Pacific Grove, CA Map & Demographics
Pacific Grove Map
Pacific Grove Overview
$64,346
PER CAPITA INCOME
$148,438
AVG FAMILY INCOME
$102,553
AVG HOUSEHOLD INCOME
30.5%
WAGE / INCOME GAP [ % ]
69.5¢/ $1
WAGE / INCOME GAP [ $ ]
$8,506
FAMILY INCOME DEFICIT
0.45
INEQUALITY / GINI INDEX
15,098
TOTAL POPULATION
6,713
MALE POPULATION
8,385
FEMALE POPULATION
80.06
MALES / 100 FEMALES
124.91
FEMALES / 100 MALES
49.2
MEDIAN AGE
2.8
AVG FAMILY SIZE
2.1
AVG HOUSEHOLD SIZE
7,680
LABOR FORCE [ PEOPLE ]
59.9%
PERCENT IN LABOR FORCE
5.6%
UNEMPLOYMENT RATE
Pacific Grove Zip Codes
Income in Pacific Grove
Income Overview in Pacific Grove
Per Capita Income in Pacific Grove is $64,346, while median incomes of families and households are $148,438 and $102,553 respectively.
| Characteristic | Number | Measure |
| Per Capita Income | 15,098 | $64,346 |
| Median Family Income | 3,972 | $148,438 |
| Mean Family Income | 3,972 | $177,945 |
| Median Household Income | 6,860 | $102,553 |
| Mean Household Income | 6,860 | $139,959 |
| Income Deficit | 3,972 | $8,506 |
| Wage / Income Gap (%) | 15,098 | 30.47% |
| Wage / Income Gap ($) | 15,098 | 69.53¢ per $1 |
| Gini / Inequality Index | 15,098 | 0.45 |
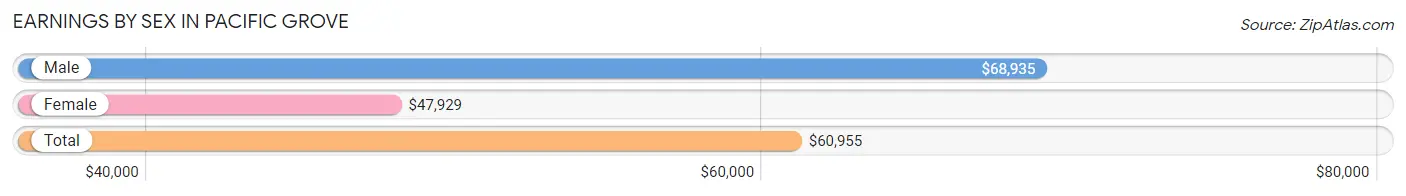
Earnings by Sex in Pacific Grove
Average Earnings in Pacific Grove are $60,955, $68,935 for men and $47,929 for women, a difference of 30.5%.
| Sex | Number | Average Earnings |
| Male | 4,007 (50.3%) | $68,935 |
| Female | 3,966 (49.7%) | $47,929 |
| Total | 7,973 (100.0%) | $60,955 |
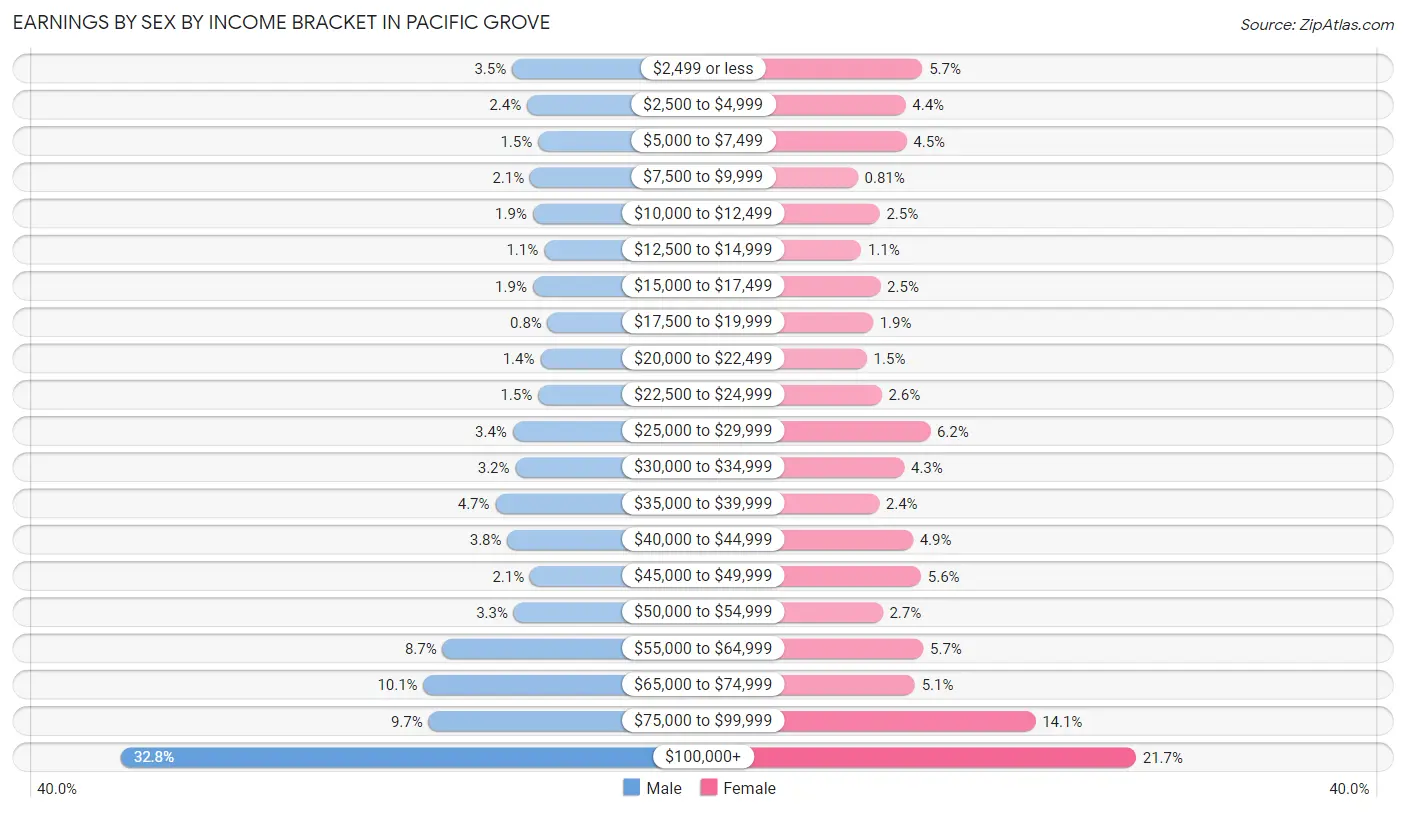
Earnings by Sex by Income Bracket in Pacific Grove
The most common earnings brackets in Pacific Grove are $100,000+ for men (1,314 | 32.8%) and $100,000+ for women (859 | 21.7%).
| Income | Male | Female |
| $2,499 or less | 139 (3.5%) | 224 (5.7%) |
| $2,500 to $4,999 | 94 (2.4%) | 174 (4.4%) |
| $5,000 to $7,499 | 61 (1.5%) | 177 (4.5%) |
| $7,500 to $9,999 | 85 (2.1%) | 32 (0.8%) |
| $10,000 to $12,499 | 77 (1.9%) | 97 (2.5%) |
| $12,500 to $14,999 | 43 (1.1%) | 42 (1.1%) |
| $15,000 to $17,499 | 77 (1.9%) | 99 (2.5%) |
| $17,500 to $19,999 | 32 (0.8%) | 77 (1.9%) |
| $20,000 to $22,499 | 54 (1.3%) | 59 (1.5%) |
| $22,500 to $24,999 | 61 (1.5%) | 103 (2.6%) |
| $25,000 to $29,999 | 137 (3.4%) | 247 (6.2%) |
| $30,000 to $34,999 | 129 (3.2%) | 170 (4.3%) |
| $35,000 to $39,999 | 189 (4.7%) | 95 (2.4%) |
| $40,000 to $44,999 | 153 (3.8%) | 196 (4.9%) |
| $45,000 to $49,999 | 85 (2.1%) | 220 (5.6%) |
| $50,000 to $54,999 | 134 (3.3%) | 106 (2.7%) |
| $55,000 to $64,999 | 348 (8.7%) | 227 (5.7%) |
| $65,000 to $74,999 | 405 (10.1%) | 202 (5.1%) |
| $75,000 to $99,999 | 390 (9.7%) | 560 (14.1%) |
| $100,000+ | 1,314 (32.8%) | 859 (21.7%) |
| Total | 4,007 (100.0%) | 3,966 (100.0%) |
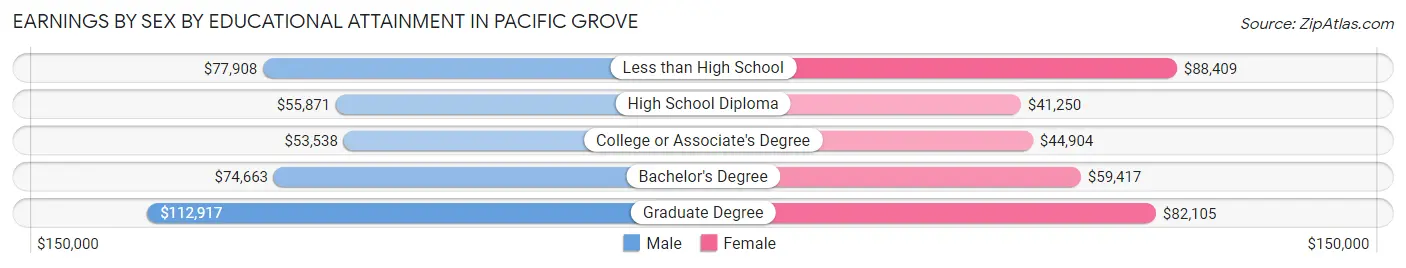
Earnings by Sex by Educational Attainment in Pacific Grove
Average earnings in Pacific Grove are $72,626 for men and $57,765 for women, a difference of 20.5%. Men with an educational attainment of graduate degree enjoy the highest average annual earnings of $112,917, while those with college or associate's degree education earn the least with $53,538. Women with an educational attainment of less than high school earn the most with the average annual earnings of $88,409, while those with high school diploma education have the smallest earnings of $41,250.
| Educational Attainment | Male Income | Female Income |
| Less than High School | $77,908 | $88,409 |
| High School Diploma | $55,871 | $41,250 |
| College or Associate's Degree | $53,538 | $44,904 |
| Bachelor's Degree | $74,663 | $59,417 |
| Graduate Degree | $112,917 | $82,105 |
| Total | $72,626 | $57,765 |
Family Income in Pacific Grove
Family Income Brackets in Pacific Grove
According to the Pacific Grove family income data, there are 1,172 families falling into the $200,000+ income range, which is the most common income bracket and makes up 29.5% of all families. Conversely, the $10,000 to $14,999 income bracket is the least frequent group with only 8 families (0.2%) belonging to this category.
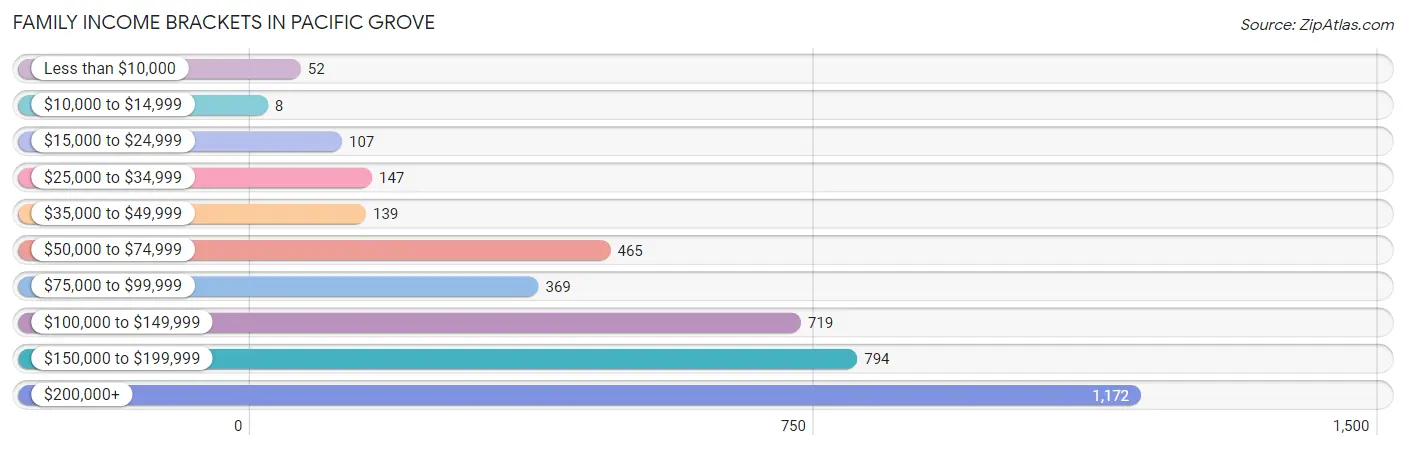
| Income Bracket | # Families | % Families |
| Less than $10,000 | 52 | 1.3% |
| $10,000 to $14,999 | 8 | 0.2% |
| $15,000 to $24,999 | 107 | 2.7% |
| $25,000 to $34,999 | 147 | 3.7% |
| $35,000 to $49,999 | 139 | 3.5% |
| $50,000 to $74,999 | 465 | 11.7% |
| $75,000 to $99,999 | 369 | 9.3% |
| $100,000 to $149,999 | 719 | 18.1% |
| $150,000 to $199,999 | 794 | 20.0% |
| $200,000+ | 1,172 | 29.5% |
Family Income by Famaliy Size in Pacific Grove
6-person families (79 | 2.0%) account for the highest median family income in Pacific Grove with $250,001 per family, while 2-person families (2,447 | 61.6%) have the highest median income of $62,775 per family member.
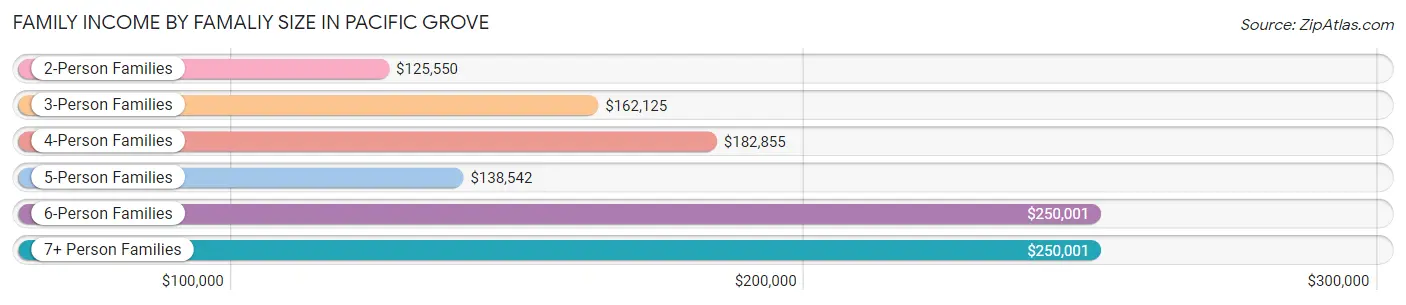
| Income Bracket | # Families | Median Income |
| 2-Person Families | 2,447 (61.6%) | $125,550 |
| 3-Person Families | 695 (17.5%) | $162,125 |
| 4-Person Families | 645 (16.2%) | $182,855 |
| 5-Person Families | 79 (2.0%) | $138,542 |
| 6-Person Families | 79 (2.0%) | $250,001 |
| 7+ Person Families | 27 (0.7%) | $250,001 |
| Total | 3,972 (100.0%) | $148,438 |
Family Income by Number of Earners in Pacific Grove
The median family income in Pacific Grove is $148,438, with families comprising 2 earners (1,641) having the highest median family income of $180,089, while families with 1 earner (1,454) have the lowest median family income of $113,952, accounting for 41.3% and 36.6% of families, respectively.
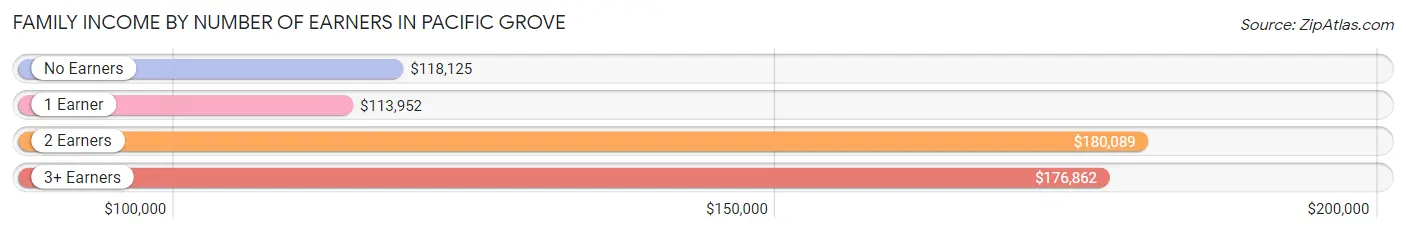
| Number of Earners | # Families | Median Income |
| No Earners | 674 (17.0%) | $118,125 |
| 1 Earner | 1,454 (36.6%) | $113,952 |
| 2 Earners | 1,641 (41.3%) | $180,089 |
| 3+ Earners | 203 (5.1%) | $176,862 |
| Total | 3,972 (100.0%) | $148,438 |
Household Income in Pacific Grove
Household Income Brackets in Pacific Grove
With 1,358 households falling in the category, the $200,000+ income range is the most frequent in Pacific Grove, accounting for 19.8% of all households. In contrast, only 82 households (1.2%) fall into the $10,000 to $14,999 income bracket, making it the least populous group.
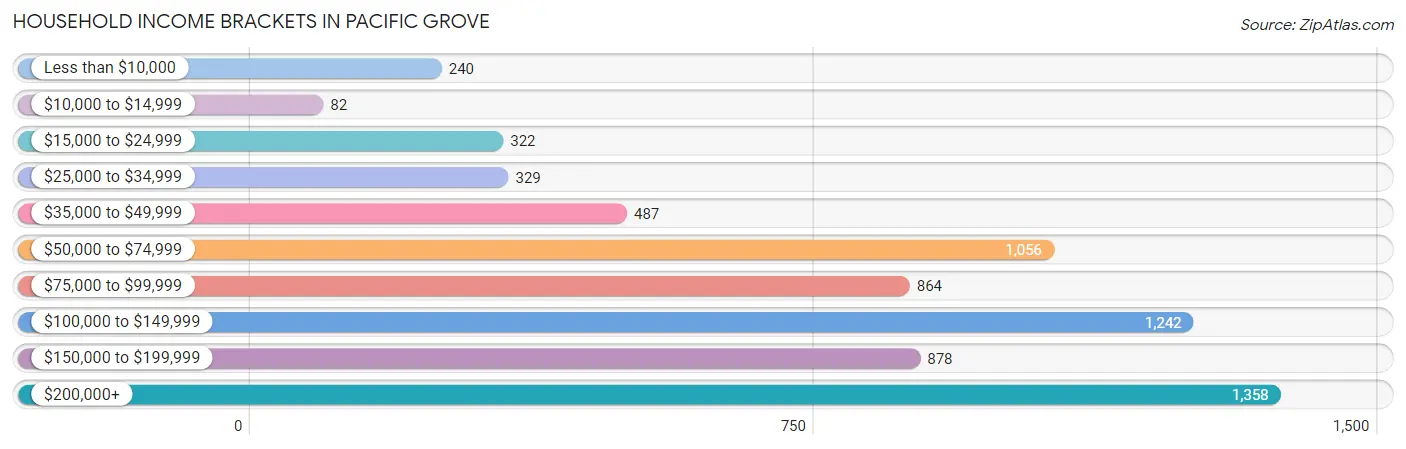
| Income Bracket | # Households | % Households |
| Less than $10,000 | 240 | 3.5% |
| $10,000 to $14,999 | 82 | 1.2% |
| $15,000 to $24,999 | 322 | 4.7% |
| $25,000 to $34,999 | 329 | 4.8% |
| $35,000 to $49,999 | 487 | 7.1% |
| $50,000 to $74,999 | 1,056 | 15.4% |
| $75,000 to $99,999 | 864 | 12.6% |
| $100,000 to $149,999 | 1,242 | 18.1% |
| $150,000 to $199,999 | 878 | 12.8% |
| $200,000+ | 1,358 | 19.8% |
Household Income by Householder Age in Pacific Grove
The median household income in Pacific Grove is $102,553, with the highest median household income of $131,638 found in the 45 to 64 years age bracket for the primary householder. A total of 2,184 households (31.8%) fall into this category. Meanwhile, the 15 to 24 years age bracket for the primary householder has the lowest median household income of $58,750, with 106 households (1.5%) in this group.
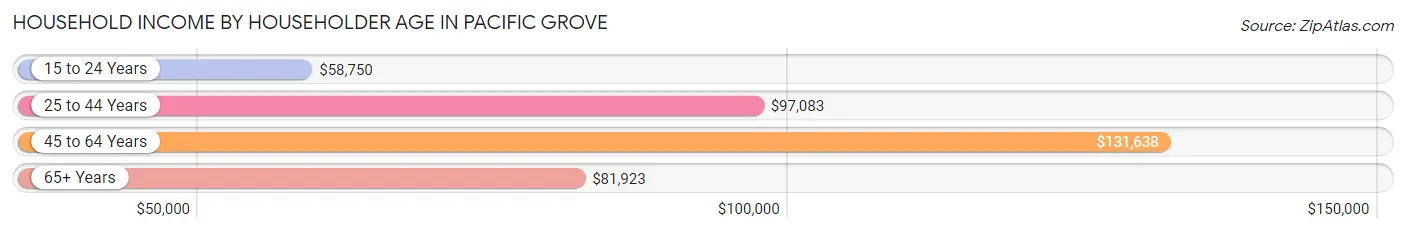
| Income Bracket | # Households | Median Income |
| 15 to 24 Years | 106 (1.5%) | $58,750 |
| 25 to 44 Years | 1,778 (25.9%) | $97,083 |
| 45 to 64 Years | 2,184 (31.8%) | $131,638 |
| 65+ Years | 2,792 (40.7%) | $81,923 |
| Total | 6,860 (100.0%) | $102,553 |
Poverty in Pacific Grove
Income Below Poverty by Sex and Age in Pacific Grove
With 5.6% poverty level for males and 8.3% for females among the residents of Pacific Grove, 18 to 24 year old males and 25 to 34 year old females are the most vulnerable to poverty, with 40 males (13.3%) and 182 females (19.4%) in their respective age groups living below the poverty level.
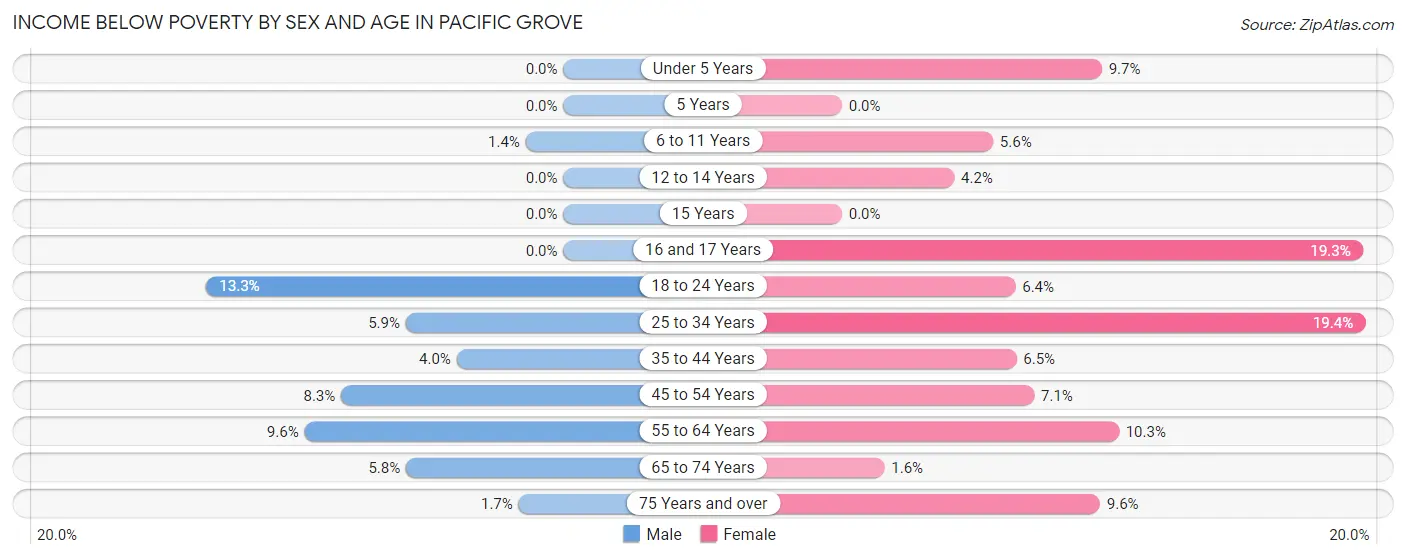
| Age Bracket | Male | Female |
| Under 5 Years | 0 (0.0%) | 33 (9.7%) |
| 5 Years | 0 (0.0%) | 0 (0.0%) |
| 6 to 11 Years | 6 (1.4%) | 33 (5.6%) |
| 12 to 14 Years | 0 (0.0%) | 11 (4.2%) |
| 15 Years | 0 (0.0%) | 0 (0.0%) |
| 16 and 17 Years | 0 (0.0%) | 29 (19.3%) |
| 18 to 24 Years | 40 (13.3%) | 25 (6.4%) |
| 25 to 34 Years | 50 (5.9%) | 182 (19.4%) |
| 35 to 44 Years | 33 (4.0%) | 56 (6.5%) |
| 45 to 54 Years | 74 (8.3%) | 77 (7.1%) |
| 55 to 64 Years | 88 (9.6%) | 130 (10.3%) |
| 65 to 74 Years | 69 (5.8%) | 19 (1.6%) |
| 75 Years and over | 11 (1.7%) | 92 (9.6%) |
| Total | 371 (5.6%) | 687 (8.3%) |
Income Above Poverty by Sex and Age in Pacific Grove
According to the poverty statistics in Pacific Grove, males aged under 5 years and females aged 5 years are the age groups that are most secure financially, with 100.0% of males and 100.0% of females in these age groups living above the poverty line.
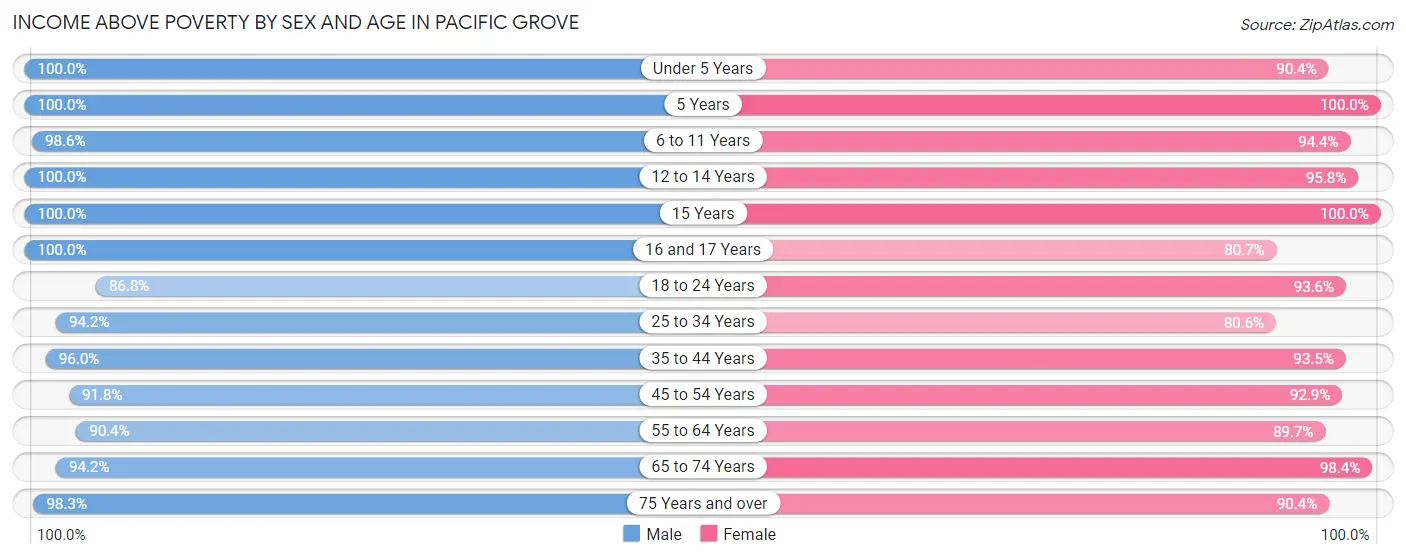
| Age Bracket | Male | Female |
| Under 5 Years | 203 (100.0%) | 309 (90.3%) |
| 5 Years | 46 (100.0%) | 111 (100.0%) |
| 6 to 11 Years | 422 (98.6%) | 555 (94.4%) |
| 12 to 14 Years | 155 (100.0%) | 253 (95.8%) |
| 15 Years | 30 (100.0%) | 106 (100.0%) |
| 16 and 17 Years | 158 (100.0%) | 121 (80.7%) |
| 18 to 24 Years | 262 (86.8%) | 363 (93.6%) |
| 25 to 34 Years | 805 (94.2%) | 755 (80.6%) |
| 35 to 44 Years | 801 (96.0%) | 808 (93.5%) |
| 45 to 54 Years | 823 (91.7%) | 1,002 (92.9%) |
| 55 to 64 Years | 828 (90.4%) | 1,134 (89.7%) |
| 65 to 74 Years | 1,112 (94.2%) | 1,186 (98.4%) |
| 75 Years and over | 652 (98.3%) | 868 (90.4%) |
| Total | 6,297 (94.4%) | 7,571 (91.7%) |
Income Below Poverty Among Married-Couple Families in Pacific Grove
The poverty statistics for married-couple families in Pacific Grove show that 2.6% or 84 of the total 3,209 families live below the poverty line. Families with 1 or 2 children have the highest poverty rate of 3.9%, comprising of 32 families. On the other hand, families with 3 or 4 children have the lowest poverty rate of 0.0%, which includes 0 families.
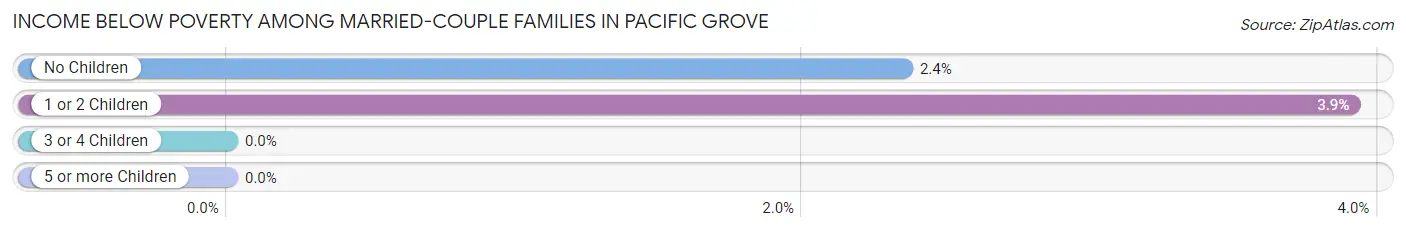
| Children | Above Poverty | Below Poverty |
| No Children | 2,164 (97.7%) | 52 (2.4%) |
| 1 or 2 Children | 786 (96.1%) | 32 (3.9%) |
| 3 or 4 Children | 154 (100.0%) | 0 (0.0%) |
| 5 or more Children | 21 (100.0%) | 0 (0.0%) |
| Total | 3,125 (97.4%) | 84 (2.6%) |
Income Below Poverty Among Single-Parent Households in Pacific Grove
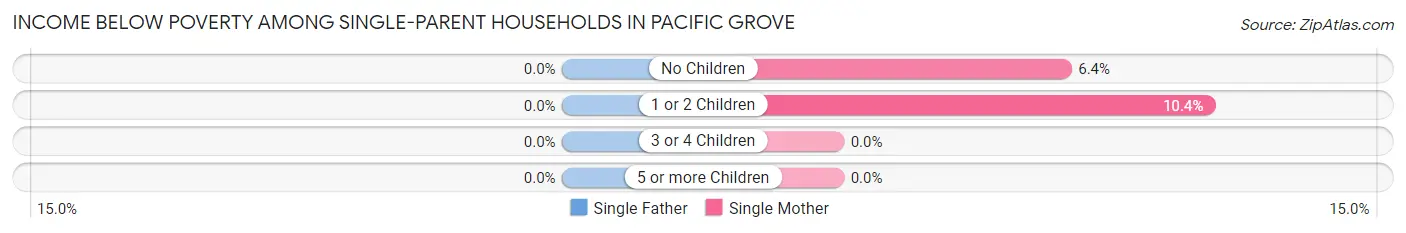
| Children | Single Father | Single Mother |
| No Children | 0 (0.0%) | 18 (6.4%) |
| 1 or 2 Children | 0 (0.0%) | 22 (10.4%) |
| 3 or 4 Children | 0 (0.0%) | 0 (0.0%) |
| 5 or more Children | 0 (0.0%) | 0 (0.0%) |
| Total | 0 (0.0%) | 40 (7.7%) |
Income Below Poverty Among Married-Couple vs Single-Parent Households in Pacific Grove
The poverty data for Pacific Grove shows that 84 of the married-couple family households (2.6%) and 40 of the single-parent households (5.2%) are living below the poverty level. Within the married-couple family households, those with 1 or 2 children have the highest poverty rate, with 32 households (3.9%) falling below the poverty line. Among the single-parent households, those with 1 or 2 children have the highest poverty rate, with 22 household (7.1%) living below poverty.
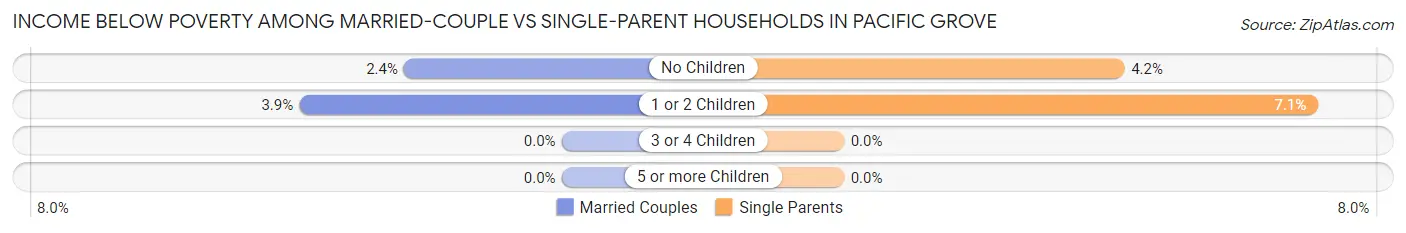
| Children | Married-Couple Families | Single-Parent Households |
| No Children | 52 (2.4%) | 18 (4.2%) |
| 1 or 2 Children | 32 (3.9%) | 22 (7.1%) |
| 3 or 4 Children | 0 (0.0%) | 0 (0.0%) |
| 5 or more Children | 0 (0.0%) | 0 (0.0%) |
| Total | 84 (2.6%) | 40 (5.2%) |
Race in Pacific Grove
The most populous races in Pacific Grove are White / Caucasian (11,759 | 77.9%), Hispanic or Latino (1,704 | 11.3%), and Two or more Races (1,302 | 8.6%).
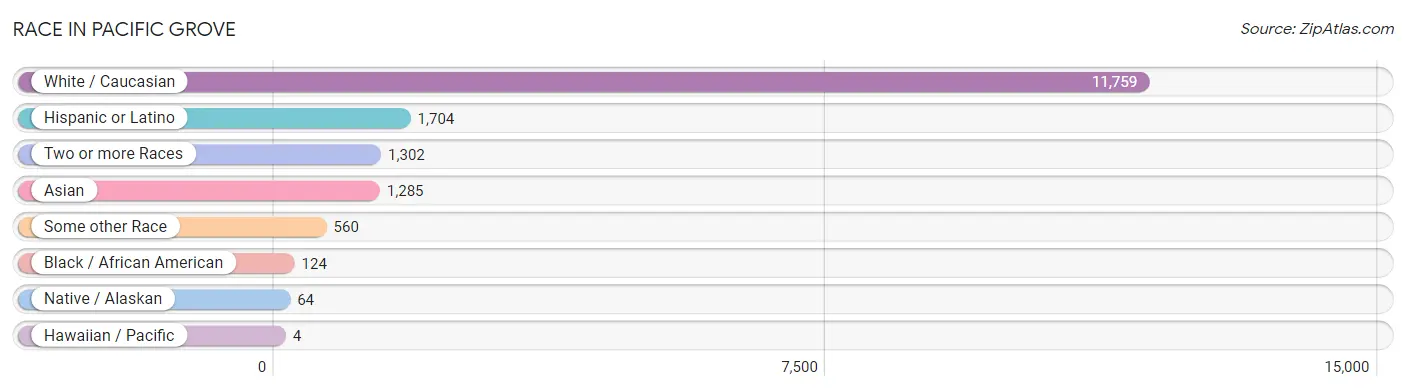
| Race | # Population | % Population |
| Asian | 1,285 | 8.5% |
| Black / African American | 124 | 0.8% |
| Hawaiian / Pacific | 4 | 0.0% |
| Hispanic or Latino | 1,704 | 11.3% |
| Native / Alaskan | 64 | 0.4% |
| White / Caucasian | 11,759 | 77.9% |
| Two or more Races | 1,302 | 8.6% |
| Some other Race | 560 | 3.7% |
| Total | 15,098 | 100.0% |
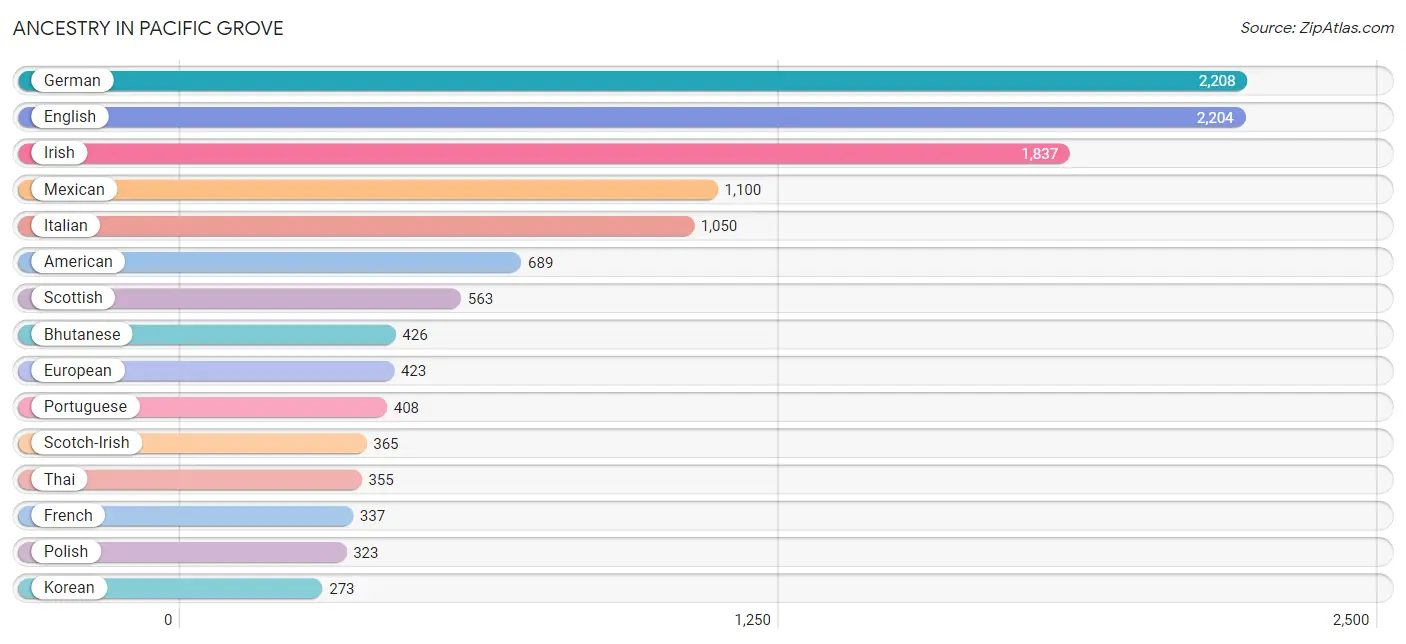
Ancestry in Pacific Grove
The most populous ancestries reported in Pacific Grove are German (2,208 | 14.6%), English (2,204 | 14.6%), Irish (1,837 | 12.2%), Mexican (1,100 | 7.3%), and Italian (1,050 | 7.0%), together accounting for 55.6% of all Pacific Grove residents.
| Ancestry | # Population | % Population |
| Afghan | 103 | 0.7% |
| African | 16 | 0.1% |
| Alaska Native | 19 | 0.1% |
| Albanian | 88 | 0.6% |
| Alsatian | 17 | 0.1% |
| American | 689 | 4.6% |
| Arab | 228 | 1.5% |
| Argentinean | 73 | 0.5% |
| Armenian | 21 | 0.1% |
| Australian | 6 | 0.0% |
| Austrian | 97 | 0.6% |
| Basque | 22 | 0.2% |
| Belgian | 33 | 0.2% |
| Bhutanese | 426 | 2.8% |
| Blackfeet | 27 | 0.2% |
| Brazilian | 20 | 0.1% |
| British | 220 | 1.5% |
| Burmese | 204 | 1.3% |
| Canadian | 5 | 0.0% |
| Cape Verdean | 4 | 0.0% |
| Carpatho Rusyn | 5 | 0.0% |
| Central American | 39 | 0.3% |
| Central American Indian | 4 | 0.0% |
| Cherokee | 63 | 0.4% |
| Chilean | 4 | 0.0% |
| Choctaw | 39 | 0.3% |
| Colombian | 5 | 0.0% |
| Creek | 23 | 0.2% |
| Croatian | 159 | 1.1% |
| Cuban | 119 | 0.8% |
| Czech | 46 | 0.3% |
| Czechoslovakian | 21 | 0.1% |
| Danish | 76 | 0.5% |
| Dutch | 198 | 1.3% |
| Eastern European | 83 | 0.5% |
| Ecuadorian | 3 | 0.0% |
| Egyptian | 24 | 0.2% |
| English | 2,204 | 14.6% |
| European | 423 | 2.8% |
| Filipino | 21 | 0.1% |
| Finnish | 52 | 0.3% |
| French | 337 | 2.2% |
| French Canadian | 52 | 0.3% |
| German | 2,208 | 14.6% |
| Greek | 85 | 0.6% |
| Guamanian / Chamorro | 47 | 0.3% |
| Guatemalan | 6 | 0.0% |
| Haitian | 8 | 0.1% |
| Hmong | 18 | 0.1% |
| Hopi | 7 | 0.1% |
| Hungarian | 129 | 0.9% |
| Indian (Asian) | 188 | 1.3% |
| Iranian | 7 | 0.1% |
| Irish | 1,837 | 12.2% |
| Israeli | 32 | 0.2% |
| Italian | 1,050 | 7.0% |
| Jamaican | 9 | 0.1% |
| Japanese | 8 | 0.1% |
| Jordanian | 20 | 0.1% |
| Korean | 273 | 1.8% |
| Laotian | 6 | 0.0% |
| Lebanese | 73 | 0.5% |
| Lithuanian | 20 | 0.1% |
| Mexican | 1,100 | 7.3% |
| Mexican American Indian | 31 | 0.2% |
| Mongolian | 21 | 0.1% |
| Native Hawaiian | 36 | 0.2% |
| New Zealander | 10 | 0.1% |
| Northern European | 135 | 0.9% |
| Norwegian | 225 | 1.5% |
| Okinawan | 43 | 0.3% |
| Osage | 15 | 0.1% |
| Pakistani | 11 | 0.1% |
| Peruvian | 35 | 0.2% |
| Pima | 11 | 0.1% |
| Polish | 323 | 2.1% |
| Portuguese | 408 | 2.7% |
| Pueblo | 7 | 0.1% |
| Puerto Rican | 70 | 0.5% |
| Romanian | 5 | 0.0% |
| Russian | 193 | 1.3% |
| Salvadoran | 33 | 0.2% |
| Scandinavian | 67 | 0.4% |
| Scotch-Irish | 365 | 2.4% |
| Scottish | 563 | 3.7% |
| Sioux | 24 | 0.2% |
| Slovak | 85 | 0.6% |
| Slovene | 11 | 0.1% |
| South American | 120 | 0.8% |
| Spaniard | 170 | 1.1% |
| Spanish | 45 | 0.3% |
| Sri Lankan | 47 | 0.3% |
| Subsaharan African | 20 | 0.1% |
| Swedish | 196 | 1.3% |
| Swiss | 129 | 0.9% |
| Syrian | 39 | 0.3% |
| Thai | 355 | 2.4% |
| Ukrainian | 171 | 1.1% |
| Vietnamese | 45 | 0.3% |
| Welsh | 232 | 1.5% |
| Yaqui | 30 | 0.2% |
| Yugoslavian | 8 | 0.1% |
| Yup'ik | 14 | 0.1% | View All 103 Rows |
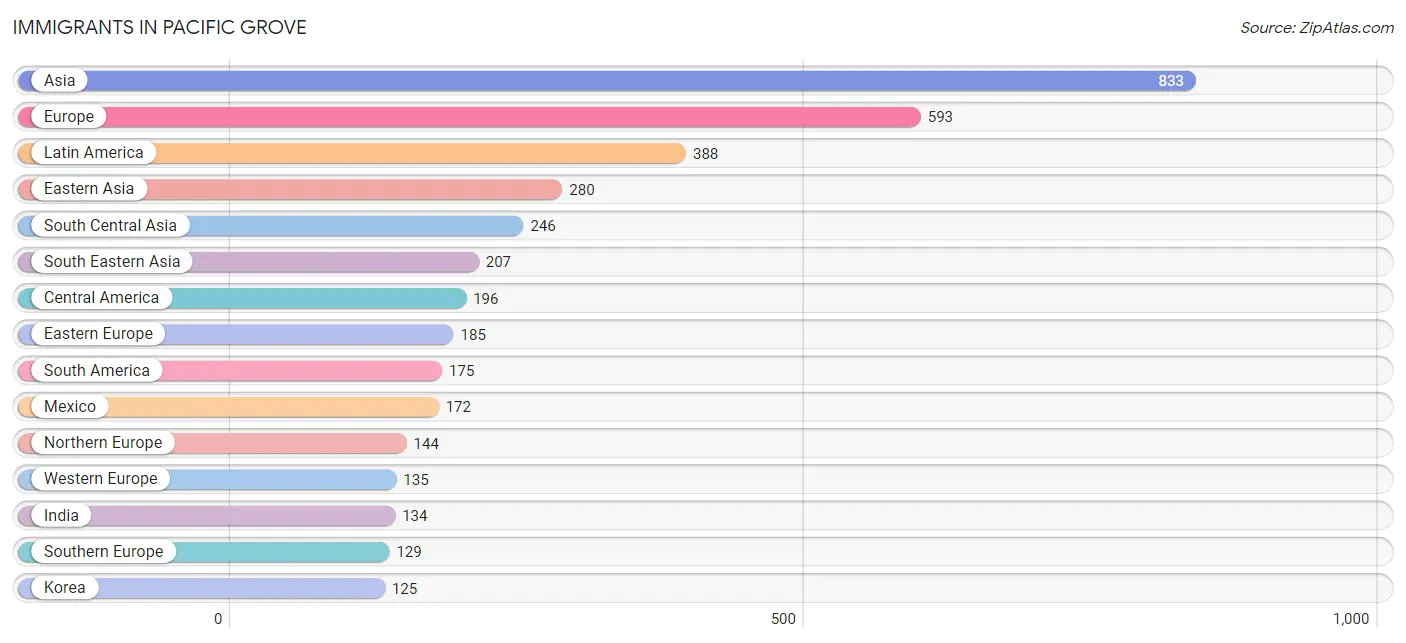
Immigrants in Pacific Grove
The most numerous immigrant groups reported in Pacific Grove came from Asia (833 | 5.5%), Europe (593 | 3.9%), Latin America (388 | 2.6%), Eastern Asia (280 | 1.8%), and South Central Asia (246 | 1.6%), together accounting for 15.5% of all Pacific Grove residents.
| Immigration Origin | # Population | % Population |
| Afghanistan | 82 | 0.5% |
| Africa | 82 | 0.5% |
| Argentina | 58 | 0.4% |
| Asia | 833 | 5.5% |
| Australia | 6 | 0.0% |
| Bangladesh | 21 | 0.1% |
| Brazil | 66 | 0.4% |
| Canada | 53 | 0.4% |
| Caribbean | 17 | 0.1% |
| Central America | 196 | 1.3% |
| Chile | 4 | 0.0% |
| China | 73 | 0.5% |
| Croatia | 14 | 0.1% |
| Eastern Asia | 280 | 1.8% |
| Eastern Europe | 185 | 1.2% |
| Ecuador | 3 | 0.0% |
| Egypt | 73 | 0.5% |
| El Salvador | 13 | 0.1% |
| England | 79 | 0.5% |
| Europe | 593 | 3.9% |
| France | 24 | 0.2% |
| Germany | 101 | 0.7% |
| Guatemala | 6 | 0.0% |
| Haiti | 8 | 0.1% |
| Hungary | 68 | 0.4% |
| India | 134 | 0.9% |
| Indonesia | 6 | 0.0% |
| Iraq | 5 | 0.0% |
| Ireland | 13 | 0.1% |
| Israel | 20 | 0.1% |
| Italy | 26 | 0.2% |
| Jamaica | 9 | 0.1% |
| Japan | 82 | 0.5% |
| Jordan | 20 | 0.1% |
| Korea | 125 | 0.8% |
| Laos | 43 | 0.3% |
| Latin America | 388 | 2.6% |
| Lebanon | 10 | 0.1% |
| Malaysia | 21 | 0.1% |
| Mexico | 172 | 1.1% |
| Netherlands | 10 | 0.1% |
| Nigeria | 6 | 0.0% |
| Northern Africa | 73 | 0.5% |
| Northern Europe | 144 | 0.9% |
| Oceania | 29 | 0.2% |
| Pakistan | 9 | 0.1% |
| Panama | 5 | 0.0% |
| Peru | 44 | 0.3% |
| Philippines | 112 | 0.7% |
| Portugal | 71 | 0.5% |
| Russia | 41 | 0.3% |
| Scotland | 5 | 0.0% |
| South Africa | 3 | 0.0% |
| South America | 175 | 1.2% |
| South Central Asia | 246 | 1.6% |
| South Eastern Asia | 207 | 1.4% |
| Southern Europe | 129 | 0.9% |
| Spain | 32 | 0.2% |
| Sweden | 5 | 0.0% |
| Syria | 39 | 0.3% |
| Taiwan | 31 | 0.2% |
| Turkey | 6 | 0.0% |
| Ukraine | 62 | 0.4% |
| Vietnam | 20 | 0.1% |
| Western Africa | 6 | 0.0% |
| Western Asia | 100 | 0.7% |
| Western Europe | 135 | 0.9% | View All 67 Rows |
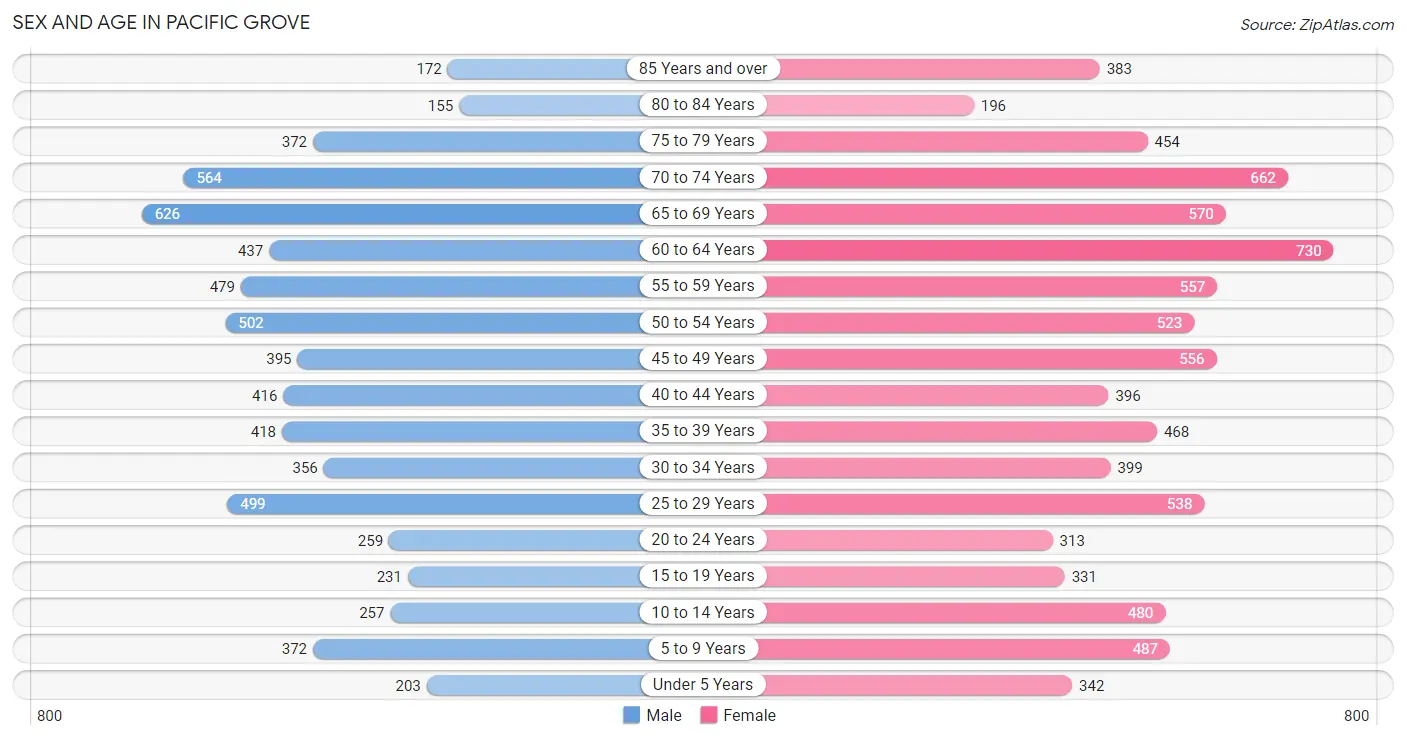
Sex and Age in Pacific Grove
Sex and Age in Pacific Grove
The most populous age groups in Pacific Grove are 65 to 69 Years (626 | 9.3%) for men and 60 to 64 Years (730 | 8.7%) for women.
| Age Bracket | Male | Female |
| Under 5 Years | 203 (3.0%) | 342 (4.1%) |
| 5 to 9 Years | 372 (5.5%) | 487 (5.8%) |
| 10 to 14 Years | 257 (3.8%) | 480 (5.7%) |
| 15 to 19 Years | 231 (3.4%) | 331 (4.0%) |
| 20 to 24 Years | 259 (3.9%) | 313 (3.7%) |
| 25 to 29 Years | 499 (7.4%) | 538 (6.4%) |
| 30 to 34 Years | 356 (5.3%) | 399 (4.8%) |
| 35 to 39 Years | 418 (6.2%) | 468 (5.6%) |
| 40 to 44 Years | 416 (6.2%) | 396 (4.7%) |
| 45 to 49 Years | 395 (5.9%) | 556 (6.6%) |
| 50 to 54 Years | 502 (7.5%) | 523 (6.2%) |
| 55 to 59 Years | 479 (7.1%) | 557 (6.6%) |
| 60 to 64 Years | 437 (6.5%) | 730 (8.7%) |
| 65 to 69 Years | 626 (9.3%) | 570 (6.8%) |
| 70 to 74 Years | 564 (8.4%) | 662 (7.9%) |
| 75 to 79 Years | 372 (5.5%) | 454 (5.4%) |
| 80 to 84 Years | 155 (2.3%) | 196 (2.3%) |
| 85 Years and over | 172 (2.6%) | 383 (4.6%) |
| Total | 6,713 (100.0%) | 8,385 (100.0%) |
Families and Households in Pacific Grove
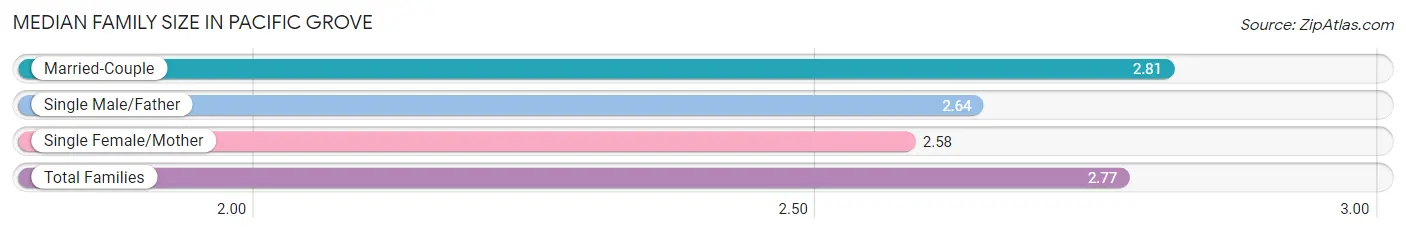
Median Family Size in Pacific Grove
The median family size in Pacific Grove is 2.77 persons per family, with married-couple families (3,209 | 80.8%) accounting for the largest median family size of 2.81 persons per family. On the other hand, single female/mother families (516 | 13.0%) represent the smallest median family size with 2.58 persons per family.
| Family Type | # Families | Family Size |
| Married-Couple | 3,209 (80.8%) | 2.81 |
| Single Male/Father | 247 (6.2%) | 2.64 |
| Single Female/Mother | 516 (13.0%) | 2.58 |
| Total Families | 3,972 (100.0%) | 2.77 |
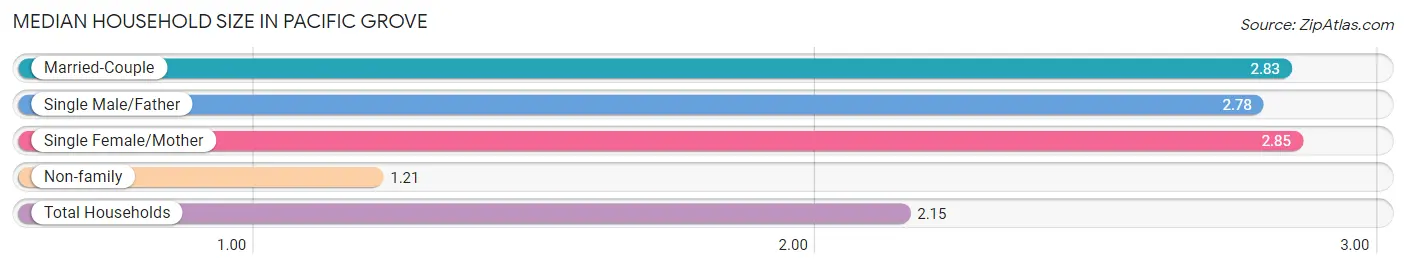
Median Household Size in Pacific Grove
The median household size in Pacific Grove is 2.15 persons per household, with single female/mother households (516 | 7.5%) accounting for the largest median household size of 2.85 persons per household. non-family households (2,888 | 42.1%) represent the smallest median household size with 1.21 persons per household.
| Household Type | # Households | Household Size |
| Married-Couple | 3,209 (46.8%) | 2.83 |
| Single Male/Father | 247 (3.6%) | 2.78 |
| Single Female/Mother | 516 (7.5%) | 2.85 |
| Non-family | 2,888 (42.1%) | 1.21 |
| Total Households | 6,860 (100.0%) | 2.15 |
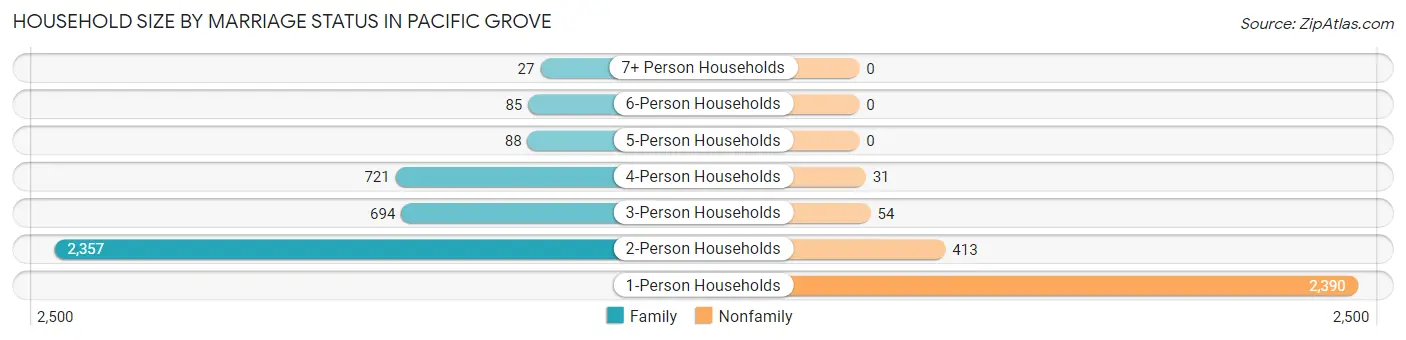
Household Size by Marriage Status in Pacific Grove
Out of a total of 6,860 households in Pacific Grove, 3,972 (57.9%) are family households, while 2,888 (42.1%) are nonfamily households. The most numerous type of family households are 2-person households, comprising 2,357, and the most common type of nonfamily households are 1-person households, comprising 2,390.
| Household Size | Family Households | Nonfamily Households |
| 1-Person Households | - | 2,390 (34.8%) |
| 2-Person Households | 2,357 (34.4%) | 413 (6.0%) |
| 3-Person Households | 694 (10.1%) | 54 (0.8%) |
| 4-Person Households | 721 (10.5%) | 31 (0.4%) |
| 5-Person Households | 88 (1.3%) | 0 (0.0%) |
| 6-Person Households | 85 (1.2%) | 0 (0.0%) |
| 7+ Person Households | 27 (0.4%) | 0 (0.0%) |
| Total | 3,972 (57.9%) | 2,888 (42.1%) |
Female Fertility in Pacific Grove
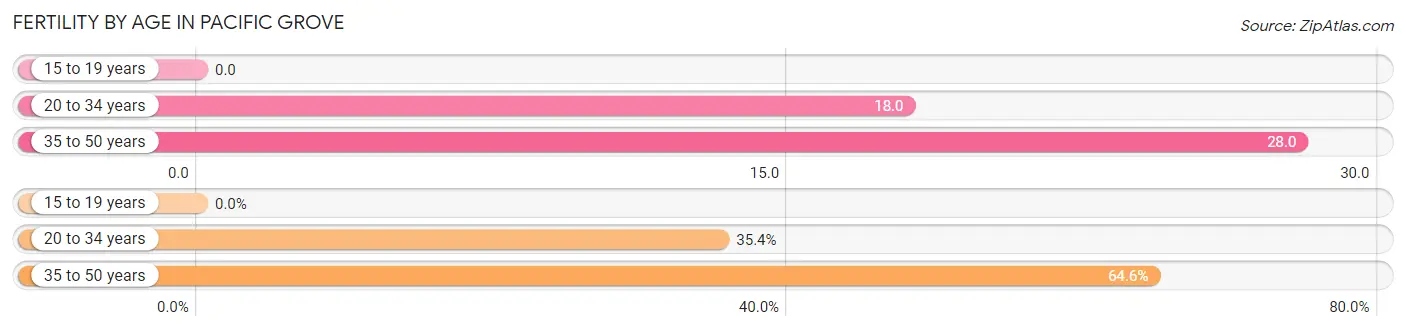
Fertility by Age in Pacific Grove
Average fertility rate in Pacific Grove is 21.0 births per 1,000 women. Women in the age bracket of 35 to 50 years have the highest fertility rate with 28.0 births per 1,000 women. Women in the age bracket of 35 to 50 years acount for 64.6% of all women with births.
| Age Bracket | Women with Births | Births / 1,000 Women |
| 15 to 19 years | 0 (0.0%) | 0.0 |
| 20 to 34 years | 23 (35.4%) | 18.0 |
| 35 to 50 years | 42 (64.6%) | 28.0 |
| Total | 65 (100.0%) | 21.0 |
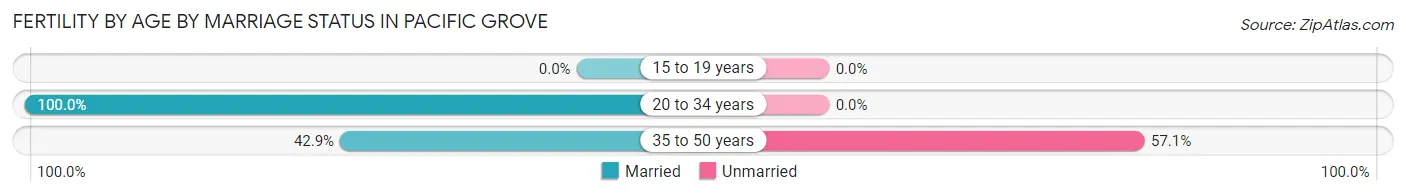
Fertility by Age by Marriage Status in Pacific Grove
63.1% of women with births (65) in Pacific Grove are married. The highest percentage of unmarried women with births falls into 35 to 50 years age bracket with 57.1% of them unmarried at the time of birth, while the lowest percentage of unmarried women with births belong to 20 to 34 years age bracket with 0.0% of them unmarried.
| Age Bracket | Married | Unmarried |
| 15 to 19 years | 0 (0.0%) | 0 (0.0%) |
| 20 to 34 years | 23 (100.0%) | 0 (0.0%) |
| 35 to 50 years | 18 (42.9%) | 24 (57.1%) |
| Total | 41 (63.1%) | 24 (36.9%) |
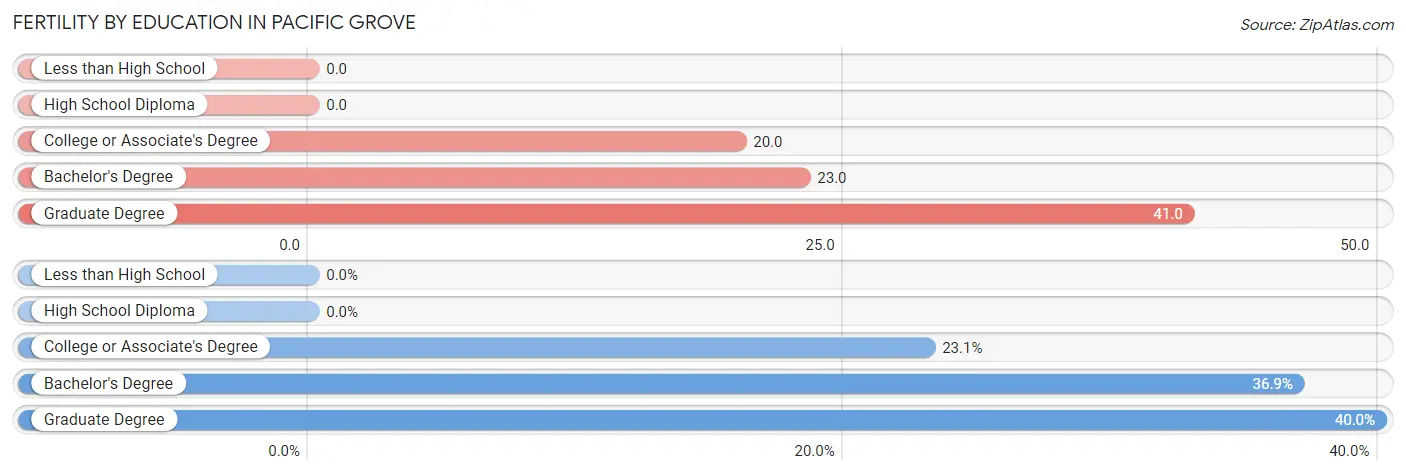
Fertility by Education in Pacific Grove
| Educational Attainment | Women with Births | Births / 1,000 Women |
| Less than High School | 0 (0.0%) | 0.0 |
| High School Diploma | 0 (0.0%) | 0.0 |
| College or Associate's Degree | 15 (23.1%) | 20.0 |
| Bachelor's Degree | 24 (36.9%) | 23.0 |
| Graduate Degree | 26 (40.0%) | 41.0 |
| Total | 65 (100.0%) | 21.0 |
Fertility by Education by Marriage Status in Pacific Grove
36.9% of women with births in Pacific Grove are unmarried. Women with the educational attainment of college or associate's degree are most likely to be married with 100.0% of them married at childbirth, while women with the educational attainment of bachelor's degree are least likely to be married with 100.0% of them unmarried at childbirth.
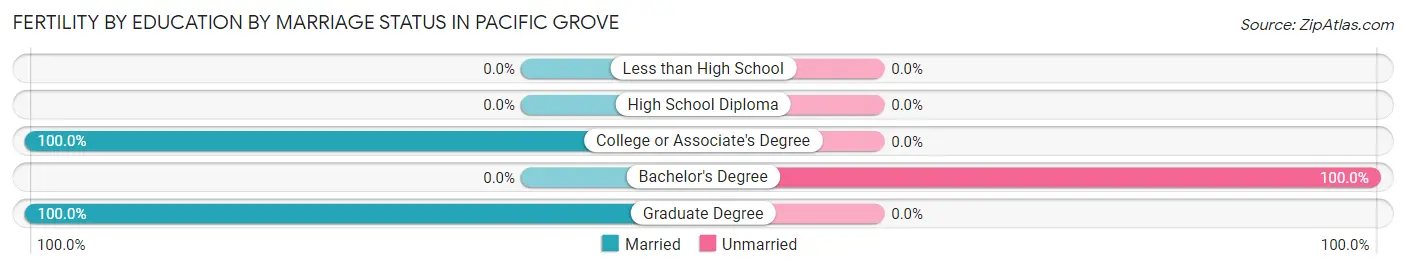
| Educational Attainment | Married | Unmarried |
| Less than High School | 0 (0.0%) | 0 (0.0%) |
| High School Diploma | 0 (0.0%) | 0 (0.0%) |
| College or Associate's Degree | 15 (100.0%) | 0 (0.0%) |
| Bachelor's Degree | 0 (0.0%) | 24 (100.0%) |
| Graduate Degree | 26 (100.0%) | 0 (0.0%) |
| Total | 41 (63.1%) | 24 (36.9%) |
Employment Characteristics in Pacific Grove
Employment by Class of Employer in Pacific Grove
Among the 7,161 employed individuals in Pacific Grove, private company employees (3,474 | 48.5%), local government employees (828 | 11.6%), and federal government employees (748 | 10.4%) make up the most common classes of employment.
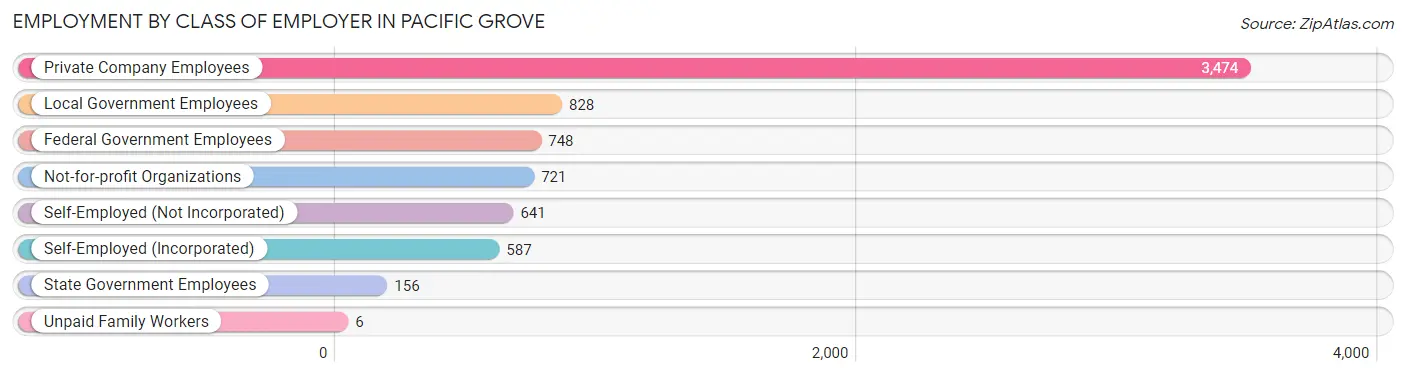
| Employer Class | # Employees | % Employees |
| Private Company Employees | 3,474 | 48.5% |
| Self-Employed (Incorporated) | 587 | 8.2% |
| Self-Employed (Not Incorporated) | 641 | 8.9% |
| Not-for-profit Organizations | 721 | 10.1% |
| Local Government Employees | 828 | 11.6% |
| State Government Employees | 156 | 2.2% |
| Federal Government Employees | 748 | 10.4% |
| Unpaid Family Workers | 6 | 0.1% |
| Total | 7,161 | 100.0% |
Employment Status by Age in Pacific Grove
According to the labor force statistics for Pacific Grove, out of the total population over 16 years of age (12,821), 59.9% or 7,680 individuals are in the labor force, with 5.6% or 430 of them unemployed. The age group with the highest labor force participation rate is 35 to 44 years, with 86.7% or 1,472 individuals in the labor force. Within the labor force, the 16 to 19 years age range has the highest percentage of unemployed individuals, with 23.9% or 43 of them being unemployed.
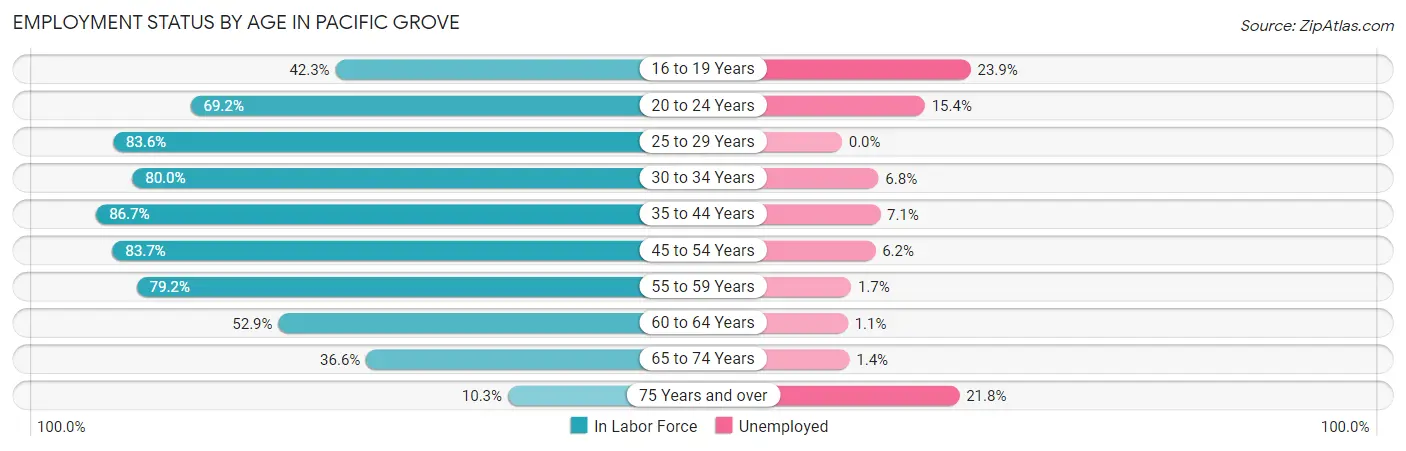
| Age Bracket | In Labor Force | Unemployed |
| 16 to 19 Years | 180 (42.3%) | 43 (23.9%) |
| 20 to 24 Years | 396 (69.2%) | 61 (15.4%) |
| 25 to 29 Years | 867 (83.6%) | 0 (0.0%) |
| 30 to 34 Years | 604 (80.0%) | 41 (6.8%) |
| 35 to 44 Years | 1,472 (86.7%) | 105 (7.1%) |
| 45 to 54 Years | 1,654 (83.7%) | 103 (6.2%) |
| 55 to 59 Years | 821 (79.2%) | 14 (1.7%) |
| 60 to 64 Years | 617 (52.9%) | 7 (1.1%) |
| 65 to 74 Years | 886 (36.6%) | 12 (1.4%) |
| 75 Years and over | 178 (10.3%) | 39 (21.8%) |
| Total | 7,680 (59.9%) | 430 (5.6%) |
Employment Status by Educational Attainment in Pacific Grove
According to labor force statistics for Pacific Grove, 78.7% of individuals (6,036) out of the total population between 25 and 64 years of age (7,669) are in the labor force, with 4.5% or 272 of them being unemployed. The group with the highest labor force participation rate are those with the educational attainment of bachelor's degree or higher, with 83.5% or 3,776 individuals in the labor force. Within the labor force, individuals with college / associate degree education have the highest percentage of unemployment, with 5.4% or 82 of them being unemployed.
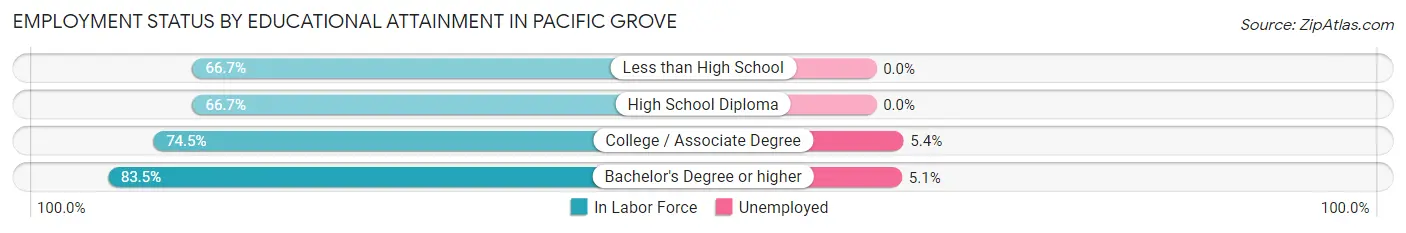
| Educational Attainment | In Labor Force | Unemployed |
| Less than High School | 224 (66.7%) | 0 (0.0%) |
| High School Diploma | 520 (66.7%) | 0 (0.0%) |
| College / Associate Degree | 1,513 (74.5%) | 110 (5.4%) |
| Bachelor's Degree or higher | 3,776 (83.5%) | 231 (5.1%) |
| Total | 6,036 (78.7%) | 345 (4.5%) |
Employment Occupations by Sex in Pacific Grove
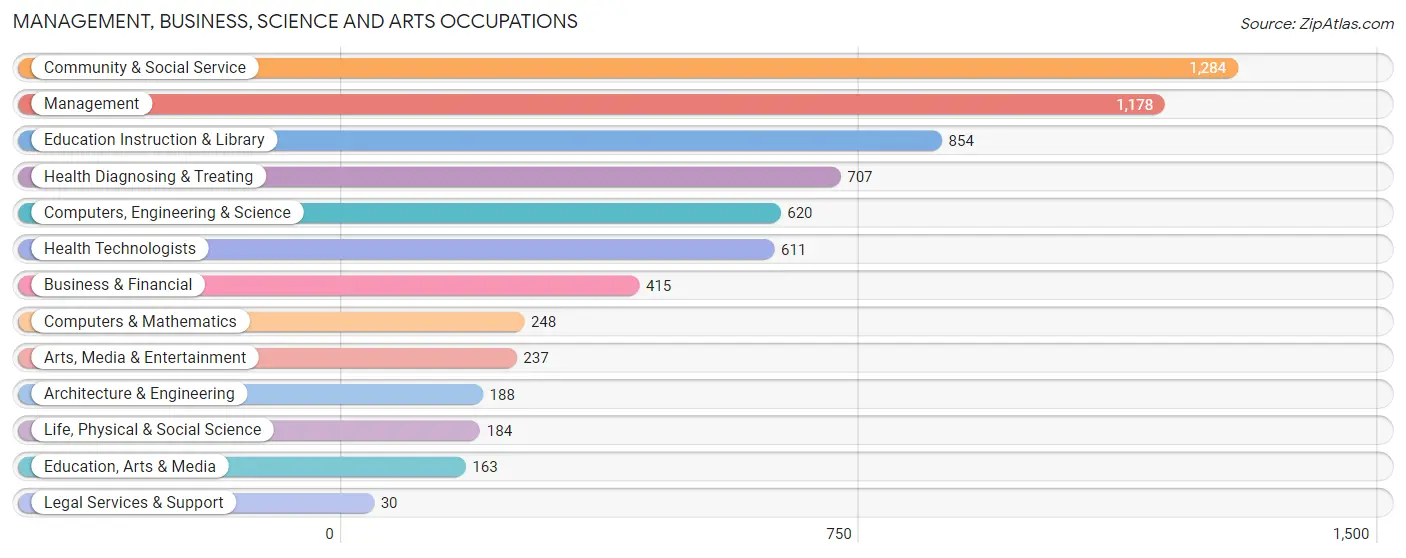
Management, Business, Science and Arts Occupations
The most common Management, Business, Science and Arts occupations in Pacific Grove are Community & Social Service (1,284 | 18.4%), Management (1,178 | 16.9%), Education Instruction & Library (854 | 12.2%), Health Diagnosing & Treating (707 | 10.1%), and Computers, Engineering & Science (620 | 8.9%).
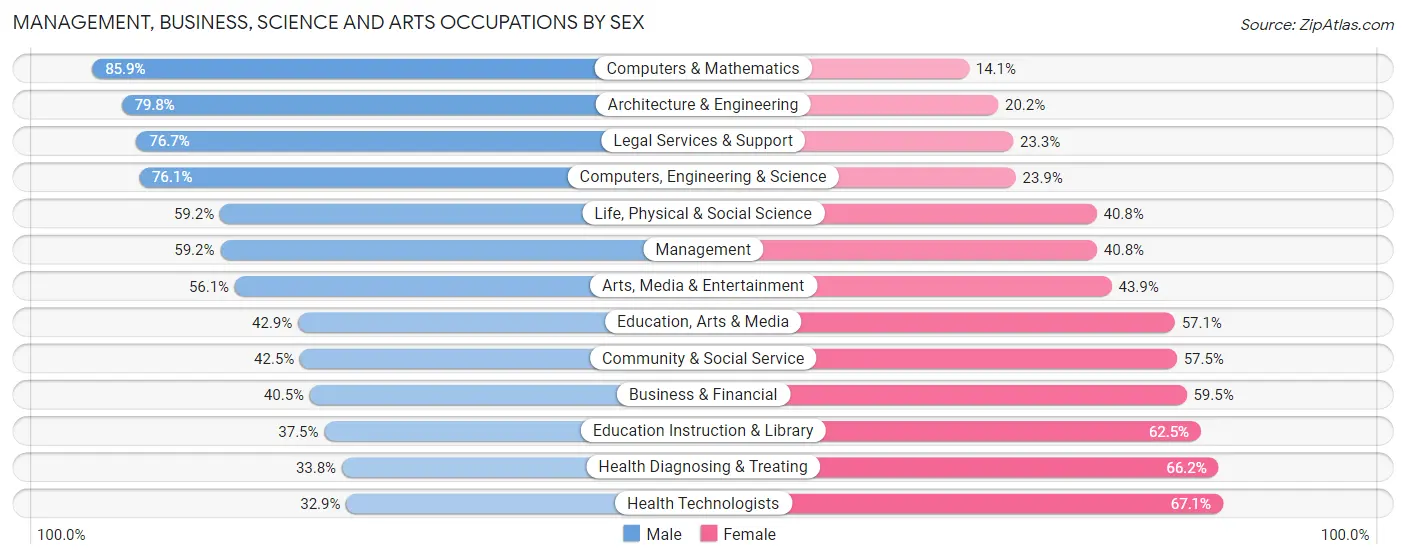
Management, Business, Science and Arts Occupations by Sex
Within the Management, Business, Science and Arts occupations in Pacific Grove, the most male-oriented occupations are Computers & Mathematics (85.9%), Architecture & Engineering (79.8%), and Legal Services & Support (76.7%), while the most female-oriented occupations are Health Technologists (67.1%), Health Diagnosing & Treating (66.2%), and Education Instruction & Library (62.5%).
| Occupation | Male | Female |
| Management | 697 (59.2%) | 481 (40.8%) |
| Business & Financial | 168 (40.5%) | 247 (59.5%) |
| Computers, Engineering & Science | 472 (76.1%) | 148 (23.9%) |
| Computers & Mathematics | 213 (85.9%) | 35 (14.1%) |
| Architecture & Engineering | 150 (79.8%) | 38 (20.2%) |
| Life, Physical & Social Science | 109 (59.2%) | 75 (40.8%) |
| Community & Social Service | 546 (42.5%) | 738 (57.5%) |
| Education, Arts & Media | 70 (42.9%) | 93 (57.1%) |
| Legal Services & Support | 23 (76.7%) | 7 (23.3%) |
| Education Instruction & Library | 320 (37.5%) | 534 (62.5%) |
| Arts, Media & Entertainment | 133 (56.1%) | 104 (43.9%) |
| Health Diagnosing & Treating | 239 (33.8%) | 468 (66.2%) |
| Health Technologists | 201 (32.9%) | 410 (67.1%) |
| Total (Category) | 2,122 (50.5%) | 2,082 (49.5%) |
| Total (Overall) | 3,426 (49.1%) | 3,551 (50.9%) |
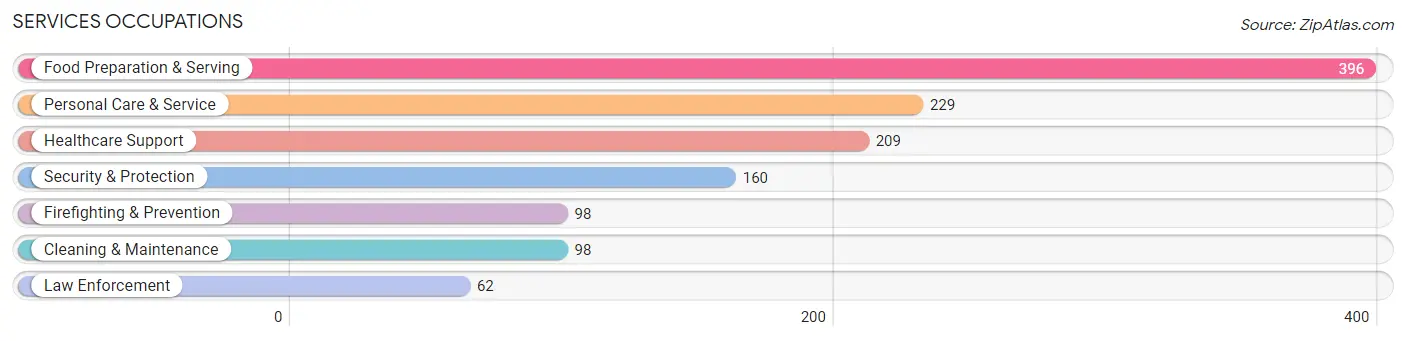
Services Occupations
The most common Services occupations in Pacific Grove are Food Preparation & Serving (396 | 5.7%), Personal Care & Service (229 | 3.3%), Healthcare Support (209 | 3.0%), Security & Protection (160 | 2.3%), and Firefighting & Prevention (98 | 1.4%).
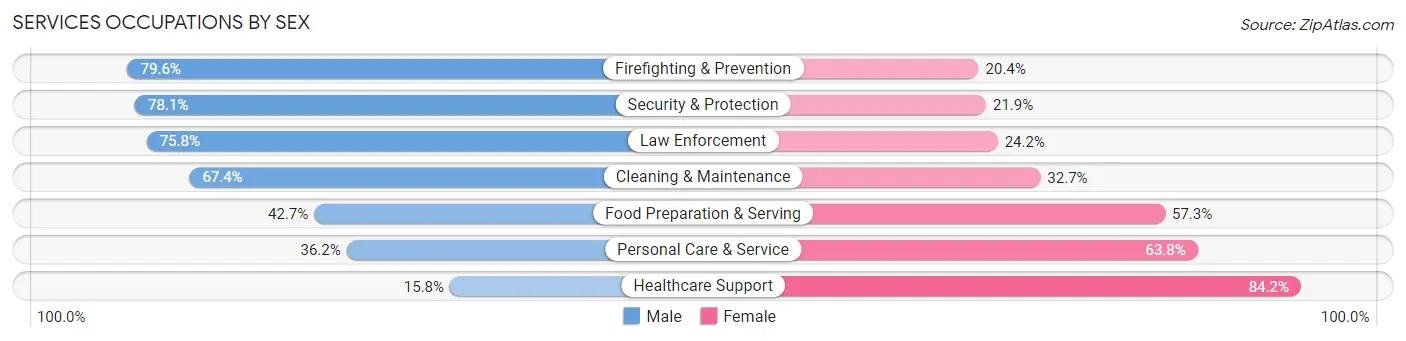
Services Occupations by Sex
Within the Services occupations in Pacific Grove, the most male-oriented occupations are Firefighting & Prevention (79.6%), Security & Protection (78.1%), and Law Enforcement (75.8%), while the most female-oriented occupations are Healthcare Support (84.2%), Personal Care & Service (63.8%), and Food Preparation & Serving (57.3%).
| Occupation | Male | Female |
| Healthcare Support | 33 (15.8%) | 176 (84.2%) |
| Security & Protection | 125 (78.1%) | 35 (21.9%) |
| Firefighting & Prevention | 78 (79.6%) | 20 (20.4%) |
| Law Enforcement | 47 (75.8%) | 15 (24.2%) |
| Food Preparation & Serving | 169 (42.7%) | 227 (57.3%) |
| Cleaning & Maintenance | 66 (67.3%) | 32 (32.7%) |
| Personal Care & Service | 83 (36.2%) | 146 (63.8%) |
| Total (Category) | 476 (43.6%) | 616 (56.4%) |
| Total (Overall) | 3,426 (49.1%) | 3,551 (50.9%) |
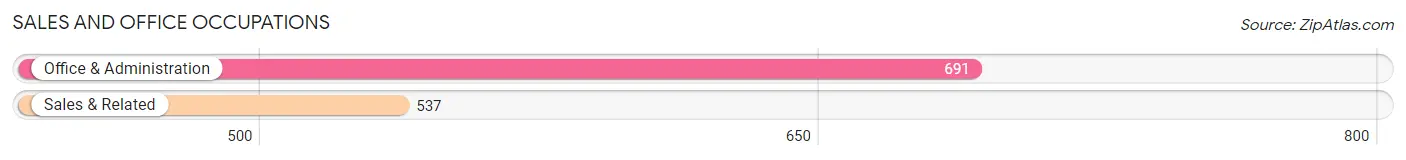
Sales and Office Occupations
The most common Sales and Office occupations in Pacific Grove are Office & Administration (691 | 9.9%), and Sales & Related (537 | 7.7%).
Sales and Office Occupations by Sex
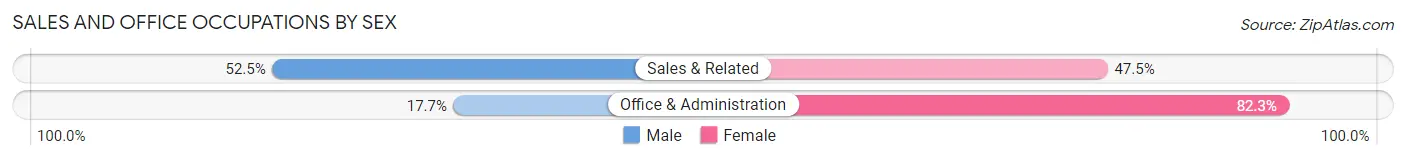
| Occupation | Male | Female |
| Sales & Related | 282 (52.5%) | 255 (47.5%) |
| Office & Administration | 122 (17.7%) | 569 (82.3%) |
| Total (Category) | 404 (32.9%) | 824 (67.1%) |
| Total (Overall) | 3,426 (49.1%) | 3,551 (50.9%) |
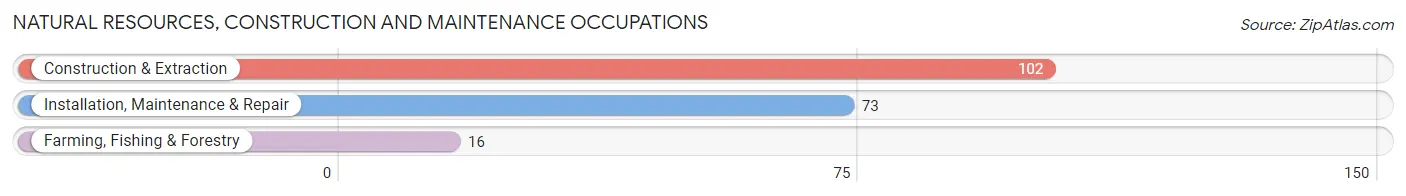
Natural Resources, Construction and Maintenance Occupations
The most common Natural Resources, Construction and Maintenance occupations in Pacific Grove are Construction & Extraction (102 | 1.5%), Installation, Maintenance & Repair (73 | 1.1%), and Farming, Fishing & Forestry (16 | 0.2%).
Natural Resources, Construction and Maintenance Occupations by Sex
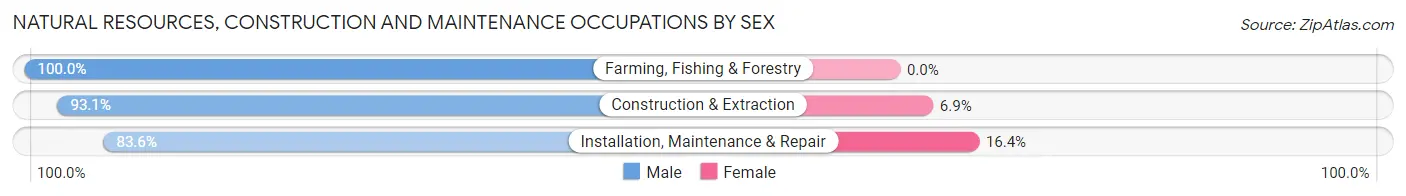
| Occupation | Male | Female |
| Farming, Fishing & Forestry | 16 (100.0%) | 0 (0.0%) |
| Construction & Extraction | 95 (93.1%) | 7 (6.9%) |
| Installation, Maintenance & Repair | 61 (83.6%) | 12 (16.4%) |
| Total (Category) | 172 (90.0%) | 19 (10.0%) |
| Total (Overall) | 3,426 (49.1%) | 3,551 (50.9%) |
Production, Transportation and Moving Occupations
The most common Production, Transportation and Moving occupations in Pacific Grove are Transportation (152 | 2.2%), Production (59 | 0.9%), and Material Moving (51 | 0.7%).
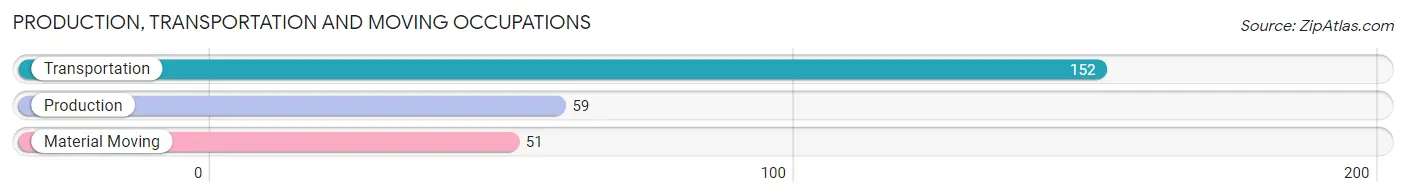
Production, Transportation and Moving Occupations by Sex
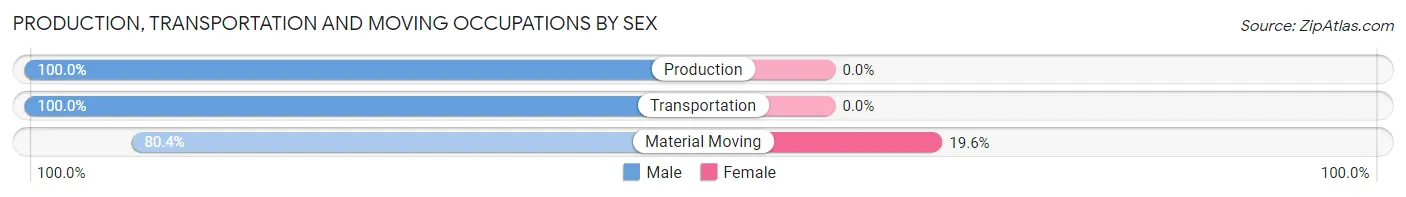
| Occupation | Male | Female |
| Production | 59 (100.0%) | 0 (0.0%) |
| Transportation | 152 (100.0%) | 0 (0.0%) |
| Material Moving | 41 (80.4%) | 10 (19.6%) |
| Total (Category) | 252 (96.2%) | 10 (3.8%) |
| Total (Overall) | 3,426 (49.1%) | 3,551 (50.9%) |
Employment Industries by Sex in Pacific Grove
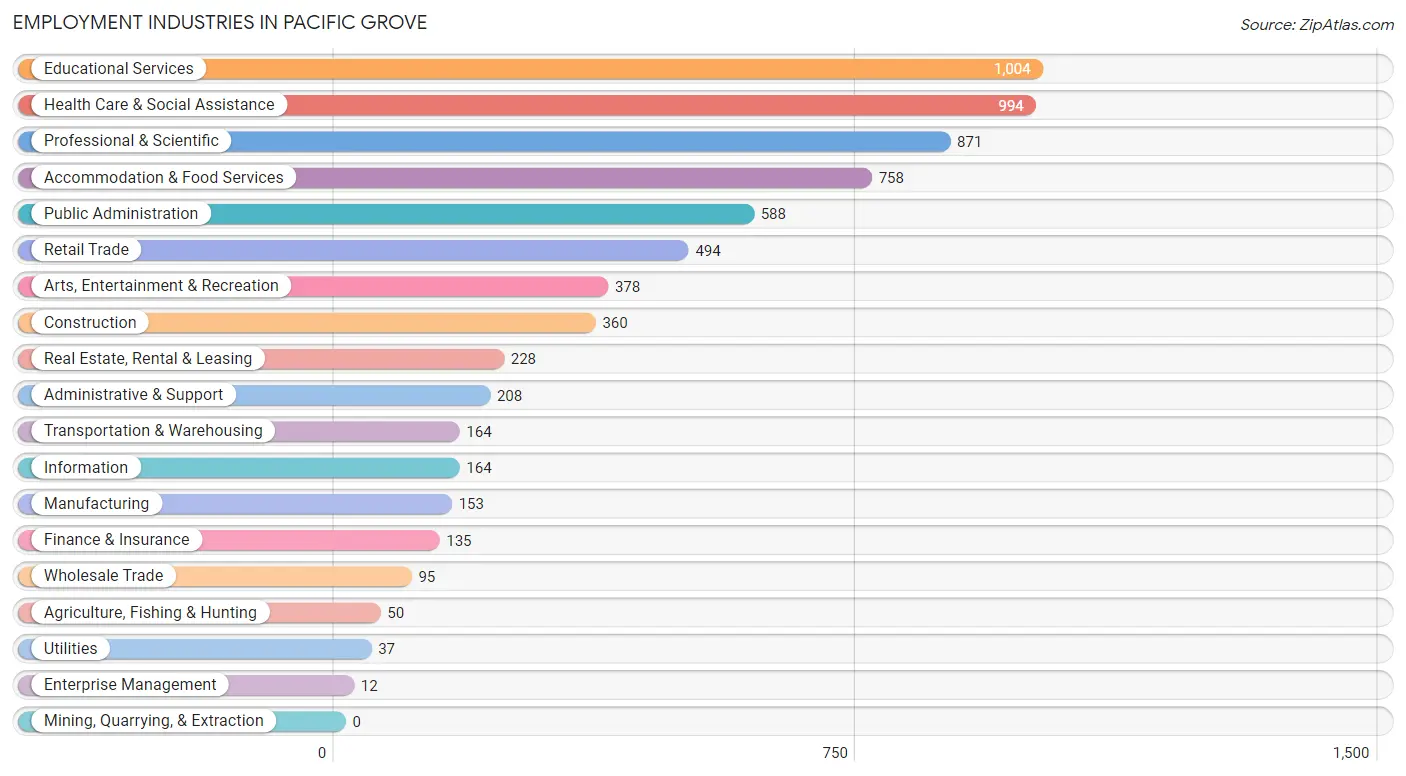
Employment Industries in Pacific Grove
The major employment industries in Pacific Grove include Educational Services (1,004 | 14.4%), Health Care & Social Assistance (994 | 14.2%), Professional & Scientific (871 | 12.5%), Accommodation & Food Services (758 | 10.9%), and Public Administration (588 | 8.4%).
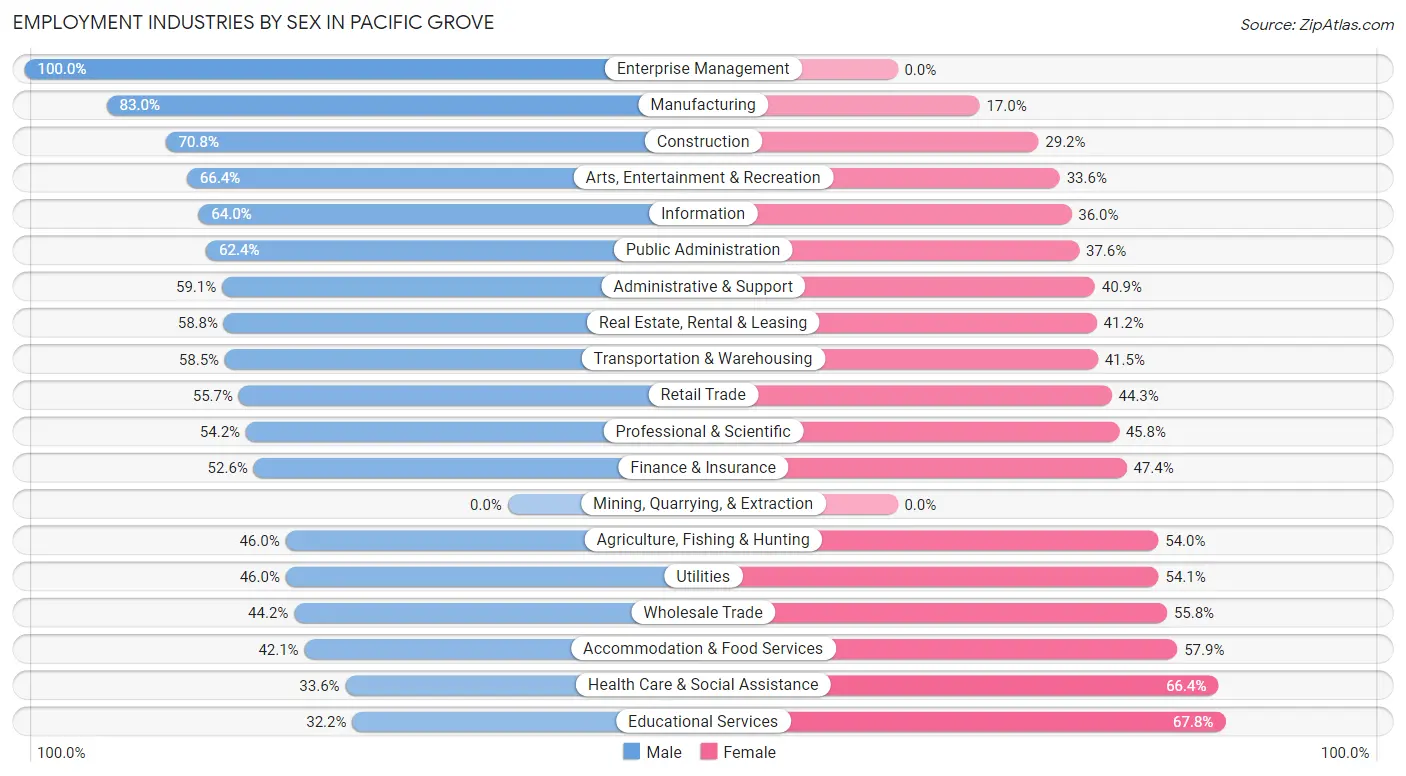
Employment Industries by Sex in Pacific Grove
The Pacific Grove industries that see more men than women are Enterprise Management (100.0%), Manufacturing (83.0%), and Construction (70.8%), whereas the industries that tend to have a higher number of women are Educational Services (67.8%), Health Care & Social Assistance (66.4%), and Accommodation & Food Services (57.9%).
| Industry | Male | Female |
| Agriculture, Fishing & Hunting | 23 (46.0%) | 27 (54.0%) |
| Mining, Quarrying, & Extraction | 0 (0.0%) | 0 (0.0%) |
| Construction | 255 (70.8%) | 105 (29.2%) |
| Manufacturing | 127 (83.0%) | 26 (17.0%) |
| Wholesale Trade | 42 (44.2%) | 53 (55.8%) |
| Retail Trade | 275 (55.7%) | 219 (44.3%) |
| Transportation & Warehousing | 96 (58.5%) | 68 (41.5%) |
| Utilities | 17 (46.0%) | 20 (54.0%) |
| Information | 105 (64.0%) | 59 (36.0%) |
| Finance & Insurance | 71 (52.6%) | 64 (47.4%) |
| Real Estate, Rental & Leasing | 134 (58.8%) | 94 (41.2%) |
| Professional & Scientific | 472 (54.2%) | 399 (45.8%) |
| Enterprise Management | 12 (100.0%) | 0 (0.0%) |
| Administrative & Support | 123 (59.1%) | 85 (40.9%) |
| Educational Services | 323 (32.2%) | 681 (67.8%) |
| Health Care & Social Assistance | 334 (33.6%) | 660 (66.4%) |
| Arts, Entertainment & Recreation | 251 (66.4%) | 127 (33.6%) |
| Accommodation & Food Services | 319 (42.1%) | 439 (57.9%) |
| Public Administration | 367 (62.4%) | 221 (37.6%) |
| Total | 3,426 (49.1%) | 3,551 (50.9%) |
Education in Pacific Grove
School Enrollment in Pacific Grove
The most common levels of schooling among the 3,133 students in Pacific Grove are elementary school (692 | 22.1%), high school (576 | 18.4%), and college / undergraduate (566 | 18.1%).
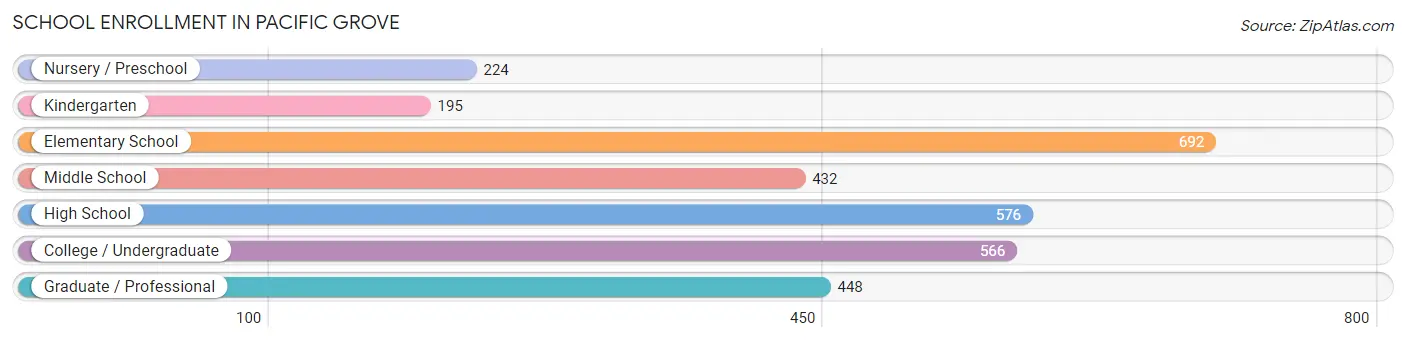
| School Level | # Students | % Students |
| Nursery / Preschool | 224 | 7.1% |
| Kindergarten | 195 | 6.2% |
| Elementary School | 692 | 22.1% |
| Middle School | 432 | 13.8% |
| High School | 576 | 18.4% |
| College / Undergraduate | 566 | 18.1% |
| Graduate / Professional | 448 | 14.3% |
| Total | 3,133 | 100.0% |
School Enrollment by Age by Funding Source in Pacific Grove
Out of a total of 3,133 students who are enrolled in schools in Pacific Grove, 633 (20.2%) attend a private institution, while the remaining 2,500 (79.8%) are enrolled in public schools. The age group of 25 to 34 year olds has the highest likelihood of being enrolled in private schools, with 98 (39.0% in the age bracket) enrolled. Conversely, the age group of 5 to 9 year old has the lowest likelihood of being enrolled in a private school, with 745 (89.5% in the age bracket) attending a public institution.
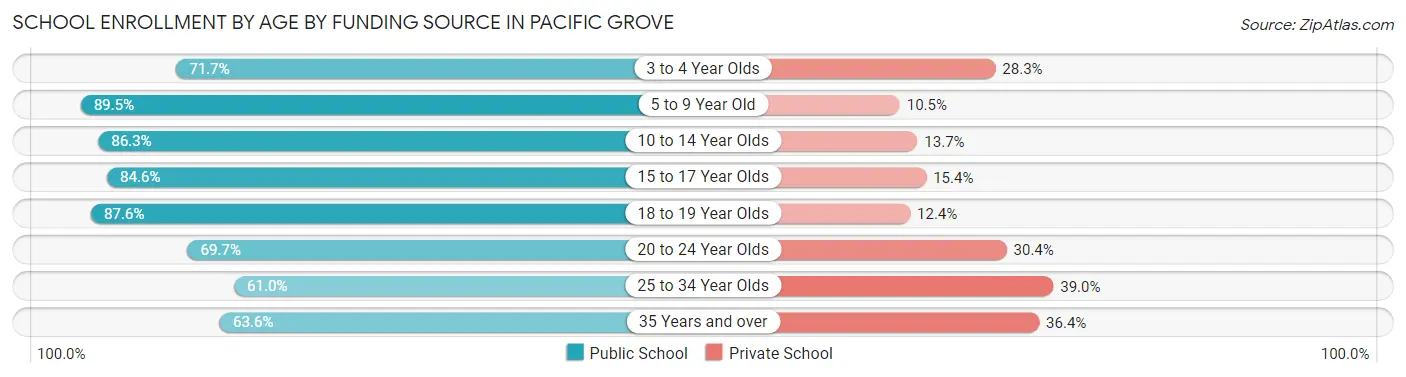
| Age Bracket | Public School | Private School |
| 3 to 4 Year Olds | 132 (71.7%) | 52 (28.3%) |
| 5 to 9 Year Old | 745 (89.5%) | 87 (10.5%) |
| 10 to 14 Year Olds | 578 (86.3%) | 92 (13.7%) |
| 15 to 17 Year Olds | 363 (84.6%) | 66 (15.4%) |
| 18 to 19 Year Olds | 85 (87.6%) | 12 (12.4%) |
| 20 to 24 Year Olds | 218 (69.7%) | 95 (30.3%) |
| 25 to 34 Year Olds | 153 (61.0%) | 98 (39.0%) |
| 35 Years and over | 227 (63.6%) | 130 (36.4%) |
| Total | 2,500 (79.8%) | 633 (20.2%) |
Educational Attainment by Field of Study in Pacific Grove
Business (807 | 10.8%), social sciences (803 | 10.8%), bio, nature & agricultural (759 | 10.2%), literature & languages (640 | 8.6%), and arts & humanities (541 | 7.3%) are the most common fields of study among 7,442 individuals in Pacific Grove who have obtained a bachelor's degree or higher.
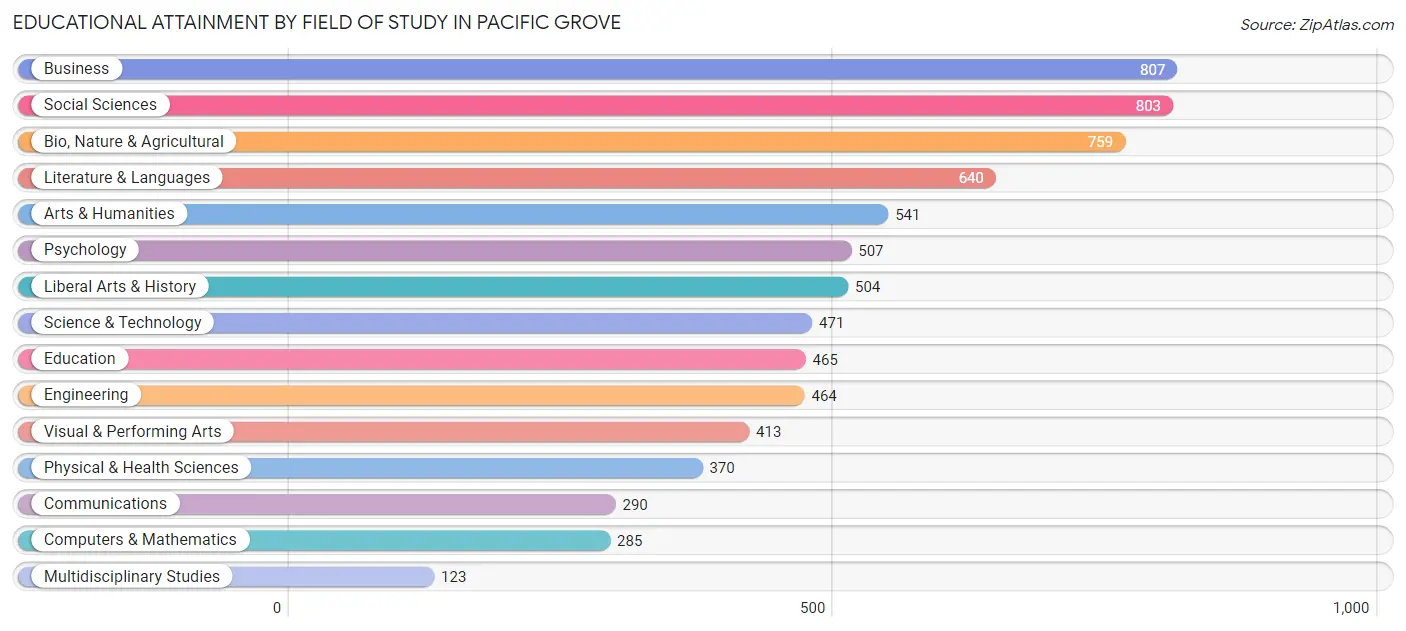
| Field of Study | # Graduates | % Graduates |
| Computers & Mathematics | 285 | 3.8% |
| Bio, Nature & Agricultural | 759 | 10.2% |
| Physical & Health Sciences | 370 | 5.0% |
| Psychology | 507 | 6.8% |
| Social Sciences | 803 | 10.8% |
| Engineering | 464 | 6.2% |
| Multidisciplinary Studies | 123 | 1.7% |
| Science & Technology | 471 | 6.3% |
| Business | 807 | 10.8% |
| Education | 465 | 6.2% |
| Literature & Languages | 640 | 8.6% |
| Liberal Arts & History | 504 | 6.8% |
| Visual & Performing Arts | 413 | 5.6% |
| Communications | 290 | 3.9% |
| Arts & Humanities | 541 | 7.3% |
| Total | 7,442 | 100.0% |
Transportation & Commute in Pacific Grove
Vehicle Availability by Sex in Pacific Grove
The most prevalent vehicle ownership categories in Pacific Grove are males with 2 vehicles (1,844, accounting for 51.7%) and females with 2 vehicles (1,662, making up 51.3%).
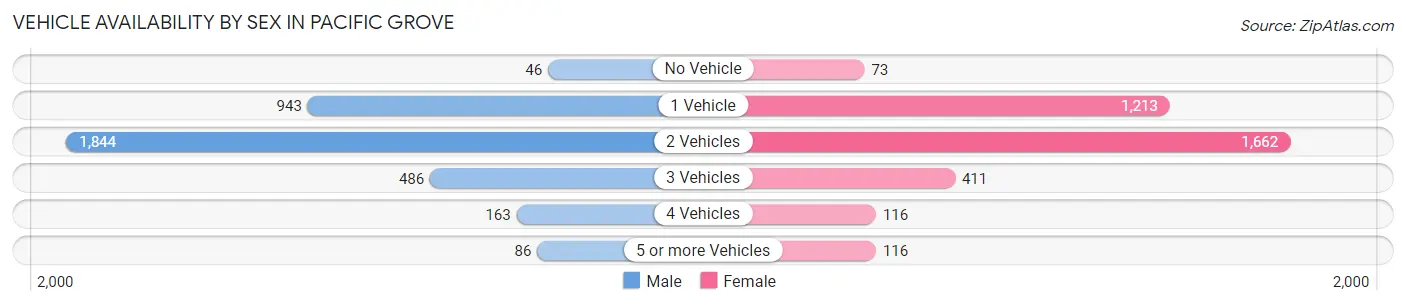
| Vehicles Available | Male | Female |
| No Vehicle | 46 (1.3%) | 73 (2.0%) |
| 1 Vehicle | 943 (26.4%) | 1,213 (33.8%) |
| 2 Vehicles | 1,844 (51.7%) | 1,662 (46.3%) |
| 3 Vehicles | 486 (13.6%) | 411 (11.5%) |
| 4 Vehicles | 163 (4.6%) | 116 (3.2%) |
| 5 or more Vehicles | 86 (2.4%) | 116 (3.2%) |
| Total | 3,568 (100.0%) | 3,591 (100.0%) |
Commute Time in Pacific Grove
The most frequently occuring commute durations in Pacific Grove are 10 to 14 minutes (1,262 commuters, 20.9%), 15 to 19 minutes (1,123 commuters, 18.6%), and 20 to 24 minutes (919 commuters, 15.2%).
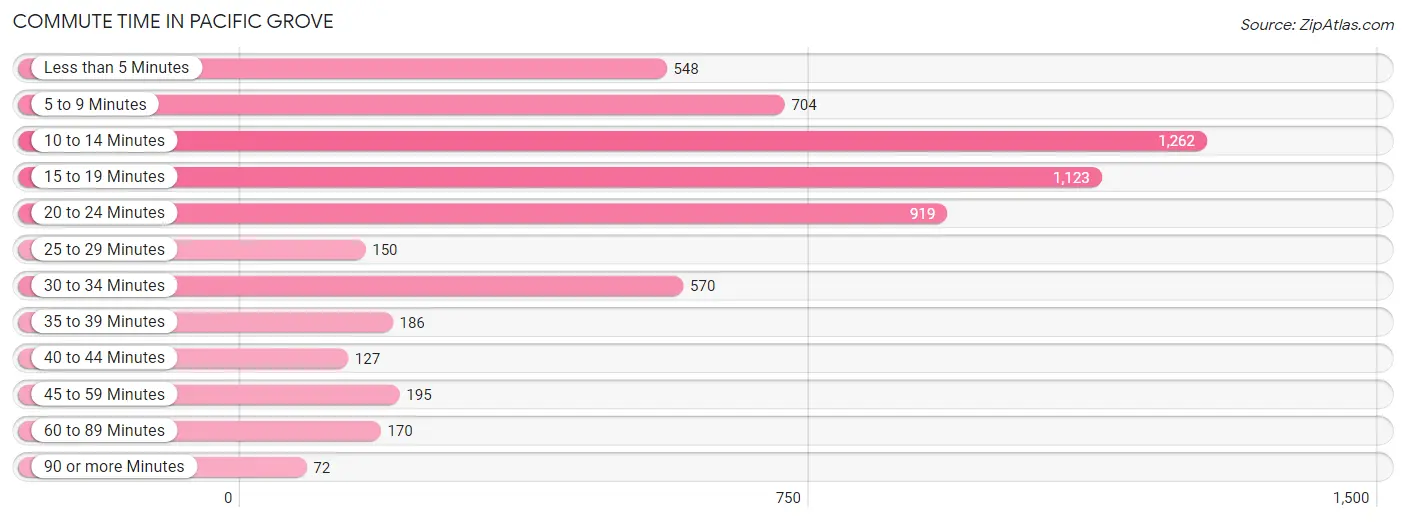
| Commute Time | # Commuters | % Commuters |
| Less than 5 Minutes | 548 | 9.1% |
| 5 to 9 Minutes | 704 | 11.7% |
| 10 to 14 Minutes | 1,262 | 20.9% |
| 15 to 19 Minutes | 1,123 | 18.6% |
| 20 to 24 Minutes | 919 | 15.2% |
| 25 to 29 Minutes | 150 | 2.5% |
| 30 to 34 Minutes | 570 | 9.5% |
| 35 to 39 Minutes | 186 | 3.1% |
| 40 to 44 Minutes | 127 | 2.1% |
| 45 to 59 Minutes | 195 | 3.2% |
| 60 to 89 Minutes | 170 | 2.8% |
| 90 or more Minutes | 72 | 1.2% |
Commute Time by Sex in Pacific Grove
The most common commute times in Pacific Grove are 10 to 14 minutes (709 commuters, 24.5%) for males and 15 to 19 minutes (642 commuters, 20.5%) for females.
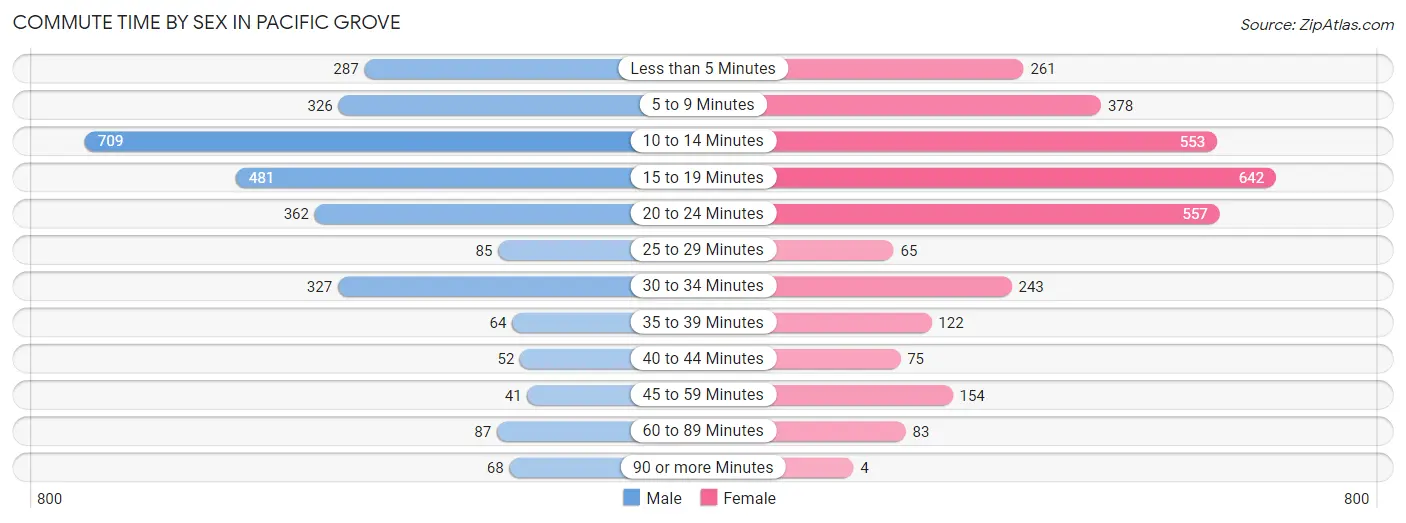
| Commute Time | Male | Female |
| Less than 5 Minutes | 287 (9.9%) | 261 (8.3%) |
| 5 to 9 Minutes | 326 (11.3%) | 378 (12.0%) |
| 10 to 14 Minutes | 709 (24.5%) | 553 (17.6%) |
| 15 to 19 Minutes | 481 (16.7%) | 642 (20.5%) |
| 20 to 24 Minutes | 362 (12.5%) | 557 (17.8%) |
| 25 to 29 Minutes | 85 (2.9%) | 65 (2.1%) |
| 30 to 34 Minutes | 327 (11.3%) | 243 (7.7%) |
| 35 to 39 Minutes | 64 (2.2%) | 122 (3.9%) |
| 40 to 44 Minutes | 52 (1.8%) | 75 (2.4%) |
| 45 to 59 Minutes | 41 (1.4%) | 154 (4.9%) |
| 60 to 89 Minutes | 87 (3.0%) | 83 (2.6%) |
| 90 or more Minutes | 68 (2.4%) | 4 (0.1%) |
Time of Departure to Work by Sex in Pacific Grove
The most frequent times of departure to work in Pacific Grove are 8:00 AM to 8:29 AM (480, 16.6%) for males and 7:00 AM to 7:29 AM (481, 15.3%) for females.
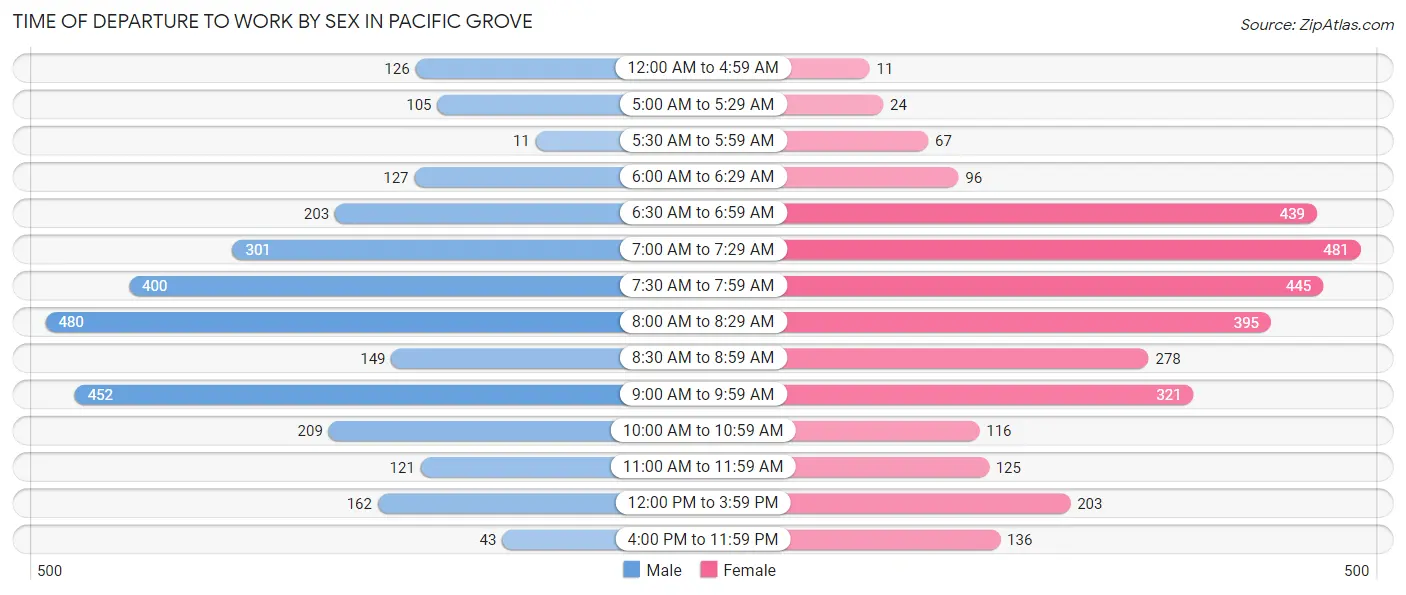
| Time of Departure | Male | Female |
| 12:00 AM to 4:59 AM | 126 (4.4%) | 11 (0.4%) |
| 5:00 AM to 5:29 AM | 105 (3.6%) | 24 (0.8%) |
| 5:30 AM to 5:59 AM | 11 (0.4%) | 67 (2.1%) |
| 6:00 AM to 6:29 AM | 127 (4.4%) | 96 (3.1%) |
| 6:30 AM to 6:59 AM | 203 (7.0%) | 439 (14.0%) |
| 7:00 AM to 7:29 AM | 301 (10.4%) | 481 (15.3%) |
| 7:30 AM to 7:59 AM | 400 (13.9%) | 445 (14.2%) |
| 8:00 AM to 8:29 AM | 480 (16.6%) | 395 (12.6%) |
| 8:30 AM to 8:59 AM | 149 (5.2%) | 278 (8.9%) |
| 9:00 AM to 9:59 AM | 452 (15.7%) | 321 (10.2%) |
| 10:00 AM to 10:59 AM | 209 (7.2%) | 116 (3.7%) |
| 11:00 AM to 11:59 AM | 121 (4.2%) | 125 (4.0%) |
| 12:00 PM to 3:59 PM | 162 (5.6%) | 203 (6.5%) |
| 4:00 PM to 11:59 PM | 43 (1.5%) | 136 (4.3%) |
| Total | 2,889 (100.0%) | 3,137 (100.0%) |
Housing Occupancy in Pacific Grove
Occupancy by Ownership in Pacific Grove
Of the total 6,860 dwellings in Pacific Grove, owner-occupied units account for 3,355 (48.9%), while renter-occupied units make up 3,505 (51.1%).
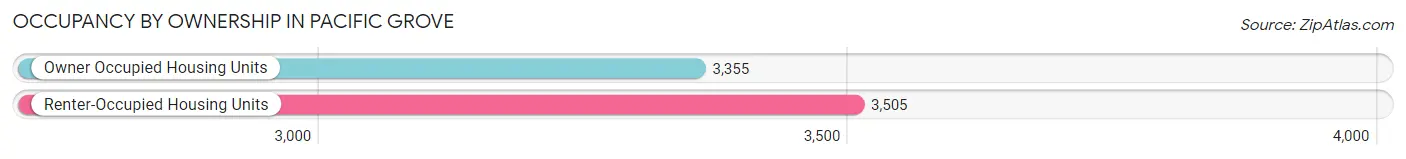
| Occupancy | # Housing Units | % Housing Units |
| Owner Occupied Housing Units | 3,355 | 48.9% |
| Renter-Occupied Housing Units | 3,505 | 51.1% |
| Total Occupied Housing Units | 6,860 | 100.0% |
Occupancy by Household Size in Pacific Grove
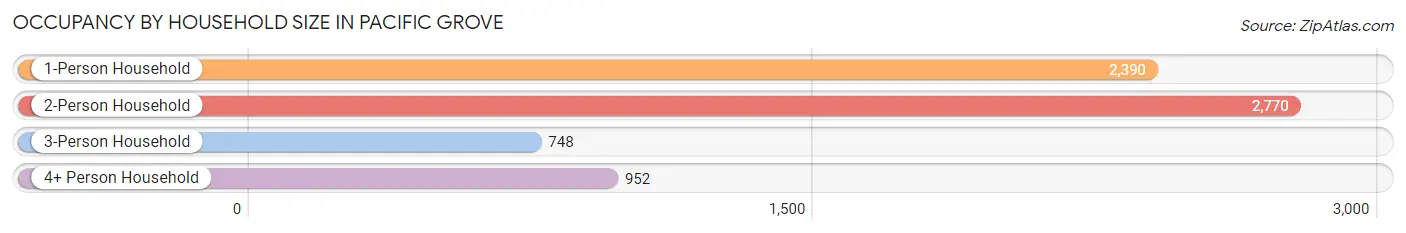
| Household Size | # Housing Units | % Housing Units |
| 1-Person Household | 2,390 | 34.8% |
| 2-Person Household | 2,770 | 40.4% |
| 3-Person Household | 748 | 10.9% |
| 4+ Person Household | 952 | 13.9% |
| Total Housing Units | 6,860 | 100.0% |
Occupancy by Ownership by Household Size in Pacific Grove
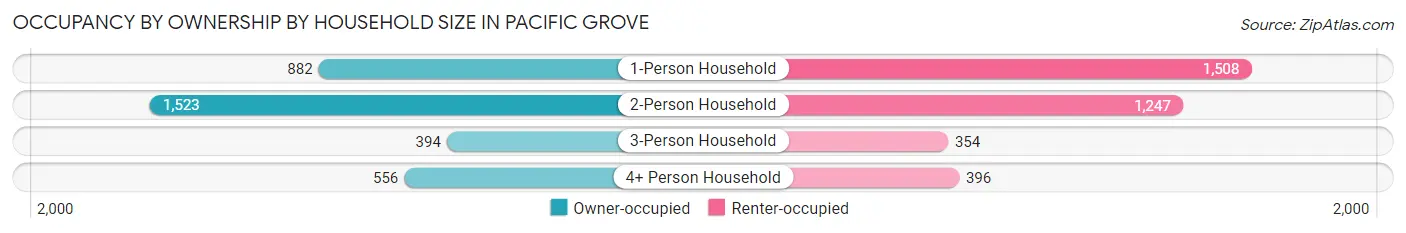
| Household Size | Owner-occupied | Renter-occupied |
| 1-Person Household | 882 (36.9%) | 1,508 (63.1%) |
| 2-Person Household | 1,523 (55.0%) | 1,247 (45.0%) |
| 3-Person Household | 394 (52.7%) | 354 (47.3%) |
| 4+ Person Household | 556 (58.4%) | 396 (41.6%) |
| Total Housing Units | 3,355 (48.9%) | 3,505 (51.1%) |
Occupancy by Educational Attainment in Pacific Grove
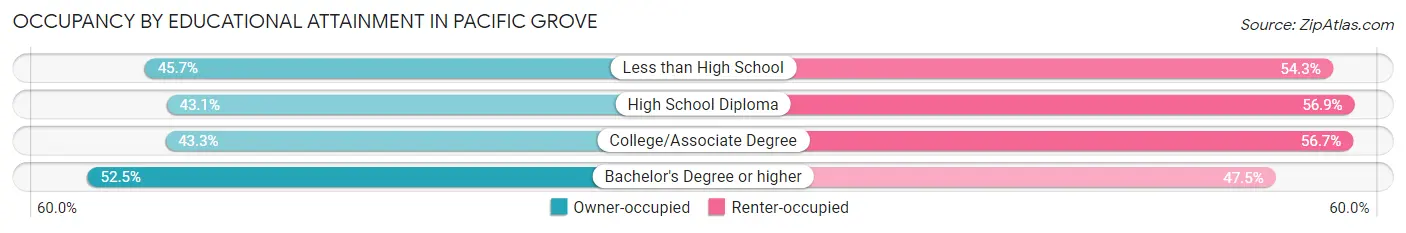
| Household Size | Owner-occupied | Renter-occupied |
| Less than High School | 96 (45.7%) | 114 (54.3%) |
| High School Diploma | 247 (43.1%) | 326 (56.9%) |
| College/Associate Degree | 836 (43.3%) | 1,096 (56.7%) |
| Bachelor's Degree or higher | 2,176 (52.5%) | 1,969 (47.5%) |
Occupancy by Age of Householder in Pacific Grove
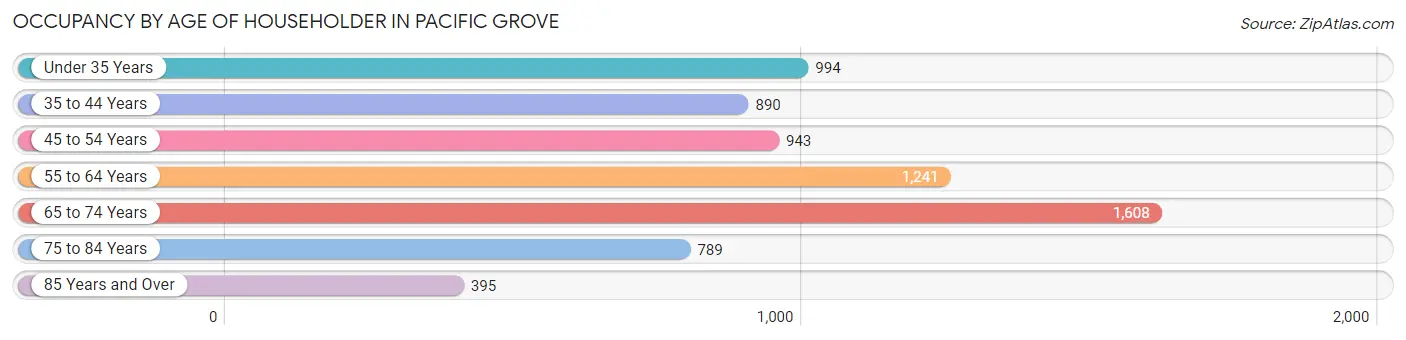
| Age Bracket | # Households | % Households |
| Under 35 Years | 994 | 14.5% |
| 35 to 44 Years | 890 | 13.0% |
| 45 to 54 Years | 943 | 13.8% |
| 55 to 64 Years | 1,241 | 18.1% |
| 65 to 74 Years | 1,608 | 23.4% |
| 75 to 84 Years | 789 | 11.5% |
| 85 Years and Over | 395 | 5.8% |
| Total | 6,860 | 100.0% |
Housing Finances in Pacific Grove
Median Income by Occupancy in Pacific Grove
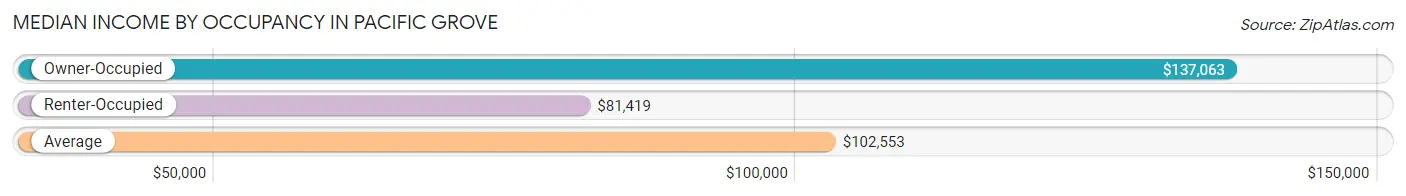
| Occupancy Type | # Households | Median Income |
| Owner-Occupied | 3,355 (48.9%) | $137,063 |
| Renter-Occupied | 3,505 (51.1%) | $81,419 |
| Average | 6,860 (100.0%) | $102,553 |
Occupancy by Householder Income Bracket in Pacific Grove
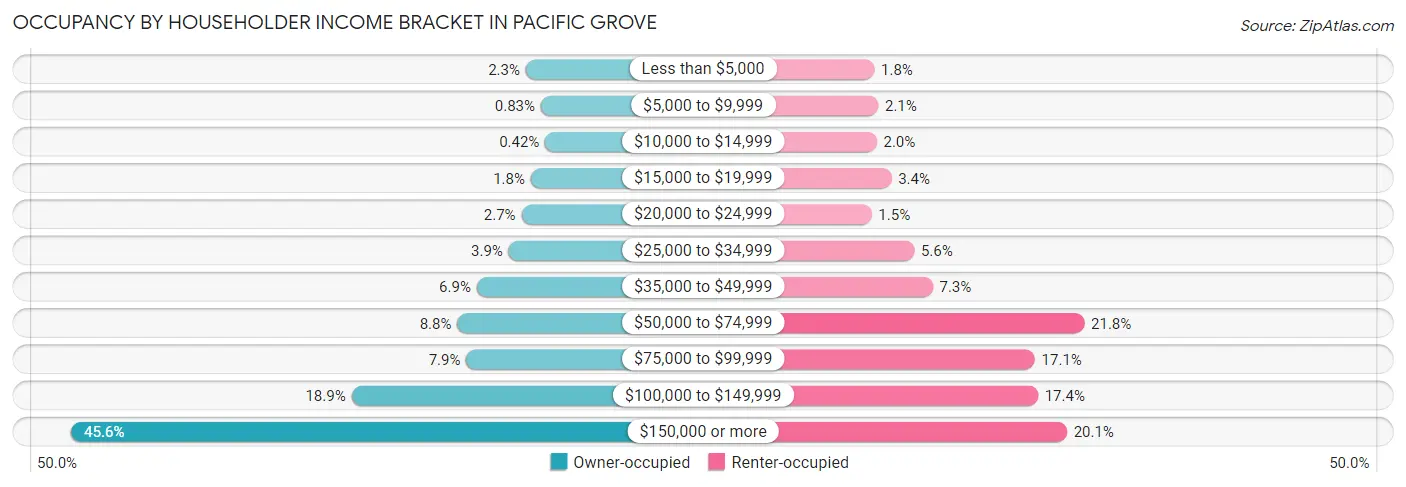
| Income Bracket | Owner-occupied | Renter-occupied |
| Less than $5,000 | 76 (2.3%) | 62 (1.8%) |
| $5,000 to $9,999 | 28 (0.8%) | 75 (2.1%) |
| $10,000 to $14,999 | 14 (0.4%) | 70 (2.0%) |
| $15,000 to $19,999 | 60 (1.8%) | 119 (3.4%) |
| $20,000 to $24,999 | 90 (2.7%) | 53 (1.5%) |
| $25,000 to $34,999 | 131 (3.9%) | 195 (5.6%) |
| $35,000 to $49,999 | 233 (6.9%) | 257 (7.3%) |
| $50,000 to $74,999 | 295 (8.8%) | 763 (21.8%) |
| $75,000 to $99,999 | 266 (7.9%) | 598 (17.1%) |
| $100,000 to $149,999 | 633 (18.9%) | 608 (17.3%) |
| $150,000 or more | 1,529 (45.6%) | 705 (20.1%) |
| Total | 3,355 (100.0%) | 3,505 (100.0%) |
Monthly Housing Cost Tiers in Pacific Grove
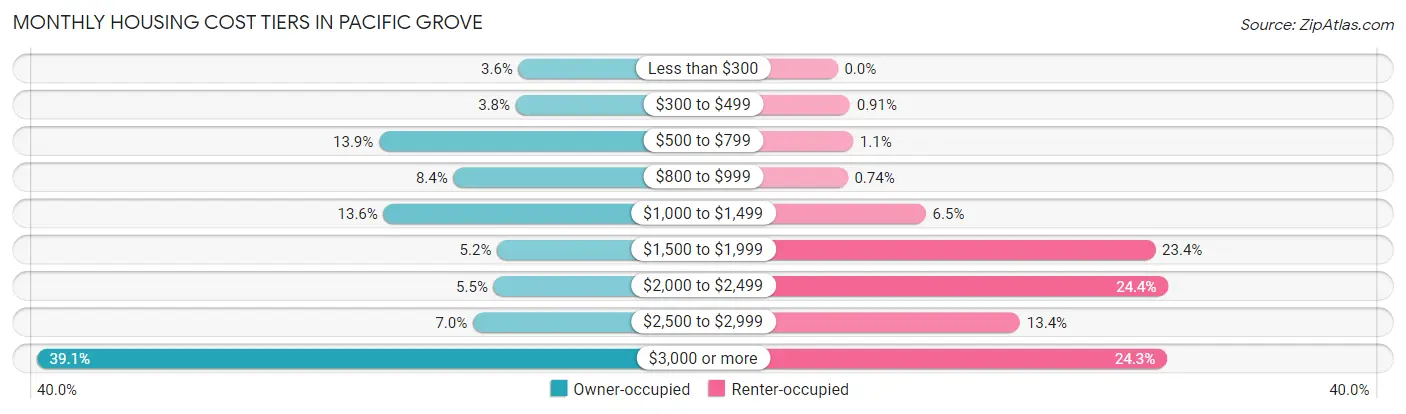
| Monthly Cost | Owner-occupied | Renter-occupied |
| Less than $300 | 121 (3.6%) | 0 (0.0%) |
| $300 to $499 | 128 (3.8%) | 32 (0.9%) |
| $500 to $799 | 466 (13.9%) | 40 (1.1%) |
| $800 to $999 | 282 (8.4%) | 26 (0.7%) |
| $1,000 to $1,499 | 455 (13.6%) | 228 (6.5%) |
| $1,500 to $1,999 | 174 (5.2%) | 820 (23.4%) |
| $2,000 to $2,499 | 183 (5.4%) | 854 (24.4%) |
| $2,500 to $2,999 | 234 (7.0%) | 471 (13.4%) |
| $3,000 or more | 1,312 (39.1%) | 851 (24.3%) |
| Total | 3,355 (100.0%) | 3,505 (100.0%) |
Physical Housing Characteristics in Pacific Grove
Housing Structures in Pacific Grove
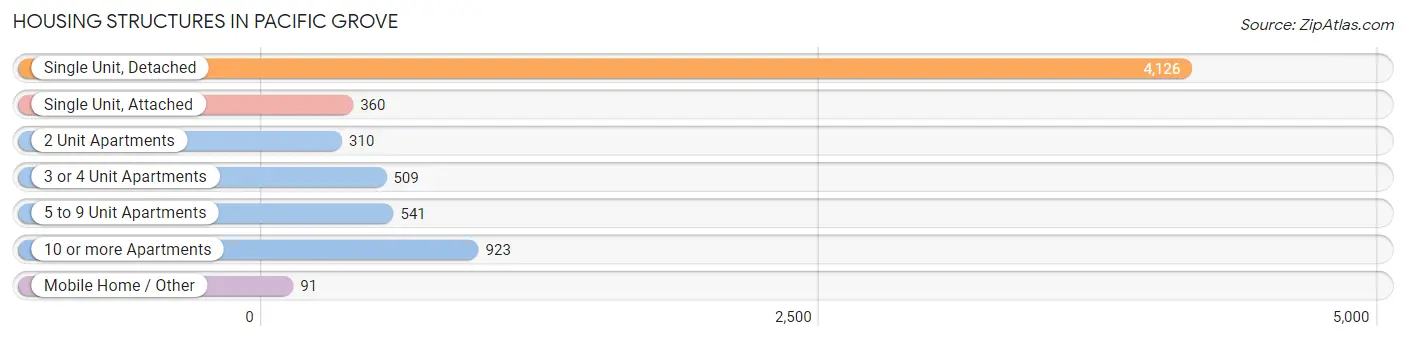
| Structure Type | # Housing Units | % Housing Units |
| Single Unit, Detached | 4,126 | 60.2% |
| Single Unit, Attached | 360 | 5.2% |
| 2 Unit Apartments | 310 | 4.5% |
| 3 or 4 Unit Apartments | 509 | 7.4% |
| 5 to 9 Unit Apartments | 541 | 7.9% |
| 10 or more Apartments | 923 | 13.5% |
| Mobile Home / Other | 91 | 1.3% |
| Total | 6,860 | 100.0% |
Housing Structures by Occupancy in Pacific Grove
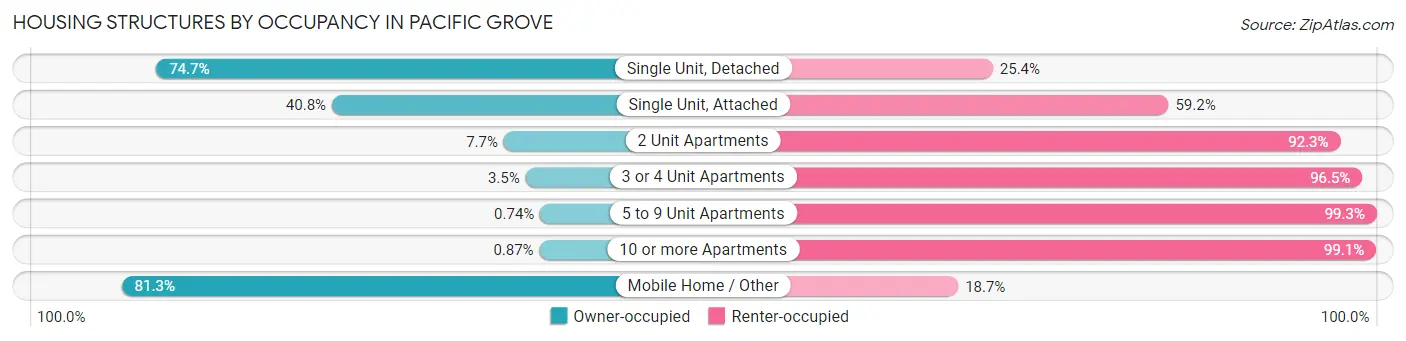
| Structure Type | Owner-occupied | Renter-occupied |
| Single Unit, Detached | 3,080 (74.7%) | 1,046 (25.4%) |
| Single Unit, Attached | 147 (40.8%) | 213 (59.2%) |
| 2 Unit Apartments | 24 (7.7%) | 286 (92.3%) |
| 3 or 4 Unit Apartments | 18 (3.5%) | 491 (96.5%) |
| 5 to 9 Unit Apartments | 4 (0.7%) | 537 (99.3%) |
| 10 or more Apartments | 8 (0.9%) | 915 (99.1%) |
| Mobile Home / Other | 74 (81.3%) | 17 (18.7%) |
| Total | 3,355 (48.9%) | 3,505 (51.1%) |
Housing Structures by Number of Rooms in Pacific Grove
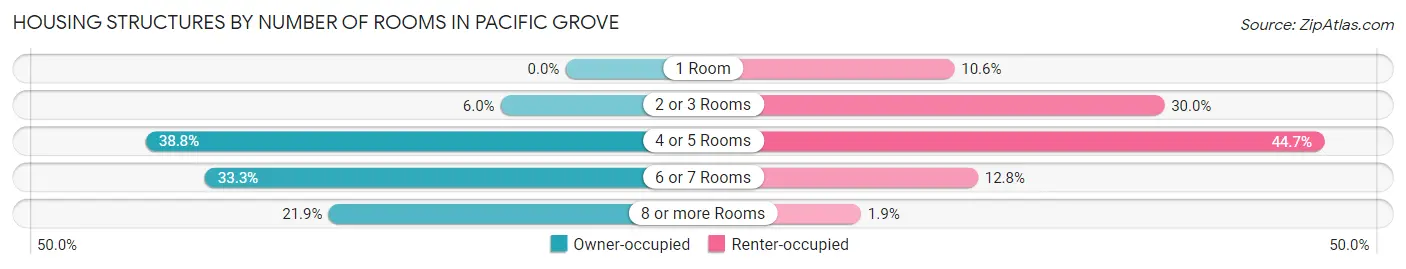
| Number of Rooms | Owner-occupied | Renter-occupied |
| 1 Room | 0 (0.0%) | 371 (10.6%) |
| 2 or 3 Rooms | 201 (6.0%) | 1,051 (30.0%) |
| 4 or 5 Rooms | 1,301 (38.8%) | 1,568 (44.7%) |
| 6 or 7 Rooms | 1,118 (33.3%) | 447 (12.8%) |
| 8 or more Rooms | 735 (21.9%) | 68 (1.9%) |
| Total | 3,355 (100.0%) | 3,505 (100.0%) |
Housing Structure by Heating Type in Pacific Grove
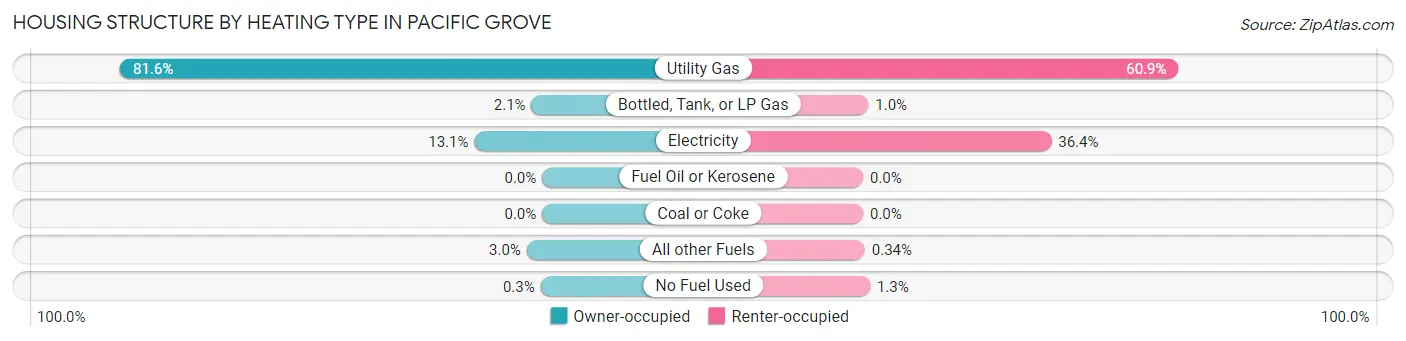
| Heating Type | Owner-occupied | Renter-occupied |
| Utility Gas | 2,736 (81.6%) | 2,135 (60.9%) |
| Bottled, Tank, or LP Gas | 69 (2.1%) | 36 (1.0%) |
| Electricity | 440 (13.1%) | 1,275 (36.4%) |
| Fuel Oil or Kerosene | 0 (0.0%) | 0 (0.0%) |
| Coal or Coke | 0 (0.0%) | 0 (0.0%) |
| All other Fuels | 100 (3.0%) | 12 (0.3%) |
| No Fuel Used | 10 (0.3%) | 47 (1.3%) |
| Total | 3,355 (100.0%) | 3,505 (100.0%) |
Household Vehicle Usage in Pacific Grove
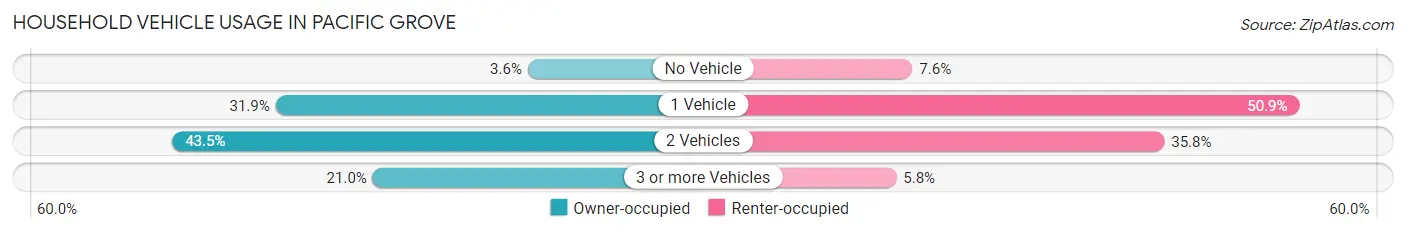
| Vehicles per Household | Owner-occupied | Renter-occupied |
| No Vehicle | 122 (3.6%) | 265 (7.6%) |
| 1 Vehicle | 1,070 (31.9%) | 1,784 (50.9%) |
| 2 Vehicles | 1,458 (43.5%) | 1,254 (35.8%) |
| 3 or more Vehicles | 705 (21.0%) | 202 (5.8%) |
| Total | 3,355 (100.0%) | 3,505 (100.0%) |
Real Estate & Mortgages in Pacific Grove
Real Estate and Mortgage Overview in Pacific Grove
| Characteristic | Without Mortgage | With Mortgage |
| Housing Units | 1,429 | 1,926 |
| Median Property Value | $1,041,700 | $1,077,100 |
| Median Household Income | $102,708 | $1,041 |
| Monthly Housing Costs | $855 | $1,201 |
| Real Estate Taxes | $4,645 | $19 |
Property Value by Mortgage Status in Pacific Grove
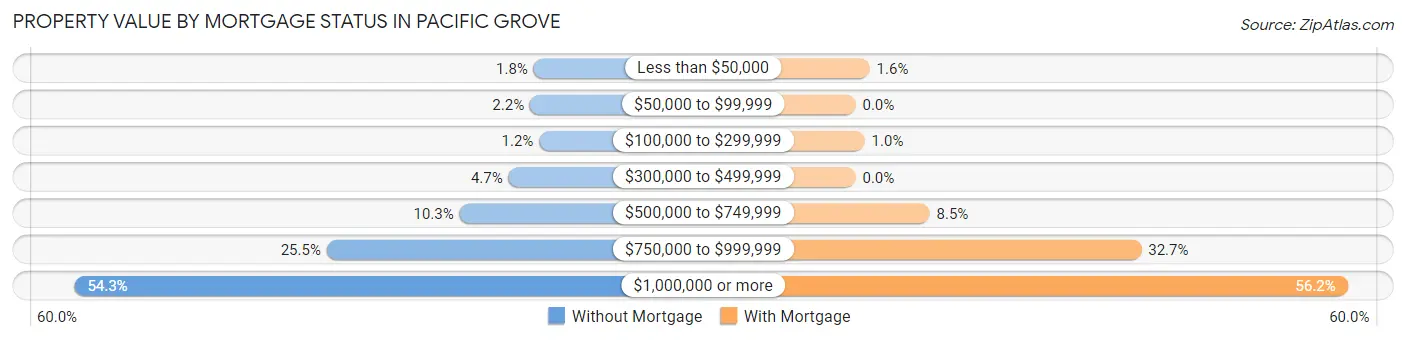
| Property Value | Without Mortgage | With Mortgage |
| Less than $50,000 | 26 (1.8%) | 31 (1.6%) |
| $50,000 to $99,999 | 32 (2.2%) | 0 (0.0%) |
| $100,000 to $299,999 | 17 (1.2%) | 20 (1.0%) |
| $300,000 to $499,999 | 67 (4.7%) | 0 (0.0%) |
| $500,000 to $749,999 | 147 (10.3%) | 163 (8.5%) |
| $750,000 to $999,999 | 364 (25.5%) | 629 (32.7%) |
| $1,000,000 or more | 776 (54.3%) | 1,083 (56.2%) |
| Total | 1,429 (100.0%) | 1,926 (100.0%) |
Household Income by Mortgage Status in Pacific Grove
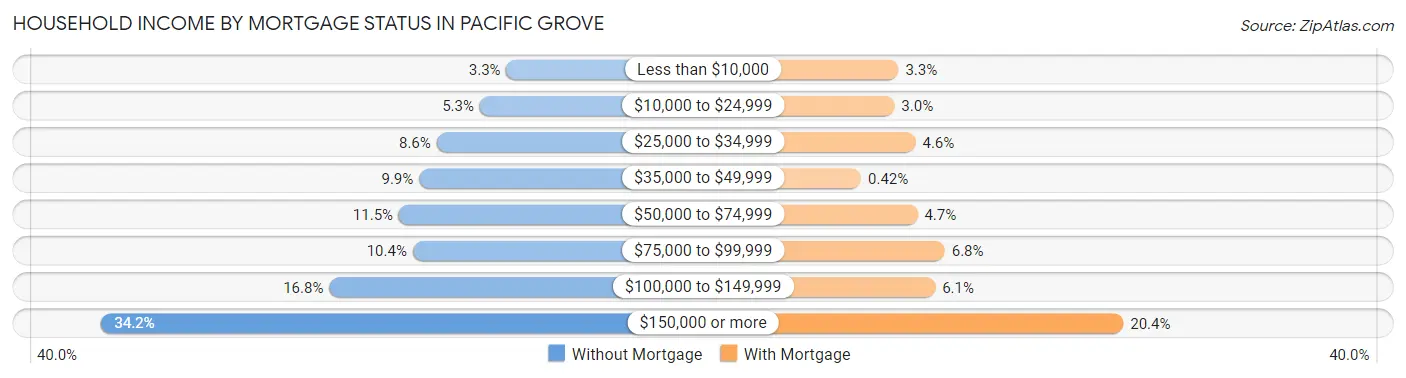
| Household Income | Without Mortgage | With Mortgage |
| Less than $10,000 | 47 (3.3%) | 63 (3.3%) |
| $10,000 to $24,999 | 76 (5.3%) | 57 (3.0%) |
| $25,000 to $34,999 | 123 (8.6%) | 88 (4.6%) |
| $35,000 to $49,999 | 142 (9.9%) | 8 (0.4%) |
| $50,000 to $74,999 | 164 (11.5%) | 91 (4.7%) |
| $75,000 to $99,999 | 149 (10.4%) | 131 (6.8%) |
| $100,000 to $149,999 | 240 (16.8%) | 117 (6.1%) |
| $150,000 or more | 488 (34.2%) | 393 (20.4%) |
| Total | 1,429 (100.0%) | 1,926 (100.0%) |
Property Value to Household Income Ratio in Pacific Grove
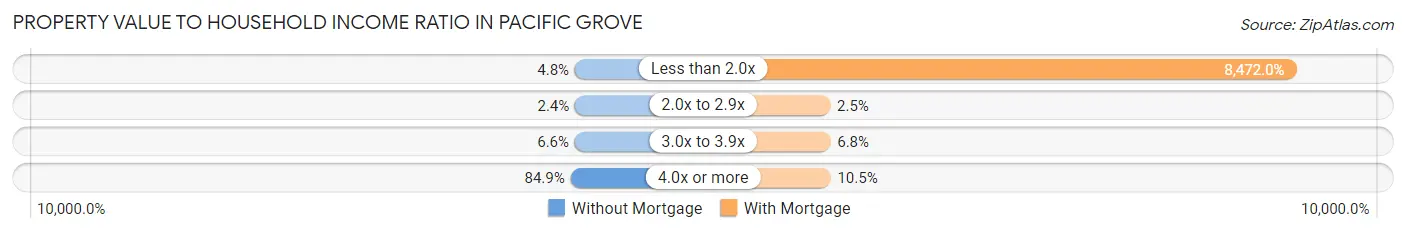
| Value-to-Income Ratio | Without Mortgage | With Mortgage |
| Less than 2.0x | 69 (4.8%) | 163,171 (8,472.0%) |
| 2.0x to 2.9x | 34 (2.4%) | 48 (2.5%) |
| 3.0x to 3.9x | 94 (6.6%) | 130 (6.8%) |
| 4.0x or more | 1,213 (84.9%) | 202 (10.5%) |
| Total | 1,429 (100.0%) | 1,926 (100.0%) |
Real Estate Taxes by Mortgage Status in Pacific Grove
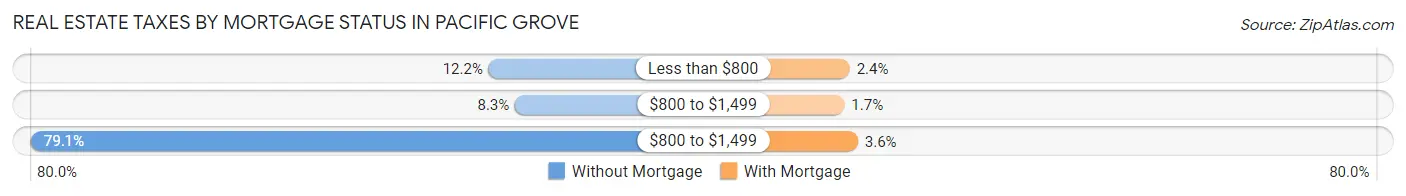
| Property Taxes | Without Mortgage | With Mortgage |
| Less than $800 | 174 (12.2%) | 47 (2.4%) |
| $800 to $1,499 | 119 (8.3%) | 32 (1.7%) |
| $800 to $1,499 | 1,130 (79.1%) | 70 (3.6%) |
| Total | 1,429 (100.0%) | 1,926 (100.0%) |
Health & Disability in Pacific Grove
Health Insurance Coverage by Age in Pacific Grove
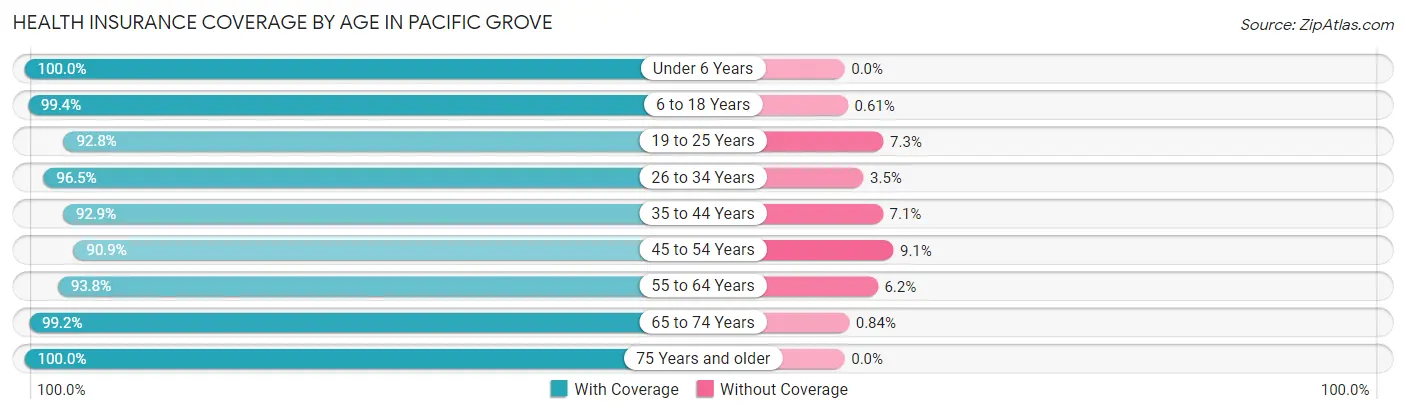
| Age Bracket | With Coverage | Without Coverage |
| Under 6 Years | 702 (100.0%) | 0 (0.0%) |
| 6 to 18 Years | 1,942 (99.4%) | 12 (0.6%) |
| 19 to 25 Years | 704 (92.7%) | 55 (7.2%) |
| 26 to 34 Years | 1,402 (96.5%) | 51 (3.5%) |
| 35 to 44 Years | 1,521 (92.9%) | 117 (7.1%) |
| 45 to 54 Years | 1,770 (90.9%) | 177 (9.1%) |
| 55 to 64 Years | 2,045 (93.8%) | 135 (6.2%) |
| 65 to 74 Years | 2,366 (99.2%) | 20 (0.8%) |
| 75 Years and older | 1,623 (100.0%) | 0 (0.0%) |
| Total | 14,075 (96.1%) | 567 (3.9%) |
Health Insurance Coverage by Citizenship Status in Pacific Grove
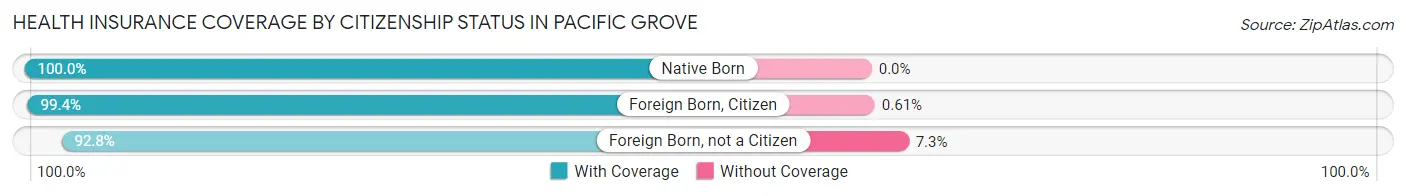
| Citizenship Status | With Coverage | Without Coverage |
| Native Born | 702 (100.0%) | 0 (0.0%) |
| Foreign Born, Citizen | 1,942 (99.4%) | 12 (0.6%) |
| Foreign Born, not a Citizen | 704 (92.7%) | 55 (7.2%) |
Health Insurance Coverage by Household Income in Pacific Grove
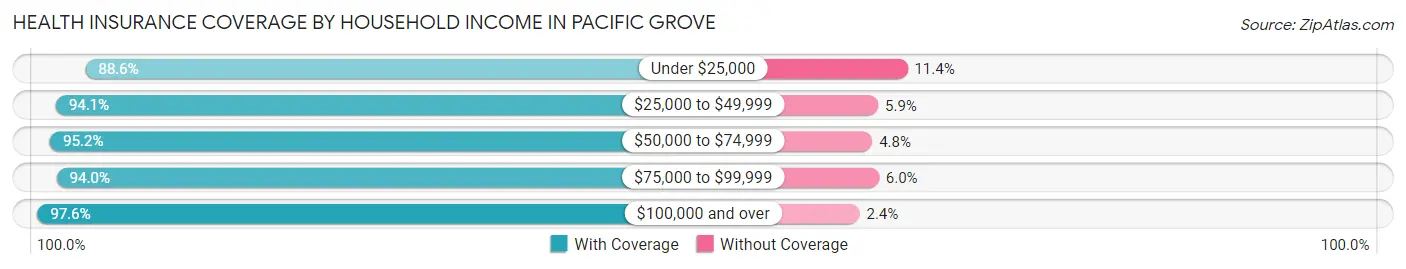
| Household Income | With Coverage | Without Coverage |
| Under $25,000 | 803 (88.6%) | 103 (11.4%) |
| $25,000 to $49,999 | 1,061 (94.1%) | 66 (5.9%) |
| $50,000 to $74,999 | 1,676 (95.2%) | 84 (4.8%) |
| $75,000 to $99,999 | 1,505 (94.0%) | 96 (6.0%) |
| $100,000 and over | 8,838 (97.6%) | 216 (2.4%) |
Public vs Private Health Insurance Coverage by Age in Pacific Grove
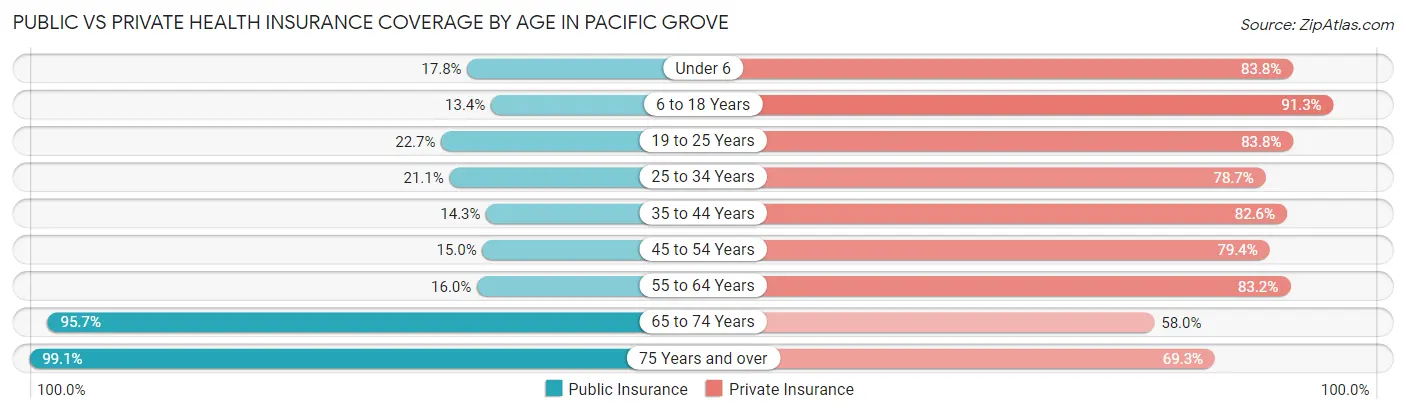
| Age Bracket | Public Insurance | Private Insurance |
| Under 6 | 125 (17.8%) | 588 (83.8%) |
| 6 to 18 Years | 262 (13.4%) | 1,783 (91.2%) |
| 19 to 25 Years | 172 (22.7%) | 636 (83.8%) |
| 25 to 34 Years | 307 (21.1%) | 1,143 (78.7%) |
| 35 to 44 Years | 234 (14.3%) | 1,353 (82.6%) |
| 45 to 54 Years | 292 (15.0%) | 1,546 (79.4%) |
| 55 to 64 Years | 349 (16.0%) | 1,814 (83.2%) |
| 65 to 74 Years | 2,284 (95.7%) | 1,384 (58.0%) |
| 75 Years and over | 1,609 (99.1%) | 1,124 (69.3%) |
| Total | 5,634 (38.5%) | 11,371 (77.7%) |
Disability Status by Sex by Age in Pacific Grove
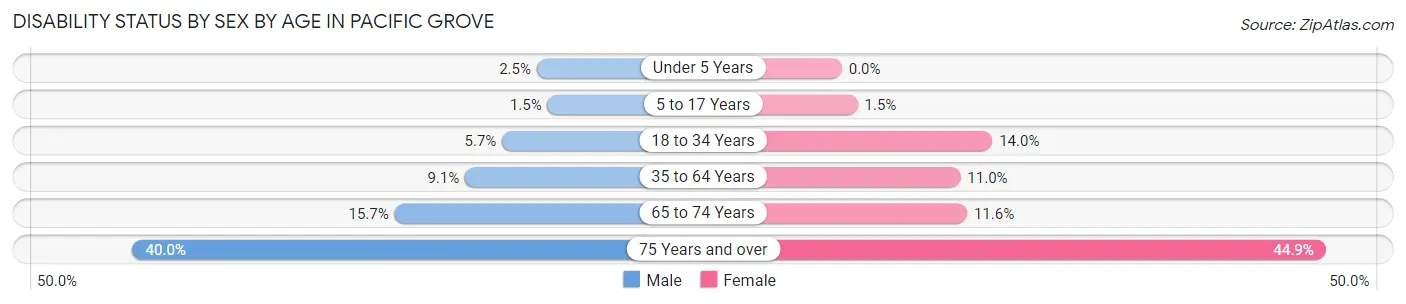
| Age Bracket | Male | Female |
| Under 5 Years | 5 (2.5%) | 0 (0.0%) |
| 5 to 17 Years | 12 (1.5%) | 18 (1.5%) |
| 18 to 34 Years | 58 (5.7%) | 176 (14.0%) |
| 35 to 64 Years | 236 (9.1%) | 350 (11.0%) |
| 65 to 74 Years | 185 (15.7%) | 140 (11.6%) |
| 75 Years and over | 265 (40.0%) | 431 (44.9%) |
Disability Class by Sex by Age in Pacific Grove
Disability Class: Hearing Difficulty
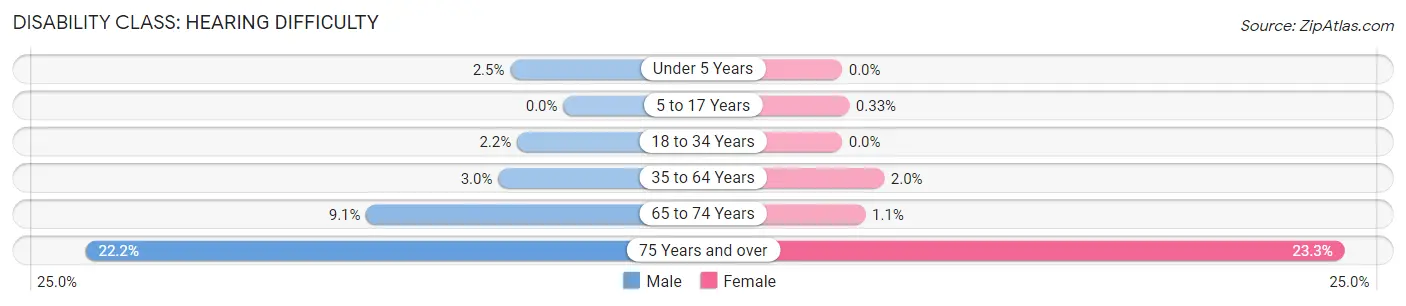
| Age Bracket | Male | Female |
| Under 5 Years | 5 (2.5%) | 0 (0.0%) |
| 5 to 17 Years | 0 (0.0%) | 4 (0.3%) |
| 18 to 34 Years | 22 (2.1%) | 0 (0.0%) |
| 35 to 64 Years | 78 (3.0%) | 62 (1.9%) |
| 65 to 74 Years | 108 (9.1%) | 13 (1.1%) |
| 75 Years and over | 147 (22.2%) | 224 (23.3%) |
Disability Class: Vision Difficulty
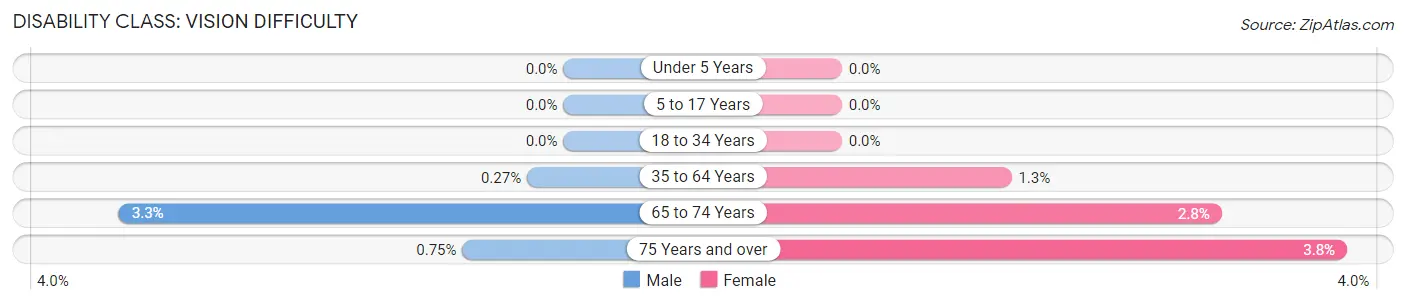
| Age Bracket | Male | Female |
| Under 5 Years | 0 (0.0%) | 0 (0.0%) |
| 5 to 17 Years | 0 (0.0%) | 0 (0.0%) |
| 18 to 34 Years | 0 (0.0%) | 0 (0.0%) |
| 35 to 64 Years | 7 (0.3%) | 40 (1.3%) |
| 65 to 74 Years | 39 (3.3%) | 34 (2.8%) |
| 75 Years and over | 5 (0.7%) | 36 (3.7%) |
Disability Class: Cognitive Difficulty
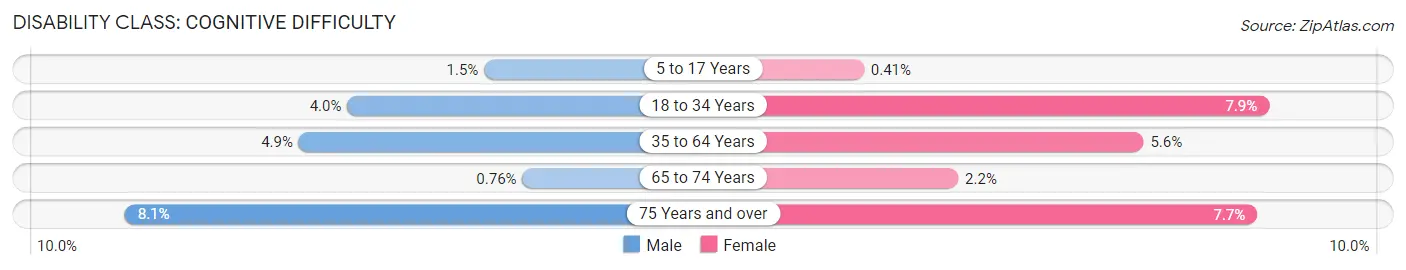
| Age Bracket | Male | Female |
| 5 to 17 Years | 12 (1.5%) | 5 (0.4%) |
| 18 to 34 Years | 41 (4.0%) | 100 (7.9%) |
| 35 to 64 Years | 127 (4.9%) | 178 (5.6%) |
| 65 to 74 Years | 9 (0.8%) | 26 (2.2%) |
| 75 Years and over | 54 (8.1%) | 74 (7.7%) |
Disability Class: Ambulatory Difficulty
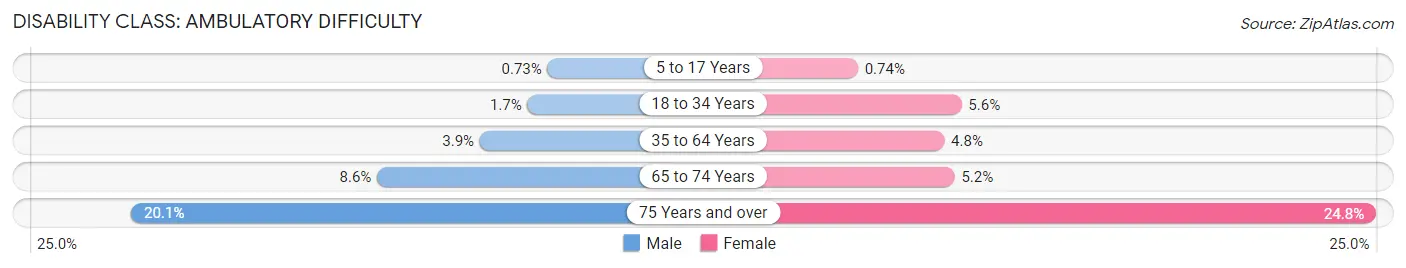
| Age Bracket | Male | Female |
| 5 to 17 Years | 6 (0.7%) | 9 (0.7%) |
| 18 to 34 Years | 17 (1.7%) | 70 (5.6%) |
| 35 to 64 Years | 100 (3.9%) | 151 (4.8%) |
| 65 to 74 Years | 102 (8.6%) | 63 (5.2%) |
| 75 Years and over | 133 (20.1%) | 238 (24.8%) |
Disability Class: Self-Care Difficulty
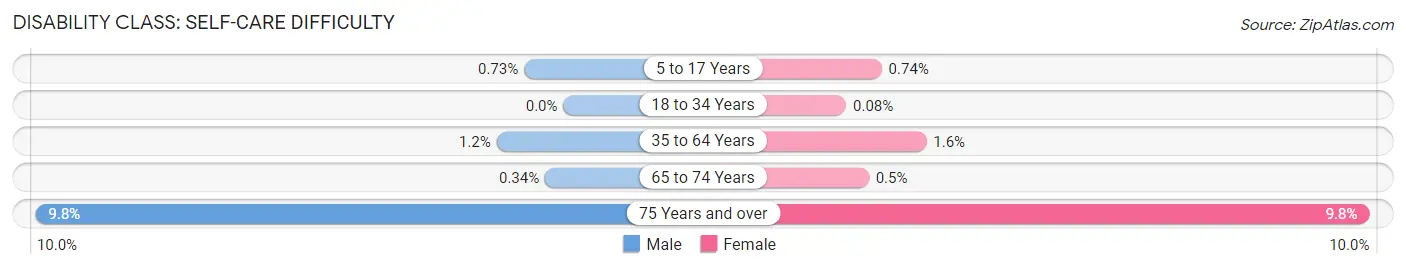
| Age Bracket | Male | Female |
| 5 to 17 Years | 6 (0.7%) | 9 (0.7%) |
| 18 to 34 Years | 0 (0.0%) | 1 (0.1%) |
| 35 to 64 Years | 32 (1.2%) | 50 (1.6%) |
| 65 to 74 Years | 4 (0.3%) | 6 (0.5%) |
| 75 Years and over | 65 (9.8%) | 94 (9.8%) |
Technology Access in Pacific Grove
Computing Device Access in Pacific Grove
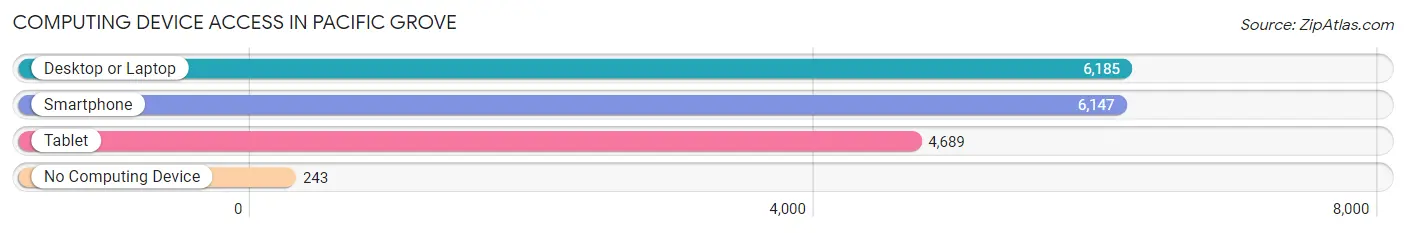
| Device Type | # Households | % Households |
| Desktop or Laptop | 6,185 | 90.2% |
| Smartphone | 6,147 | 89.6% |
| Tablet | 4,689 | 68.3% |
| No Computing Device | 243 | 3.5% |
| Total | 6,860 | 100.0% |
Internet Access in Pacific Grove
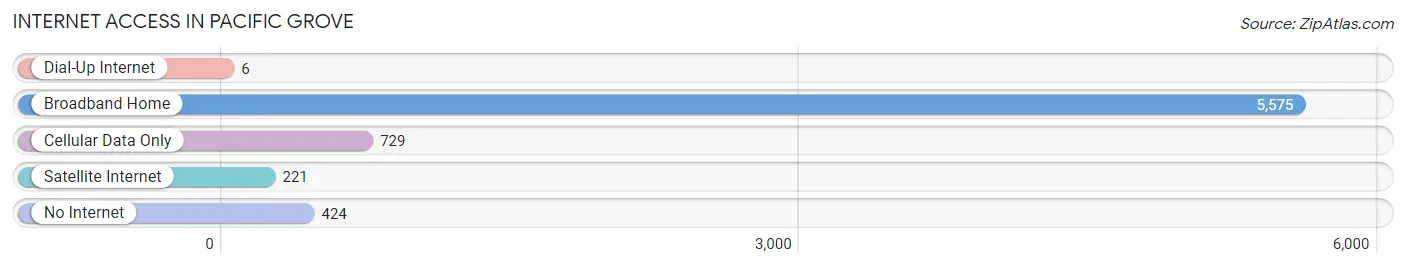
| Internet Type | # Households | % Households |
| Dial-Up Internet | 6 | 0.1% |
| Broadband Home | 5,575 | 81.3% |
| Cellular Data Only | 729 | 10.6% |
| Satellite Internet | 221 | 3.2% |
| No Internet | 424 | 6.2% |
| Total | 6,860 | 100.0% |
Pacific Grove Summary
History
Pacific Grove, California is a small coastal city located in Monterey County, California. It is situated on the Monterey Peninsula, between Monterey and Carmel-by-the-Sea. The city was founded in 1875 by a group of Methodists who wanted to create a Christian retreat. The city was incorporated in 1889 and has since become a popular tourist destination.
Geography
Pacific Grove is located on the Monterey Peninsula, between Monterey and Carmel-by-the-Sea. It is bordered by the Pacific Ocean to the west, Monterey Bay to the east, and the Santa Lucia Mountains to the north. The city has a total area of 5.3 square miles, of which 4.9 square miles is land and 0.4 square miles is water.
Economy
Pacific Grove’s economy is largely based on tourism. The city is home to a variety of attractions, including the Point Pinos Lighthouse, the Monterey Bay Aquarium, and the Monarch Grove Sanctuary. The city also has a thriving retail sector, with a variety of shops and restaurants. Additionally, the city is home to a number of businesses, including software companies, financial services firms, and medical offices.
Demographics
As of the 2010 census, Pacific Grove had a population of 15,041. The racial makeup of the city was 79.2% White, 0.7% African American, 1.2% Native American, 4.3% Asian, 0.2% Pacific Islander, 9.2% from other races, and 4.9% from two or more races. Hispanic or Latino of any race were 18.2% of the population.
The median income for a household in the city was $60,845, and the median income for a family was $71,817. The per capita income for the city was $35,945. About 8.2% of families and 11.2% of the population were below the poverty line, including 15.2% of those under age 18 and 5.2% of those age 65 or over.
Common Questions
What is Per Capita Income in Pacific Grove?
Per Capita income in Pacific Grove is $64,346.
What is the Median Family Income in Pacific Grove?
Median Family Income in Pacific Grove is $148,438.
What is the Median Household income in Pacific Grove?
Median Household Income in Pacific Grove is $102,553.
What is Income or Wage Gap in Pacific Grove?
Income or Wage Gap in Pacific Grove is 30.5%.
Women in Pacific Grove earn 69.5 cents for every dollar earned by a man.
What is Family Income Deficit in Pacific Grove?
Family Income Deficit in Pacific Grove is $8,506.
Families that are below poverty line in Pacific Grove earn $8,506 less on average than the poverty threshold level.
What is Inequality or Gini Index in Pacific Grove?
Inequality or Gini Index in Pacific Grove is 0.45.
What is the Total Population of Pacific Grove?
Total Population of Pacific Grove is 15,098.
What is the Total Male Population of Pacific Grove?
Total Male Population of Pacific Grove is 6,713.
What is the Total Female Population of Pacific Grove?
Total Female Population of Pacific Grove is 8,385.
What is the Ratio of Males per 100 Females in Pacific Grove?
There are 80.06 Males per 100 Females in Pacific Grove.
What is the Ratio of Females per 100 Males in Pacific Grove?
There are 124.91 Females per 100 Males in Pacific Grove.
What is the Median Population Age in Pacific Grove?
Median Population Age in Pacific Grove is 49.2 Years.
What is the Average Family Size in Pacific Grove
Average Family Size in Pacific Grove is 2.8 People.
What is the Average Household Size in Pacific Grove
Average Household Size in Pacific Grove is 2.1 People.
How Large is the Labor Force in Pacific Grove?
There are 7,680 People in the Labor Forcein in Pacific Grove.
What is the Percentage of People in the Labor Force in Pacific Grove?
59.9% of People are in the Labor Force in Pacific Grove.
What is the Unemployment Rate in Pacific Grove?
Unemployment Rate in Pacific Grove is 5.6%.