Katy, TX Map & Demographics
Katy Map
Katy Overview
$46,184
PER CAPITA INCOME
$133,479
AVG FAMILY INCOME
$114,917
AVG HOUSEHOLD INCOME
44.9%
WAGE / INCOME GAP [ % ]
55.1¢/ $1
WAGE / INCOME GAP [ $ ]
0.42
INEQUALITY / GINI INDEX
22,826
TOTAL POPULATION
11,436
MALE POPULATION
11,390
FEMALE POPULATION
100.40
MALES / 100 FEMALES
99.60
FEMALES / 100 MALES
35.7
MEDIAN AGE
3.6
AVG FAMILY SIZE
3.2
AVG HOUSEHOLD SIZE
11,072
LABOR FORCE [ PEOPLE ]
66.1%
PERCENT IN LABOR FORCE
6.5%
UNEMPLOYMENT RATE
Income in Katy
Income Overview in Katy
Per Capita Income in Katy is $46,184, while median incomes of families and households are $133,479 and $114,917 respectively.
| Characteristic | Number | Measure |
| Per Capita Income | 22,826 | $46,184 |
| Median Family Income | 5,768 | $133,479 |
| Mean Family Income | 5,768 | $162,685 |
| Median Household Income | 6,993 | $114,917 |
| Mean Household Income | 6,993 | $147,414 |
| Income Deficit | 5,768 | $0 |
| Wage / Income Gap (%) | 22,826 | 44.87% |
| Wage / Income Gap ($) | 22,826 | 55.13¢ per $1 |
| Gini / Inequality Index | 22,826 | 0.42 |
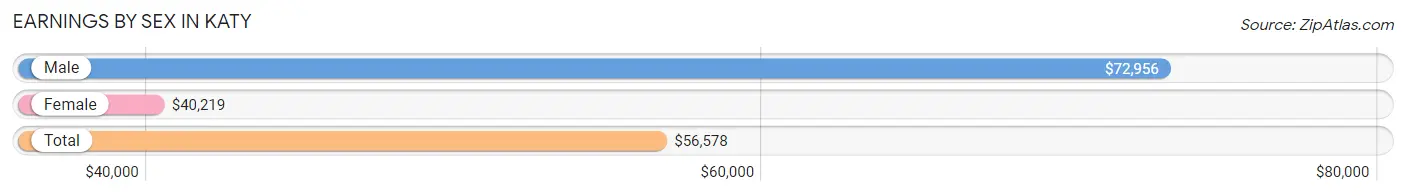
Earnings by Sex in Katy
Average Earnings in Katy are $56,578, $72,956 for men and $40,219 for women, a difference of 44.9%.
| Sex | Number | Average Earnings |
| Male | 6,071 (54.3%) | $72,956 |
| Female | 5,117 (45.7%) | $40,219 |
| Total | 11,188 (100.0%) | $56,578 |
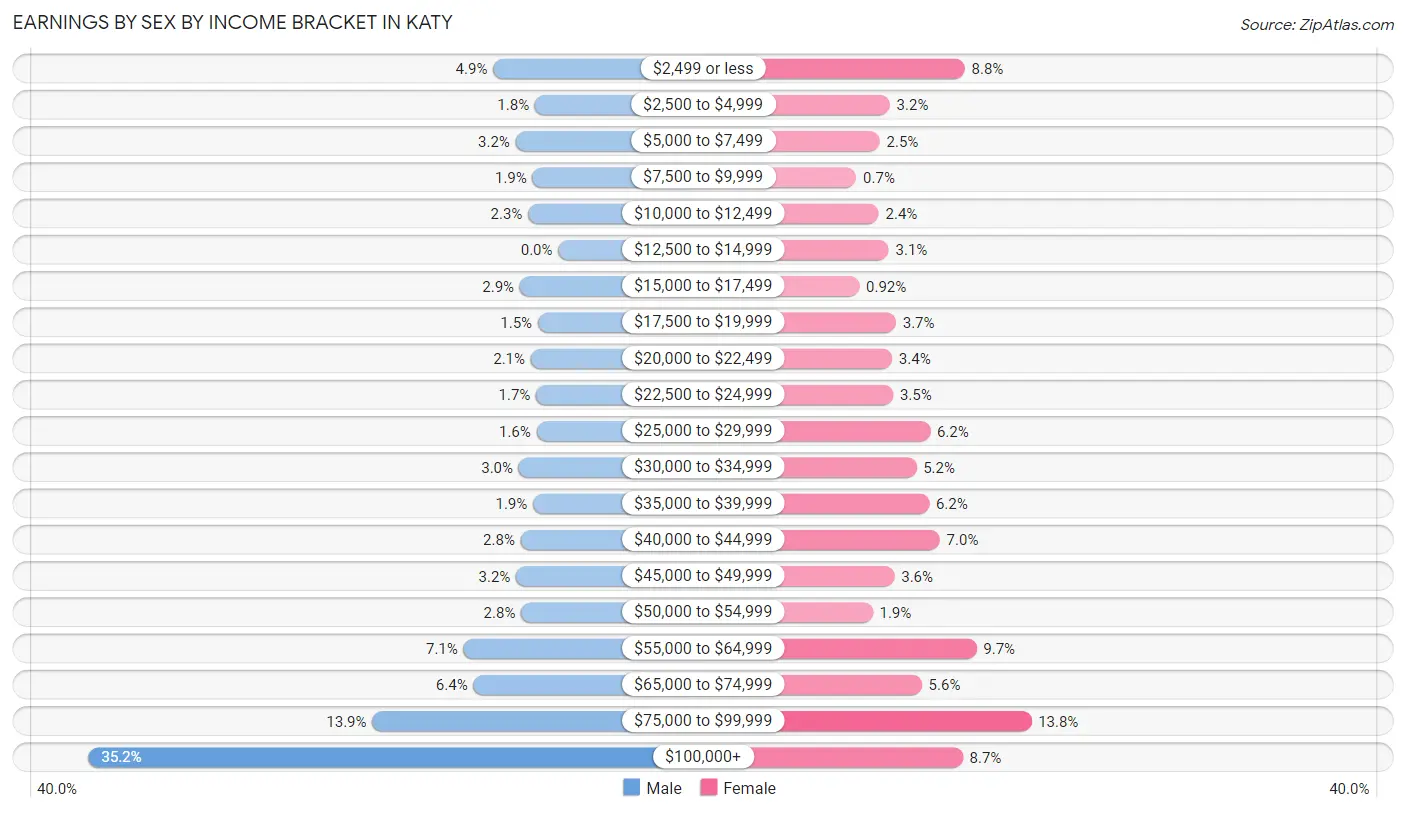
Earnings by Sex by Income Bracket in Katy
The most common earnings brackets in Katy are $100,000+ for men (2,138 | 35.2%) and $75,000 to $99,999 for women (707 | 13.8%).
| Income | Male | Female |
| $2,499 or less | 296 (4.9%) | 452 (8.8%) |
| $2,500 to $4,999 | 106 (1.8%) | 164 (3.2%) |
| $5,000 to $7,499 | 194 (3.2%) | 126 (2.5%) |
| $7,500 to $9,999 | 117 (1.9%) | 36 (0.7%) |
| $10,000 to $12,499 | 137 (2.3%) | 122 (2.4%) |
| $12,500 to $14,999 | 0 (0.0%) | 160 (3.1%) |
| $15,000 to $17,499 | 175 (2.9%) | 47 (0.9%) |
| $17,500 to $19,999 | 93 (1.5%) | 188 (3.7%) |
| $20,000 to $22,499 | 125 (2.1%) | 173 (3.4%) |
| $22,500 to $24,999 | 101 (1.7%) | 177 (3.5%) |
| $25,000 to $29,999 | 99 (1.6%) | 319 (6.2%) |
| $30,000 to $34,999 | 180 (3.0%) | 266 (5.2%) |
| $35,000 to $39,999 | 115 (1.9%) | 315 (6.2%) |
| $40,000 to $44,999 | 171 (2.8%) | 356 (7.0%) |
| $45,000 to $49,999 | 192 (3.2%) | 182 (3.6%) |
| $50,000 to $54,999 | 169 (2.8%) | 99 (1.9%) |
| $55,000 to $64,999 | 431 (7.1%) | 497 (9.7%) |
| $65,000 to $74,999 | 386 (6.4%) | 287 (5.6%) |
| $75,000 to $99,999 | 846 (13.9%) | 707 (13.8%) |
| $100,000+ | 2,138 (35.2%) | 444 (8.7%) |
| Total | 6,071 (100.0%) | 5,117 (100.0%) |
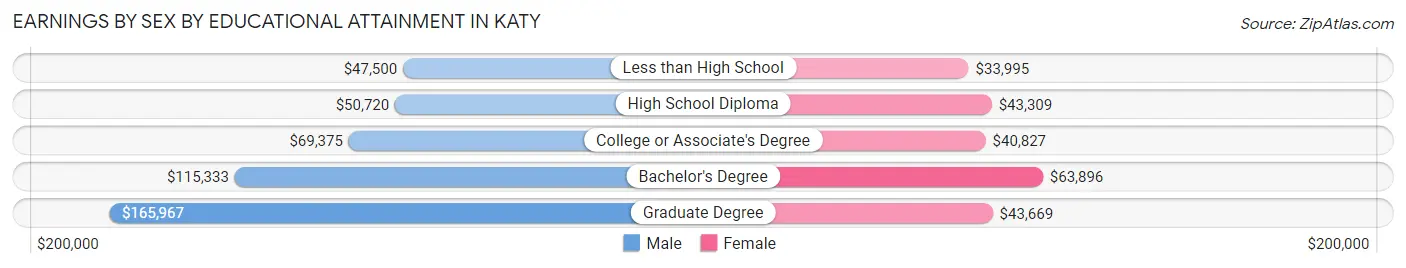
Earnings by Sex by Educational Attainment in Katy
Average earnings in Katy are $84,760 for men and $44,740 for women, a difference of 47.2%. Men with an educational attainment of graduate degree enjoy the highest average annual earnings of $165,967, while those with less than high school education earn the least with $47,500. Women with an educational attainment of bachelor's degree earn the most with the average annual earnings of $63,896, while those with less than high school education have the smallest earnings of $33,995.
| Educational Attainment | Male Income | Female Income |
| Less than High School | $47,500 | $33,995 |
| High School Diploma | $50,720 | $43,309 |
| College or Associate's Degree | $69,375 | $40,827 |
| Bachelor's Degree | $115,333 | $63,896 |
| Graduate Degree | $165,967 | $43,669 |
| Total | $84,760 | $44,740 |
Family Income in Katy
Family Income Brackets in Katy
According to the Katy family income data, there are 1,332 families falling into the $200,000+ income range, which is the most common income bracket and makes up 23.1% of all families.
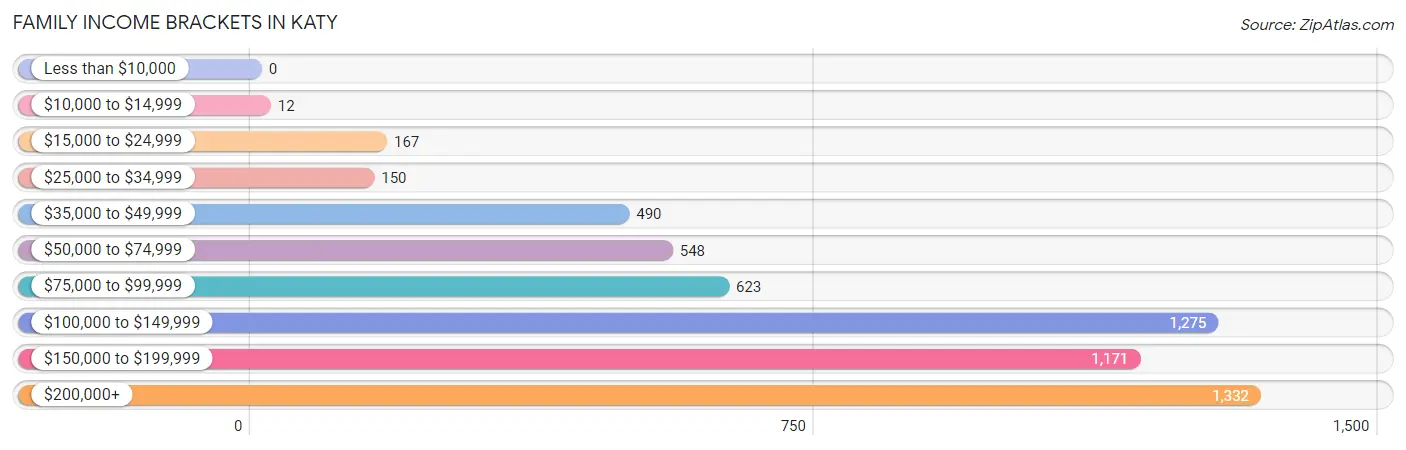
| Income Bracket | # Families | % Families |
| Less than $10,000 | 0 | 0.0% |
| $10,000 to $14,999 | 12 | 0.2% |
| $15,000 to $24,999 | 167 | 2.9% |
| $25,000 to $34,999 | 150 | 2.6% |
| $35,000 to $49,999 | 490 | 8.5% |
| $50,000 to $74,999 | 548 | 9.5% |
| $75,000 to $99,999 | 623 | 10.8% |
| $100,000 to $149,999 | 1,275 | 22.1% |
| $150,000 to $199,999 | 1,171 | 20.3% |
| $200,000+ | 1,332 | 23.1% |
Family Income by Famaliy Size in Katy
3-person families (1,294 | 22.4%) account for the highest median family income in Katy with $170,526 per family, while 2-person families (1,835 | 31.8%) have the highest median income of $58,496 per family member.
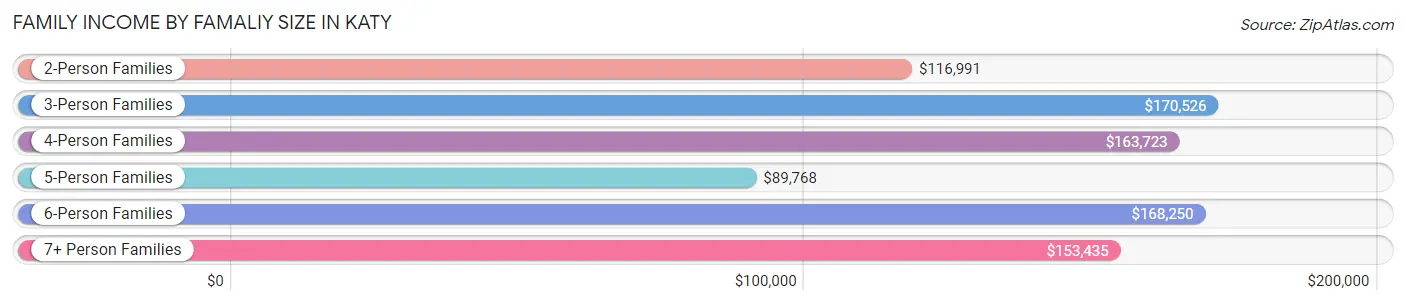
| Income Bracket | # Families | Median Income |
| 2-Person Families | 1,835 (31.8%) | $116,991 |
| 3-Person Families | 1,294 (22.4%) | $170,526 |
| 4-Person Families | 1,475 (25.6%) | $163,723 |
| 5-Person Families | 835 (14.5%) | $89,768 |
| 6-Person Families | 156 (2.7%) | $168,250 |
| 7+ Person Families | 173 (3.0%) | $153,435 |
| Total | 5,768 (100.0%) | $133,479 |
Family Income by Number of Earners in Katy
The median family income in Katy is $133,479, with families comprising 2 earners (2,160) having the highest median family income of $161,892, while families with no earners (715) have the lowest median family income of $67,768, accounting for 37.4% and 12.4% of families, respectively.
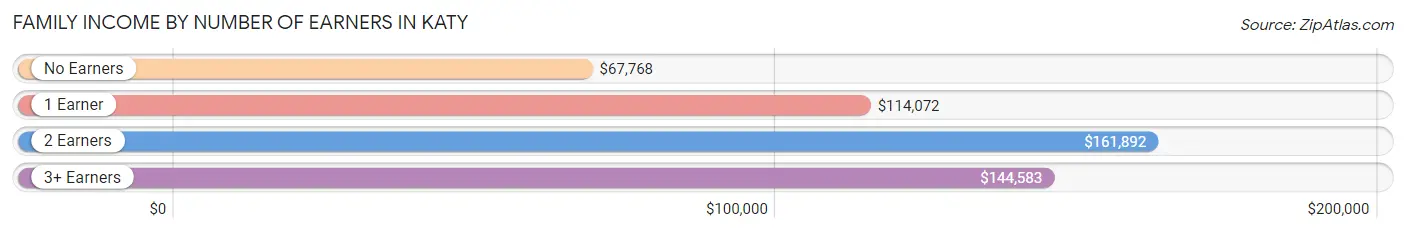
| Number of Earners | # Families | Median Income |
| No Earners | 715 (12.4%) | $67,768 |
| 1 Earner | 1,831 (31.7%) | $114,072 |
| 2 Earners | 2,160 (37.4%) | $161,892 |
| 3+ Earners | 1,062 (18.4%) | $144,583 |
| Total | 5,768 (100.0%) | $133,479 |
Household Income in Katy
Household Income Brackets in Katy
With 1,455 households falling in the category, the $100,000 to $149,999 income range is the most frequent in Katy, accounting for 20.8% of all households. In contrast, only 77 households (1.1%) fall into the less than $10,000 income bracket, making it the least populous group.
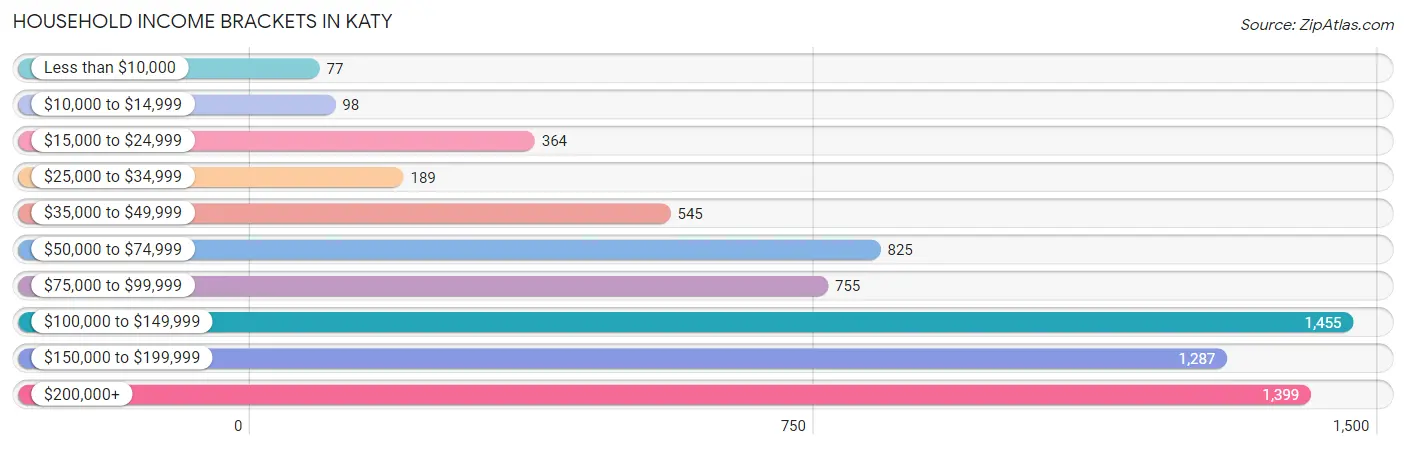
| Income Bracket | # Households | % Households |
| Less than $10,000 | 77 | 1.1% |
| $10,000 to $14,999 | 98 | 1.4% |
| $15,000 to $24,999 | 364 | 5.2% |
| $25,000 to $34,999 | 189 | 2.7% |
| $35,000 to $49,999 | 545 | 7.8% |
| $50,000 to $74,999 | 825 | 11.8% |
| $75,000 to $99,999 | 755 | 10.8% |
| $100,000 to $149,999 | 1,455 | 20.8% |
| $150,000 to $199,999 | 1,287 | 18.4% |
| $200,000+ | 1,399 | 20.0% |
Household Income by Householder Age in Katy
The median household income in Katy is $114,917, with the highest median household income of $154,118 found in the 25 to 44 years age bracket for the primary householder. A total of 2,360 households (33.8%) fall into this category. Meanwhile, the 15 to 24 years age bracket for the primary householder has the lowest median household income of $0, with 10 households (0.1%) in this group.
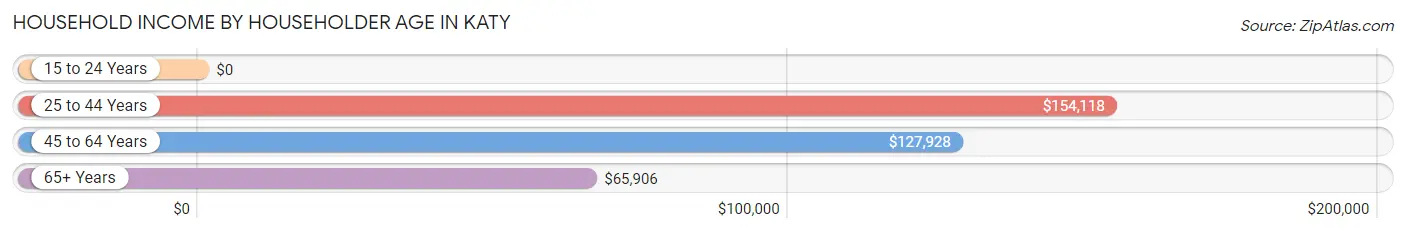
| Income Bracket | # Households | Median Income |
| 15 to 24 Years | 10 (0.1%) | $0 |
| 25 to 44 Years | 2,360 (33.8%) | $154,118 |
| 45 to 64 Years | 3,117 (44.6%) | $127,928 |
| 65+ Years | 1,506 (21.5%) | $65,906 |
| Total | 6,993 (100.0%) | $114,917 |
Poverty in Katy
Income Below Poverty by Sex and Age in Katy
With 2.3% poverty level for males and 4.7% for females among the residents of Katy, 45 to 54 year old males and 12 to 14 year old females are the most vulnerable to poverty, with 152 males (8.1%) and 196 females (31.9%) in their respective age groups living below the poverty level.
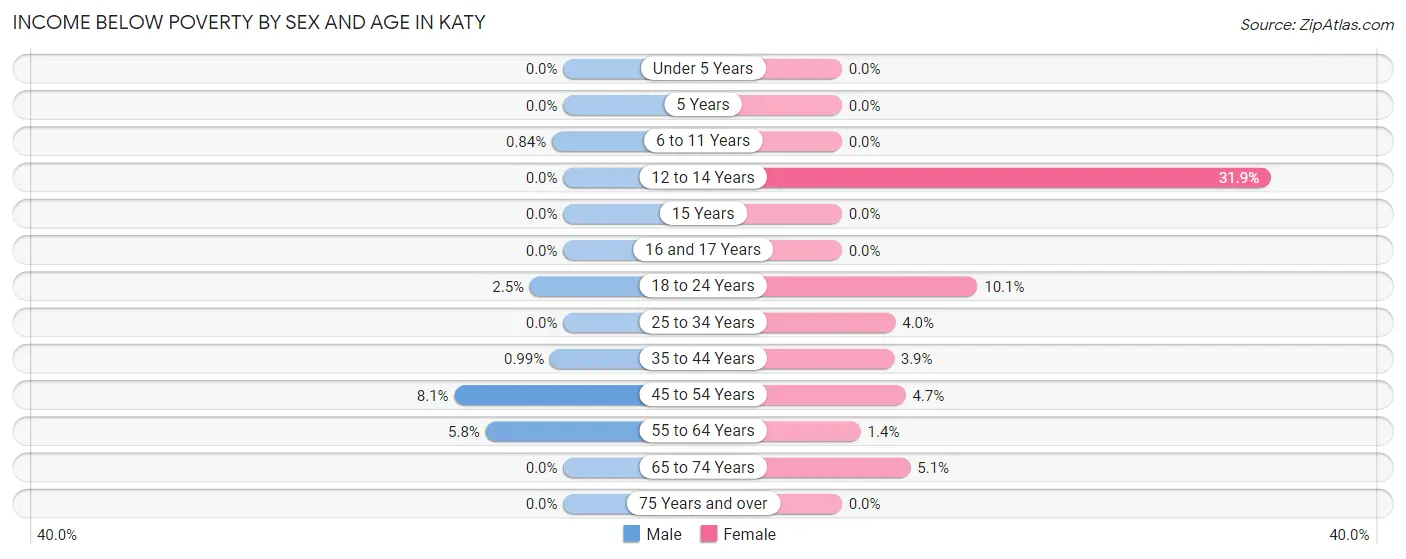
| Age Bracket | Male | Female |
| Under 5 Years | 0 (0.0%) | 0 (0.0%) |
| 5 Years | 0 (0.0%) | 0 (0.0%) |
| 6 to 11 Years | 14 (0.8%) | 0 (0.0%) |
| 12 to 14 Years | 0 (0.0%) | 196 (31.9%) |
| 15 Years | 0 (0.0%) | 0 (0.0%) |
| 16 and 17 Years | 0 (0.0%) | 0 (0.0%) |
| 18 to 24 Years | 22 (2.5%) | 72 (10.1%) |
| 25 to 34 Years | 0 (0.0%) | 51 (4.0%) |
| 35 to 44 Years | 15 (1.0%) | 59 (3.9%) |
| 45 to 54 Years | 152 (8.1%) | 87 (4.7%) |
| 55 to 64 Years | 59 (5.8%) | 18 (1.4%) |
| 65 to 74 Years | 0 (0.0%) | 43 (5.1%) |
| 75 Years and over | 0 (0.0%) | 0 (0.0%) |
| Total | 262 (2.3%) | 526 (4.7%) |
Income Above Poverty by Sex and Age in Katy
According to the poverty statistics in Katy, males aged under 5 years and females aged under 5 years are the age groups that are most secure financially, with 100.0% of males and 100.0% of females in these age groups living above the poverty line.
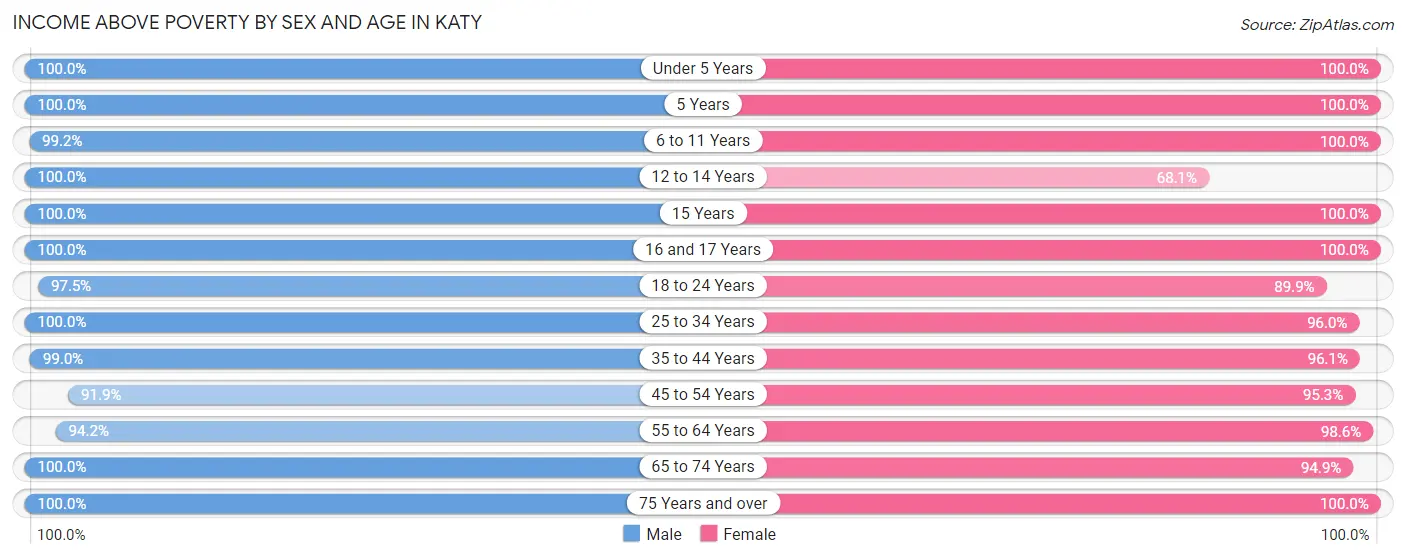
| Age Bracket | Male | Female |
| Under 5 Years | 825 (100.0%) | 823 (100.0%) |
| 5 Years | 212 (100.0%) | 158 (100.0%) |
| 6 to 11 Years | 1,646 (99.2%) | 840 (100.0%) |
| 12 to 14 Years | 453 (100.0%) | 419 (68.1%) |
| 15 Years | 109 (100.0%) | 275 (100.0%) |
| 16 and 17 Years | 316 (100.0%) | 577 (100.0%) |
| 18 to 24 Years | 866 (97.5%) | 644 (89.9%) |
| 25 to 34 Years | 1,332 (100.0%) | 1,235 (96.0%) |
| 35 to 44 Years | 1,499 (99.0%) | 1,471 (96.1%) |
| 45 to 54 Years | 1,726 (91.9%) | 1,753 (95.3%) |
| 55 to 64 Years | 963 (94.2%) | 1,269 (98.6%) |
| 65 to 74 Years | 602 (100.0%) | 801 (94.9%) |
| 75 Years and over | 544 (100.0%) | 433 (100.0%) |
| Total | 11,093 (97.7%) | 10,698 (95.3%) |
Income Below Poverty Among Married-Couple Families in Katy
The poverty statistics for married-couple families in Katy show that 2.2% or 109 of the total 4,849 families live below the poverty line. Families with 3 or 4 children have the highest poverty rate of 16.6%, comprising of 97 families. On the other hand, families with 1 or 2 children have the lowest poverty rate of 0.0%, which includes 0 families.
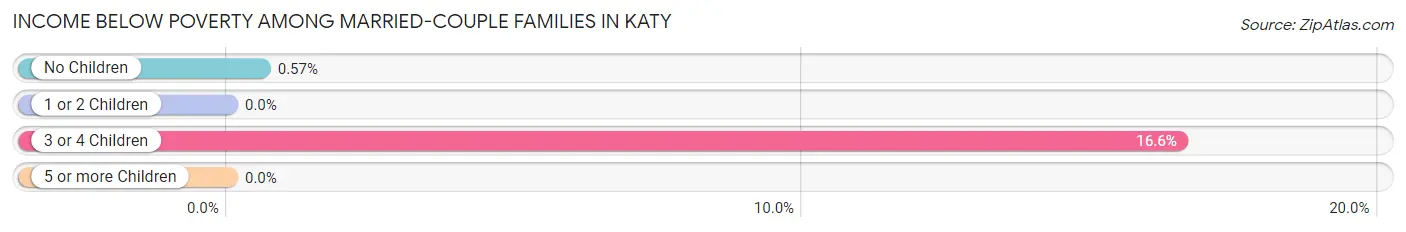
| Children | Above Poverty | Below Poverty |
| No Children | 2,096 (99.4%) | 12 (0.6%) |
| 1 or 2 Children | 2,009 (100.0%) | 0 (0.0%) |
| 3 or 4 Children | 489 (83.5%) | 97 (16.6%) |
| 5 or more Children | 146 (100.0%) | 0 (0.0%) |
| Total | 4,740 (97.8%) | 109 (2.2%) |
Income Below Poverty Among Single-Parent Households in Katy
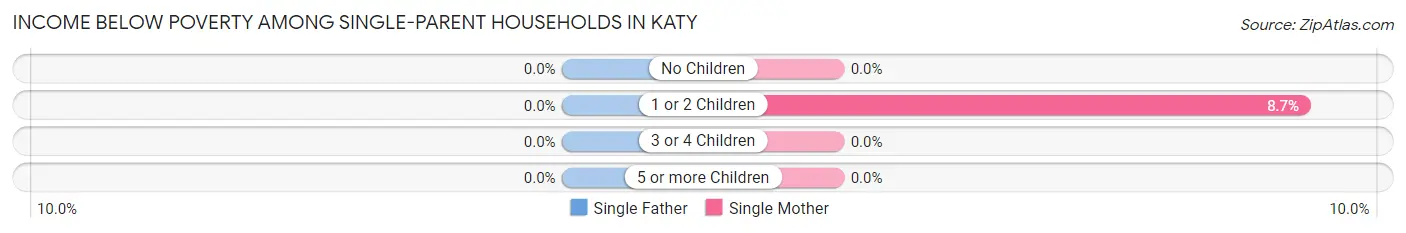
| Children | Single Father | Single Mother |
| No Children | 0 (0.0%) | 0 (0.0%) |
| 1 or 2 Children | 0 (0.0%) | 12 (8.7%) |
| 3 or 4 Children | 0 (0.0%) | 0 (0.0%) |
| 5 or more Children | 0 (0.0%) | 0 (0.0%) |
| Total | 0 (0.0%) | 12 (2.1%) |
Income Below Poverty Among Married-Couple vs Single-Parent Households in Katy
The poverty data for Katy shows that 109 of the married-couple family households (2.2%) and 12 of the single-parent households (1.3%) are living below the poverty level. Within the married-couple family households, those with 3 or 4 children have the highest poverty rate, with 97 households (16.6%) falling below the poverty line. Among the single-parent households, those with 1 or 2 children have the highest poverty rate, with 12 household (3.9%) living below poverty.
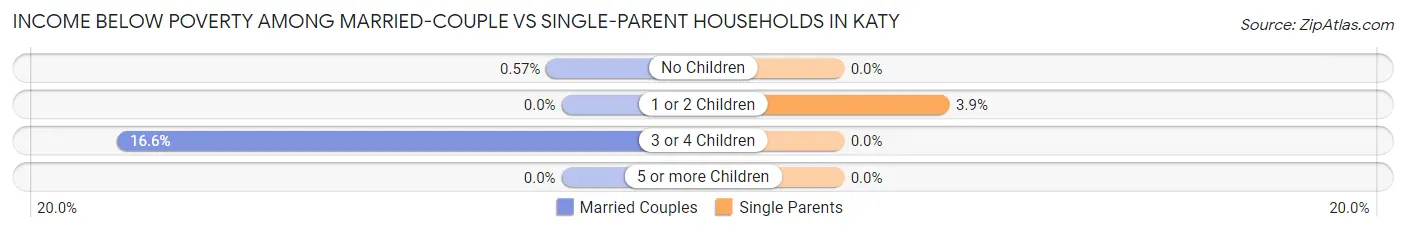
| Children | Married-Couple Families | Single-Parent Households |
| No Children | 12 (0.6%) | 0 (0.0%) |
| 1 or 2 Children | 0 (0.0%) | 12 (3.9%) |
| 3 or 4 Children | 97 (16.6%) | 0 (0.0%) |
| 5 or more Children | 0 (0.0%) | 0 (0.0%) |
| Total | 109 (2.2%) | 12 (1.3%) |
Race in Katy
The most populous races in Katy are White / Caucasian (13,094 | 57.4%), Hispanic or Latino (6,875 | 30.1%), and Black / African American (2,776 | 12.2%).
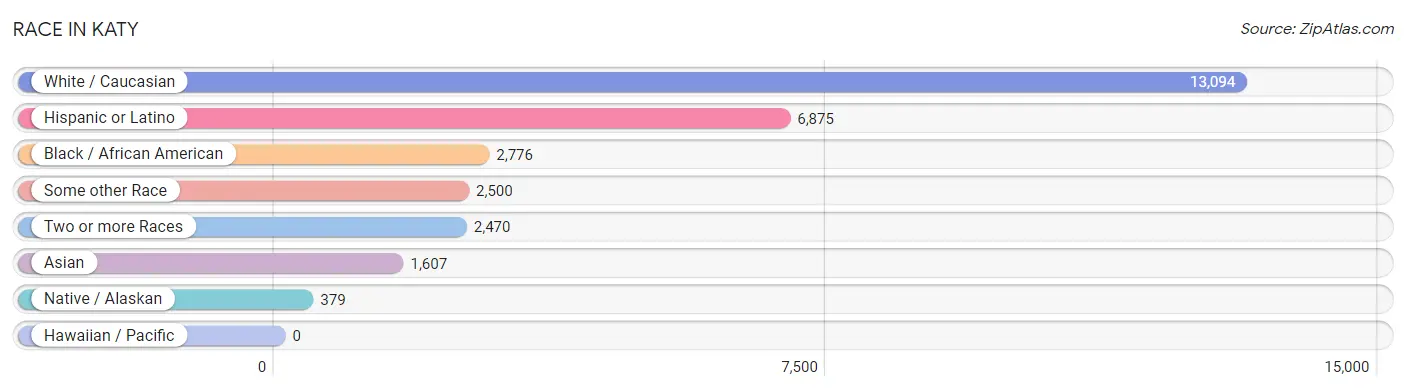
| Race | # Population | % Population |
| Asian | 1,607 | 7.0% |
| Black / African American | 2,776 | 12.2% |
| Hawaiian / Pacific | 0 | 0.0% |
| Hispanic or Latino | 6,875 | 30.1% |
| Native / Alaskan | 379 | 1.7% |
| White / Caucasian | 13,094 | 57.4% |
| Two or more Races | 2,470 | 10.8% |
| Some other Race | 2,500 | 11.0% |
| Total | 22,826 | 100.0% |
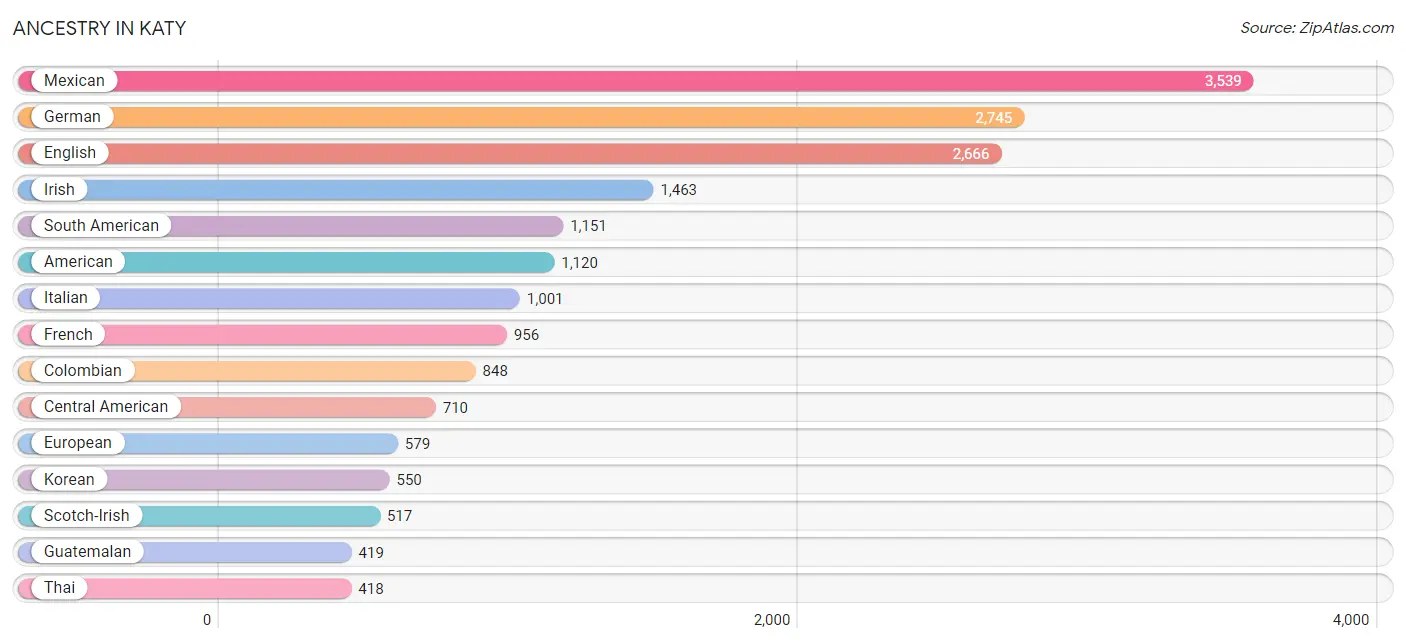
Ancestry in Katy
The most populous ancestries reported in Katy are Mexican (3,539 | 15.5%), German (2,745 | 12.0%), English (2,666 | 11.7%), Irish (1,463 | 6.4%), and South American (1,151 | 5.0%), together accounting for 50.7% of all Katy residents.
| Ancestry | # Population | % Population |
| African | 52 | 0.2% |
| American | 1,120 | 4.9% |
| Arab | 156 | 0.7% |
| Austrian | 17 | 0.1% |
| Belgian | 16 | 0.1% |
| Bhutanese | 77 | 0.3% |
| British | 144 | 0.6% |
| Burmese | 154 | 0.7% |
| Canadian | 32 | 0.1% |
| Central American | 710 | 3.1% |
| Central American Indian | 83 | 0.4% |
| Colombian | 848 | 3.7% |
| Cuban | 168 | 0.7% |
| Czech | 164 | 0.7% |
| Czechoslovakian | 16 | 0.1% |
| Danish | 208 | 0.9% |
| Dominican | 103 | 0.4% |
| Dutch | 266 | 1.2% |
| Eastern European | 18 | 0.1% |
| Egyptian | 75 | 0.3% |
| English | 2,666 | 11.7% |
| European | 579 | 2.5% |
| Filipino | 20 | 0.1% |
| French | 956 | 4.2% |
| French Canadian | 79 | 0.4% |
| German | 2,745 | 12.0% |
| Greek | 39 | 0.2% |
| Guatemalan | 419 | 1.8% |
| Honduran | 112 | 0.5% |
| Hungarian | 123 | 0.5% |
| Indian (Asian) | 69 | 0.3% |
| Irish | 1,463 | 6.4% |
| Iroquois | 1 | 0.0% |
| Italian | 1,001 | 4.4% |
| Korean | 550 | 2.4% |
| Laotian | 17 | 0.1% |
| Lebanese | 30 | 0.1% |
| Liberian | 91 | 0.4% |
| Lithuanian | 23 | 0.1% |
| Malaysian | 10 | 0.0% |
| Mexican | 3,539 | 15.5% |
| Mexican American Indian | 269 | 1.2% |
| Norwegian | 211 | 0.9% |
| Pakistani | 18 | 0.1% |
| Polish | 364 | 1.6% |
| Portuguese | 9 | 0.0% |
| Puerto Rican | 122 | 0.5% |
| Romanian | 13 | 0.1% |
| Russian | 27 | 0.1% |
| Salvadoran | 179 | 0.8% |
| Scandinavian | 62 | 0.3% |
| Scotch-Irish | 517 | 2.3% |
| Scottish | 271 | 1.2% |
| South American | 1,151 | 5.0% |
| Spaniard | 20 | 0.1% |
| Spanish | 11 | 0.1% |
| Sri Lankan | 342 | 1.5% |
| Subsaharan African | 367 | 1.6% |
| Sudanese | 224 | 1.0% |
| Swedish | 136 | 0.6% |
| Syrian | 23 | 0.1% |
| Thai | 418 | 1.8% |
| Turkish | 14 | 0.1% |
| Uruguayan | 104 | 0.5% |
| Venezuelan | 199 | 0.9% |
| Welsh | 24 | 0.1% | View All 66 Rows |
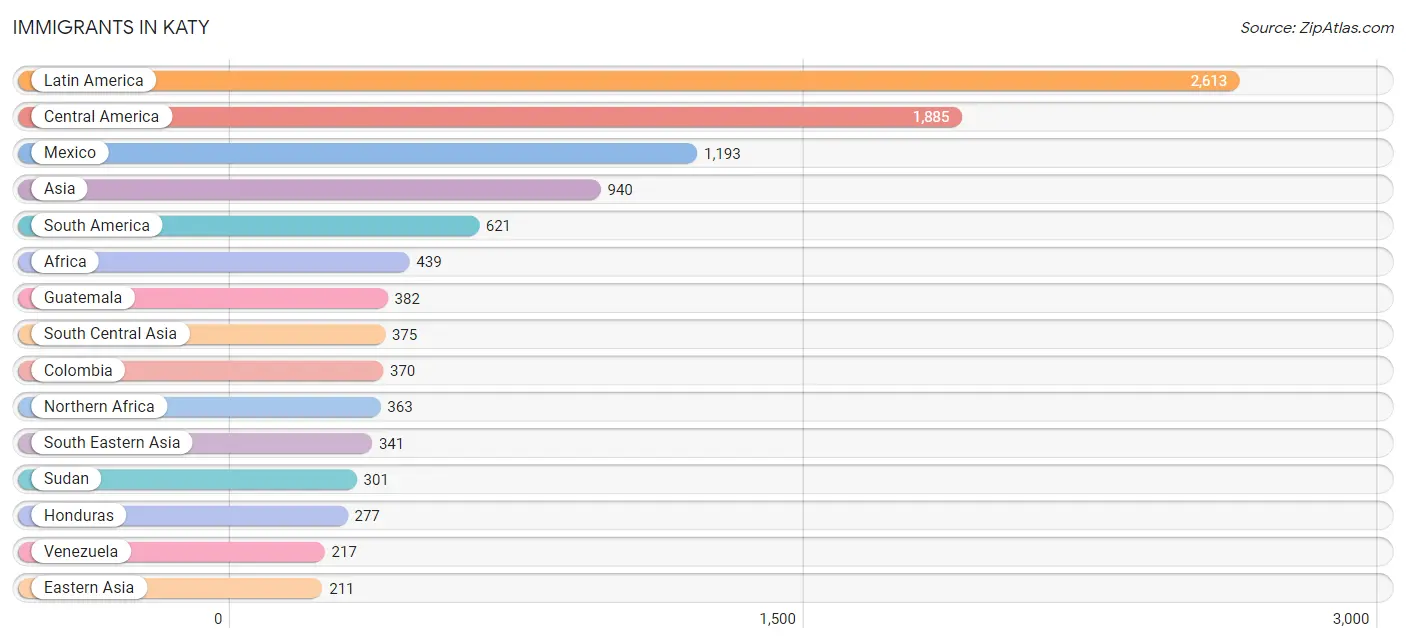
Immigrants in Katy
The most numerous immigrant groups reported in Katy came from Latin America (2,613 | 11.5%), Central America (1,885 | 8.3%), Mexico (1,193 | 5.2%), Asia (940 | 4.1%), and South America (621 | 2.7%), together accounting for 31.8% of all Katy residents.
| Immigration Origin | # Population | % Population |
| Africa | 439 | 1.9% |
| Asia | 940 | 4.1% |
| Cambodia | 6 | 0.0% |
| Canada | 46 | 0.2% |
| Caribbean | 107 | 0.5% |
| Central America | 1,885 | 8.3% |
| China | 192 | 0.8% |
| Colombia | 370 | 1.6% |
| Cuba | 107 | 0.5% |
| Eastern Asia | 211 | 0.9% |
| Egypt | 62 | 0.3% |
| El Salvador | 33 | 0.1% |
| Europe | 97 | 0.4% |
| Guatemala | 382 | 1.7% |
| Honduras | 277 | 1.2% |
| India | 161 | 0.7% |
| Indonesia | 34 | 0.2% |
| Korea | 19 | 0.1% |
| Laos | 10 | 0.0% |
| Latin America | 2,613 | 11.5% |
| Liberia | 44 | 0.2% |
| Mexico | 1,193 | 5.2% |
| Middle Africa | 32 | 0.1% |
| Nepal | 5 | 0.0% |
| Netherlands | 36 | 0.2% |
| Northern Africa | 363 | 1.6% |
| Northern Europe | 61 | 0.3% |
| Pakistan | 209 | 0.9% |
| Philippines | 152 | 0.7% |
| Saudi Arabia | 13 | 0.1% |
| South America | 621 | 2.7% |
| South Central Asia | 375 | 1.6% |
| South Eastern Asia | 341 | 1.5% |
| Sudan | 301 | 1.3% |
| Taiwan | 85 | 0.4% |
| Thailand | 18 | 0.1% |
| Uruguay | 34 | 0.2% |
| Venezuela | 217 | 0.9% |
| Vietnam | 121 | 0.5% |
| Western Africa | 44 | 0.2% |
| Western Asia | 13 | 0.1% |
| Western Europe | 36 | 0.2% | View All 42 Rows |
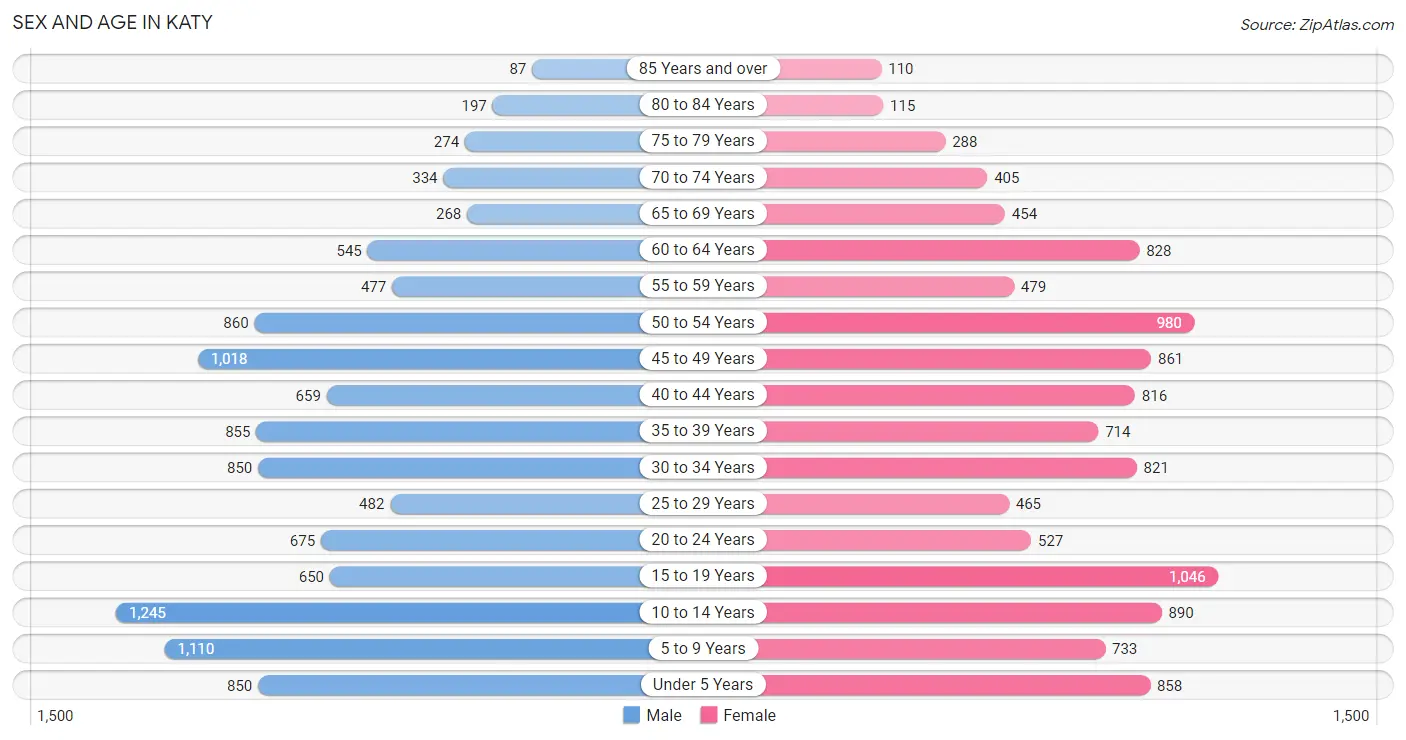
Sex and Age in Katy
Sex and Age in Katy
The most populous age groups in Katy are 10 to 14 Years (1,245 | 10.9%) for men and 15 to 19 Years (1,046 | 9.2%) for women.
| Age Bracket | Male | Female |
| Under 5 Years | 850 (7.4%) | 858 (7.5%) |
| 5 to 9 Years | 1,110 (9.7%) | 733 (6.4%) |
| 10 to 14 Years | 1,245 (10.9%) | 890 (7.8%) |
| 15 to 19 Years | 650 (5.7%) | 1,046 (9.2%) |
| 20 to 24 Years | 675 (5.9%) | 527 (4.6%) |
| 25 to 29 Years | 482 (4.2%) | 465 (4.1%) |
| 30 to 34 Years | 850 (7.4%) | 821 (7.2%) |
| 35 to 39 Years | 855 (7.5%) | 714 (6.3%) |
| 40 to 44 Years | 659 (5.8%) | 816 (7.2%) |
| 45 to 49 Years | 1,018 (8.9%) | 861 (7.6%) |
| 50 to 54 Years | 860 (7.5%) | 980 (8.6%) |
| 55 to 59 Years | 477 (4.2%) | 479 (4.2%) |
| 60 to 64 Years | 545 (4.8%) | 828 (7.3%) |
| 65 to 69 Years | 268 (2.3%) | 454 (4.0%) |
| 70 to 74 Years | 334 (2.9%) | 405 (3.6%) |
| 75 to 79 Years | 274 (2.4%) | 288 (2.5%) |
| 80 to 84 Years | 197 (1.7%) | 115 (1.0%) |
| 85 Years and over | 87 (0.8%) | 110 (1.0%) |
| Total | 11,436 (100.0%) | 11,390 (100.0%) |
Families and Households in Katy
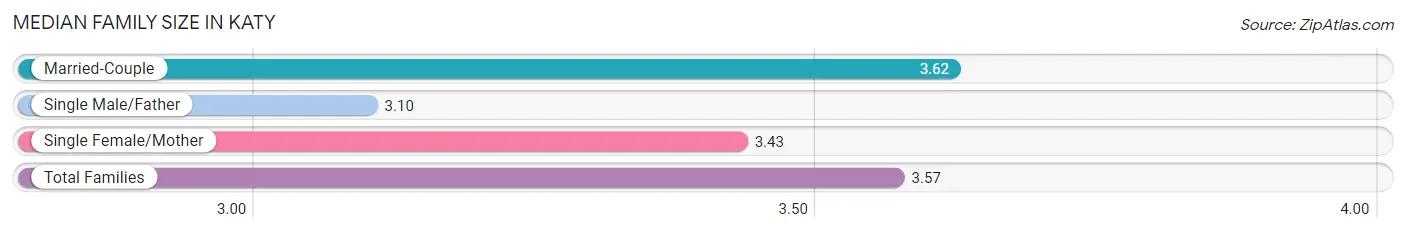
Median Family Size in Katy
The median family size in Katy is 3.57 persons per family, with married-couple families (4,849 | 84.1%) accounting for the largest median family size of 3.62 persons per family. On the other hand, single male/father families (354 | 6.1%) represent the smallest median family size with 3.10 persons per family.
| Family Type | # Families | Family Size |
| Married-Couple | 4,849 (84.1%) | 3.62 |
| Single Male/Father | 354 (6.1%) | 3.10 |
| Single Female/Mother | 565 (9.8%) | 3.43 |
| Total Families | 5,768 (100.0%) | 3.57 |
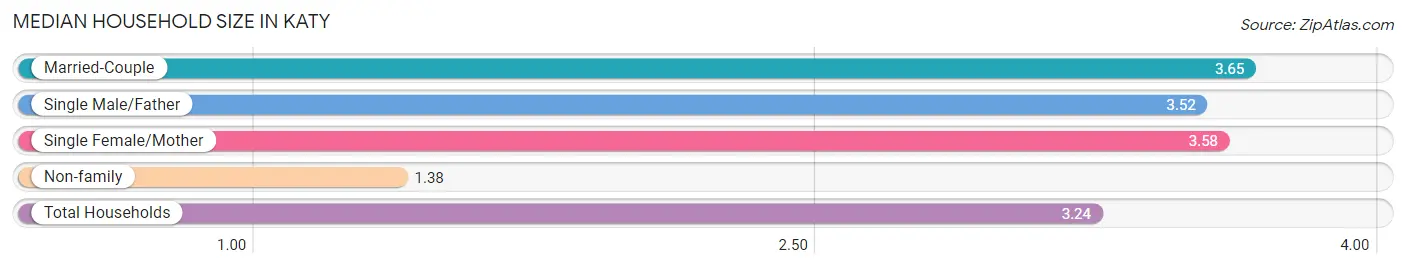
Median Household Size in Katy
The median household size in Katy is 3.24 persons per household, with married-couple households (4,849 | 69.3%) accounting for the largest median household size of 3.65 persons per household. non-family households (1,225 | 17.5%) represent the smallest median household size with 1.38 persons per household.
| Household Type | # Households | Household Size |
| Married-Couple | 4,849 (69.3%) | 3.65 |
| Single Male/Father | 354 (5.1%) | 3.52 |
| Single Female/Mother | 565 (8.1%) | 3.58 |
| Non-family | 1,225 (17.5%) | 1.38 |
| Total Households | 6,993 (100.0%) | 3.24 |
Household Size by Marriage Status in Katy
Out of a total of 6,993 households in Katy, 5,768 (82.5%) are family households, while 1,225 (17.5%) are nonfamily households. The most numerous type of family households are 2-person households, comprising 1,796, and the most common type of nonfamily households are 1-person households, comprising 934.
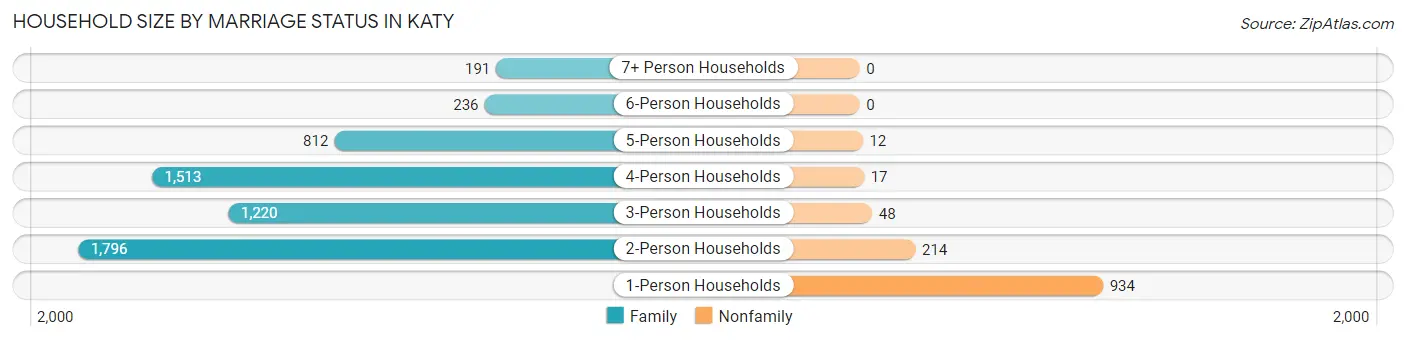
| Household Size | Family Households | Nonfamily Households |
| 1-Person Households | - | 934 (13.4%) |
| 2-Person Households | 1,796 (25.7%) | 214 (3.1%) |
| 3-Person Households | 1,220 (17.4%) | 48 (0.7%) |
| 4-Person Households | 1,513 (21.6%) | 17 (0.2%) |
| 5-Person Households | 812 (11.6%) | 12 (0.2%) |
| 6-Person Households | 236 (3.4%) | 0 (0.0%) |
| 7+ Person Households | 191 (2.7%) | 0 (0.0%) |
| Total | 5,768 (82.5%) | 1,225 (17.5%) |
Female Fertility in Katy
Fertility by Age in Katy
Average fertility rate in Katy is 67.0 births per 1,000 women. Women in the age bracket of 20 to 34 years have the highest fertility rate with 110.0 births per 1,000 women. Women in the age bracket of 20 to 34 years acount for 54.8% of all women with births.
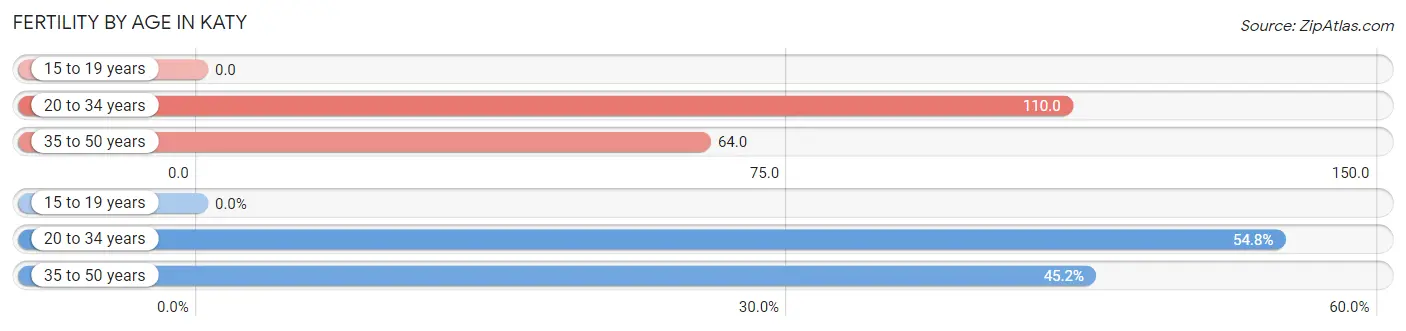
| Age Bracket | Women with Births | Births / 1,000 Women |
| 15 to 19 years | 0 (0.0%) | 0.0 |
| 20 to 34 years | 199 (54.8%) | 110.0 |
| 35 to 50 years | 164 (45.2%) | 64.0 |
| Total | 363 (100.0%) | 67.0 |
Fertility by Age by Marriage Status in Katy
98.6% of women with births (363) in Katy are married. The highest percentage of unmarried women with births falls into 20 to 34 years age bracket with 2.5% of them unmarried at the time of birth, while the lowest percentage of unmarried women with births belong to 35 to 50 years age bracket with 0.0% of them unmarried.
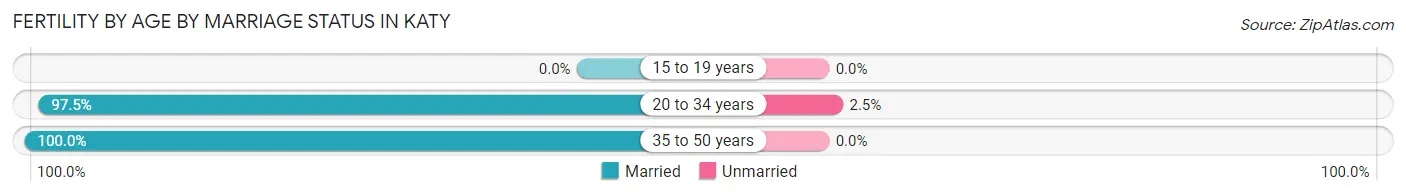
| Age Bracket | Married | Unmarried |
| 15 to 19 years | 0 (0.0%) | 0 (0.0%) |
| 20 to 34 years | 194 (97.5%) | 5 (2.5%) |
| 35 to 50 years | 164 (100.0%) | 0 (0.0%) |
| Total | 358 (98.6%) | 5 (1.4%) |
Fertility by Education in Katy
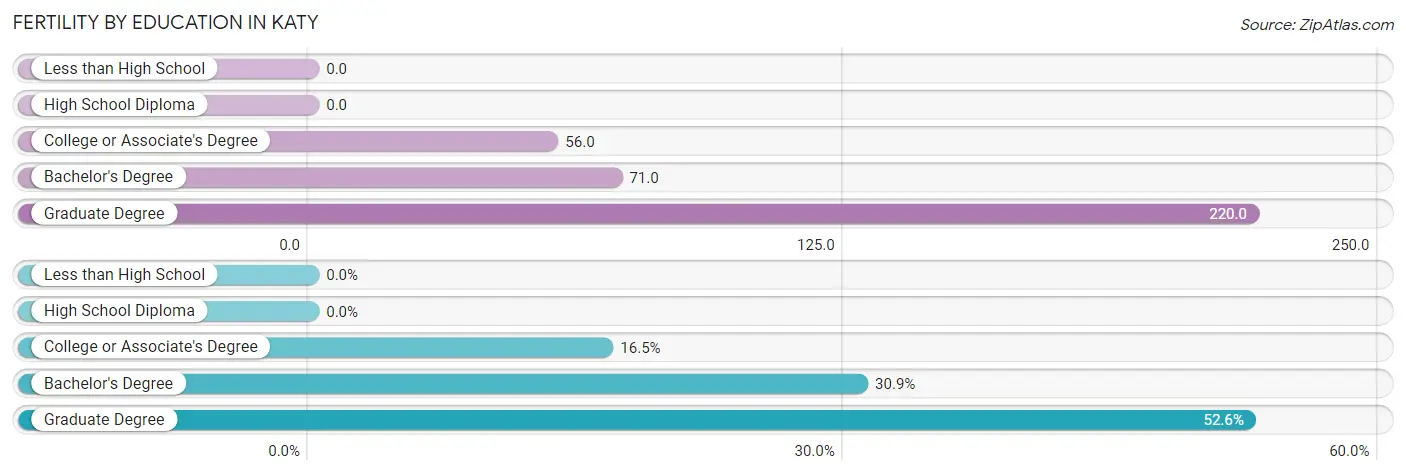
| Educational Attainment | Women with Births | Births / 1,000 Women |
| Less than High School | 0 (0.0%) | 0.0 |
| High School Diploma | 0 (0.0%) | 0.0 |
| College or Associate's Degree | 60 (16.5%) | 56.0 |
| Bachelor's Degree | 112 (30.8%) | 71.0 |
| Graduate Degree | 191 (52.6%) | 220.0 |
| Total | 363 (100.0%) | 67.0 |
Fertility by Education by Marriage Status in Katy
1.4% of women with births in Katy are unmarried. Women with the educational attainment of college or associate's degree are most likely to be married with 100.0% of them married at childbirth, while women with the educational attainment of bachelor's degree are least likely to be married with 4.5% of them unmarried at childbirth.
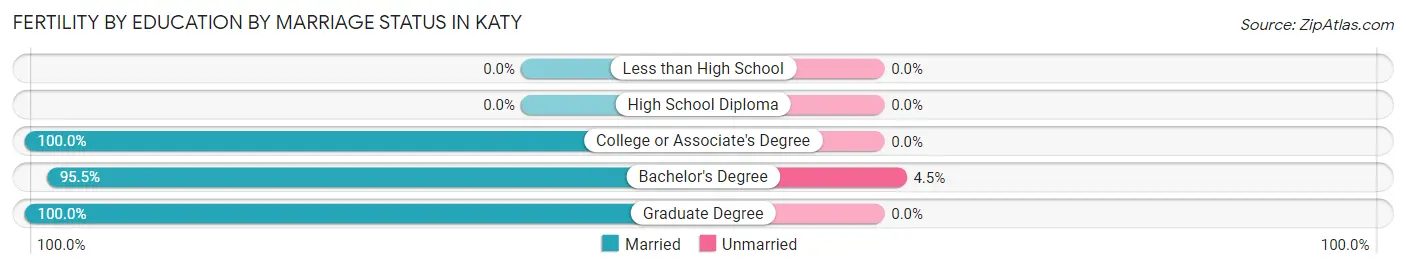
| Educational Attainment | Married | Unmarried |
| Less than High School | 0 (0.0%) | 0 (0.0%) |
| High School Diploma | 0 (0.0%) | 0 (0.0%) |
| College or Associate's Degree | 60 (100.0%) | 0 (0.0%) |
| Bachelor's Degree | 107 (95.5%) | 5 (4.5%) |
| Graduate Degree | 191 (100.0%) | 0 (0.0%) |
| Total | 358 (98.6%) | 5 (1.4%) |
Employment Characteristics in Katy
Employment by Class of Employer in Katy
Among the 10,124 employed individuals in Katy, private company employees (7,010 | 69.2%), local government employees (1,044 | 10.3%), and self-employed (not incorporated) (982 | 9.7%) make up the most common classes of employment.
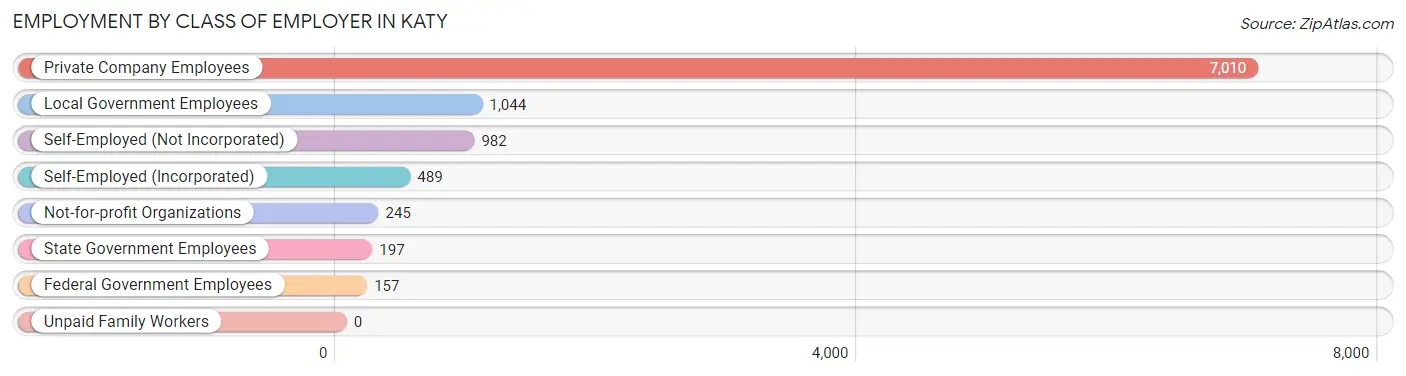
| Employer Class | # Employees | % Employees |
| Private Company Employees | 7,010 | 69.2% |
| Self-Employed (Incorporated) | 489 | 4.8% |
| Self-Employed (Not Incorporated) | 982 | 9.7% |
| Not-for-profit Organizations | 245 | 2.4% |
| Local Government Employees | 1,044 | 10.3% |
| State Government Employees | 197 | 1.9% |
| Federal Government Employees | 157 | 1.5% |
| Unpaid Family Workers | 0 | 0.0% |
| Total | 10,124 | 100.0% |
Employment Status by Age in Katy
According to the labor force statistics for Katy, out of the total population over 16 years of age (16,750), 66.1% or 11,072 individuals are in the labor force, with 6.5% or 720 of them unemployed. The age group with the highest labor force participation rate is 35 to 44 years, with 84.5% or 2,572 individuals in the labor force. Within the labor force, the 20 to 24 years age range has the highest percentage of unemployed individuals, with 29.1% or 272 of them being unemployed.
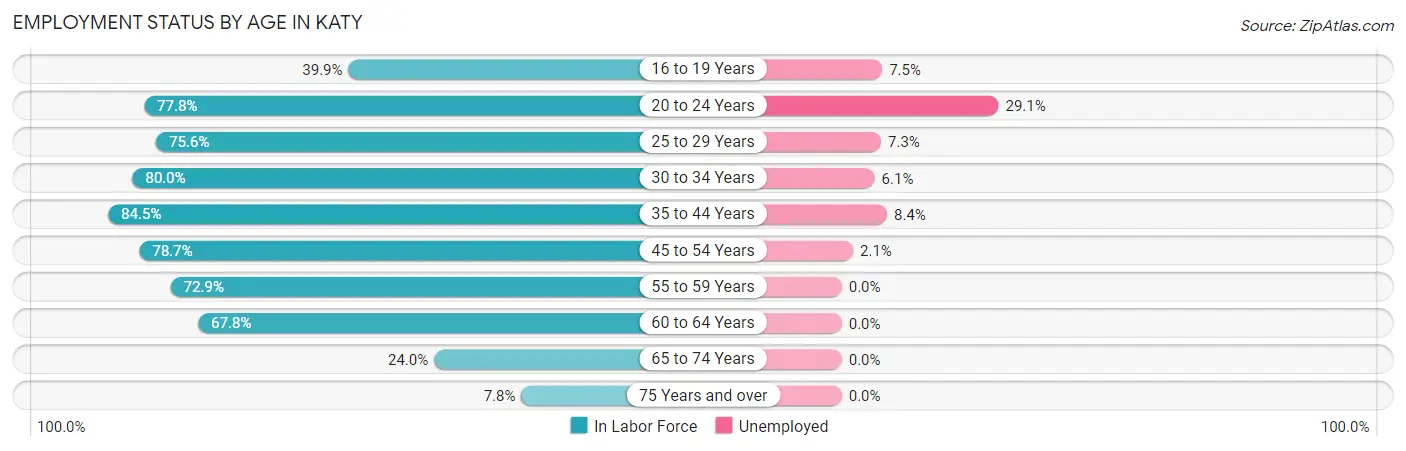
| Age Bracket | In Labor Force | Unemployed |
| 16 to 19 Years | 521 (39.9%) | 39 (7.5%) |
| 20 to 24 Years | 935 (77.8%) | 272 (29.1%) |
| 25 to 29 Years | 716 (75.6%) | 52 (7.3%) |
| 30 to 34 Years | 1,337 (80.0%) | 82 (6.1%) |
| 35 to 44 Years | 2,572 (84.5%) | 216 (8.4%) |
| 45 to 54 Years | 2,927 (78.7%) | 61 (2.1%) |
| 55 to 59 Years | 697 (72.9%) | 0 (0.0%) |
| 60 to 64 Years | 931 (67.8%) | 0 (0.0%) |
| 65 to 74 Years | 351 (24.0%) | 0 (0.0%) |
| 75 Years and over | 84 (7.8%) | 0 (0.0%) |
| Total | 11,072 (66.1%) | 720 (6.5%) |
Employment Status by Educational Attainment in Katy
According to labor force statistics for Katy, 78.4% of individuals (9,181) out of the total population between 25 and 64 years of age (11,710) are in the labor force, with 4.5% or 413 of them being unemployed. The group with the highest labor force participation rate are those with the educational attainment of bachelor's degree or higher, with 81.6% or 4,729 individuals in the labor force. Within the labor force, individuals with college / associate degree education have the highest percentage of unemployment, with 8.2% or 214 of them being unemployed.
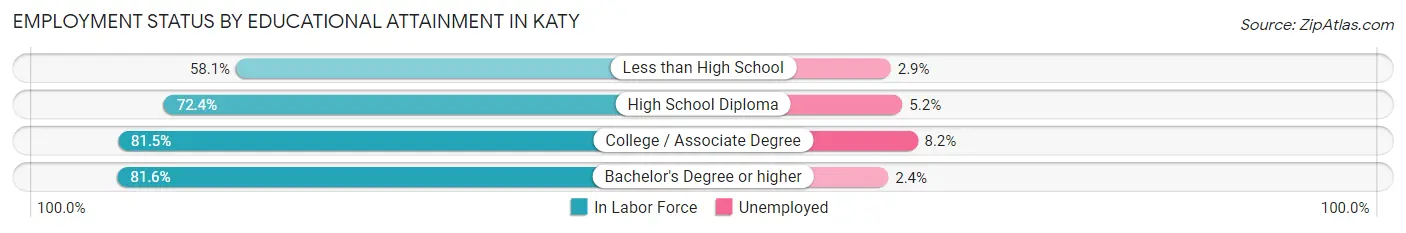
| Educational Attainment | In Labor Force | Unemployed |
| Less than High School | 509 (58.1%) | 25 (2.9%) |
| High School Diploma | 1,326 (72.4%) | 95 (5.2%) |
| College / Associate Degree | 2,615 (81.5%) | 263 (8.2%) |
| Bachelor's Degree or higher | 4,729 (81.6%) | 139 (2.4%) |
| Total | 9,181 (78.4%) | 527 (4.5%) |
Employment Occupations by Sex in Katy
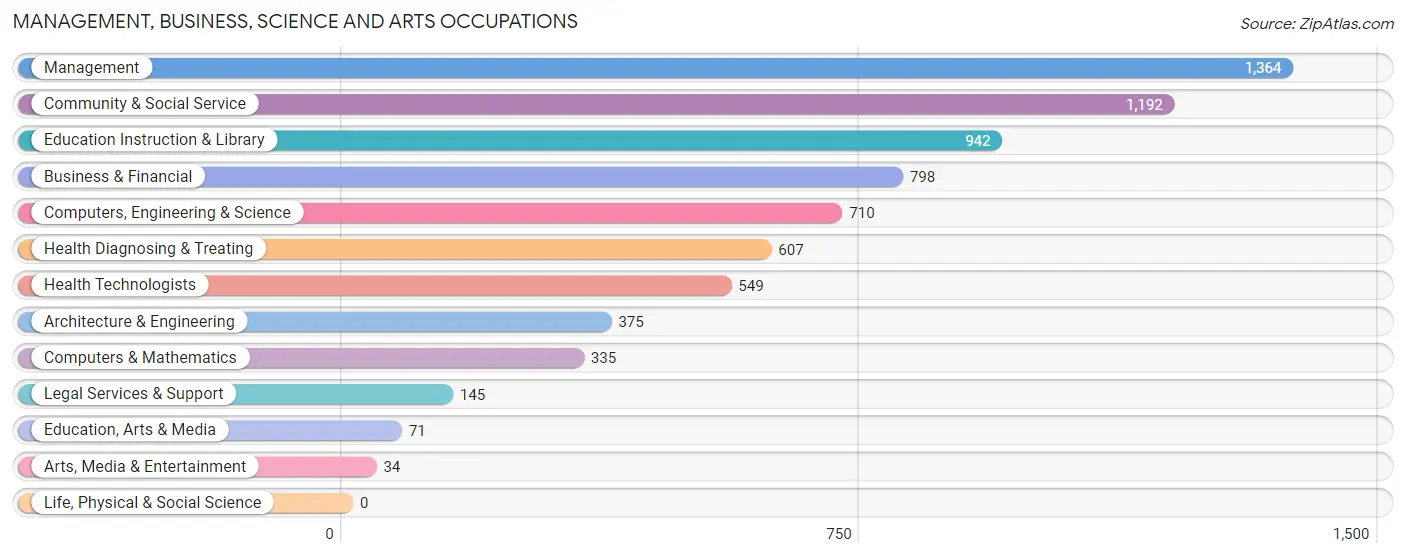
Management, Business, Science and Arts Occupations
The most common Management, Business, Science and Arts occupations in Katy are Management (1,364 | 13.2%), Community & Social Service (1,192 | 11.5%), Education Instruction & Library (942 | 9.1%), Business & Financial (798 | 7.7%), and Computers, Engineering & Science (710 | 6.9%).
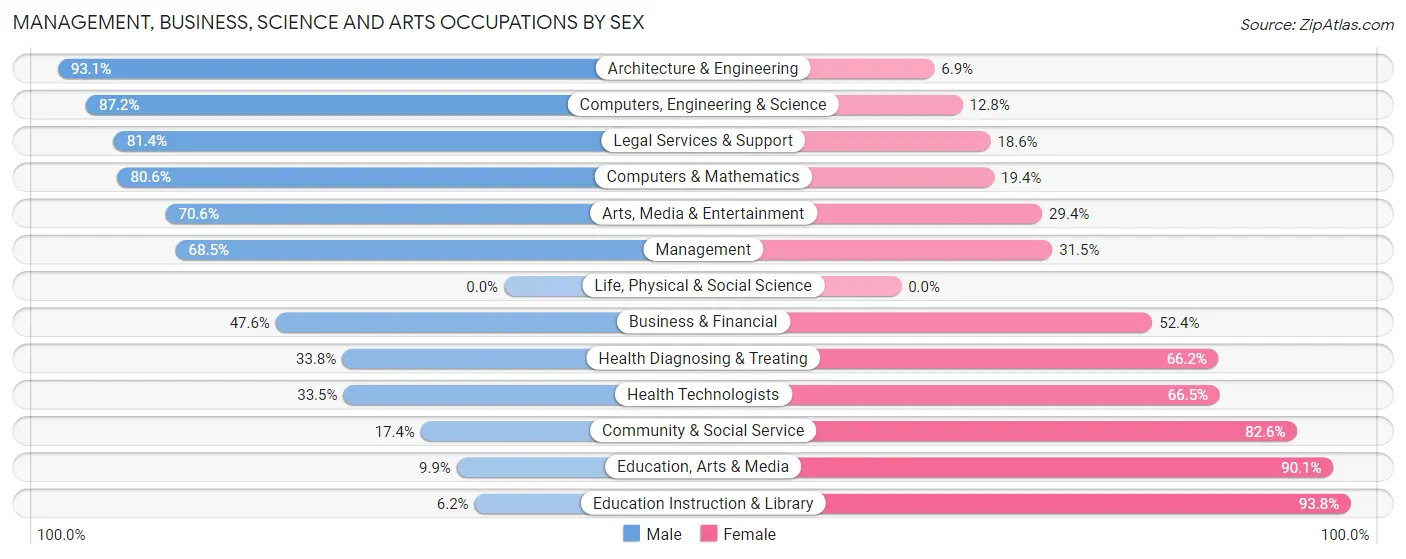
Management, Business, Science and Arts Occupations by Sex
Within the Management, Business, Science and Arts occupations in Katy, the most male-oriented occupations are Architecture & Engineering (93.1%), Computers, Engineering & Science (87.2%), and Legal Services & Support (81.4%), while the most female-oriented occupations are Education Instruction & Library (93.8%), Education, Arts & Media (90.1%), and Community & Social Service (82.6%).
| Occupation | Male | Female |
| Management | 934 (68.5%) | 430 (31.5%) |
| Business & Financial | 380 (47.6%) | 418 (52.4%) |
| Computers, Engineering & Science | 619 (87.2%) | 91 (12.8%) |
| Computers & Mathematics | 270 (80.6%) | 65 (19.4%) |
| Architecture & Engineering | 349 (93.1%) | 26 (6.9%) |
| Life, Physical & Social Science | 0 (0.0%) | 0 (0.0%) |
| Community & Social Service | 207 (17.4%) | 985 (82.6%) |
| Education, Arts & Media | 7 (9.9%) | 64 (90.1%) |
| Legal Services & Support | 118 (81.4%) | 27 (18.6%) |
| Education Instruction & Library | 58 (6.2%) | 884 (93.8%) |
| Arts, Media & Entertainment | 24 (70.6%) | 10 (29.4%) |
| Health Diagnosing & Treating | 205 (33.8%) | 402 (66.2%) |
| Health Technologists | 184 (33.5%) | 365 (66.5%) |
| Total (Category) | 2,345 (50.2%) | 2,326 (49.8%) |
| Total (Overall) | 5,572 (53.8%) | 4,775 (46.2%) |
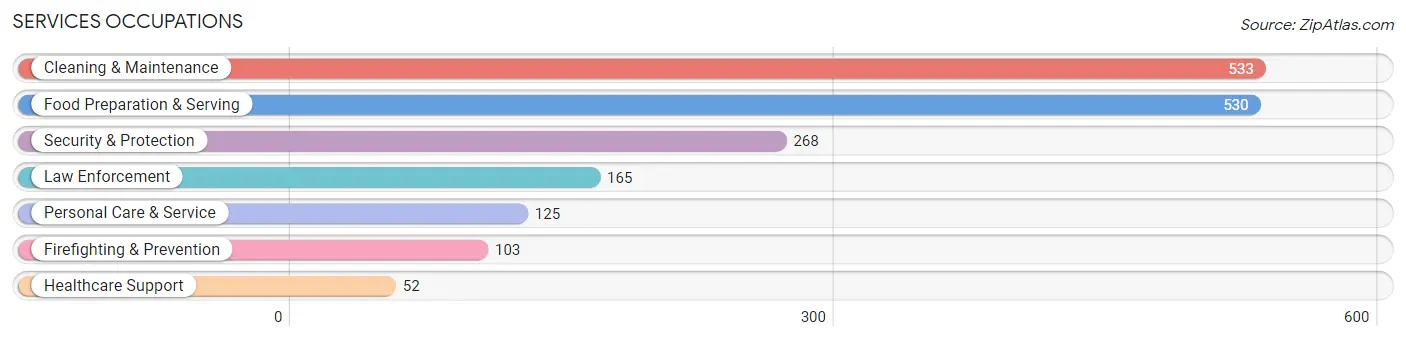
Services Occupations
The most common Services occupations in Katy are Cleaning & Maintenance (533 | 5.1%), Food Preparation & Serving (530 | 5.1%), Security & Protection (268 | 2.6%), Law Enforcement (165 | 1.6%), and Personal Care & Service (125 | 1.2%).
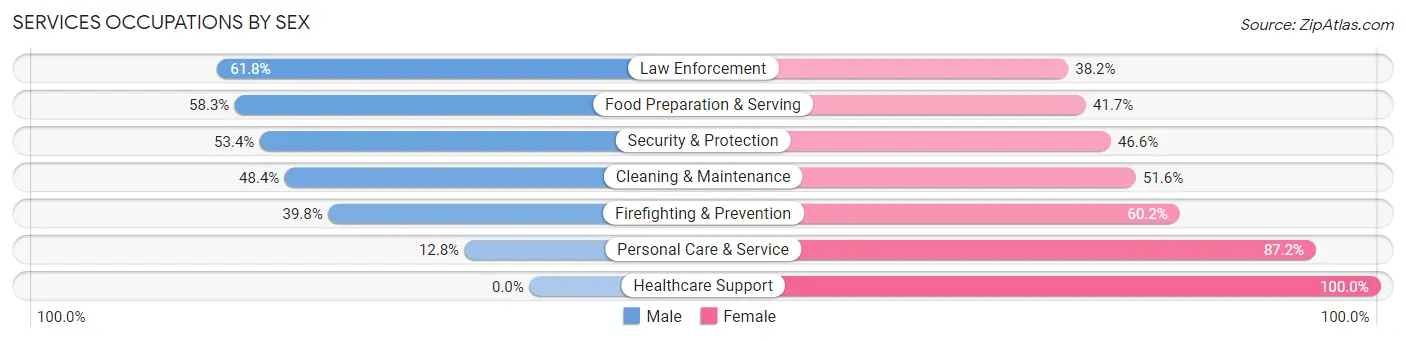
Services Occupations by Sex
Within the Services occupations in Katy, the most male-oriented occupations are Law Enforcement (61.8%), Food Preparation & Serving (58.3%), and Security & Protection (53.4%), while the most female-oriented occupations are Healthcare Support (100.0%), Personal Care & Service (87.2%), and Firefighting & Prevention (60.2%).
| Occupation | Male | Female |
| Healthcare Support | 0 (0.0%) | 52 (100.0%) |
| Security & Protection | 143 (53.4%) | 125 (46.6%) |
| Firefighting & Prevention | 41 (39.8%) | 62 (60.2%) |
| Law Enforcement | 102 (61.8%) | 63 (38.2%) |
| Food Preparation & Serving | 309 (58.3%) | 221 (41.7%) |
| Cleaning & Maintenance | 258 (48.4%) | 275 (51.6%) |
| Personal Care & Service | 16 (12.8%) | 109 (87.2%) |
| Total (Category) | 726 (48.1%) | 782 (51.9%) |
| Total (Overall) | 5,572 (53.8%) | 4,775 (46.2%) |
Sales and Office Occupations
The most common Sales and Office occupations in Katy are Sales & Related (1,074 | 10.4%), and Office & Administration (1,035 | 10.0%).
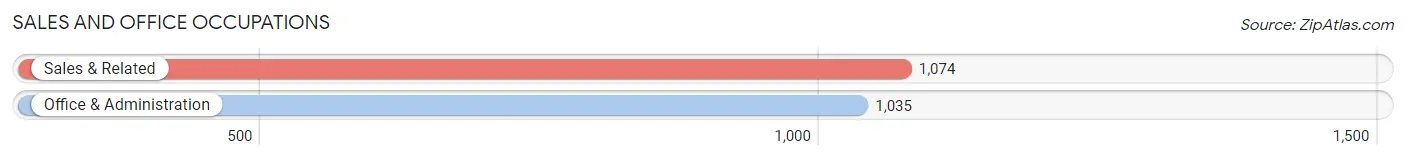
Sales and Office Occupations by Sex
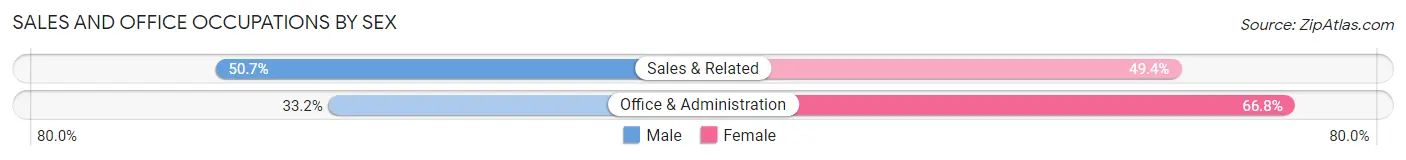
| Occupation | Male | Female |
| Sales & Related | 544 (50.6%) | 530 (49.3%) |
| Office & Administration | 344 (33.2%) | 691 (66.8%) |
| Total (Category) | 888 (42.1%) | 1,221 (57.9%) |
| Total (Overall) | 5,572 (53.8%) | 4,775 (46.2%) |
Natural Resources, Construction and Maintenance Occupations
The most common Natural Resources, Construction and Maintenance occupations in Katy are Construction & Extraction (593 | 5.7%), Installation, Maintenance & Repair (399 | 3.9%), and Farming, Fishing & Forestry (68 | 0.7%).
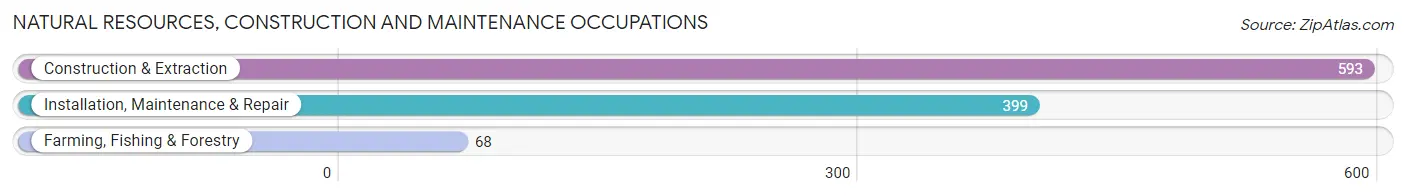
Natural Resources, Construction and Maintenance Occupations by Sex
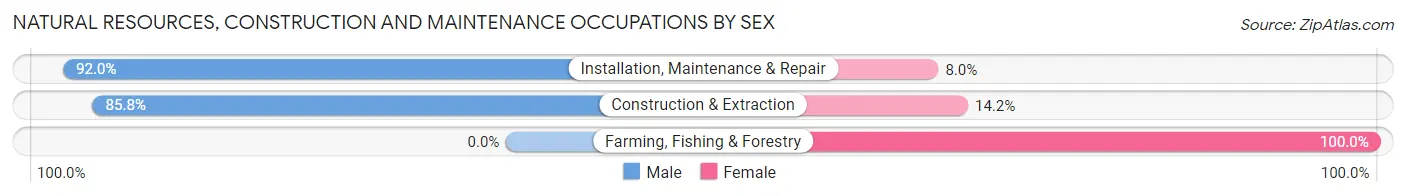
| Occupation | Male | Female |
| Farming, Fishing & Forestry | 0 (0.0%) | 68 (100.0%) |
| Construction & Extraction | 509 (85.8%) | 84 (14.2%) |
| Installation, Maintenance & Repair | 367 (92.0%) | 32 (8.0%) |
| Total (Category) | 876 (82.6%) | 184 (17.4%) |
| Total (Overall) | 5,572 (53.8%) | 4,775 (46.2%) |
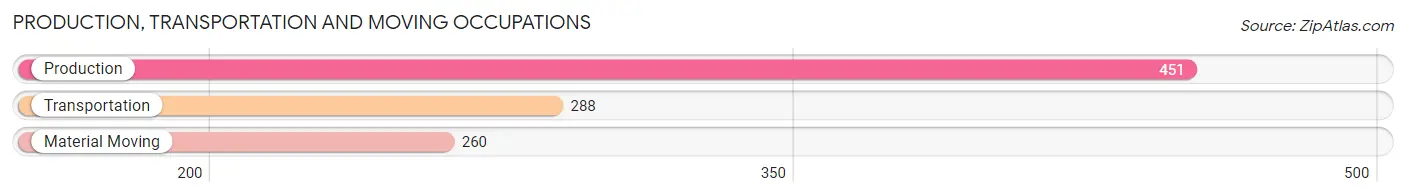
Production, Transportation and Moving Occupations
The most common Production, Transportation and Moving occupations in Katy are Production (451 | 4.4%), Transportation (288 | 2.8%), and Material Moving (260 | 2.5%).
Production, Transportation and Moving Occupations by Sex
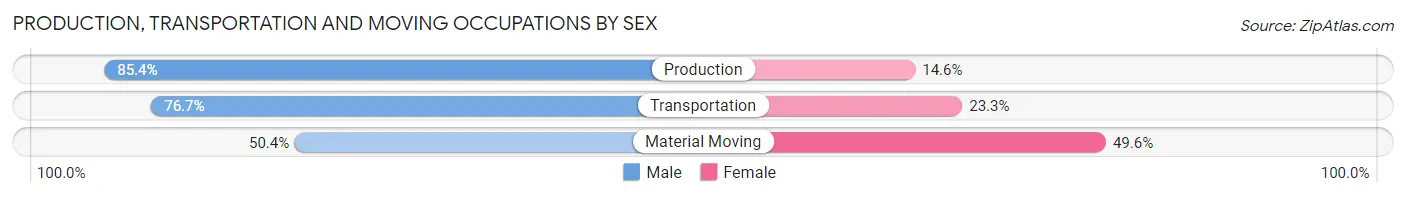
| Occupation | Male | Female |
| Production | 385 (85.4%) | 66 (14.6%) |
| Transportation | 221 (76.7%) | 67 (23.3%) |
| Material Moving | 131 (50.4%) | 129 (49.6%) |
| Total (Category) | 737 (73.8%) | 262 (26.2%) |
| Total (Overall) | 5,572 (53.8%) | 4,775 (46.2%) |
Employment Industries by Sex in Katy
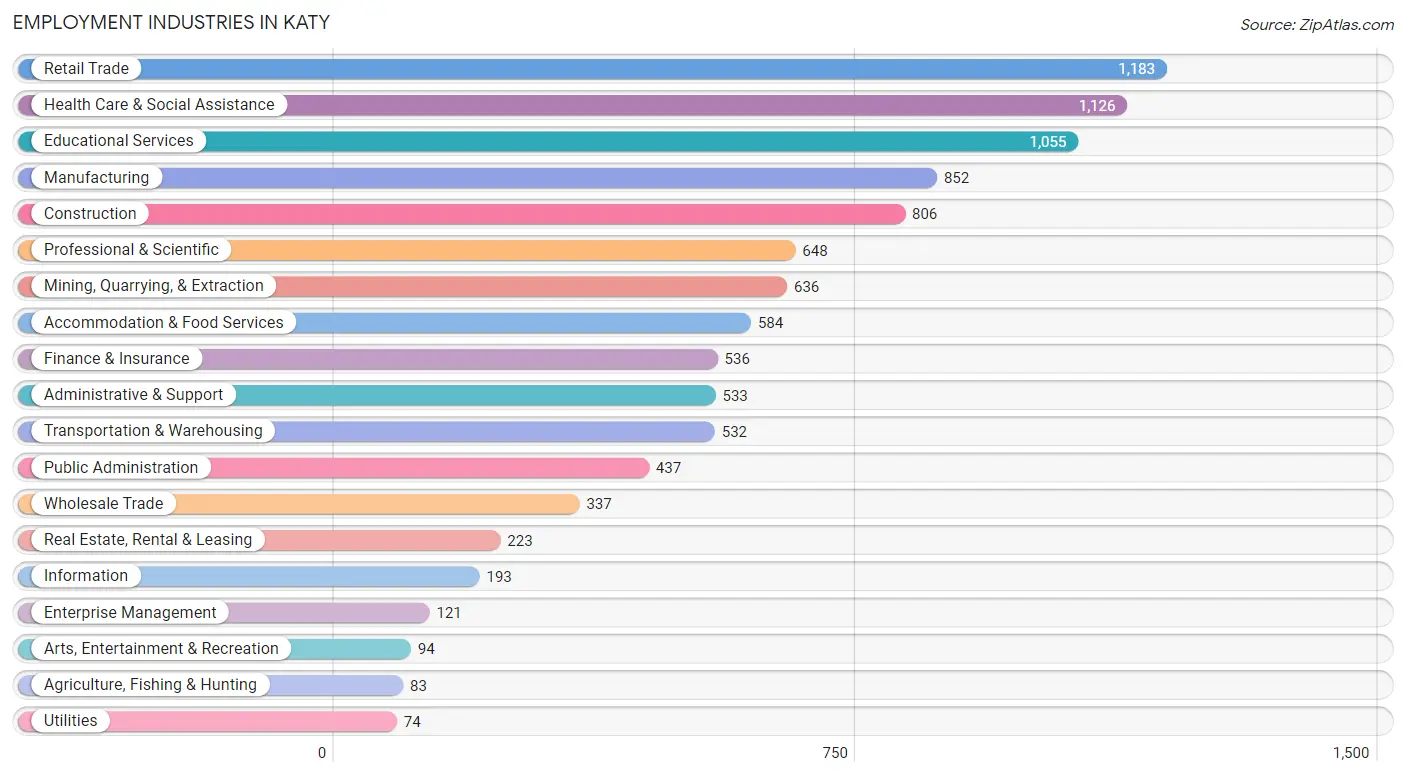
Employment Industries in Katy
The major employment industries in Katy include Retail Trade (1,183 | 11.4%), Health Care & Social Assistance (1,126 | 10.9%), Educational Services (1,055 | 10.2%), Manufacturing (852 | 8.2%), and Construction (806 | 7.8%).
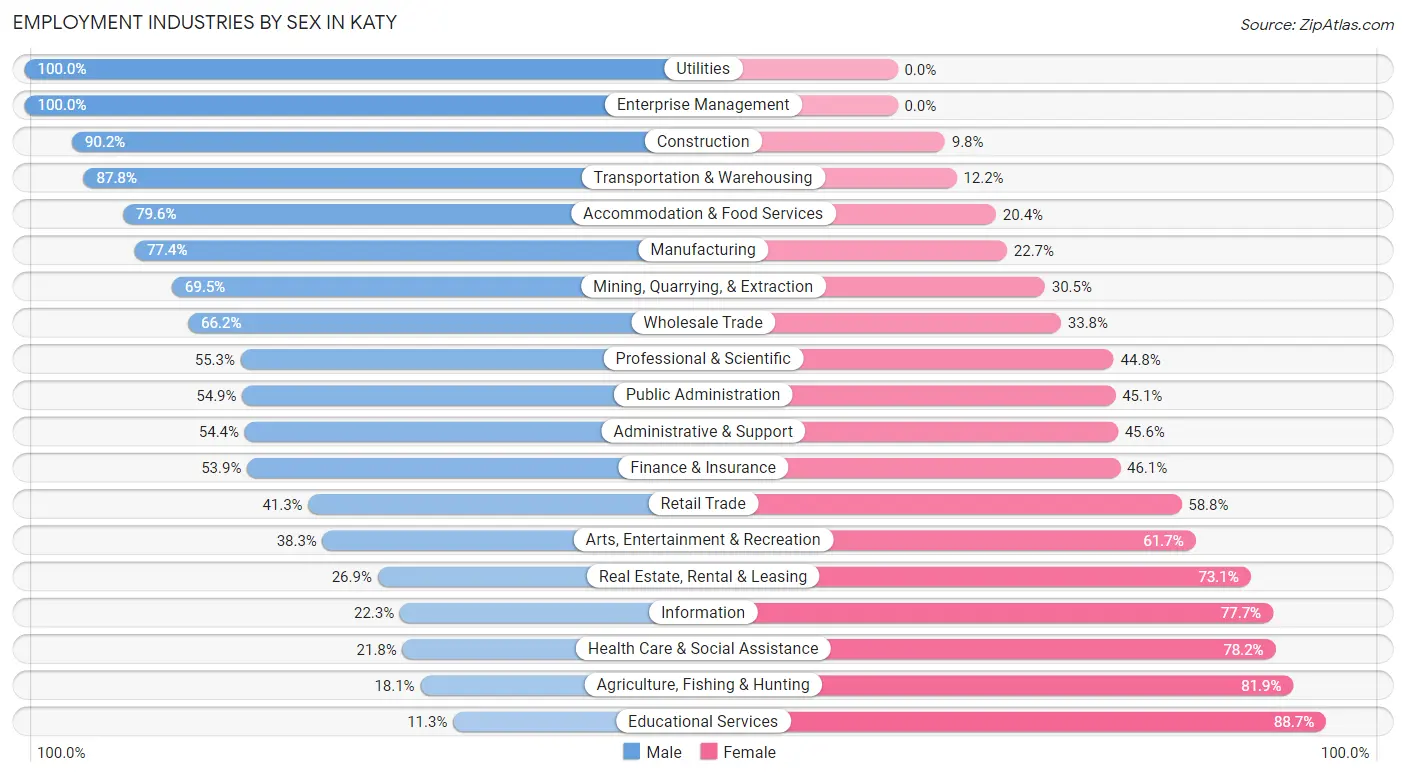
Employment Industries by Sex in Katy
The Katy industries that see more men than women are Utilities (100.0%), Enterprise Management (100.0%), and Construction (90.2%), whereas the industries that tend to have a higher number of women are Educational Services (88.7%), Agriculture, Fishing & Hunting (81.9%), and Health Care & Social Assistance (78.2%).
| Industry | Male | Female |
| Agriculture, Fishing & Hunting | 15 (18.1%) | 68 (81.9%) |
| Mining, Quarrying, & Extraction | 442 (69.5%) | 194 (30.5%) |
| Construction | 727 (90.2%) | 79 (9.8%) |
| Manufacturing | 659 (77.3%) | 193 (22.7%) |
| Wholesale Trade | 223 (66.2%) | 114 (33.8%) |
| Retail Trade | 488 (41.2%) | 695 (58.8%) |
| Transportation & Warehousing | 467 (87.8%) | 65 (12.2%) |
| Utilities | 74 (100.0%) | 0 (0.0%) |
| Information | 43 (22.3%) | 150 (77.7%) |
| Finance & Insurance | 289 (53.9%) | 247 (46.1%) |
| Real Estate, Rental & Leasing | 60 (26.9%) | 163 (73.1%) |
| Professional & Scientific | 358 (55.2%) | 290 (44.8%) |
| Enterprise Management | 121 (100.0%) | 0 (0.0%) |
| Administrative & Support | 290 (54.4%) | 243 (45.6%) |
| Educational Services | 119 (11.3%) | 936 (88.7%) |
| Health Care & Social Assistance | 245 (21.8%) | 881 (78.2%) |
| Arts, Entertainment & Recreation | 36 (38.3%) | 58 (61.7%) |
| Accommodation & Food Services | 465 (79.6%) | 119 (20.4%) |
| Public Administration | 240 (54.9%) | 197 (45.1%) |
| Total | 5,572 (53.8%) | 4,775 (46.2%) |
Education in Katy
School Enrollment in Katy
The most common levels of schooling among the 6,912 students in Katy are middle school (1,786 | 25.8%), high school (1,458 | 21.1%), and elementary school (1,430 | 20.7%).
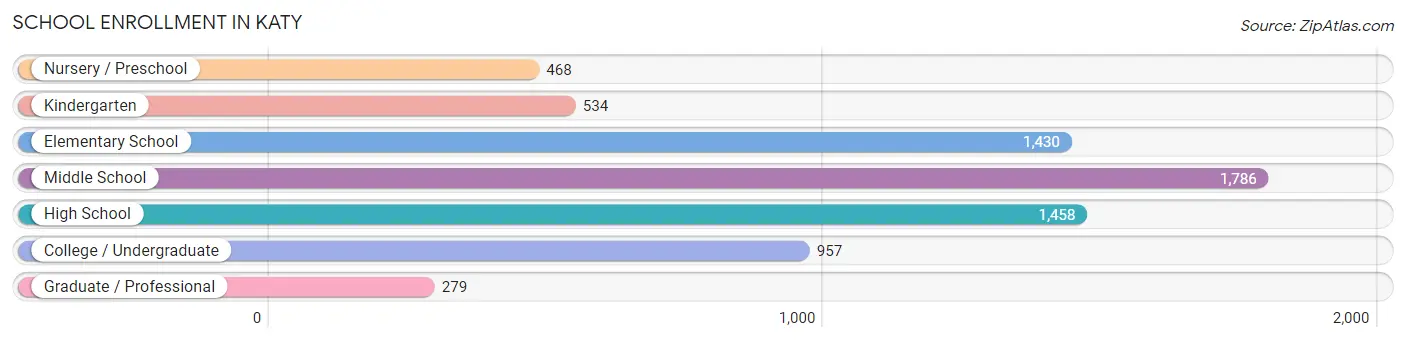
| School Level | # Students | % Students |
| Nursery / Preschool | 468 | 6.8% |
| Kindergarten | 534 | 7.7% |
| Elementary School | 1,430 | 20.7% |
| Middle School | 1,786 | 25.8% |
| High School | 1,458 | 21.1% |
| College / Undergraduate | 957 | 13.9% |
| Graduate / Professional | 279 | 4.0% |
| Total | 6,912 | 100.0% |
School Enrollment by Age by Funding Source in Katy
Out of a total of 6,912 students who are enrolled in schools in Katy, 1,099 (15.9%) attend a private institution, while the remaining 5,813 (84.1%) are enrolled in public schools. The age group of 3 to 4 year olds has the highest likelihood of being enrolled in private schools, with 288 (84.2% in the age bracket) enrolled. Conversely, the age group of 18 to 19 year olds has the lowest likelihood of being enrolled in a private school, with 245 (100.0% in the age bracket) attending a public institution.
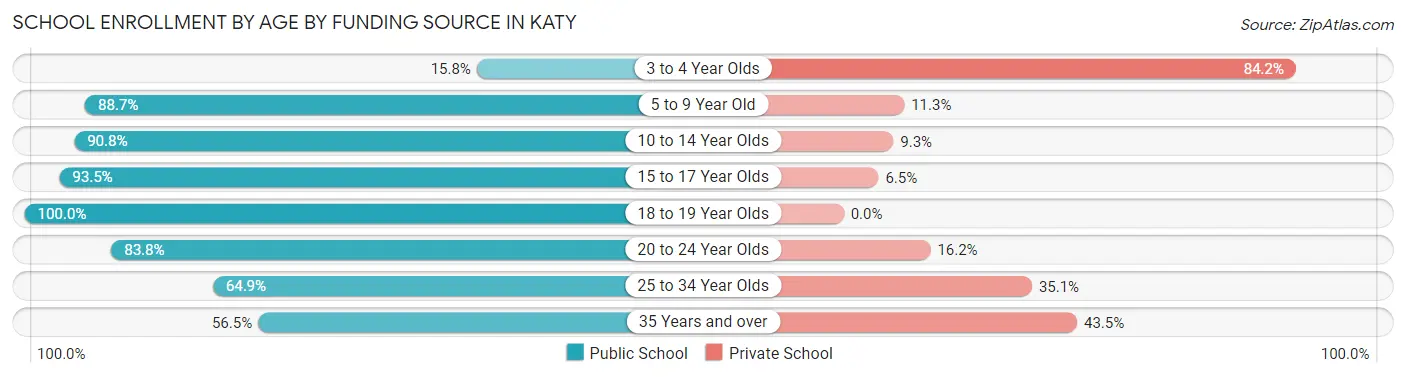
| Age Bracket | Public School | Private School |
| 3 to 4 Year Olds | 54 (15.8%) | 288 (84.2%) |
| 5 to 9 Year Old | 1,604 (88.7%) | 204 (11.3%) |
| 10 to 14 Year Olds | 1,923 (90.7%) | 196 (9.2%) |
| 15 to 17 Year Olds | 1,210 (93.5%) | 84 (6.5%) |
| 18 to 19 Year Olds | 245 (100.0%) | 0 (0.0%) |
| 20 to 24 Year Olds | 389 (83.8%) | 75 (16.2%) |
| 25 to 34 Year Olds | 187 (64.9%) | 101 (35.1%) |
| 35 Years and over | 199 (56.5%) | 153 (43.5%) |
| Total | 5,813 (84.1%) | 1,099 (15.9%) |
Educational Attainment by Field of Study in Katy
Business (1,798 | 25.3%), engineering (854 | 12.0%), education (835 | 11.8%), science & technology (832 | 11.7%), and arts & humanities (503 | 7.1%) are the most common fields of study among 7,101 individuals in Katy who have obtained a bachelor's degree or higher.
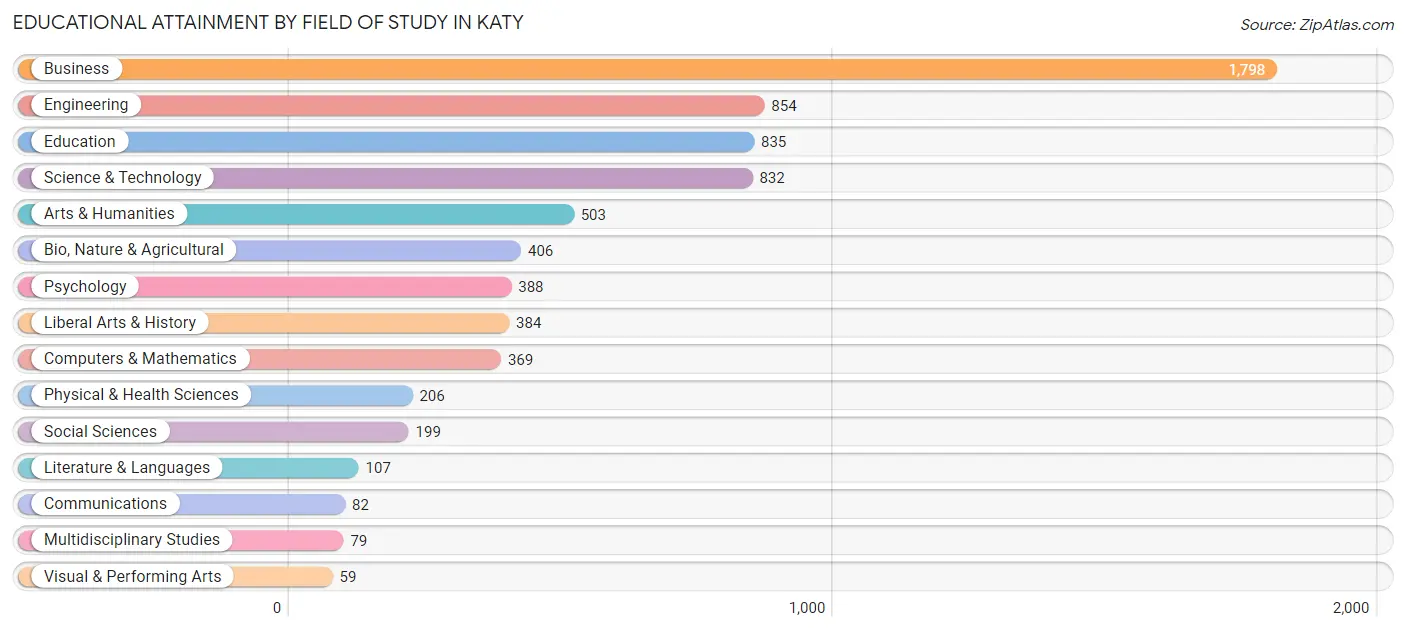
| Field of Study | # Graduates | % Graduates |
| Computers & Mathematics | 369 | 5.2% |
| Bio, Nature & Agricultural | 406 | 5.7% |
| Physical & Health Sciences | 206 | 2.9% |
| Psychology | 388 | 5.5% |
| Social Sciences | 199 | 2.8% |
| Engineering | 854 | 12.0% |
| Multidisciplinary Studies | 79 | 1.1% |
| Science & Technology | 832 | 11.7% |
| Business | 1,798 | 25.3% |
| Education | 835 | 11.8% |
| Literature & Languages | 107 | 1.5% |
| Liberal Arts & History | 384 | 5.4% |
| Visual & Performing Arts | 59 | 0.8% |
| Communications | 82 | 1.1% |
| Arts & Humanities | 503 | 7.1% |
| Total | 7,101 | 100.0% |
Transportation & Commute in Katy
Vehicle Availability by Sex in Katy
The most prevalent vehicle ownership categories in Katy are males with 2 vehicles (2,749, accounting for 49.8%) and females with 2 vehicles (2,123, making up 59.7%).
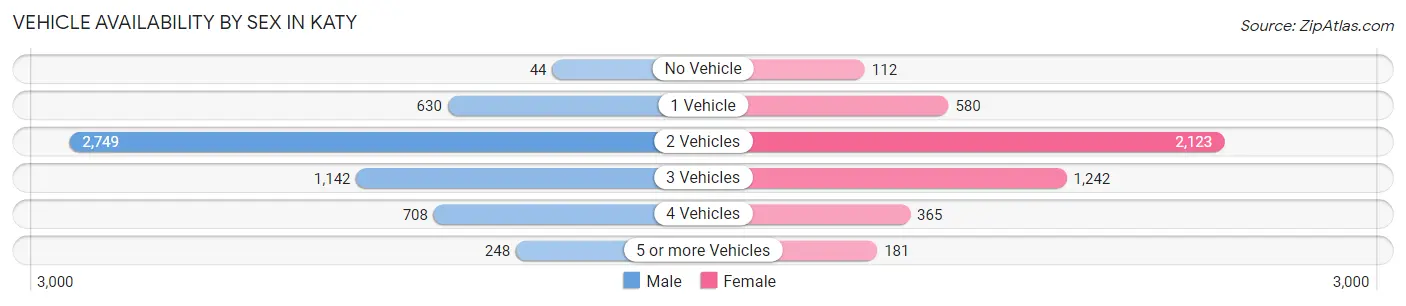
| Vehicles Available | Male | Female |
| No Vehicle | 44 (0.8%) | 112 (2.4%) |
| 1 Vehicle | 630 (11.4%) | 580 (12.6%) |
| 2 Vehicles | 2,749 (49.8%) | 2,123 (46.1%) |
| 3 Vehicles | 1,142 (20.7%) | 1,242 (27.0%) |
| 4 Vehicles | 708 (12.8%) | 365 (7.9%) |
| 5 or more Vehicles | 248 (4.5%) | 181 (3.9%) |
| Total | 5,521 (100.0%) | 4,603 (100.0%) |
Commute Time in Katy
The most frequently occuring commute durations in Katy are 45 to 59 minutes (1,341 commuters, 14.9%), 10 to 14 minutes (1,245 commuters, 13.8%), and 30 to 34 minutes (1,142 commuters, 12.7%).
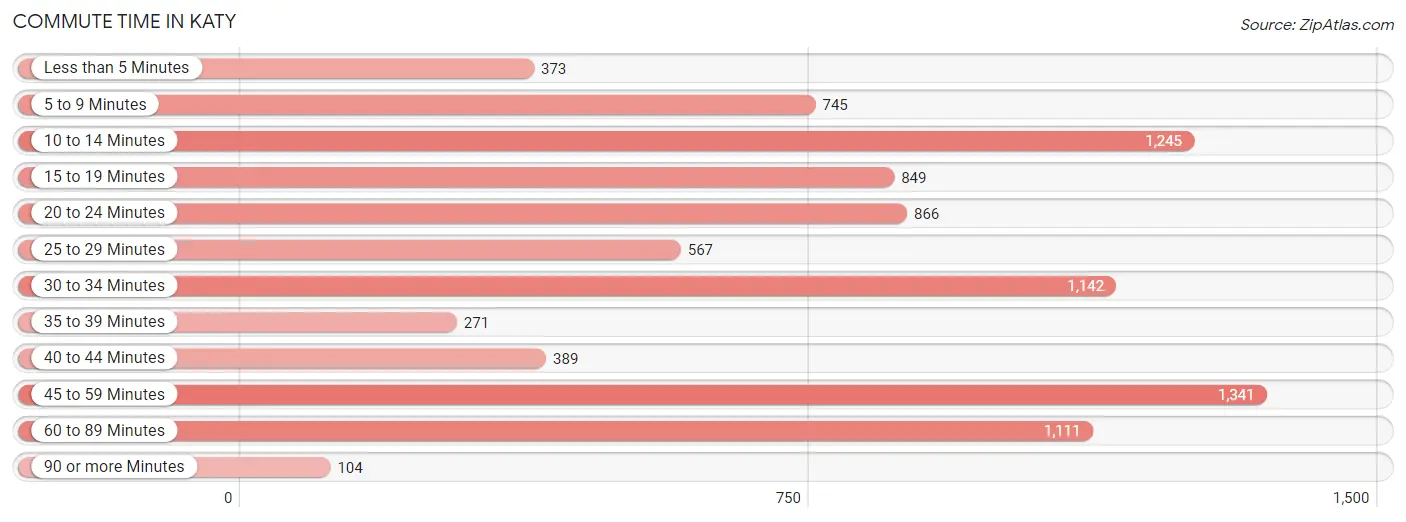
| Commute Time | # Commuters | % Commuters |
| Less than 5 Minutes | 373 | 4.1% |
| 5 to 9 Minutes | 745 | 8.3% |
| 10 to 14 Minutes | 1,245 | 13.8% |
| 15 to 19 Minutes | 849 | 9.4% |
| 20 to 24 Minutes | 866 | 9.6% |
| 25 to 29 Minutes | 567 | 6.3% |
| 30 to 34 Minutes | 1,142 | 12.7% |
| 35 to 39 Minutes | 271 | 3.0% |
| 40 to 44 Minutes | 389 | 4.3% |
| 45 to 59 Minutes | 1,341 | 14.9% |
| 60 to 89 Minutes | 1,111 | 12.3% |
| 90 or more Minutes | 104 | 1.2% |
Commute Time by Sex in Katy
The most common commute times in Katy are 45 to 59 minutes (831 commuters, 16.7%) for males and 20 to 24 minutes (672 commuters, 16.7%) for females.
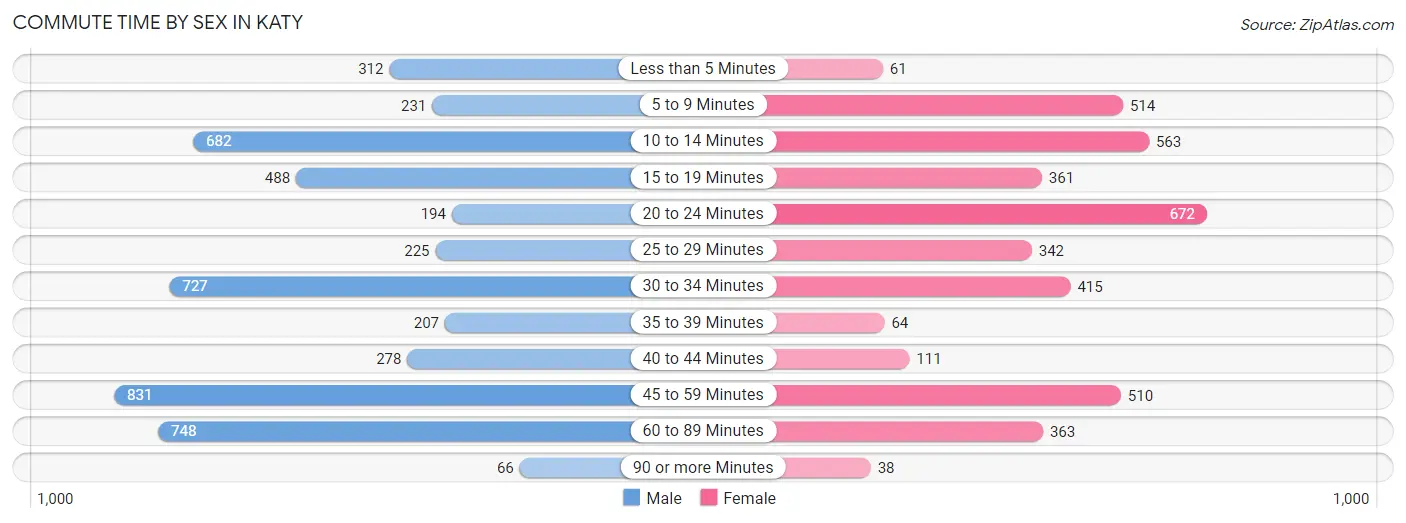
| Commute Time | Male | Female |
| Less than 5 Minutes | 312 (6.2%) | 61 (1.5%) |
| 5 to 9 Minutes | 231 (4.6%) | 514 (12.8%) |
| 10 to 14 Minutes | 682 (13.7%) | 563 (14.0%) |
| 15 to 19 Minutes | 488 (9.8%) | 361 (9.0%) |
| 20 to 24 Minutes | 194 (3.9%) | 672 (16.7%) |
| 25 to 29 Minutes | 225 (4.5%) | 342 (8.5%) |
| 30 to 34 Minutes | 727 (14.6%) | 415 (10.3%) |
| 35 to 39 Minutes | 207 (4.2%) | 64 (1.6%) |
| 40 to 44 Minutes | 278 (5.6%) | 111 (2.8%) |
| 45 to 59 Minutes | 831 (16.7%) | 510 (12.7%) |
| 60 to 89 Minutes | 748 (15.0%) | 363 (9.0%) |
| 90 or more Minutes | 66 (1.3%) | 38 (0.9%) |
Time of Departure to Work by Sex in Katy
The most frequent times of departure to work in Katy are 9:00 AM to 9:59 AM (655, 13.1%) for males and 7:00 AM to 7:29 AM (801, 20.0%) for females.
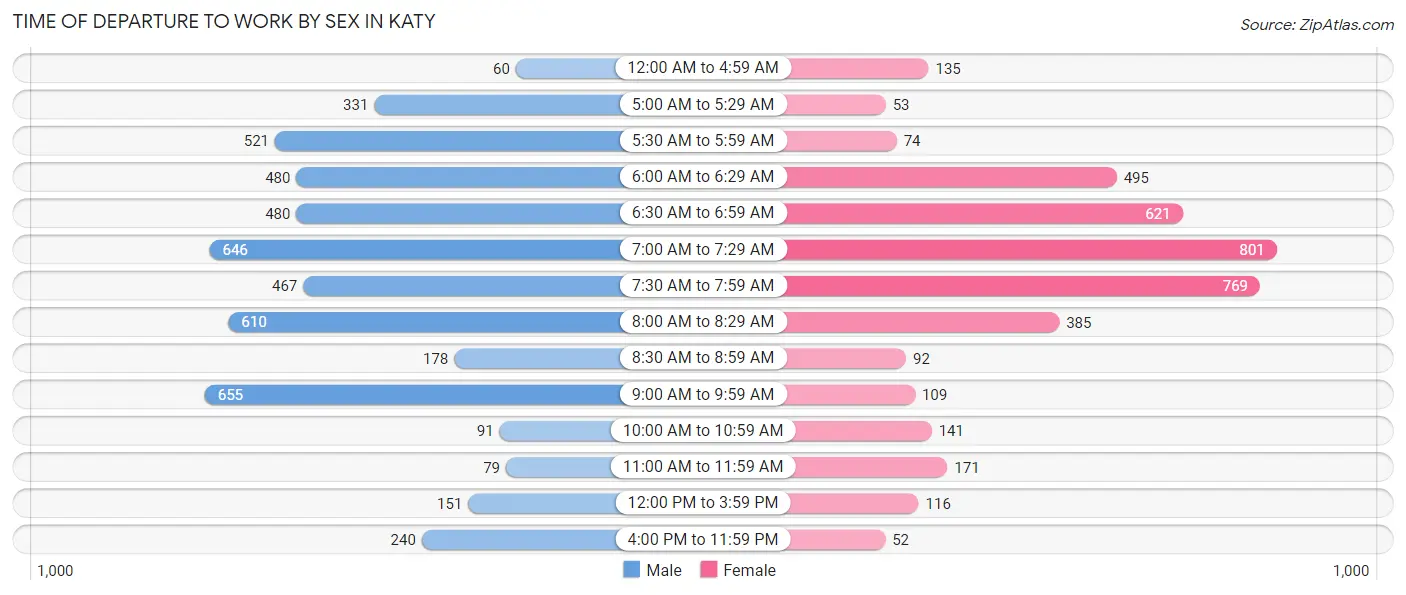
| Time of Departure | Male | Female |
| 12:00 AM to 4:59 AM | 60 (1.2%) | 135 (3.4%) |
| 5:00 AM to 5:29 AM | 331 (6.6%) | 53 (1.3%) |
| 5:30 AM to 5:59 AM | 521 (10.4%) | 74 (1.8%) |
| 6:00 AM to 6:29 AM | 480 (9.6%) | 495 (12.3%) |
| 6:30 AM to 6:59 AM | 480 (9.6%) | 621 (15.5%) |
| 7:00 AM to 7:29 AM | 646 (13.0%) | 801 (20.0%) |
| 7:30 AM to 7:59 AM | 467 (9.4%) | 769 (19.2%) |
| 8:00 AM to 8:29 AM | 610 (12.2%) | 385 (9.6%) |
| 8:30 AM to 8:59 AM | 178 (3.6%) | 92 (2.3%) |
| 9:00 AM to 9:59 AM | 655 (13.1%) | 109 (2.7%) |
| 10:00 AM to 10:59 AM | 91 (1.8%) | 141 (3.5%) |
| 11:00 AM to 11:59 AM | 79 (1.6%) | 171 (4.3%) |
| 12:00 PM to 3:59 PM | 151 (3.0%) | 116 (2.9%) |
| 4:00 PM to 11:59 PM | 240 (4.8%) | 52 (1.3%) |
| Total | 4,989 (100.0%) | 4,014 (100.0%) |
Housing Occupancy in Katy
Occupancy by Ownership in Katy
Of the total 6,993 dwellings in Katy, owner-occupied units account for 5,552 (79.4%), while renter-occupied units make up 1,441 (20.6%).
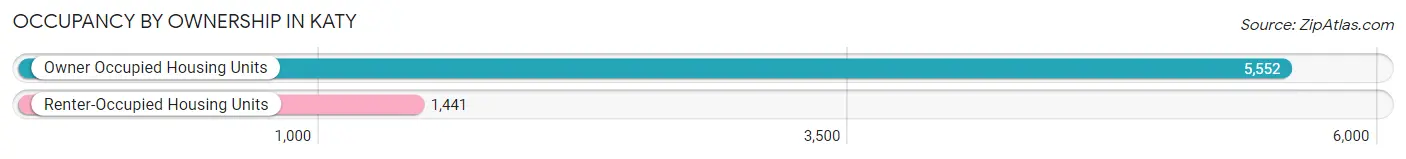
| Occupancy | # Housing Units | % Housing Units |
| Owner Occupied Housing Units | 5,552 | 79.4% |
| Renter-Occupied Housing Units | 1,441 | 20.6% |
| Total Occupied Housing Units | 6,993 | 100.0% |
Occupancy by Household Size in Katy
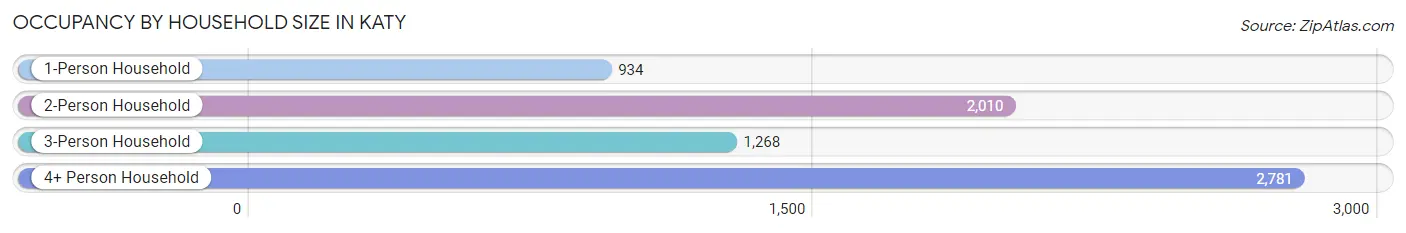
| Household Size | # Housing Units | % Housing Units |
| 1-Person Household | 934 | 13.4% |
| 2-Person Household | 2,010 | 28.7% |
| 3-Person Household | 1,268 | 18.1% |
| 4+ Person Household | 2,781 | 39.8% |
| Total Housing Units | 6,993 | 100.0% |
Occupancy by Ownership by Household Size in Katy
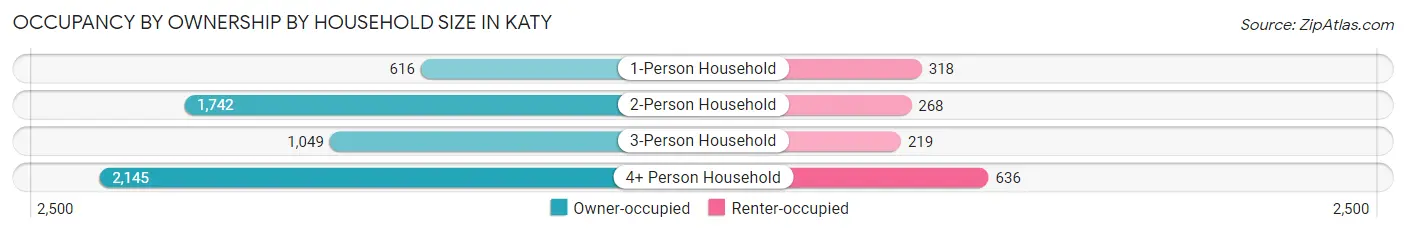
| Household Size | Owner-occupied | Renter-occupied |
| 1-Person Household | 616 (65.9%) | 318 (34.1%) |
| 2-Person Household | 1,742 (86.7%) | 268 (13.3%) |
| 3-Person Household | 1,049 (82.7%) | 219 (17.3%) |
| 4+ Person Household | 2,145 (77.1%) | 636 (22.9%) |
| Total Housing Units | 5,552 (79.4%) | 1,441 (20.6%) |
Occupancy by Educational Attainment in Katy
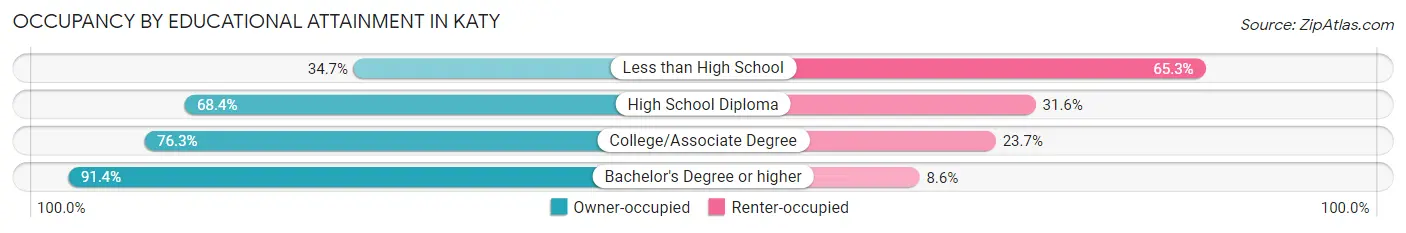
| Household Size | Owner-occupied | Renter-occupied |
| Less than High School | 201 (34.7%) | 378 (65.3%) |
| High School Diploma | 755 (68.4%) | 349 (31.6%) |
| College/Associate Degree | 1,303 (76.3%) | 405 (23.7%) |
| Bachelor's Degree or higher | 3,293 (91.4%) | 309 (8.6%) |
Occupancy by Age of Householder in Katy
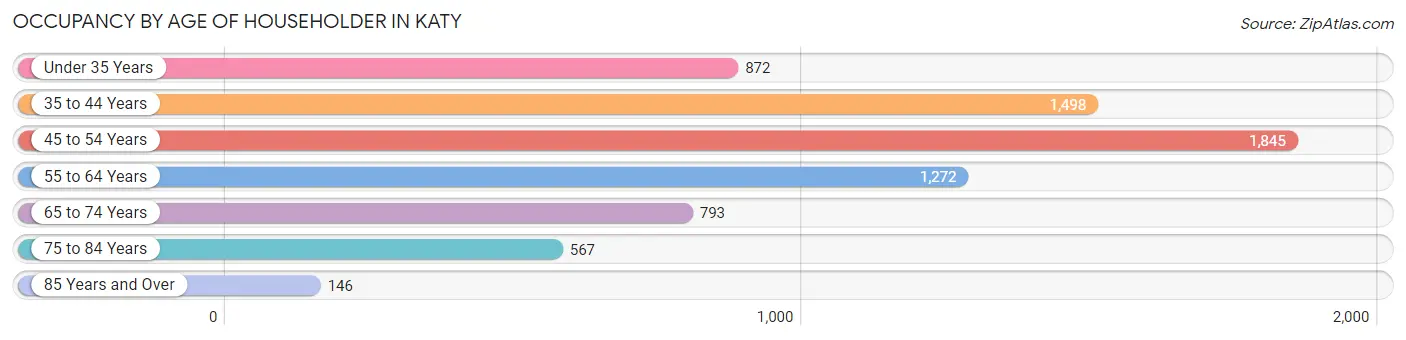
| Age Bracket | # Households | % Households |
| Under 35 Years | 872 | 12.5% |
| 35 to 44 Years | 1,498 | 21.4% |
| 45 to 54 Years | 1,845 | 26.4% |
| 55 to 64 Years | 1,272 | 18.2% |
| 65 to 74 Years | 793 | 11.3% |
| 75 to 84 Years | 567 | 8.1% |
| 85 Years and Over | 146 | 2.1% |
| Total | 6,993 | 100.0% |
Housing Finances in Katy
Median Income by Occupancy in Katy
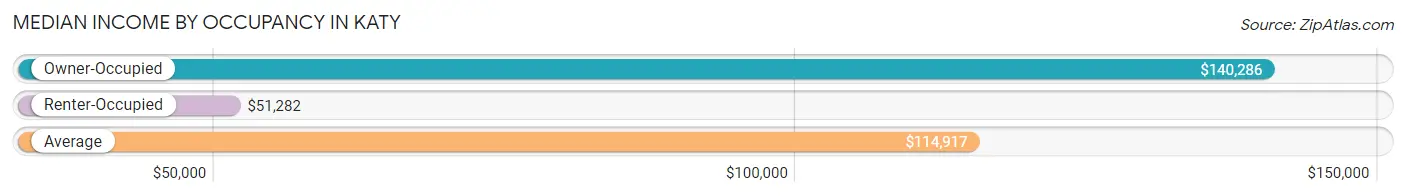
| Occupancy Type | # Households | Median Income |
| Owner-Occupied | 5,552 (79.4%) | $140,286 |
| Renter-Occupied | 1,441 (20.6%) | $51,282 |
| Average | 6,993 (100.0%) | $114,917 |
Occupancy by Householder Income Bracket in Katy
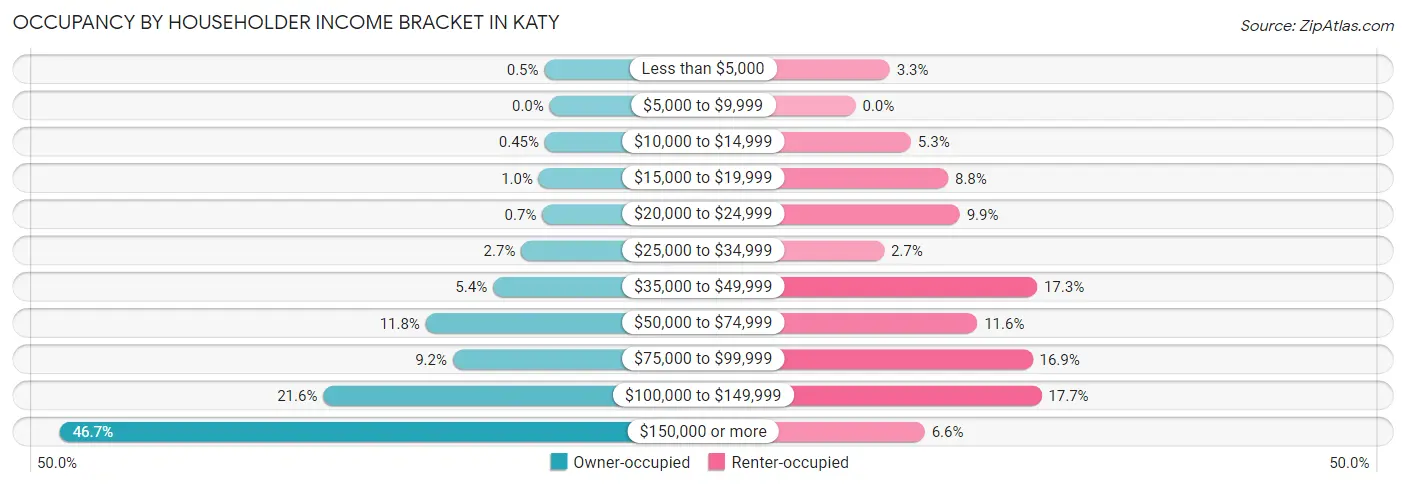
| Income Bracket | Owner-occupied | Renter-occupied |
| Less than $5,000 | 28 (0.5%) | 47 (3.3%) |
| $5,000 to $9,999 | 0 (0.0%) | 0 (0.0%) |
| $10,000 to $14,999 | 25 (0.4%) | 76 (5.3%) |
| $15,000 to $19,999 | 57 (1.0%) | 127 (8.8%) |
| $20,000 to $24,999 | 39 (0.7%) | 143 (9.9%) |
| $25,000 to $34,999 | 150 (2.7%) | 39 (2.7%) |
| $35,000 to $49,999 | 299 (5.4%) | 249 (17.3%) |
| $50,000 to $74,999 | 655 (11.8%) | 167 (11.6%) |
| $75,000 to $99,999 | 512 (9.2%) | 243 (16.9%) |
| $100,000 to $149,999 | 1,197 (21.6%) | 255 (17.7%) |
| $150,000 or more | 2,590 (46.7%) | 95 (6.6%) |
| Total | 5,552 (100.0%) | 1,441 (100.0%) |
Monthly Housing Cost Tiers in Katy
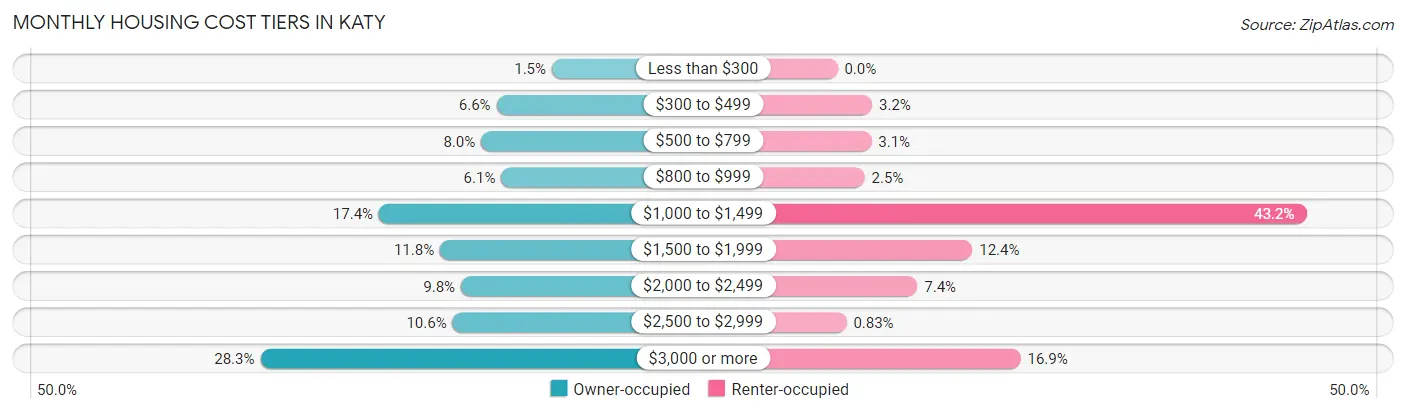
| Monthly Cost | Owner-occupied | Renter-occupied |
| Less than $300 | 81 (1.5%) | 0 (0.0%) |
| $300 to $499 | 364 (6.6%) | 46 (3.2%) |
| $500 to $799 | 443 (8.0%) | 45 (3.1%) |
| $800 to $999 | 340 (6.1%) | 36 (2.5%) |
| $1,000 to $1,499 | 965 (17.4%) | 622 (43.2%) |
| $1,500 to $1,999 | 653 (11.8%) | 179 (12.4%) |
| $2,000 to $2,499 | 546 (9.8%) | 106 (7.4%) |
| $2,500 to $2,999 | 589 (10.6%) | 12 (0.8%) |
| $3,000 or more | 1,571 (28.3%) | 243 (16.9%) |
| Total | 5,552 (100.0%) | 1,441 (100.0%) |
Physical Housing Characteristics in Katy
Housing Structures in Katy
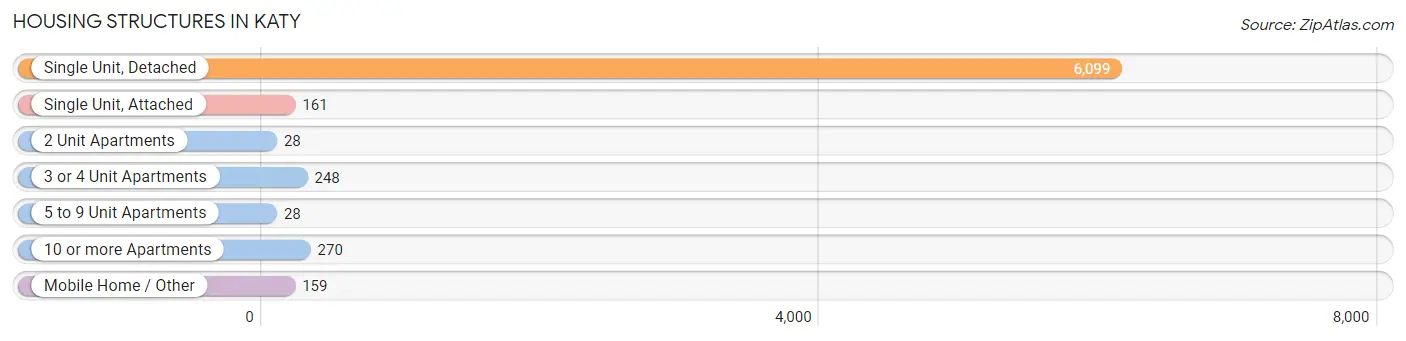
| Structure Type | # Housing Units | % Housing Units |
| Single Unit, Detached | 6,099 | 87.2% |
| Single Unit, Attached | 161 | 2.3% |
| 2 Unit Apartments | 28 | 0.4% |
| 3 or 4 Unit Apartments | 248 | 3.5% |
| 5 to 9 Unit Apartments | 28 | 0.4% |
| 10 or more Apartments | 270 | 3.9% |
| Mobile Home / Other | 159 | 2.3% |
| Total | 6,993 | 100.0% |
Housing Structures by Occupancy in Katy
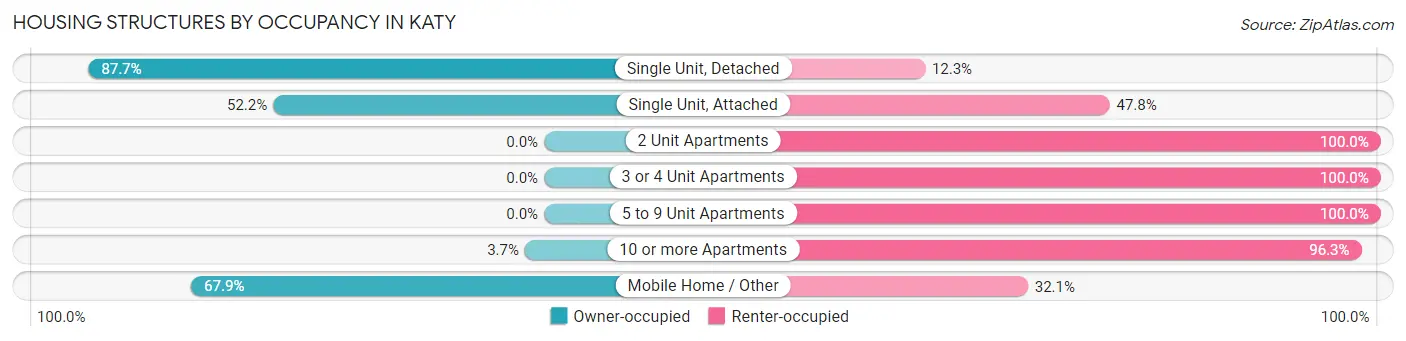
| Structure Type | Owner-occupied | Renter-occupied |
| Single Unit, Detached | 5,350 (87.7%) | 749 (12.3%) |
| Single Unit, Attached | 84 (52.2%) | 77 (47.8%) |
| 2 Unit Apartments | 0 (0.0%) | 28 (100.0%) |
| 3 or 4 Unit Apartments | 0 (0.0%) | 248 (100.0%) |
| 5 to 9 Unit Apartments | 0 (0.0%) | 28 (100.0%) |
| 10 or more Apartments | 10 (3.7%) | 260 (96.3%) |
| Mobile Home / Other | 108 (67.9%) | 51 (32.1%) |
| Total | 5,552 (79.4%) | 1,441 (20.6%) |
Housing Structures by Number of Rooms in Katy
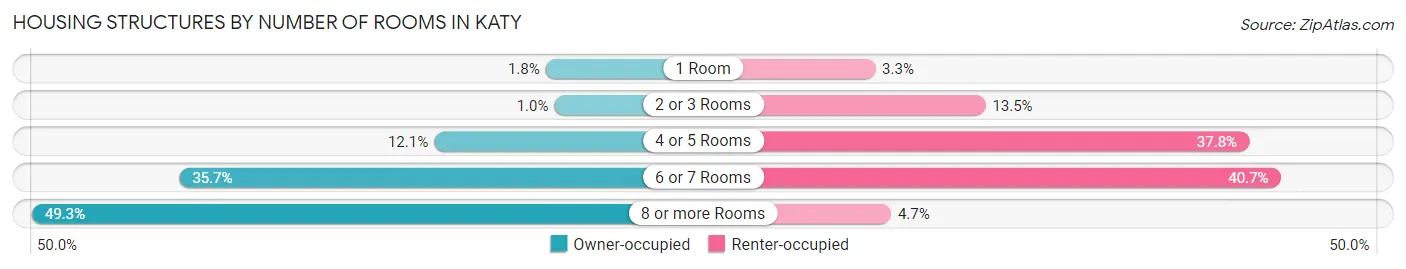
| Number of Rooms | Owner-occupied | Renter-occupied |
| 1 Room | 101 (1.8%) | 47 (3.3%) |
| 2 or 3 Rooms | 56 (1.0%) | 194 (13.5%) |
| 4 or 5 Rooms | 674 (12.1%) | 545 (37.8%) |
| 6 or 7 Rooms | 1,982 (35.7%) | 587 (40.7%) |
| 8 or more Rooms | 2,739 (49.3%) | 68 (4.7%) |
| Total | 5,552 (100.0%) | 1,441 (100.0%) |
Housing Structure by Heating Type in Katy
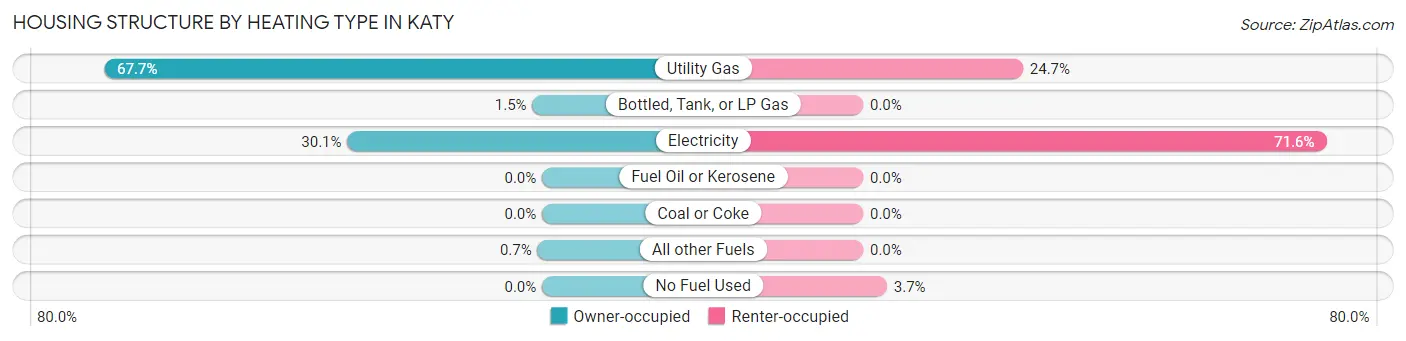
| Heating Type | Owner-occupied | Renter-occupied |
| Utility Gas | 3,759 (67.7%) | 356 (24.7%) |
| Bottled, Tank, or LP Gas | 83 (1.5%) | 0 (0.0%) |
| Electricity | 1,671 (30.1%) | 1,032 (71.6%) |
| Fuel Oil or Kerosene | 0 (0.0%) | 0 (0.0%) |
| Coal or Coke | 0 (0.0%) | 0 (0.0%) |
| All other Fuels | 39 (0.7%) | 0 (0.0%) |
| No Fuel Used | 0 (0.0%) | 53 (3.7%) |
| Total | 5,552 (100.0%) | 1,441 (100.0%) |
Household Vehicle Usage in Katy
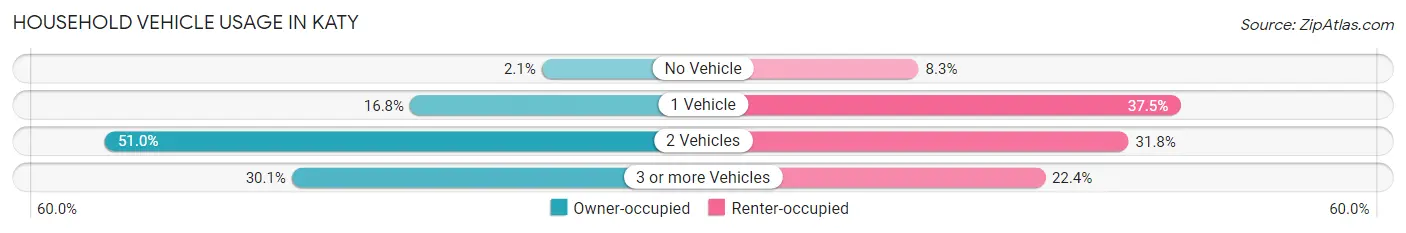
| Vehicles per Household | Owner-occupied | Renter-occupied |
| No Vehicle | 116 (2.1%) | 119 (8.3%) |
| 1 Vehicle | 935 (16.8%) | 541 (37.5%) |
| 2 Vehicles | 2,831 (51.0%) | 458 (31.8%) |
| 3 or more Vehicles | 1,670 (30.1%) | 323 (22.4%) |
| Total | 5,552 (100.0%) | 1,441 (100.0%) |
Real Estate & Mortgages in Katy
Real Estate and Mortgage Overview in Katy
| Characteristic | Without Mortgage | With Mortgage |
| Housing Units | 1,923 | 3,629 |
| Median Property Value | $255,400 | $400,100 |
| Median Household Income | $112,974 | $1,989 |
| Monthly Housing Costs | $844 | $1,552 |
| Real Estate Taxes | $4,922 | $256 |
Property Value by Mortgage Status in Katy
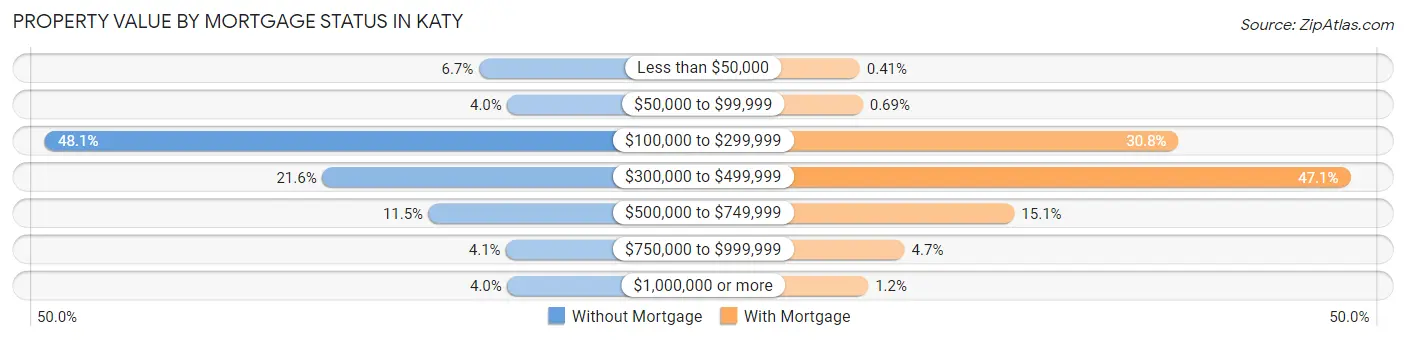
| Property Value | Without Mortgage | With Mortgage |
| Less than $50,000 | 129 (6.7%) | 15 (0.4%) |
| $50,000 to $99,999 | 77 (4.0%) | 25 (0.7%) |
| $100,000 to $299,999 | 924 (48.0%) | 1,116 (30.7%) |
| $300,000 to $499,999 | 416 (21.6%) | 1,710 (47.1%) |
| $500,000 to $749,999 | 221 (11.5%) | 549 (15.1%) |
| $750,000 to $999,999 | 79 (4.1%) | 170 (4.7%) |
| $1,000,000 or more | 77 (4.0%) | 44 (1.2%) |
| Total | 1,923 (100.0%) | 3,629 (100.0%) |
Household Income by Mortgage Status in Katy
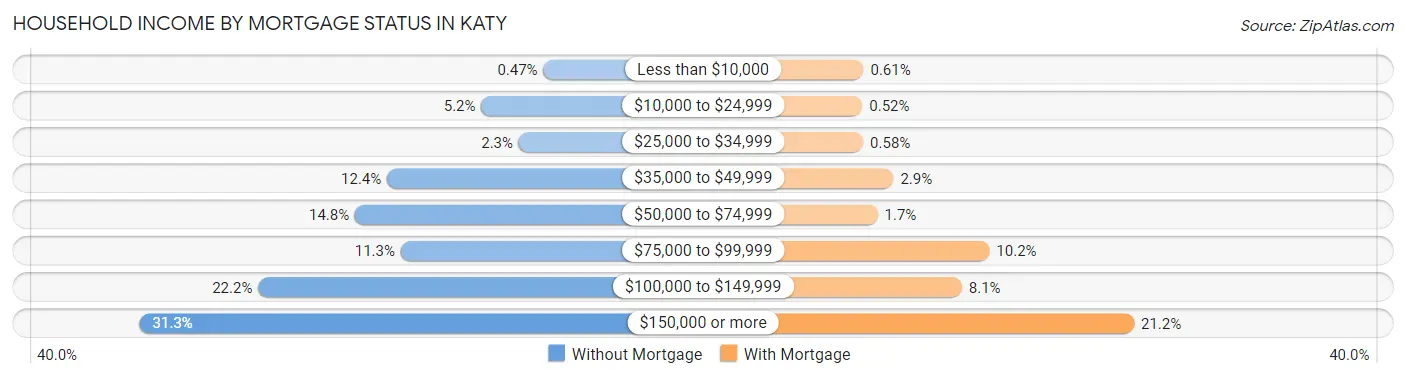
| Household Income | Without Mortgage | With Mortgage |
| Less than $10,000 | 9 (0.5%) | 22 (0.6%) |
| $10,000 to $24,999 | 100 (5.2%) | 19 (0.5%) |
| $25,000 to $34,999 | 45 (2.3%) | 21 (0.6%) |
| $35,000 to $49,999 | 238 (12.4%) | 105 (2.9%) |
| $50,000 to $74,999 | 285 (14.8%) | 61 (1.7%) |
| $75,000 to $99,999 | 218 (11.3%) | 370 (10.2%) |
| $100,000 to $149,999 | 427 (22.2%) | 294 (8.1%) |
| $150,000 or more | 601 (31.2%) | 770 (21.2%) |
| Total | 1,923 (100.0%) | 3,629 (100.0%) |
Property Value to Household Income Ratio in Katy
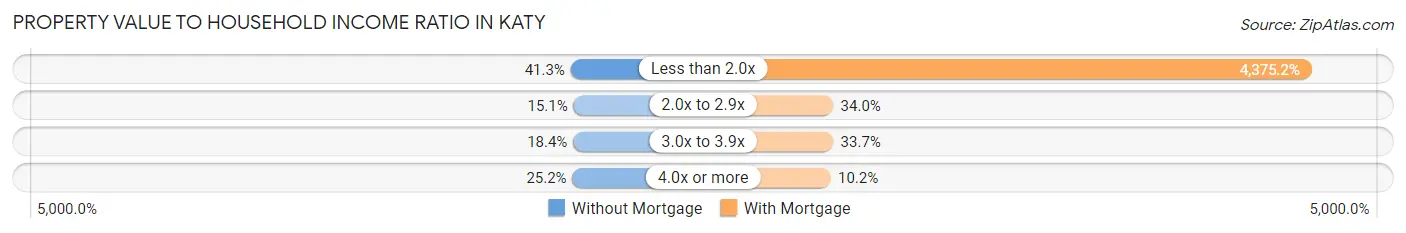
| Value-to-Income Ratio | Without Mortgage | With Mortgage |
| Less than 2.0x | 794 (41.3%) | 158,776 (4,375.2%) |
| 2.0x to 2.9x | 290 (15.1%) | 1,234 (34.0%) |
| 3.0x to 3.9x | 354 (18.4%) | 1,223 (33.7%) |
| 4.0x or more | 485 (25.2%) | 370 (10.2%) |
| Total | 1,923 (100.0%) | 3,629 (100.0%) |
Real Estate Taxes by Mortgage Status in Katy
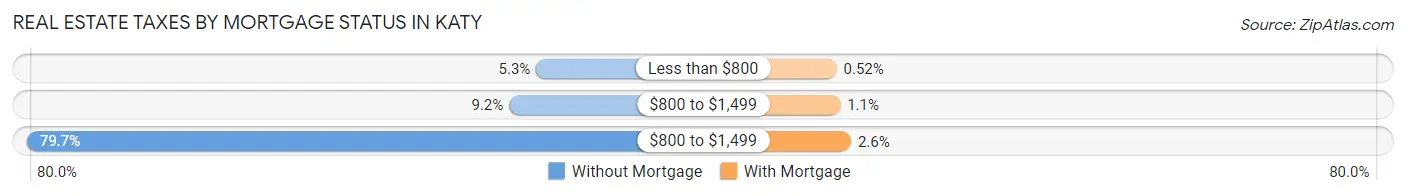
| Property Taxes | Without Mortgage | With Mortgage |
| Less than $800 | 101 (5.2%) | 19 (0.5%) |
| $800 to $1,499 | 177 (9.2%) | 38 (1.1%) |
| $800 to $1,499 | 1,532 (79.7%) | 95 (2.6%) |
| Total | 1,923 (100.0%) | 3,629 (100.0%) |
Health & Disability in Katy
Health Insurance Coverage by Age in Katy
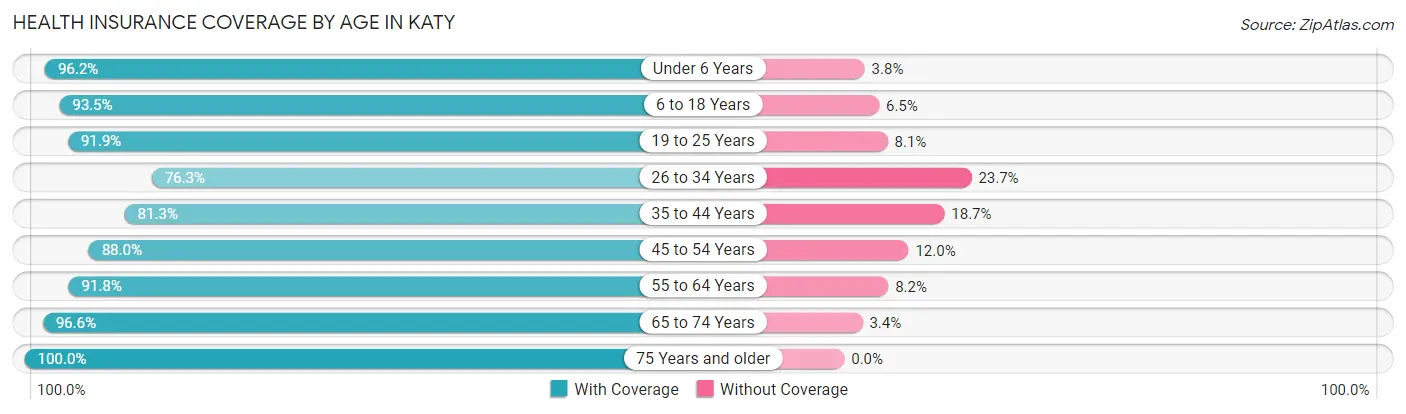
| Age Bracket | With Coverage | Without Coverage |
| Under 6 Years | 1,999 (96.2%) | 79 (3.8%) |
| 6 to 18 Years | 4,703 (93.5%) | 326 (6.5%) |
| 19 to 25 Years | 1,502 (91.9%) | 132 (8.1%) |
| 26 to 34 Years | 1,847 (76.3%) | 574 (23.7%) |
| 35 to 44 Years | 2,476 (81.3%) | 568 (18.7%) |
| 45 to 54 Years | 3,273 (88.0%) | 445 (12.0%) |
| 55 to 64 Years | 2,120 (91.8%) | 189 (8.2%) |
| 65 to 74 Years | 1,397 (96.6%) | 49 (3.4%) |
| 75 Years and older | 977 (100.0%) | 0 (0.0%) |
| Total | 20,294 (89.6%) | 2,362 (10.4%) |
Health Insurance Coverage by Citizenship Status in Katy
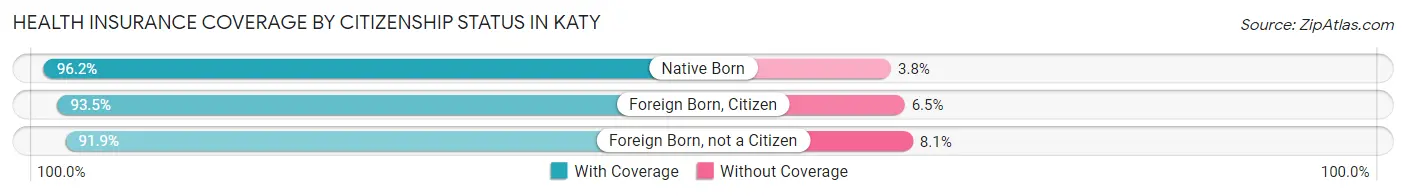
| Citizenship Status | With Coverage | Without Coverage |
| Native Born | 1,999 (96.2%) | 79 (3.8%) |
| Foreign Born, Citizen | 4,703 (93.5%) | 326 (6.5%) |
| Foreign Born, not a Citizen | 1,502 (91.9%) | 132 (8.1%) |
Health Insurance Coverage by Household Income in Katy
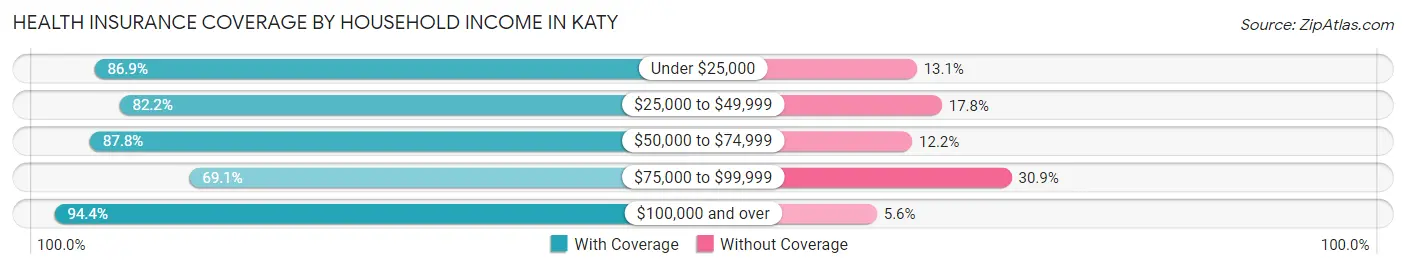
| Household Income | With Coverage | Without Coverage |
| Under $25,000 | 796 (86.9%) | 120 (13.1%) |
| $25,000 to $49,999 | 1,427 (82.2%) | 309 (17.8%) |
| $50,000 to $74,999 | 2,158 (87.8%) | 301 (12.2%) |
| $75,000 to $99,999 | 1,767 (69.1%) | 789 (30.9%) |
| $100,000 and over | 14,146 (94.4%) | 843 (5.6%) |
Public vs Private Health Insurance Coverage by Age in Katy
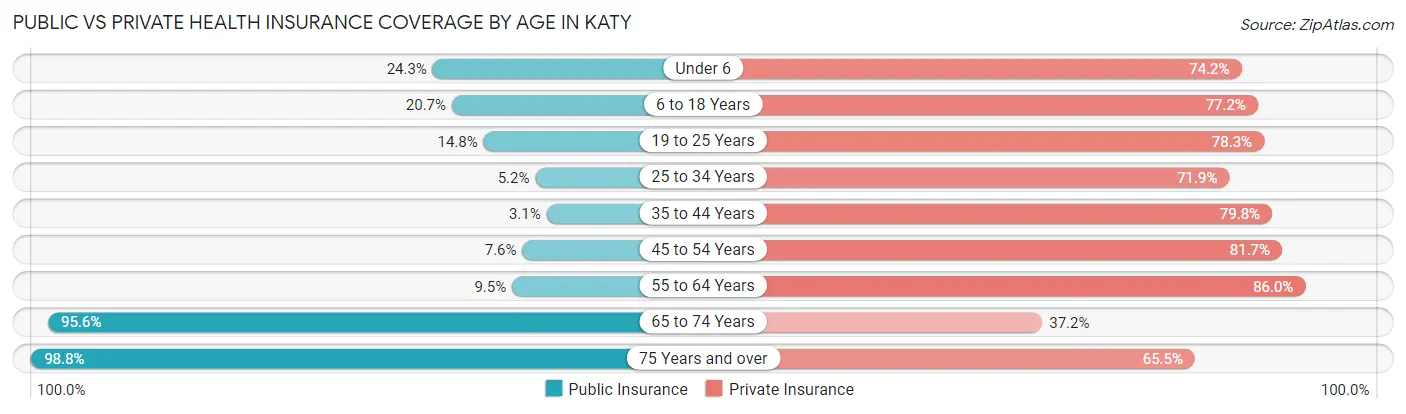
| Age Bracket | Public Insurance | Private Insurance |
| Under 6 | 504 (24.2%) | 1,541 (74.2%) |
| 6 to 18 Years | 1,041 (20.7%) | 3,882 (77.2%) |
| 19 to 25 Years | 242 (14.8%) | 1,280 (78.3%) |
| 25 to 34 Years | 126 (5.2%) | 1,741 (71.9%) |
| 35 to 44 Years | 95 (3.1%) | 2,430 (79.8%) |
| 45 to 54 Years | 283 (7.6%) | 3,037 (81.7%) |
| 55 to 64 Years | 220 (9.5%) | 1,986 (86.0%) |
| 65 to 74 Years | 1,383 (95.6%) | 538 (37.2%) |
| 75 Years and over | 965 (98.8%) | 640 (65.5%) |
| Total | 4,859 (21.4%) | 17,075 (75.4%) |
Disability Status by Sex by Age in Katy
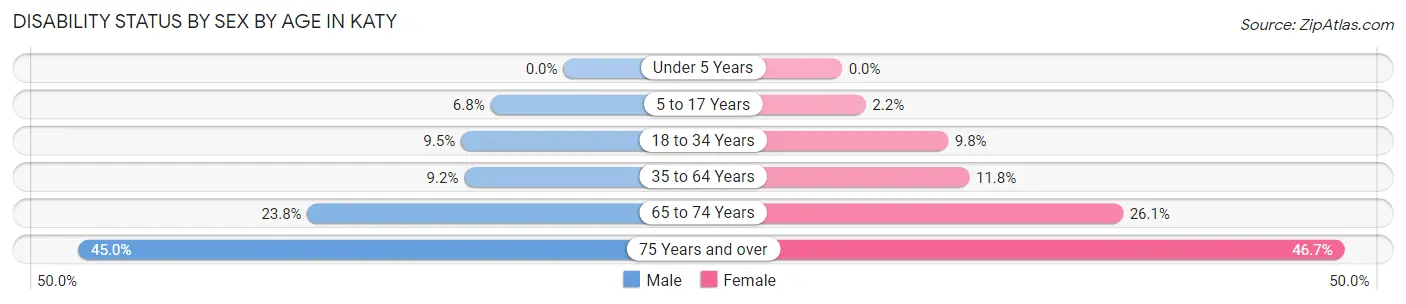
| Age Bracket | Male | Female |
| Under 5 Years | 0 (0.0%) | 0 (0.0%) |
| 5 to 17 Years | 187 (6.8%) | 54 (2.2%) |
| 18 to 34 Years | 211 (9.5%) | 197 (9.8%) |
| 35 to 64 Years | 406 (9.2%) | 550 (11.8%) |
| 65 to 74 Years | 143 (23.7%) | 220 (26.1%) |
| 75 Years and over | 245 (45.0%) | 202 (46.7%) |
Disability Class by Sex by Age in Katy
Disability Class: Hearing Difficulty
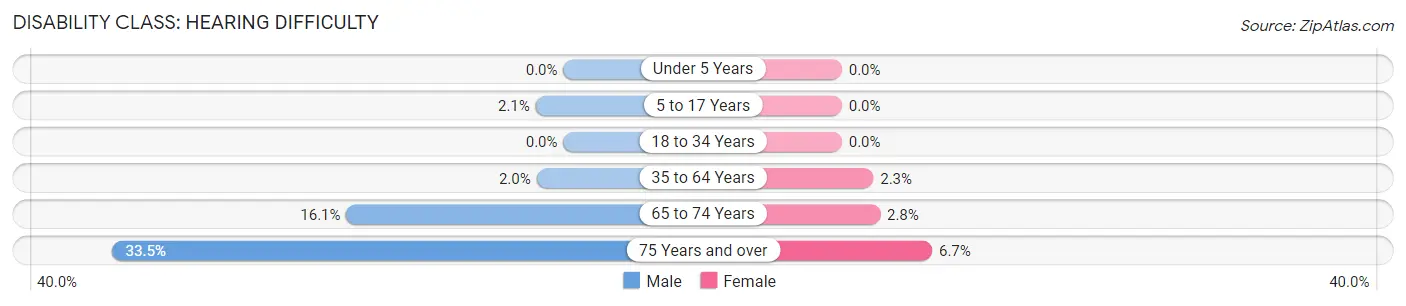
| Age Bracket | Male | Female |
| Under 5 Years | 0 (0.0%) | 0 (0.0%) |
| 5 to 17 Years | 57 (2.1%) | 0 (0.0%) |
| 18 to 34 Years | 0 (0.0%) | 0 (0.0%) |
| 35 to 64 Years | 88 (2.0%) | 109 (2.3%) |
| 65 to 74 Years | 97 (16.1%) | 24 (2.8%) |
| 75 Years and over | 182 (33.5%) | 29 (6.7%) |
Disability Class: Vision Difficulty
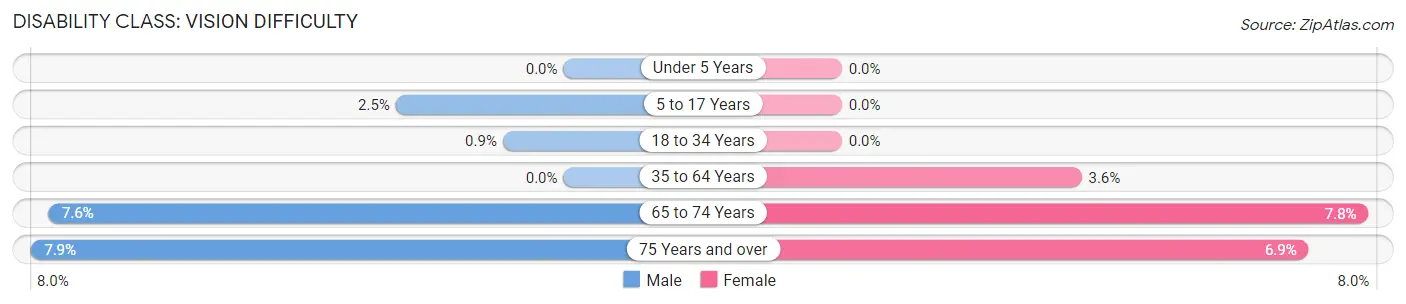
| Age Bracket | Male | Female |
| Under 5 Years | 0 (0.0%) | 0 (0.0%) |
| 5 to 17 Years | 69 (2.5%) | 0 (0.0%) |
| 18 to 34 Years | 20 (0.9%) | 0 (0.0%) |
| 35 to 64 Years | 0 (0.0%) | 166 (3.6%) |
| 65 to 74 Years | 46 (7.6%) | 66 (7.8%) |
| 75 Years and over | 43 (7.9%) | 30 (6.9%) |
Disability Class: Cognitive Difficulty
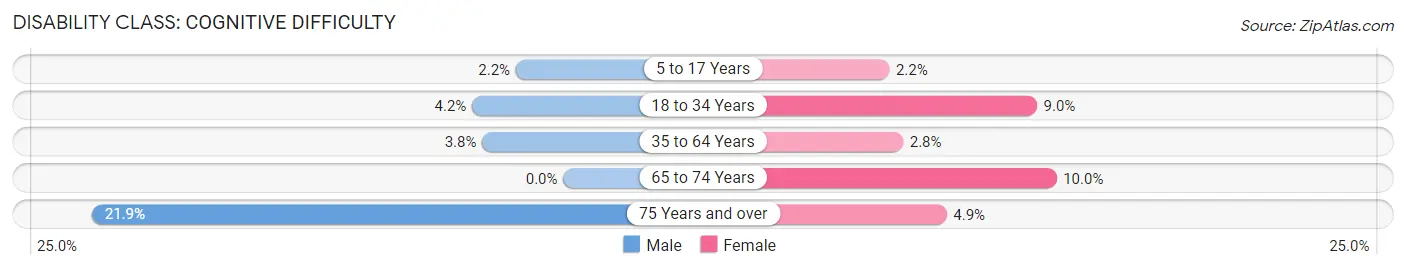
| Age Bracket | Male | Female |
| 5 to 17 Years | 61 (2.2%) | 54 (2.2%) |
| 18 to 34 Years | 94 (4.2%) | 181 (9.0%) |
| 35 to 64 Years | 166 (3.8%) | 132 (2.8%) |
| 65 to 74 Years | 0 (0.0%) | 84 (10.0%) |
| 75 Years and over | 119 (21.9%) | 21 (4.9%) |
Disability Class: Ambulatory Difficulty
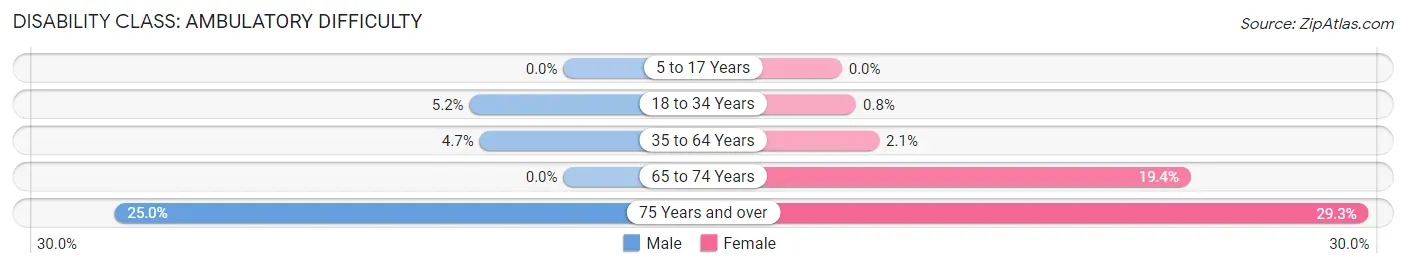
| Age Bracket | Male | Female |
| 5 to 17 Years | 0 (0.0%) | 0 (0.0%) |
| 18 to 34 Years | 116 (5.2%) | 16 (0.8%) |
| 35 to 64 Years | 206 (4.7%) | 97 (2.1%) |
| 65 to 74 Years | 0 (0.0%) | 164 (19.4%) |
| 75 Years and over | 136 (25.0%) | 127 (29.3%) |
Disability Class: Self-Care Difficulty
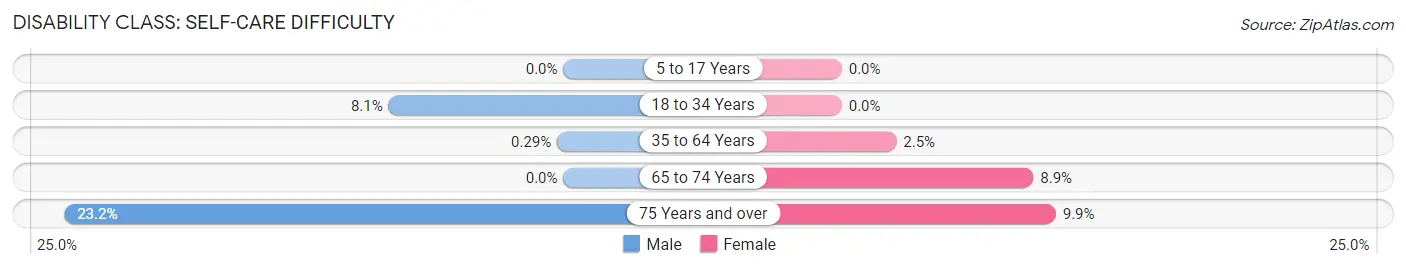
| Age Bracket | Male | Female |
| 5 to 17 Years | 0 (0.0%) | 0 (0.0%) |
| 18 to 34 Years | 180 (8.1%) | 0 (0.0%) |
| 35 to 64 Years | 13 (0.3%) | 118 (2.5%) |
| 65 to 74 Years | 0 (0.0%) | 75 (8.9%) |
| 75 Years and over | 126 (23.2%) | 43 (9.9%) |
Technology Access in Katy
Computing Device Access in Katy
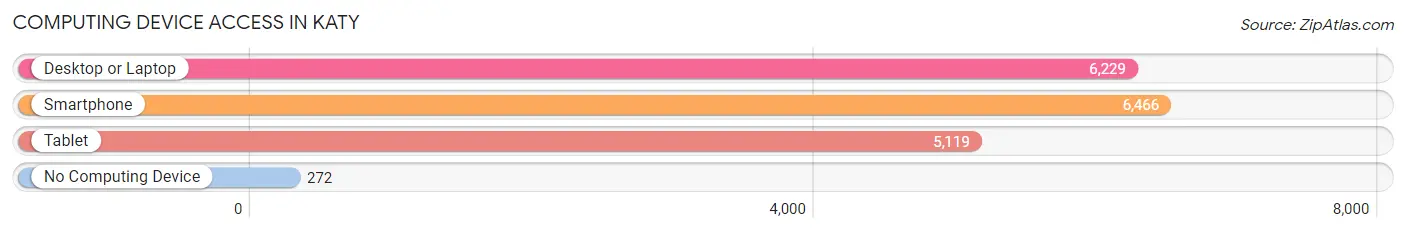
| Device Type | # Households | % Households |
| Desktop or Laptop | 6,229 | 89.1% |
| Smartphone | 6,466 | 92.5% |
| Tablet | 5,119 | 73.2% |
| No Computing Device | 272 | 3.9% |
| Total | 6,993 | 100.0% |
Internet Access in Katy
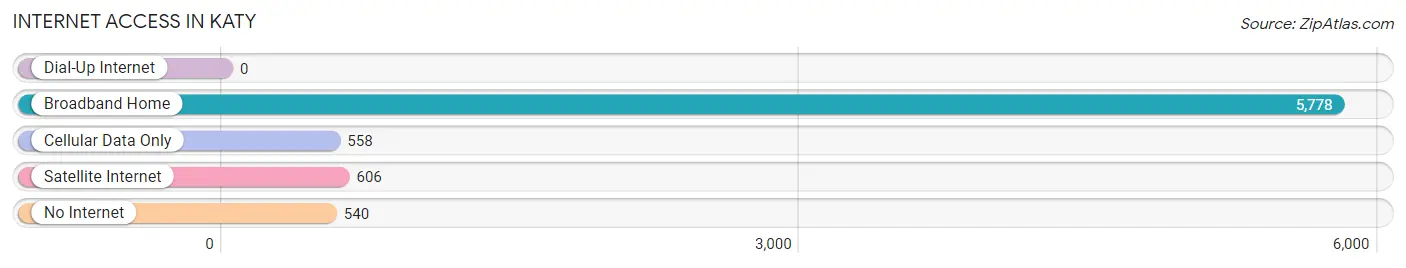
| Internet Type | # Households | % Households |
| Dial-Up Internet | 0 | 0.0% |
| Broadband Home | 5,778 | 82.6% |
| Cellular Data Only | 558 | 8.0% |
| Satellite Internet | 606 | 8.7% |
| No Internet | 540 | 7.7% |
| Total | 6,993 | 100.0% |
Katy Summary
Katy, Texas is a city located in the Greater Houston metropolitan area in Harris, Fort Bend, and Waller counties. It is located approximately 30 miles west of downtown Houston and is part of the Houston–The Woodlands–Sugar Land metropolitan area. The city is named after the nearby town of Katy, which was named after the Missouri–Kansas–Texas Railroad (commonly referred to as the "K-T Railroad").
History
The area that is now Katy was originally inhabited by the Atakapan Indians. The first settlers in the area were the James J. Crawford family, who arrived in 1872. The Crawfords built a log cabin and established a post office in 1877. The post office was named after the nearby town of Katy, which was named after the Missouri–Kansas–Texas Railroad (commonly referred to as the "K-T Railroad").
In 1895, the International-Great Northern Railroad was built through the area, and the town of Katy was established. The town grew rapidly, and by the early 1900s, it had become a thriving agricultural center. The town was incorporated in 1945, and the city of Katy was officially established in 1945.
Geography
Katy is located in the Greater Houston metropolitan area in Harris, Fort Bend, and Waller counties. It is located approximately 30 miles west of downtown Houston and is part of the Houston–The Woodlands–Sugar Land metropolitan area. The city is situated on the western edge of the Houston–Sugar Land–Baytown metropolitan area, and is bordered by the cities of Brookshire, Fulshear, and Cinco Ranch.
The city has a total area of 24.3 square miles, of which 24.2 square miles is land and 0.1 square miles is water. The city is located in the Katy Prairie, a flat, grassy area that is home to a variety of wildlife. The city is also located near the Brazos River, which provides recreational opportunities such as fishing and boating.
Economy
Katy is a major economic center in the Greater Houston area. The city is home to several major employers, including Academy Sports + Outdoors, Igloo Products Corporation, and FMC Technologies. The city is also home to several major shopping centers, including Katy Mills Mall, LaCenterra at Cinco Ranch, and Katy Asian Town.
The city is also home to several major educational institutions, including the University of Houston–Katy, Houston Community College–Katy, and Lone Star College–Katy.
Demographics
As of the 2010 census, the city had a population of 14,102. The racial makeup of the city was 73.2% White, 11.3% African American, 0.7% Native American, 5.2% Asian, 0.1% Pacific Islander, 6.2% from other races, and 3.3% from two or more races. Hispanic or Latino of any race were 20.3% of the population.
The median income for a household in the city was $68,945, and the median income for a family was $77,890. The per capita income for the city was $30,945. About 5.2% of families and 7.2% of the population were below the poverty line, including 8.3% of those under age 18 and 6.2% of those age 65 or over.
Common Questions
What is Per Capita Income in Katy?
Per Capita income in Katy is $46,184.
What is the Median Family Income in Katy?
Median Family Income in Katy is $133,479.
What is the Median Household income in Katy?
Median Household Income in Katy is $114,917.
What is Income or Wage Gap in Katy?
Income or Wage Gap in Katy is 44.9%.
Women in Katy earn 55.1 cents for every dollar earned by a man.
What is Inequality or Gini Index in Katy?
Inequality or Gini Index in Katy is 0.42.
What is the Total Population of Katy?
Total Population of Katy is 22,826.
What is the Total Male Population of Katy?
Total Male Population of Katy is 11,436.
What is the Total Female Population of Katy?
Total Female Population of Katy is 11,390.
What is the Ratio of Males per 100 Females in Katy?
There are 100.40 Males per 100 Females in Katy.
What is the Ratio of Females per 100 Males in Katy?
There are 99.60 Females per 100 Males in Katy.
What is the Median Population Age in Katy?
Median Population Age in Katy is 35.7 Years.
What is the Average Family Size in Katy
Average Family Size in Katy is 3.6 People.
What is the Average Household Size in Katy
Average Household Size in Katy is 3.2 People.
How Large is the Labor Force in Katy?
There are 11,072 People in the Labor Forcein in Katy.
What is the Percentage of People in the Labor Force in Katy?
66.1% of People are in the Labor Force in Katy.
What is the Unemployment Rate in Katy?
Unemployment Rate in Katy is 6.5%.