Pine Mountain, GA
Pine Mountain Map
Pine Mountain Overview
1,474
TOTAL POPULATION
556
MALE POPULATION
918
FEMALE POPULATION
60.57
MALES / 100 FEMALES
165.11
FEMALES / 100 MALES
43.4
MEDIAN AGE
3.2
AVG FAMILY SIZE
2.9
AVG HOUSEHOLD SIZE
$34,028
PER CAPITA INCOME
$78,906
AVG FAMILY INCOME
$59,471
AVG HOUSEHOLD INCOME
7.4%
WAGE / INCOME GAP [ % ]
92.6¢/ $1
WAGE / INCOME GAP [ $ ]
0.51
INEQUALITY / GINI INDEX
592
LABOR FORCE [ PEOPLE ]
55.2%
PERCENT IN LABOR FORCE
4.6%
UNEMPLOYMENT RATE
Pine Mountain Zip Codes
Pine Mountain Area Codes
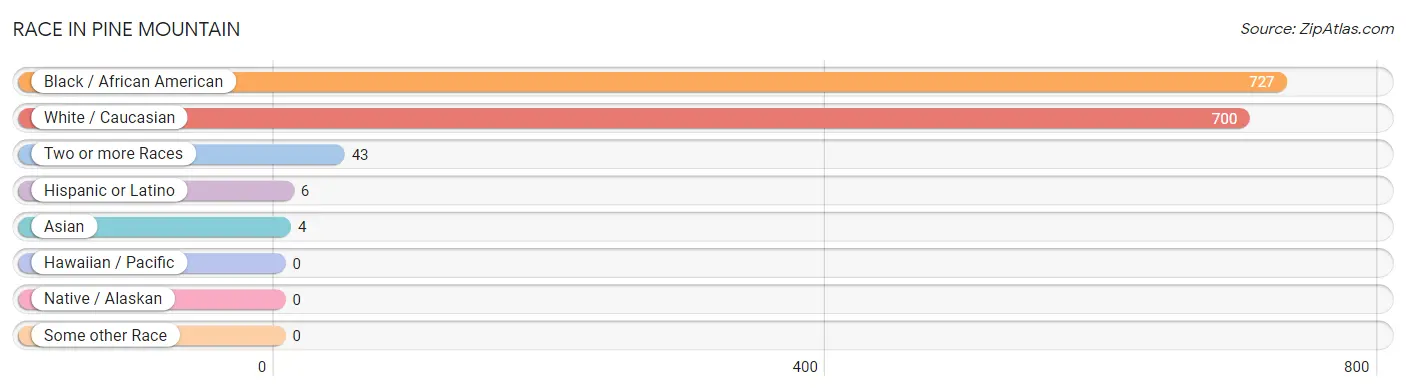
Race in Pine Mountain
The most populous races in Pine Mountain are Black / African American (727 | 49.3%), White / Caucasian (700 | 47.5%), and Two or more Races (43 | 2.9%).
| Race | # Population | % Population |
| Asian | 4 | 0.3% |
| Black / African American | 727 | 49.3% |
| Hawaiian / Pacific | 0 | 0.0% |
| Hispanic or Latino | 6 | 0.4% |
| Native / Alaskan | 0 | 0.0% |
| White / Caucasian | 700 | 47.5% |
| Two or more Races | 43 | 2.9% |
| Some other Race | 0 | 0.0% |
| Total | 1,474 | 100.0% |
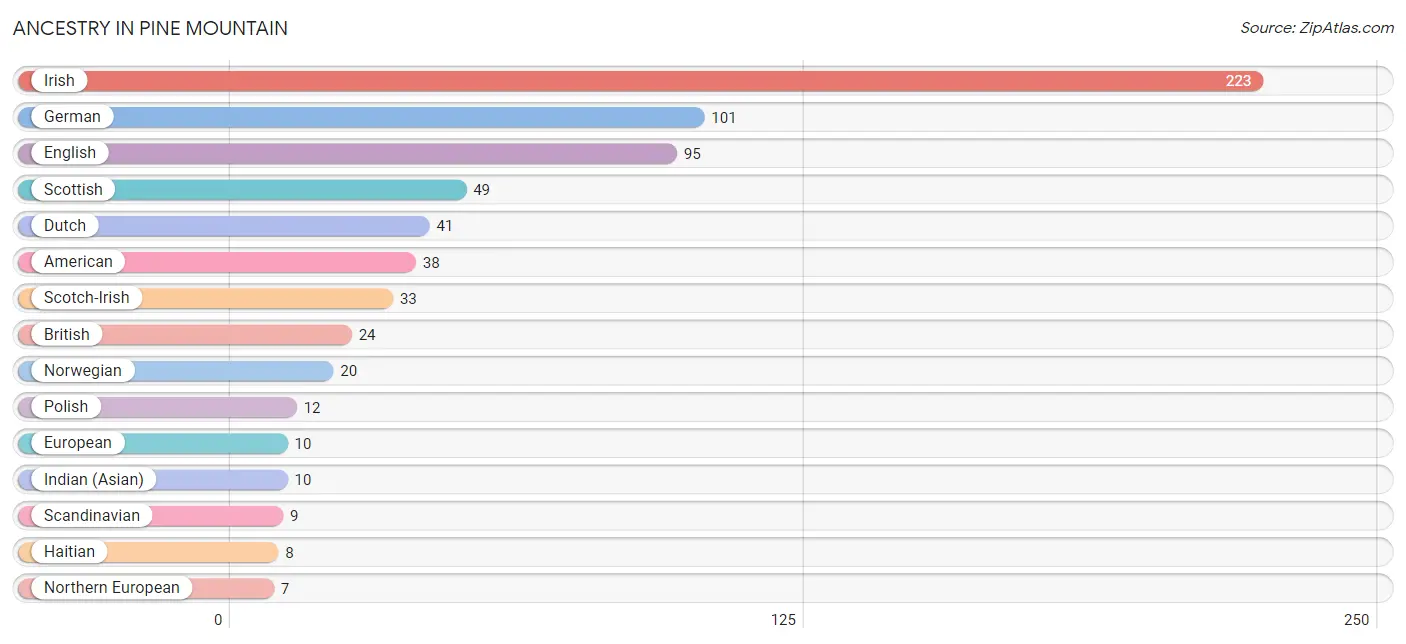
Ancestry in Pine Mountain
The most populous ancestries reported in Pine Mountain are Irish (223 | 15.1%), German (101 | 6.9%), English (95 | 6.5%), Scottish (49 | 3.3%), and Dutch (41 | 2.8%), together accounting for 34.5% of all Pine Mountain residents.
| Ancestry | # Population | % Population |
| American | 38 | 2.6% |
| British | 24 | 1.6% |
| Central American Indian | 6 | 0.4% |
| Danish | 3 | 0.2% |
| Dutch | 41 | 2.8% |
| Eastern European | 6 | 0.4% |
| English | 95 | 6.5% |
| European | 10 | 0.7% |
| French | 2 | 0.1% |
| German | 101 | 6.9% |
| Haitian | 8 | 0.5% |
| Indian (Asian) | 10 | 0.7% |
| Irish | 223 | 15.1% |
| Italian | 6 | 0.4% |
| Northern European | 7 | 0.5% |
| Norwegian | 20 | 1.4% |
| Polish | 12 | 0.8% |
| Puerto Rican | 6 | 0.4% |
| Russian | 3 | 0.2% |
| Scandinavian | 9 | 0.6% |
| Scotch-Irish | 33 | 2.2% |
| Scottish | 49 | 3.3% |
| Swiss | 3 | 0.2% | View All 23 Rows |
Immigrants in Pine Mountain
The most numerous immigrant groups reported in Pine Mountain came from , and Oceania (4 | 0.3%), together accounting for 0.3% of all Pine Mountain residents.

| Immigration Origin | # Population | % Population |
| Oceania | 4 | 0.3% | View All 1 Rows |
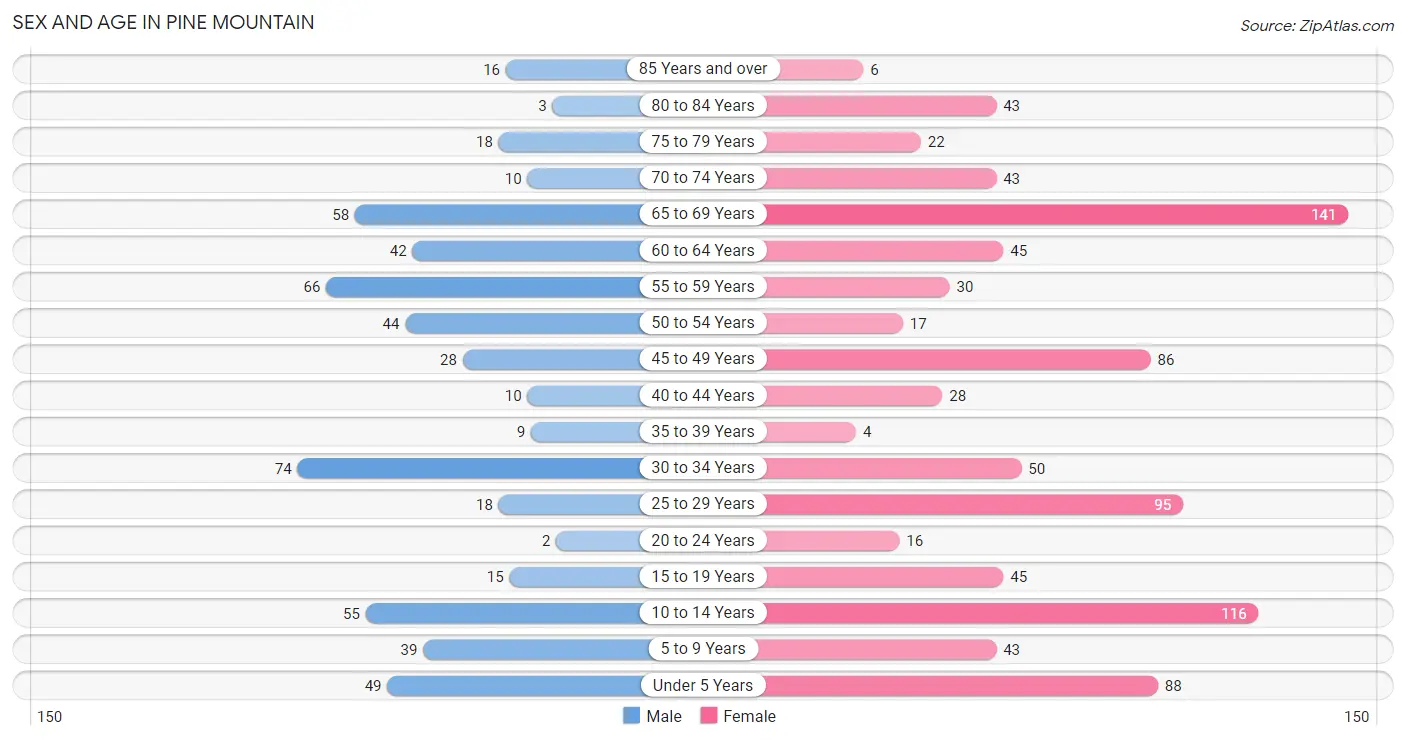
Sex and Age in Pine Mountain
Sex and Age in Pine Mountain
The most populous age groups in Pine Mountain are 30 to 34 Years (74 | 13.3%) for men and 65 to 69 Years (141 | 15.4%) for women.
| Age Bracket | Male | Female |
| Under 5 Years | 49 (8.8%) | 88 (9.6%) |
| 5 to 9 Years | 39 (7.0%) | 43 (4.7%) |
| 10 to 14 Years | 55 (9.9%) | 116 (12.6%) |
| 15 to 19 Years | 15 (2.7%) | 45 (4.9%) |
| 20 to 24 Years | 2 (0.4%) | 16 (1.7%) |
| 25 to 29 Years | 18 (3.2%) | 95 (10.3%) |
| 30 to 34 Years | 74 (13.3%) | 50 (5.4%) |
| 35 to 39 Years | 9 (1.6%) | 4 (0.4%) |
| 40 to 44 Years | 10 (1.8%) | 28 (3.0%) |
| 45 to 49 Years | 28 (5.0%) | 86 (9.4%) |
| 50 to 54 Years | 44 (7.9%) | 17 (1.8%) |
| 55 to 59 Years | 66 (11.9%) | 30 (3.3%) |
| 60 to 64 Years | 42 (7.5%) | 45 (4.9%) |
| 65 to 69 Years | 58 (10.4%) | 141 (15.4%) |
| 70 to 74 Years | 10 (1.8%) | 43 (4.7%) |
| 75 to 79 Years | 18 (3.2%) | 22 (2.4%) |
| 80 to 84 Years | 3 (0.5%) | 43 (4.7%) |
| 85 Years and over | 16 (2.9%) | 6 (0.6%) |
| Total | 556 (100.0%) | 918 (100.0%) |
Families and Households in Pine Mountain
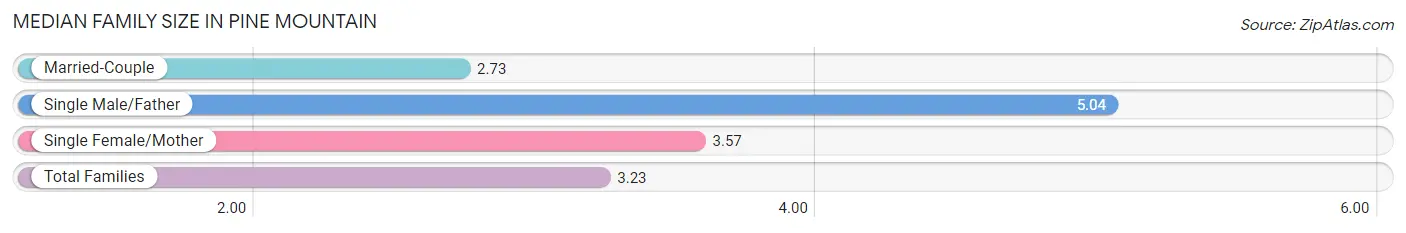
Median Family Size in Pine Mountain
The median family size in Pine Mountain is 3.23 persons per family, with single male/father families (27 | 6.8%) accounting for the largest median family size of 5.04 persons per family. On the other hand, married-couple families (206 | 52.1%) represent the smallest median family size with 2.73 persons per family.
| Family Type | # Families | Family Size |
| Married-Couple | 206 (52.1%) | 2.73 |
| Single Male/Father | 27 (6.8%) | 5.04 |
| Single Female/Mother | 162 (41.0%) | 3.57 |
| Total Families | 395 (100.0%) | 3.23 |
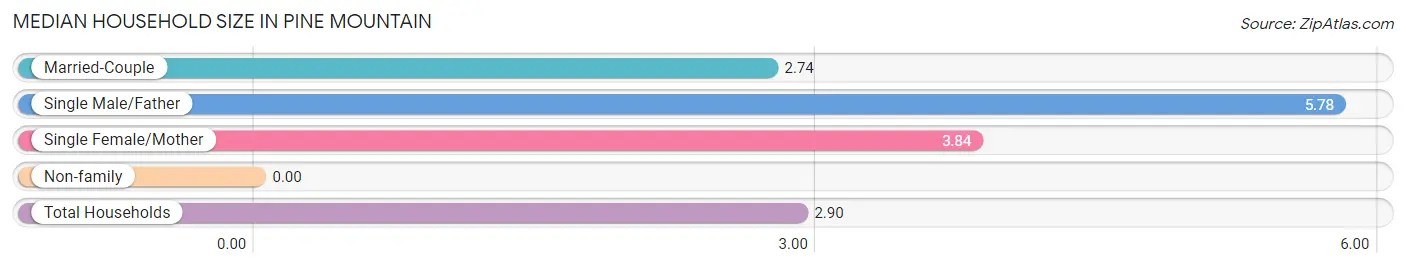
Median Household Size in Pine Mountain
| Household Type | # Households | Household Size |
| Married-Couple | 206 (41.3%) | 2.74 |
| Single Male/Father | 27 (5.4%) | 5.78 |
| Single Female/Mother | 162 (32.5%) | 3.84 |
| Non-family | 104 (20.8%) | - |
| Total Households | 499 (100.0%) | 2.90 |
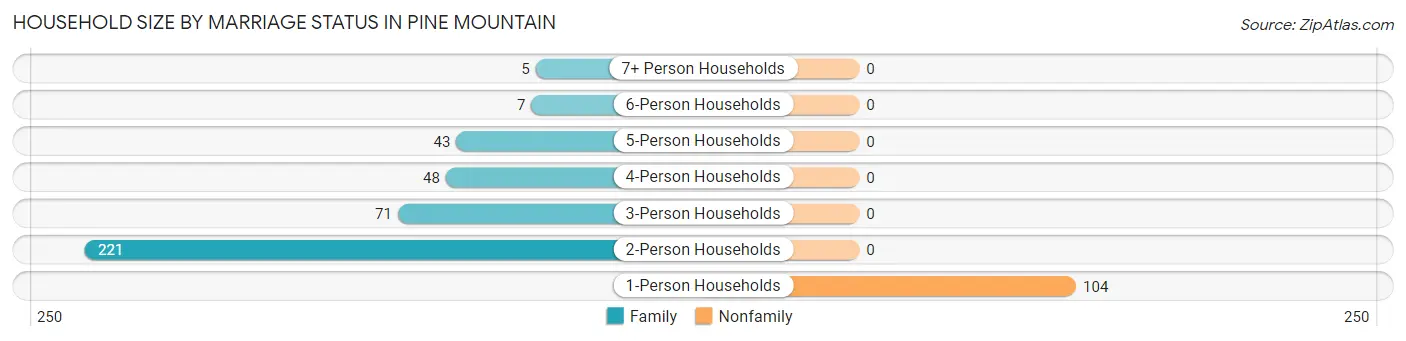
Household Size by Marriage Status in Pine Mountain
Out of a total of 499 households in Pine Mountain, 395 (79.2%) are family households, while 104 (20.8%) are nonfamily households. The most numerous type of family households are 2-person households, comprising 221, and the most common type of nonfamily households are 1-person households, comprising 104.
| Household Size | Family Households | Nonfamily Households |
| 1-Person Households | - | 104 (20.8%) |
| 2-Person Households | 221 (44.3%) | 0 (0.0%) |
| 3-Person Households | 71 (14.2%) | 0 (0.0%) |
| 4-Person Households | 48 (9.6%) | 0 (0.0%) |
| 5-Person Households | 43 (8.6%) | 0 (0.0%) |
| 6-Person Households | 7 (1.4%) | 0 (0.0%) |
| 7+ Person Households | 5 (1.0%) | 0 (0.0%) |
| Total | 395 (79.2%) | 104 (20.8%) |
Female Fertility in Pine Mountain
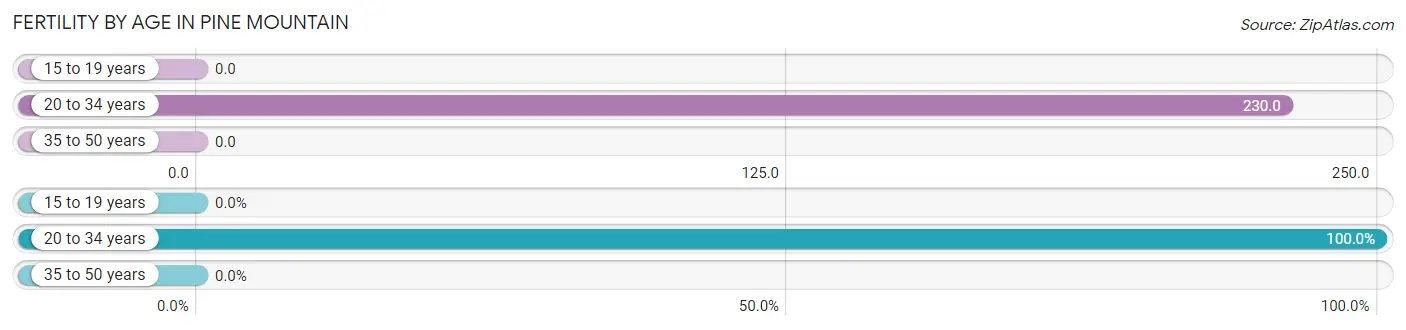
Fertility by Age in Pine Mountain
Average fertility rate in Pine Mountain is 112.0 births per 1,000 women. Women in the age bracket of 20 to 34 years have the highest fertility rate with 230.0 births per 1,000 women. Women in the age bracket of 20 to 34 years acount for 100.0% of all women with births.
| Age Bracket | Women with Births | Births / 1,000 Women |
| 15 to 19 years | 0 (0.0%) | 0.0 |
| 20 to 34 years | 37 (100.0%) | 230.0 |
| 35 to 50 years | 0 (0.0%) | 0.0 |
| Total | 37 (100.0%) | 112.0 |
Fertility by Age by Marriage Status in Pine Mountain
54.1% of women with births (37) in Pine Mountain are married. The highest percentage of unmarried women with births falls into 20 to 34 years age bracket with 46.0% of them unmarried at the time of birth, while the lowest percentage of unmarried women with births belong to 20 to 34 years age bracket with 46.0% of them unmarried.
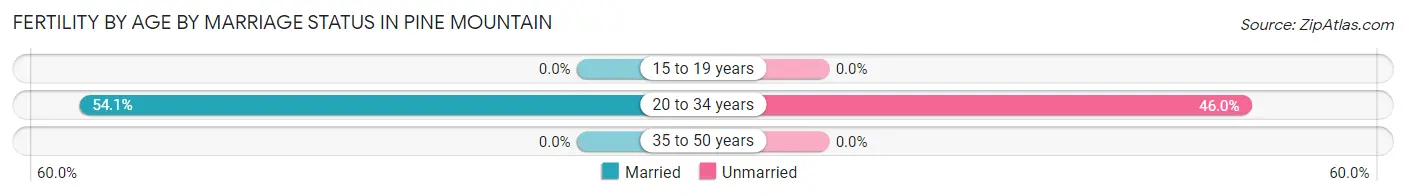
| Age Bracket | Married | Unmarried |
| 15 to 19 years | 0 (0.0%) | 0 (0.0%) |
| 20 to 34 years | 20 (54.0%) | 17 (46.0%) |
| 35 to 50 years | 0 (0.0%) | 0 (0.0%) |
| Total | 20 (54.0%) | 17 (46.0%) |
Fertility by Education in Pine Mountain
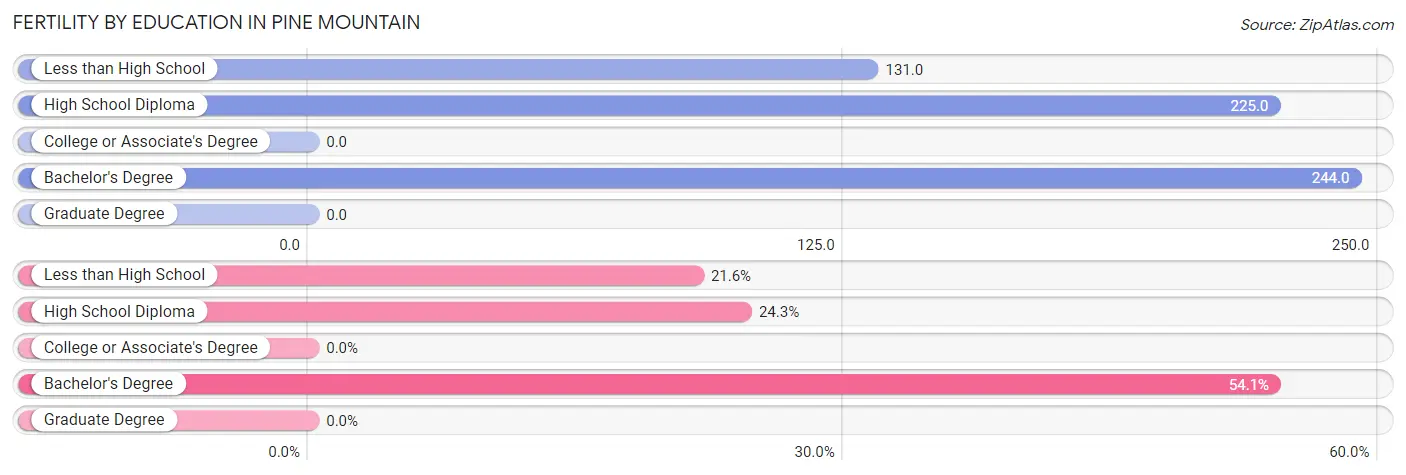
| Educational Attainment | Women with Births | Births / 1,000 Women |
| Less than High School | 8 (21.6%) | 131.0 |
| High School Diploma | 9 (24.3%) | 225.0 |
| College or Associate's Degree | 0 (0.0%) | 0.0 |
| Bachelor's Degree | 20 (54.0%) | 244.0 |
| Graduate Degree | 0 (0.0%) | 0.0 |
| Total | 37 (100.0%) | 112.0 |
Fertility by Education by Marriage Status in Pine Mountain
46.0% of women with births in Pine Mountain are unmarried. Women with the educational attainment of bachelor's degree are most likely to be married with 100.0% of them married at childbirth, while women with the educational attainment of less than high school are least likely to be married with 100.0% of them unmarried at childbirth.
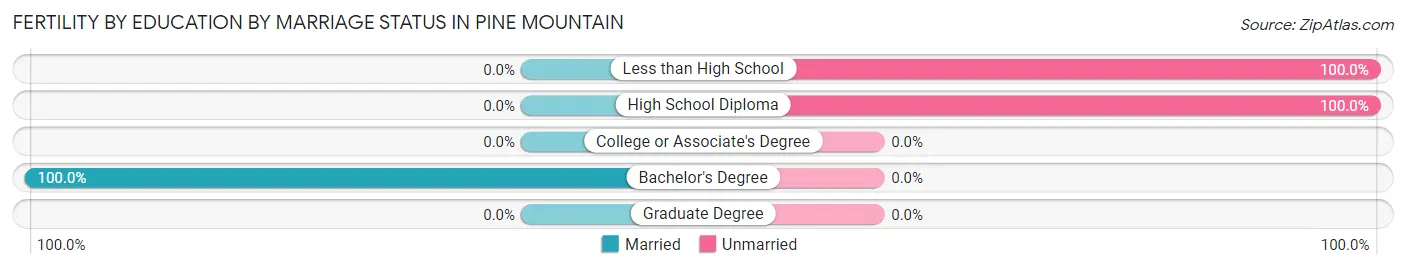
| Educational Attainment | Married | Unmarried |
| Less than High School | 0 (0.0%) | 8 (100.0%) |
| High School Diploma | 0 (0.0%) | 9 (100.0%) |
| College or Associate's Degree | 0 (0.0%) | 0 (0.0%) |
| Bachelor's Degree | 20 (100.0%) | 0 (0.0%) |
| Graduate Degree | 0 (0.0%) | 0 (0.0%) |
| Total | 20 (54.0%) | 17 (46.0%) |
Income in Pine Mountain
Income Overview in Pine Mountain
Per Capita Income in Pine Mountain is $34,028, while median incomes of families and households are $78,906 and $59,471 respectively.
| Characteristic | Number | Measure |
| Per Capita Income | 1,474 | $34,028 |
| Median Family Income | 395 | $78,906 |
| Mean Family Income | 395 | $98,769 |
| Median Household Income | 499 | $59,471 |
| Mean Household Income | 499 | $94,935 |
| Income Deficit | 395 | $0 |
| Wage / Income Gap (%) | 1,474 | 7.36% |
| Wage / Income Gap ($) | 1,474 | 92.64¢ per $1 |
| Gini / Inequality Index | 1,474 | 0.51 |
Earnings by Sex in Pine Mountain
Average Earnings in Pine Mountain are $40,565, $40,121 for men and $43,309 for women, a difference of 7.4%.
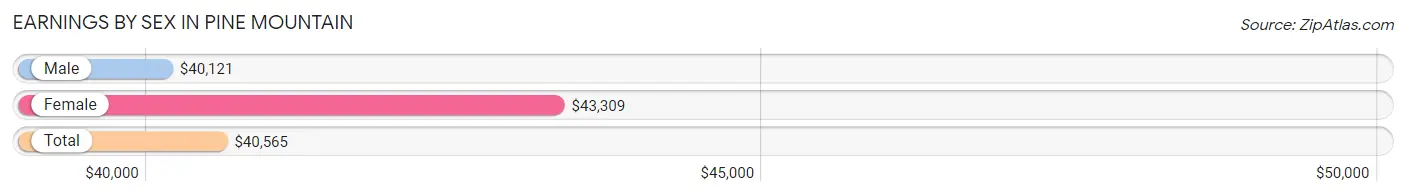
| Sex | Number | Average Earnings |
| Male | 255 (41.3%) | $40,121 |
| Female | 363 (58.7%) | $43,309 |
| Total | 618 (100.0%) | $40,565 |
Earnings by Sex by Income Bracket in Pine Mountain
The most common earnings brackets in Pine Mountain are $100,000+ for men (49 | 19.2%) and $55,000 to $64,999 for women (50 | 13.8%).
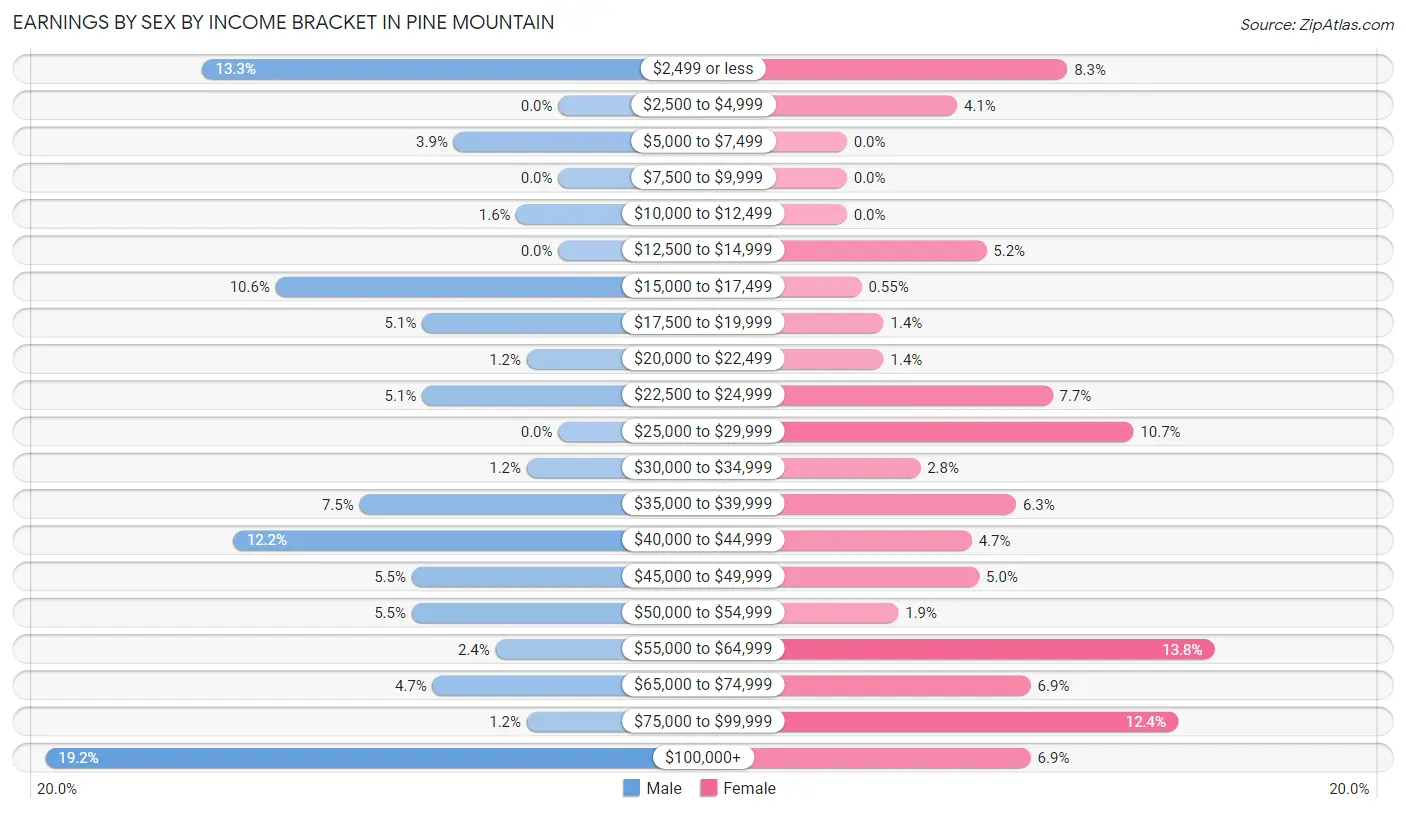
| Income | Male | Female |
| $2,499 or less | 34 (13.3%) | 30 (8.3%) |
| $2,500 to $4,999 | 0 (0.0%) | 15 (4.1%) |
| $5,000 to $7,499 | 10 (3.9%) | 0 (0.0%) |
| $7,500 to $9,999 | 0 (0.0%) | 0 (0.0%) |
| $10,000 to $12,499 | 4 (1.6%) | 0 (0.0%) |
| $12,500 to $14,999 | 0 (0.0%) | 19 (5.2%) |
| $15,000 to $17,499 | 27 (10.6%) | 2 (0.5%) |
| $17,500 to $19,999 | 13 (5.1%) | 5 (1.4%) |
| $20,000 to $22,499 | 3 (1.2%) | 5 (1.4%) |
| $22,500 to $24,999 | 13 (5.1%) | 28 (7.7%) |
| $25,000 to $29,999 | 0 (0.0%) | 39 (10.7%) |
| $30,000 to $34,999 | 3 (1.2%) | 10 (2.8%) |
| $35,000 to $39,999 | 19 (7.4%) | 23 (6.3%) |
| $40,000 to $44,999 | 31 (12.2%) | 17 (4.7%) |
| $45,000 to $49,999 | 14 (5.5%) | 18 (5.0%) |
| $50,000 to $54,999 | 14 (5.5%) | 7 (1.9%) |
| $55,000 to $64,999 | 6 (2.4%) | 50 (13.8%) |
| $65,000 to $74,999 | 12 (4.7%) | 25 (6.9%) |
| $75,000 to $99,999 | 3 (1.2%) | 45 (12.4%) |
| $100,000+ | 49 (19.2%) | 25 (6.9%) |
| Total | 255 (100.0%) | 363 (100.0%) |
Earnings by Sex by Educational Attainment in Pine Mountain
Average earnings in Pine Mountain are $40,565 for men and $44,265 for women, a difference of 8.4%. Men with an educational attainment of graduate degree enjoy the highest average annual earnings of $69,167, while those with college or associate's degree education earn the least with $35,139. Women with an educational attainment of bachelor's degree earn the most with the average annual earnings of $58,438, while those with college or associate's degree education have the smallest earnings of $57,917.
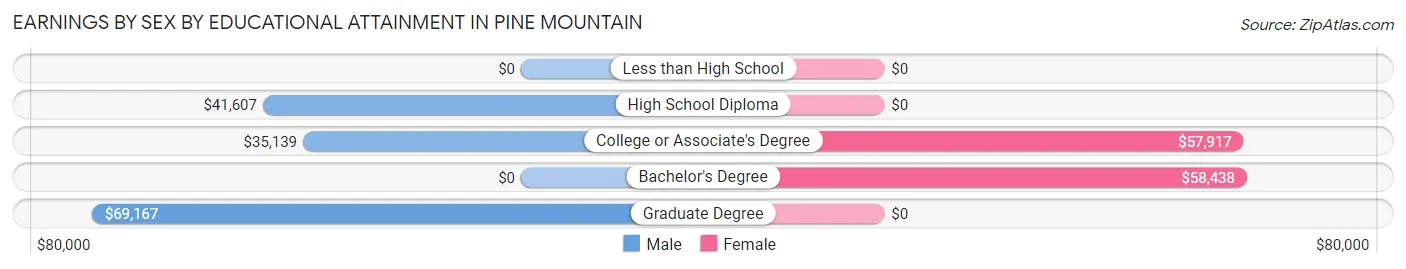
| Educational Attainment | Male Income | Female Income |
| Less than High School | - | - |
| High School Diploma | $41,607 | $0 |
| College or Associate's Degree | $35,139 | $57,917 |
| Bachelor's Degree | - | - |
| Graduate Degree | $69,167 | $0 |
| Total | $40,565 | $44,265 |
Family Income in Pine Mountain
Family Income Brackets in Pine Mountain
According to the Pine Mountain family income data, there are 86 families falling into the $100,000 to $149,999 income range, which is the most common income bracket and makes up 21.8% of all families. Conversely, the $15,000 to $24,999 income bracket is the least frequent group with only 8 families (2.0%) belonging to this category.
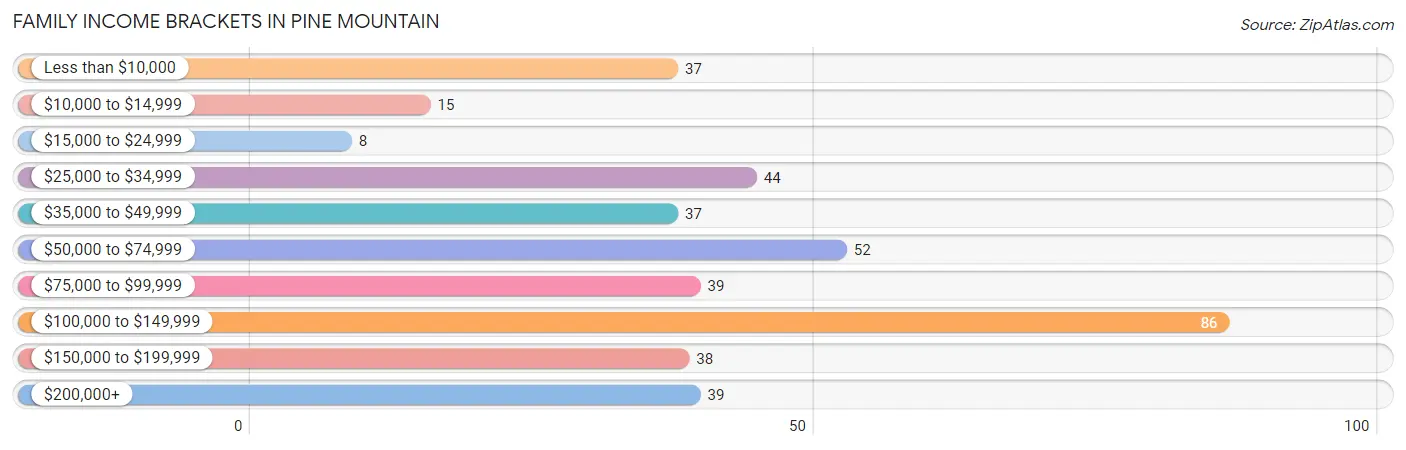
| Income Bracket | # Families | % Families |
| Less than $10,000 | 37 | 9.4% |
| $10,000 to $14,999 | 15 | 3.8% |
| $15,000 to $24,999 | 8 | 2.0% |
| $25,000 to $34,999 | 44 | 11.1% |
| $35,000 to $49,999 | 37 | 9.4% |
| $50,000 to $74,999 | 52 | 13.2% |
| $75,000 to $99,999 | 39 | 9.9% |
| $100,000 to $149,999 | 86 | 21.8% |
| $150,000 to $199,999 | 38 | 9.6% |
| $200,000+ | 39 | 9.9% |
Family Income by Famaliy Size in Pine Mountain
4-person families (54 | 13.7%) account for the highest median family income in Pine Mountain with $86,000 per family, while 2-person families (228 | 57.7%) have the highest median income of $42,000 per family member.
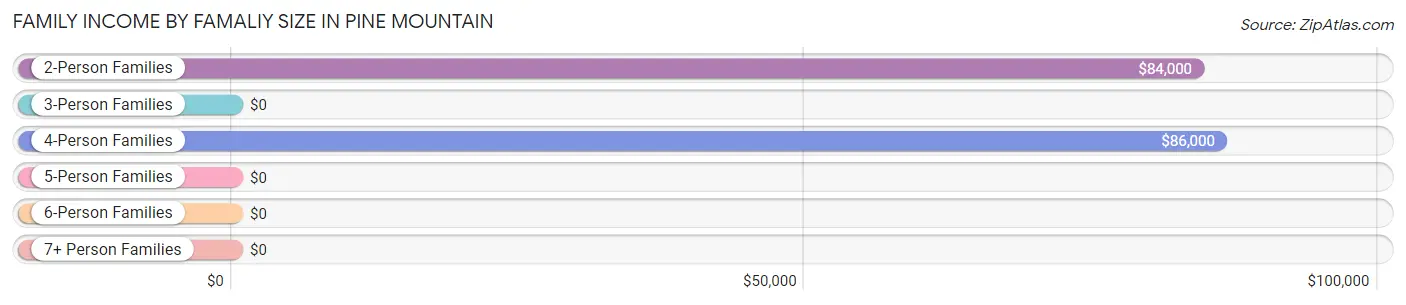
| Income Bracket | # Families | Median Income |
| 2-Person Families | 228 (57.7%) | $84,000 |
| 3-Person Families | 71 (18.0%) | $0 |
| 4-Person Families | 54 (13.7%) | $86,000 |
| 5-Person Families | 42 (10.6%) | $0 |
| 6-Person Families | 0 (0.0%) | $0 |
| 7+ Person Families | 0 (0.0%) | $0 |
| Total | 395 (100.0%) | $78,906 |
Family Income by Number of Earners in Pine Mountain
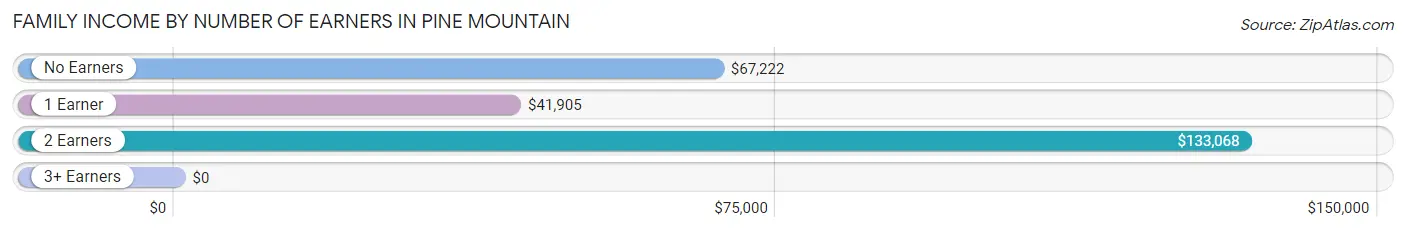
| Number of Earners | # Families | Median Income |
| No Earners | 58 (14.7%) | $67,222 |
| 1 Earner | 204 (51.6%) | $41,905 |
| 2 Earners | 133 (33.7%) | $133,068 |
| 3+ Earners | 0 (0.0%) | $0 |
| Total | 395 (100.0%) | $78,906 |
Household Income in Pine Mountain
Household Income Brackets in Pine Mountain
With 87 households falling in the category, the $100,000 to $149,999 income range is the most frequent in Pine Mountain, accounting for 17.4% of all households. In contrast, only 15 households (3.0%) fall into the $10,000 to $14,999 income bracket, making it the least populous group.
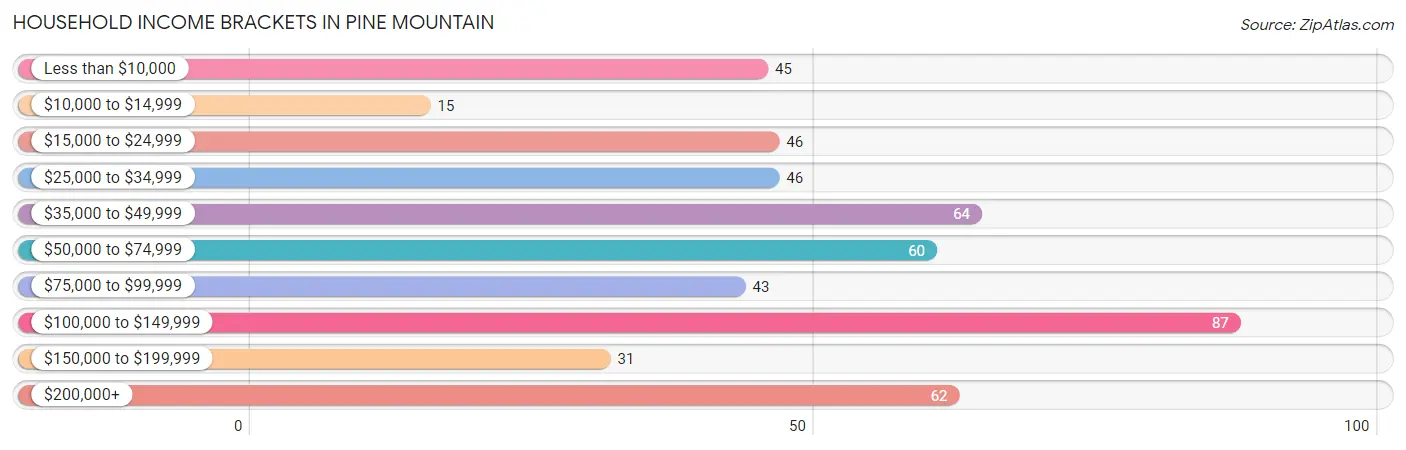
| Income Bracket | # Households | % Households |
| Less than $10,000 | 45 | 9.0% |
| $10,000 to $14,999 | 15 | 3.0% |
| $15,000 to $24,999 | 46 | 9.2% |
| $25,000 to $34,999 | 46 | 9.2% |
| $35,000 to $49,999 | 64 | 12.8% |
| $50,000 to $74,999 | 60 | 12.0% |
| $75,000 to $99,999 | 43 | 8.6% |
| $100,000 to $149,999 | 87 | 17.4% |
| $150,000 to $199,999 | 31 | 6.2% |
| $200,000+ | 62 | 12.4% |
Household Income by Householder Age in Pine Mountain
The median household income in Pine Mountain is $59,471, with the highest median household income of $97,614 found in the 25 to 44 years age bracket for the primary householder. A total of 119 households (23.8%) fall into this category. Meanwhile, the 15 to 24 years age bracket for the primary householder has the lowest median household income of $0, with 10 households (2.0%) in this group.
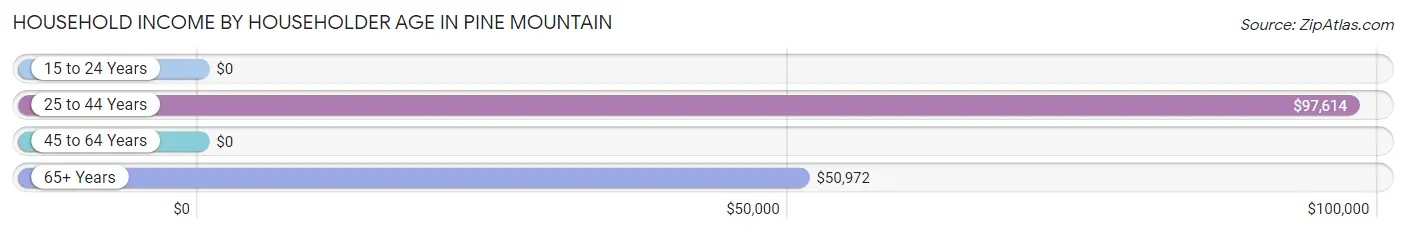
| Income Bracket | # Households | Median Income |
| 15 to 24 Years | 10 (2.0%) | $0 |
| 25 to 44 Years | 119 (23.8%) | $97,614 |
| 45 to 64 Years | 193 (38.7%) | $0 |
| 65+ Years | 177 (35.5%) | $50,972 |
| Total | 499 (100.0%) | $59,471 |
Poverty in Pine Mountain
Income Below Poverty by Sex and Age in Pine Mountain
With 13.9% poverty level for males and 20.5% for females among the residents of Pine Mountain, 45 to 54 year old males and 16 and 17 year old females are the most vulnerable to poverty, with 41 males (56.9%) and 22 females (100.0%) in their respective age groups living below the poverty level.
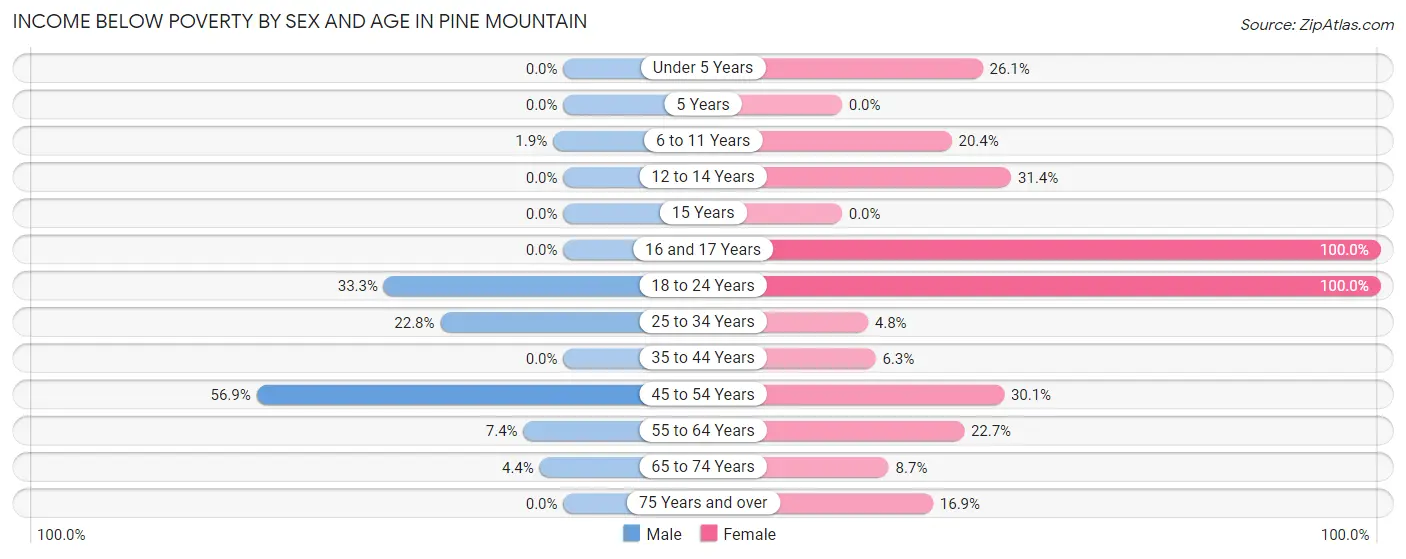
| Age Bracket | Male | Female |
| Under 5 Years | 0 (0.0%) | 23 (26.1%) |
| 5 Years | 0 (0.0%) | 0 (0.0%) |
| 6 to 11 Years | 1 (1.9%) | 11 (20.4%) |
| 12 to 14 Years | 0 (0.0%) | 33 (31.4%) |
| 15 Years | 0 (0.0%) | 0 (0.0%) |
| 16 and 17 Years | 0 (0.0%) | 22 (100.0%) |
| 18 to 24 Years | 2 (33.3%) | 11 (100.0%) |
| 25 to 34 Years | 21 (22.8%) | 7 (4.8%) |
| 35 to 44 Years | 0 (0.0%) | 2 (6.2%) |
| 45 to 54 Years | 41 (56.9%) | 31 (30.1%) |
| 55 to 64 Years | 8 (7.4%) | 17 (22.7%) |
| 65 to 74 Years | 3 (4.4%) | 16 (8.7%) |
| 75 Years and over | 0 (0.0%) | 12 (16.9%) |
| Total | 76 (13.9%) | 185 (20.5%) |
Income Above Poverty by Sex and Age in Pine Mountain
According to the poverty statistics in Pine Mountain, males aged under 5 years and females aged 15 years are the age groups that are most secure financially, with 100.0% of males and 100.0% of females in these age groups living above the poverty line.
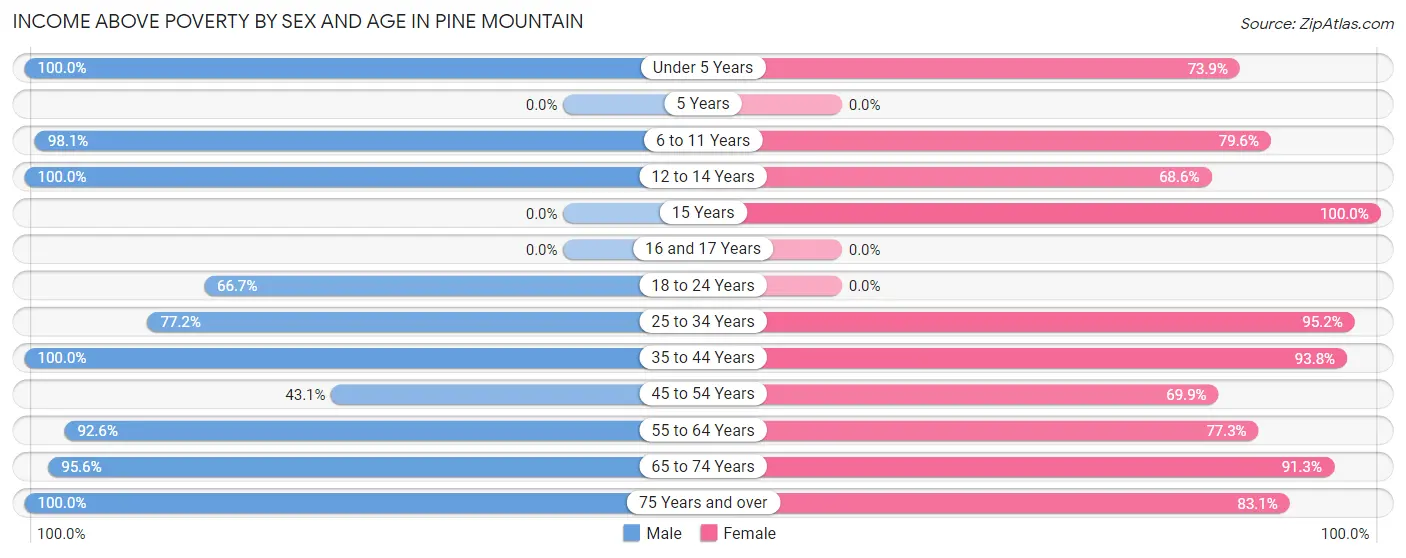
| Age Bracket | Male | Female |
| Under 5 Years | 49 (100.0%) | 65 (73.9%) |
| 5 Years | 0 (0.0%) | 0 (0.0%) |
| 6 to 11 Years | 51 (98.1%) | 43 (79.6%) |
| 12 to 14 Years | 42 (100.0%) | 72 (68.6%) |
| 15 Years | 0 (0.0%) | 12 (100.0%) |
| 16 and 17 Years | 0 (0.0%) | 0 (0.0%) |
| 18 to 24 Years | 4 (66.7%) | 0 (0.0%) |
| 25 to 34 Years | 71 (77.2%) | 138 (95.2%) |
| 35 to 44 Years | 19 (100.0%) | 30 (93.8%) |
| 45 to 54 Years | 31 (43.1%) | 72 (69.9%) |
| 55 to 64 Years | 100 (92.6%) | 58 (77.3%) |
| 65 to 74 Years | 65 (95.6%) | 168 (91.3%) |
| 75 Years and over | 37 (100.0%) | 59 (83.1%) |
| Total | 469 (86.1%) | 717 (79.5%) |
Income Below Poverty Among Married-Couple Families in Pine Mountain
The poverty statistics for married-couple families in Pine Mountain show that 2.4% or 5 of the total 206 families live below the poverty line. Families with 1 or 2 children have the highest poverty rate of 4.0%, comprising of 2 families. On the other hand, families with 3 or 4 children have the lowest poverty rate of 0.0%, which includes 0 families.
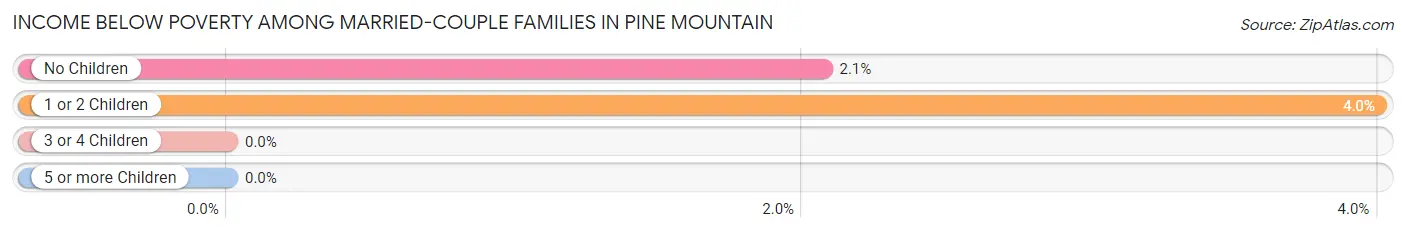
| Children | Above Poverty | Below Poverty |
| No Children | 142 (97.9%) | 3 (2.1%) |
| 1 or 2 Children | 48 (96.0%) | 2 (4.0%) |
| 3 or 4 Children | 11 (100.0%) | 0 (0.0%) |
| 5 or more Children | 0 (0.0%) | 0 (0.0%) |
| Total | 201 (97.6%) | 5 (2.4%) |
Income Below Poverty Among Single-Parent Households in Pine Mountain
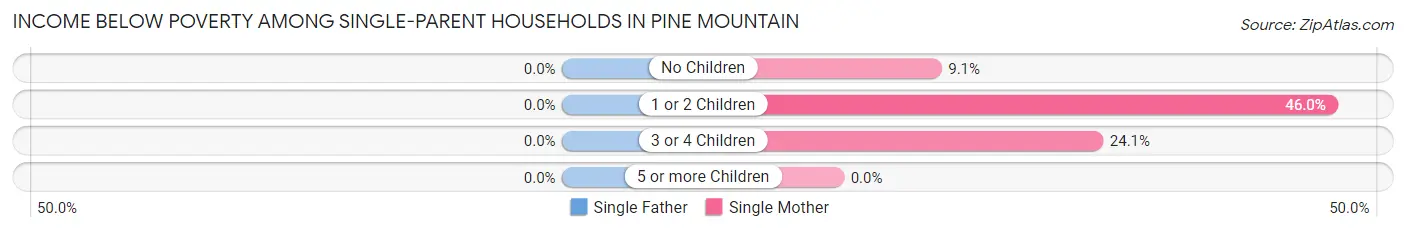
| Children | Single Father | Single Mother |
| No Children | 0 (0.0%) | 3 (9.1%) |
| 1 or 2 Children | 0 (0.0%) | 46 (46.0%) |
| 3 or 4 Children | 0 (0.0%) | 7 (24.1%) |
| 5 or more Children | 0 (0.0%) | 0 (0.0%) |
| Total | 0 (0.0%) | 56 (34.6%) |
Income Below Poverty Among Married-Couple vs Single-Parent Households in Pine Mountain
The poverty data for Pine Mountain shows that 5 of the married-couple family households (2.4%) and 56 of the single-parent households (29.6%) are living below the poverty level. Within the married-couple family households, those with 1 or 2 children have the highest poverty rate, with 2 households (4.0%) falling below the poverty line. Among the single-parent households, those with 1 or 2 children have the highest poverty rate, with 46 household (43.0%) living below poverty.
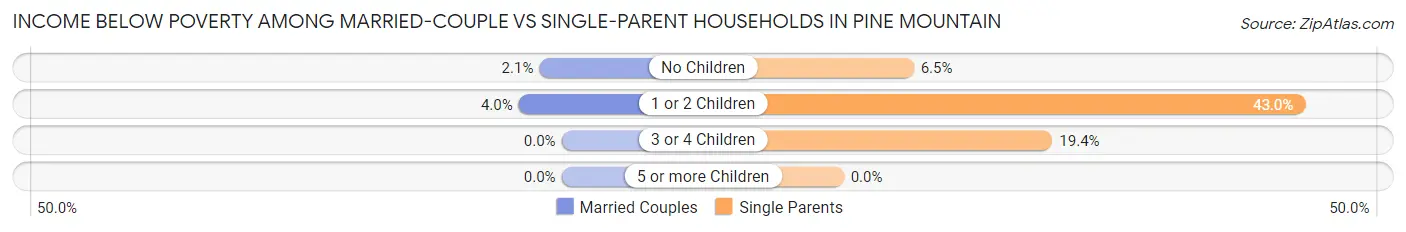
| Children | Married-Couple Families | Single-Parent Households |
| No Children | 3 (2.1%) | 3 (6.5%) |
| 1 or 2 Children | 2 (4.0%) | 46 (43.0%) |
| 3 or 4 Children | 0 (0.0%) | 7 (19.4%) |
| 5 or more Children | 0 (0.0%) | 0 (0.0%) |
| Total | 5 (2.4%) | 56 (29.6%) |
Employment Characteristics in Pine Mountain
Employment by Class of Employer in Pine Mountain
Among the 535 employed individuals in Pine Mountain, private company employees (266 | 49.7%), not-for-profit organizations (118 | 22.1%), and local government employees (55 | 10.3%) make up the most common classes of employment.
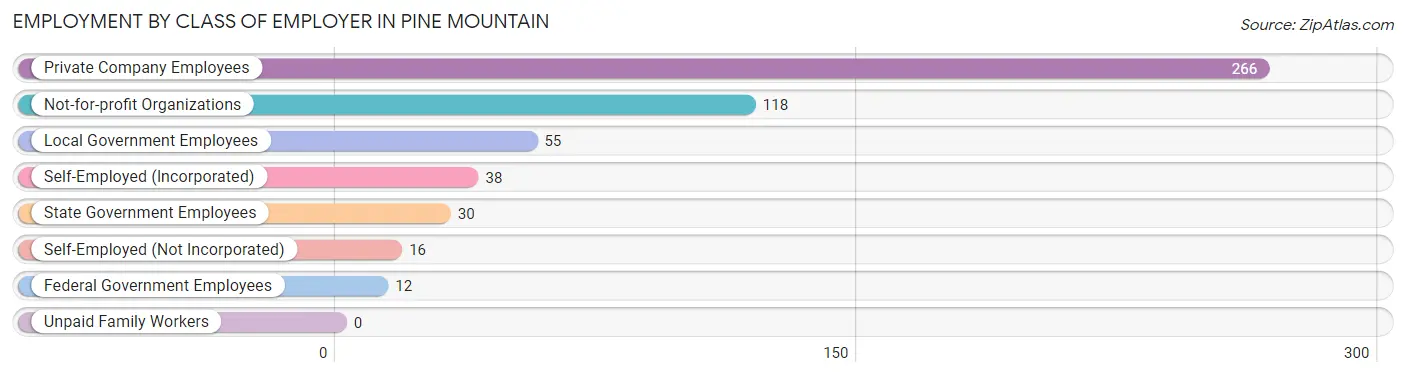
| Employer Class | # Employees | % Employees |
| Private Company Employees | 266 | 49.7% |
| Self-Employed (Incorporated) | 38 | 7.1% |
| Self-Employed (Not Incorporated) | 16 | 3.0% |
| Not-for-profit Organizations | 118 | 22.1% |
| Local Government Employees | 55 | 10.3% |
| State Government Employees | 30 | 5.6% |
| Federal Government Employees | 12 | 2.2% |
| Unpaid Family Workers | 0 | 0.0% |
| Total | 535 | 100.0% |
Employment Status by Age in Pine Mountain
According to the labor force statistics for Pine Mountain, out of the total population over 16 years of age (1,072), 55.2% or 592 individuals are in the labor force, with 4.6% or 27 of them unemployed. The age group with the highest labor force participation rate is 25 to 29 years, with 97.3% or 110 individuals in the labor force. Within the labor force, the 16 to 19 years age range has the highest percentage of unemployed individuals, with 63.2% or 12 of them being unemployed.
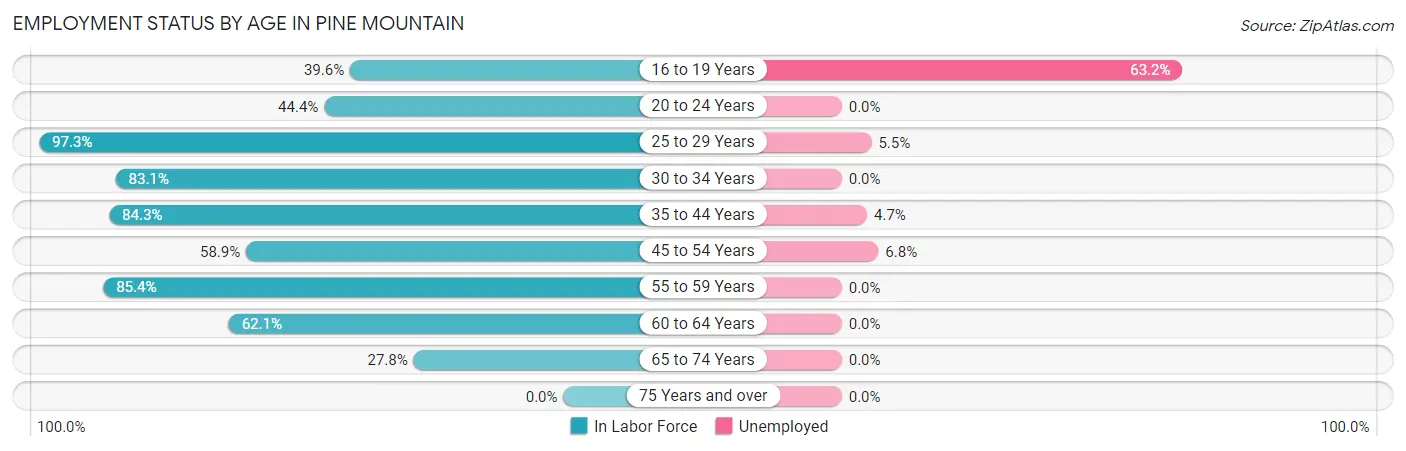
| Age Bracket | In Labor Force | Unemployed |
| 16 to 19 Years | 19 (39.6%) | 12 (63.2%) |
| 20 to 24 Years | 8 (44.4%) | 0 (0.0%) |
| 25 to 29 Years | 110 (97.3%) | 6 (5.5%) |
| 30 to 34 Years | 103 (83.1%) | 0 (0.0%) |
| 35 to 44 Years | 43 (84.3%) | 2 (4.7%) |
| 45 to 54 Years | 103 (58.9%) | 7 (6.8%) |
| 55 to 59 Years | 82 (85.4%) | 0 (0.0%) |
| 60 to 64 Years | 54 (62.1%) | 0 (0.0%) |
| 65 to 74 Years | 70 (27.8%) | 0 (0.0%) |
| 75 Years and over | 0 (0.0%) | 0 (0.0%) |
| Total | 592 (55.2%) | 27 (4.6%) |
Employment Status by Educational Attainment in Pine Mountain
According to labor force statistics for Pine Mountain, 76.6% of individuals (495) out of the total population between 25 and 64 years of age (646) are in the labor force, with 3.0% or 15 of them being unemployed. The group with the highest labor force participation rate are those with the educational attainment of college / associate degree, with 98.5% or 193 individuals in the labor force. Within the labor force, individuals with less than high school education have the highest percentage of unemployment, with 14.3% or 2 of them being unemployed.
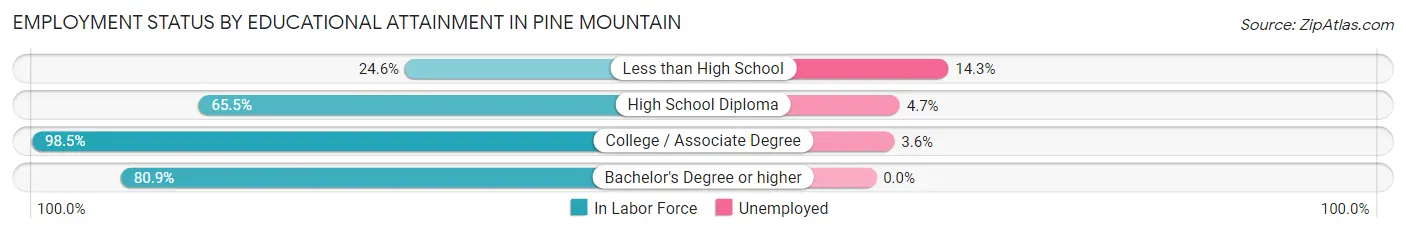
| Educational Attainment | In Labor Force | Unemployed |
| Less than High School | 14 (24.6%) | 8 (14.3%) |
| High School Diploma | 127 (65.5%) | 9 (4.7%) |
| College / Associate Degree | 193 (98.5%) | 7 (3.6%) |
| Bachelor's Degree or higher | 161 (80.9%) | 0 (0.0%) |
| Total | 495 (76.6%) | 19 (3.0%) |
Employment Occupations by Sex in Pine Mountain
Management, Business, Science and Arts Occupations
The most common Management, Business, Science and Arts occupations in Pine Mountain are Community & Social Service (58 | 10.3%), Business & Financial (42 | 7.4%), Health Diagnosing & Treating (41 | 7.3%), Management (38 | 6.7%), and Education Instruction & Library (38 | 6.7%).

Management, Business, Science and Arts Occupations by Sex
Within the Management, Business, Science and Arts occupations in Pine Mountain, the most male-oriented occupations are Computers & Mathematics (100.0%), Management (63.2%), and Arts, Media & Entertainment (37.5%), while the most female-oriented occupations are Business & Financial (100.0%), Health Technologists (100.0%), and Life, Physical & Social Science (90.5%).
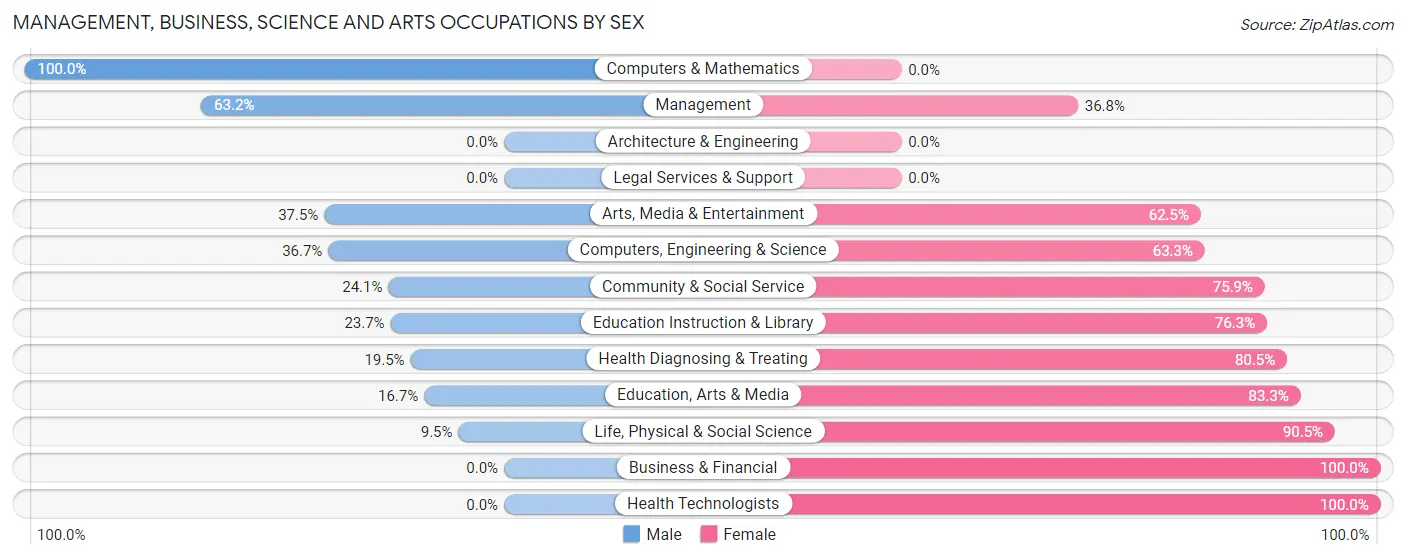
| Occupation | Male | Female |
| Management | 24 (63.2%) | 14 (36.8%) |
| Business & Financial | 0 (0.0%) | 42 (100.0%) |
| Computers, Engineering & Science | 11 (36.7%) | 19 (63.3%) |
| Computers & Mathematics | 9 (100.0%) | 0 (0.0%) |
| Architecture & Engineering | 0 (0.0%) | 0 (0.0%) |
| Life, Physical & Social Science | 2 (9.5%) | 19 (90.5%) |
| Community & Social Service | 14 (24.1%) | 44 (75.9%) |
| Education, Arts & Media | 2 (16.7%) | 10 (83.3%) |
| Legal Services & Support | 0 (0.0%) | 0 (0.0%) |
| Education Instruction & Library | 9 (23.7%) | 29 (76.3%) |
| Arts, Media & Entertainment | 3 (37.5%) | 5 (62.5%) |
| Health Diagnosing & Treating | 8 (19.5%) | 33 (80.5%) |
| Health Technologists | 0 (0.0%) | 23 (100.0%) |
| Total (Category) | 57 (27.3%) | 152 (72.7%) |
| Total (Overall) | 225 (39.8%) | 340 (60.2%) |
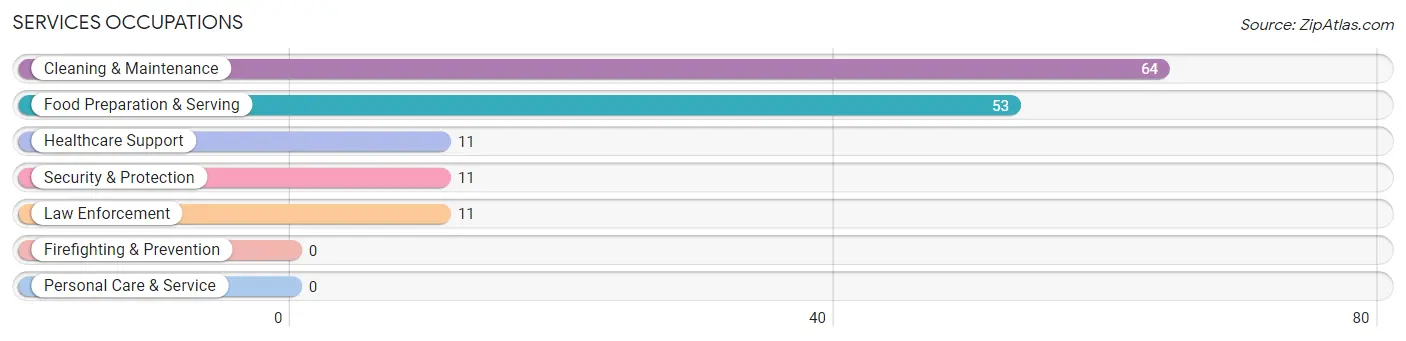
Services Occupations
The most common Services occupations in Pine Mountain are Cleaning & Maintenance (64 | 11.3%), Food Preparation & Serving (53 | 9.4%), Healthcare Support (11 | 1.9%), Security & Protection (11 | 1.9%), and Law Enforcement (11 | 1.9%).
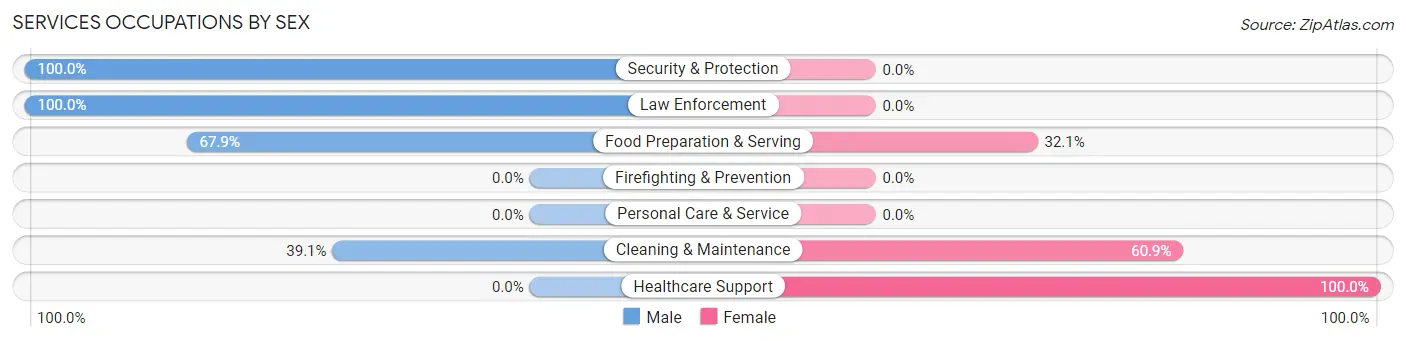
Services Occupations by Sex
Within the Services occupations in Pine Mountain, the most male-oriented occupations are Security & Protection (100.0%), Law Enforcement (100.0%), and Food Preparation & Serving (67.9%), while the most female-oriented occupations are Healthcare Support (100.0%), Cleaning & Maintenance (60.9%), and Food Preparation & Serving (32.1%).
| Occupation | Male | Female |
| Healthcare Support | 0 (0.0%) | 11 (100.0%) |
| Security & Protection | 11 (100.0%) | 0 (0.0%) |
| Firefighting & Prevention | 0 (0.0%) | 0 (0.0%) |
| Law Enforcement | 11 (100.0%) | 0 (0.0%) |
| Food Preparation & Serving | 36 (67.9%) | 17 (32.1%) |
| Cleaning & Maintenance | 25 (39.1%) | 39 (60.9%) |
| Personal Care & Service | 0 (0.0%) | 0 (0.0%) |
| Total (Category) | 72 (51.8%) | 67 (48.2%) |
| Total (Overall) | 225 (39.8%) | 340 (60.2%) |
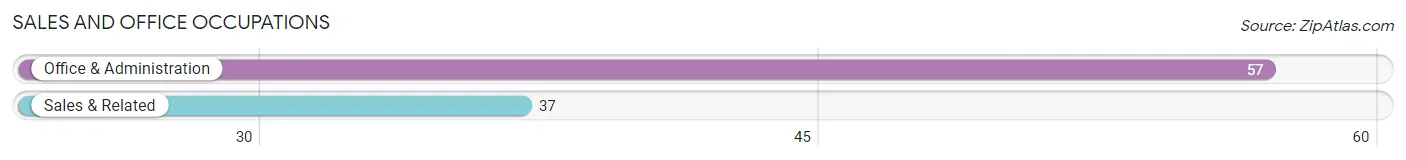
Sales and Office Occupations
The most common Sales and Office occupations in Pine Mountain are Office & Administration (57 | 10.1%), and Sales & Related (37 | 6.6%).
Sales and Office Occupations by Sex
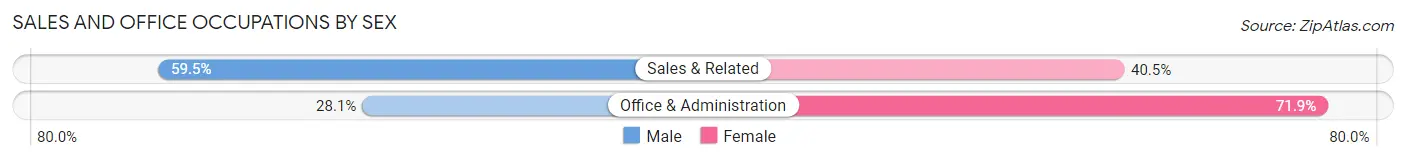
| Occupation | Male | Female |
| Sales & Related | 22 (59.5%) | 15 (40.5%) |
| Office & Administration | 16 (28.1%) | 41 (71.9%) |
| Total (Category) | 38 (40.4%) | 56 (59.6%) |
| Total (Overall) | 225 (39.8%) | 340 (60.2%) |
Natural Resources, Construction and Maintenance Occupations
The most common Natural Resources, Construction and Maintenance occupations in Pine Mountain are Installation, Maintenance & Repair (11 | 1.9%), and Construction & Extraction (6 | 1.1%).
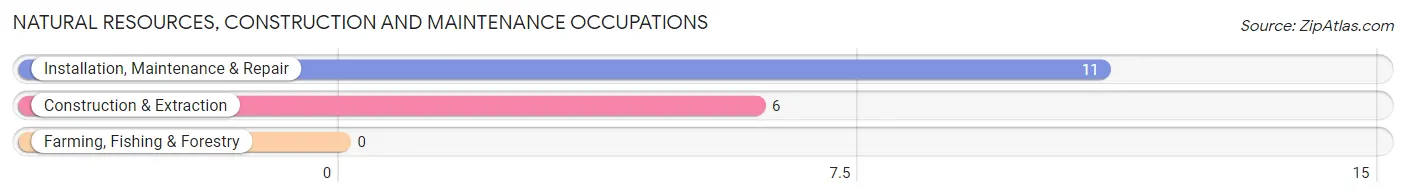
Natural Resources, Construction and Maintenance Occupations by Sex
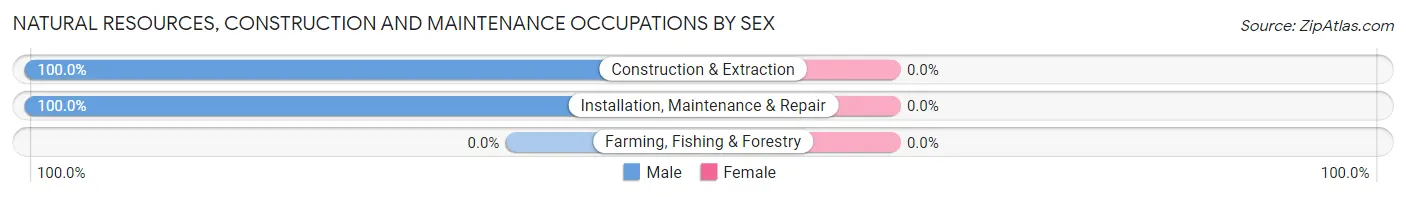
| Occupation | Male | Female |
| Farming, Fishing & Forestry | 0 (0.0%) | 0 (0.0%) |
| Construction & Extraction | 6 (100.0%) | 0 (0.0%) |
| Installation, Maintenance & Repair | 11 (100.0%) | 0 (0.0%) |
| Total (Category) | 17 (100.0%) | 0 (0.0%) |
| Total (Overall) | 225 (39.8%) | 340 (60.2%) |
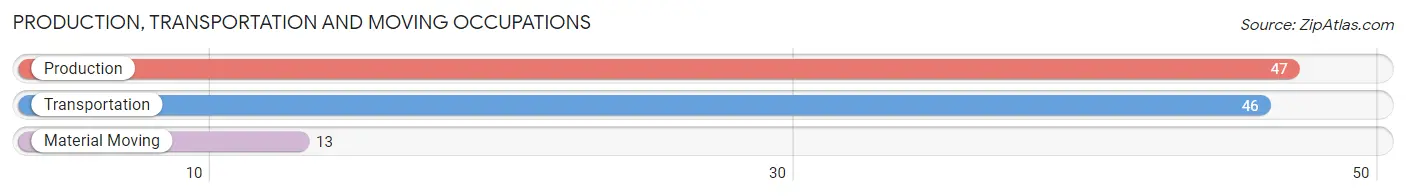
Production, Transportation and Moving Occupations
The most common Production, Transportation and Moving occupations in Pine Mountain are Production (47 | 8.3%), Transportation (46 | 8.1%), and Material Moving (13 | 2.3%).
Production, Transportation and Moving Occupations by Sex
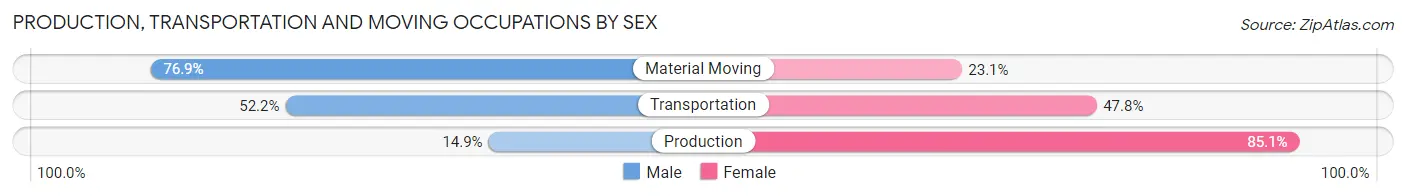
| Occupation | Male | Female |
| Production | 7 (14.9%) | 40 (85.1%) |
| Transportation | 24 (52.2%) | 22 (47.8%) |
| Material Moving | 10 (76.9%) | 3 (23.1%) |
| Total (Category) | 41 (38.7%) | 65 (61.3%) |
| Total (Overall) | 225 (39.8%) | 340 (60.2%) |
Employment Industries by Sex in Pine Mountain
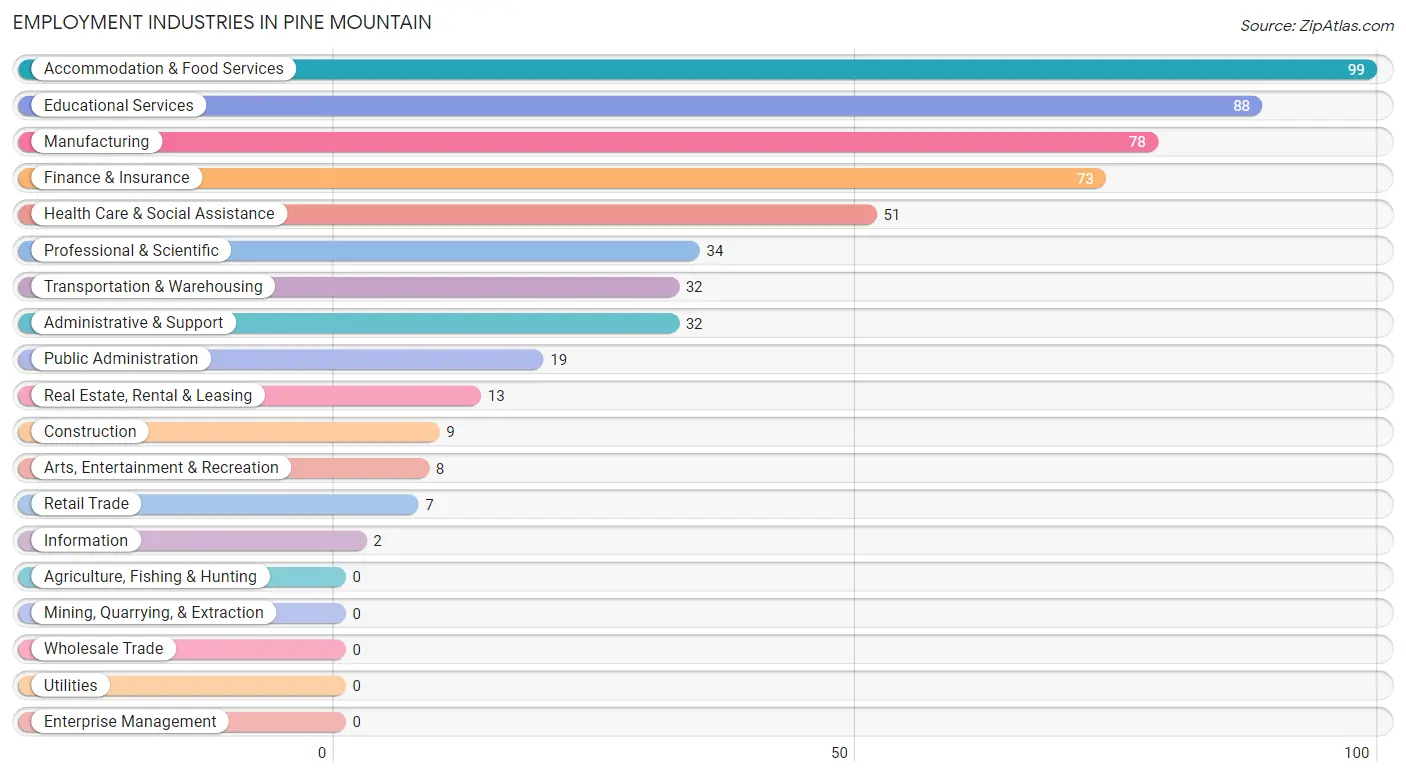
Employment Industries in Pine Mountain
The major employment industries in Pine Mountain include Accommodation & Food Services (99 | 17.5%), Educational Services (88 | 15.6%), Manufacturing (78 | 13.8%), Finance & Insurance (73 | 12.9%), and Health Care & Social Assistance (51 | 9.0%).
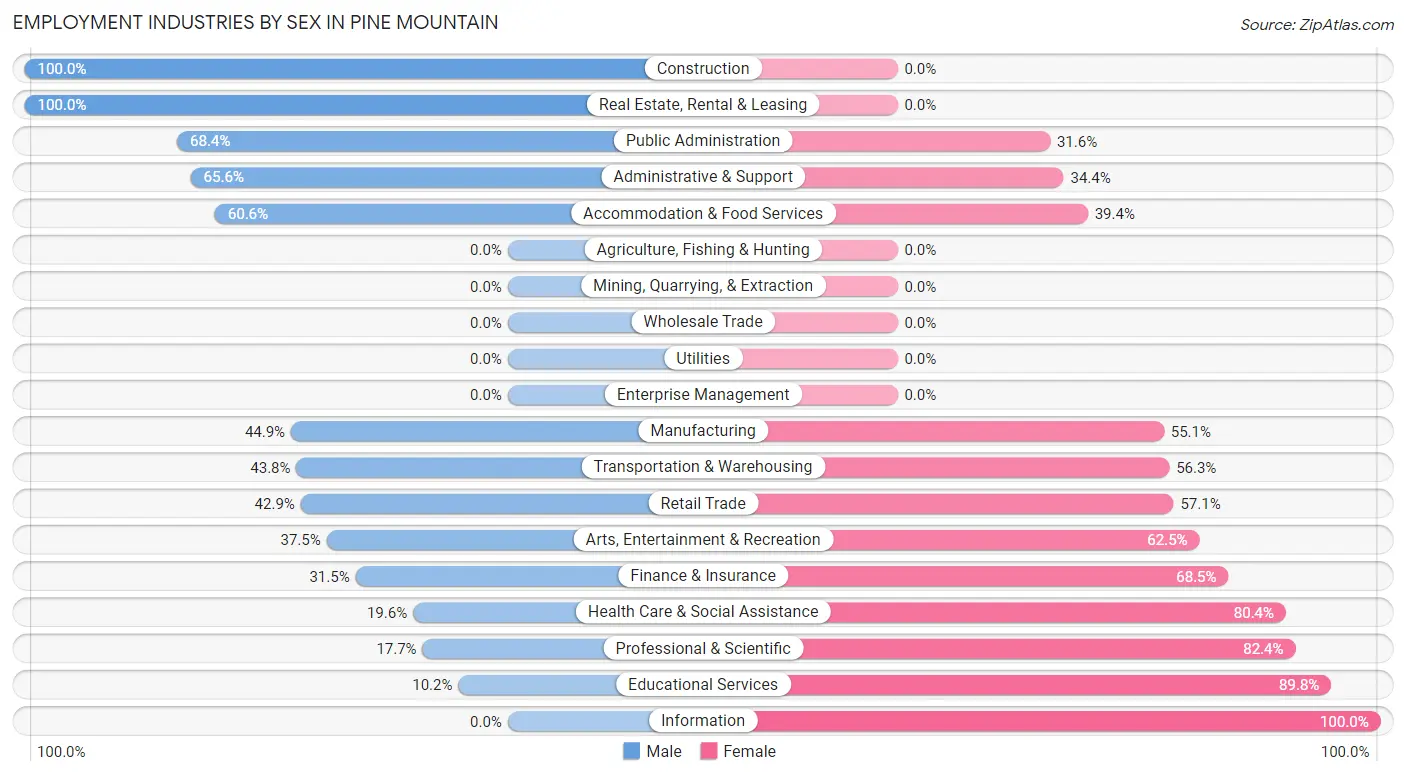
Employment Industries by Sex in Pine Mountain
The Pine Mountain industries that see more men than women are Construction (100.0%), Real Estate, Rental & Leasing (100.0%), and Public Administration (68.4%), whereas the industries that tend to have a higher number of women are Information (100.0%), Educational Services (89.8%), and Professional & Scientific (82.4%).
| Industry | Male | Female |
| Agriculture, Fishing & Hunting | 0 (0.0%) | 0 (0.0%) |
| Mining, Quarrying, & Extraction | 0 (0.0%) | 0 (0.0%) |
| Construction | 9 (100.0%) | 0 (0.0%) |
| Manufacturing | 35 (44.9%) | 43 (55.1%) |
| Wholesale Trade | 0 (0.0%) | 0 (0.0%) |
| Retail Trade | 3 (42.9%) | 4 (57.1%) |
| Transportation & Warehousing | 14 (43.8%) | 18 (56.2%) |
| Utilities | 0 (0.0%) | 0 (0.0%) |
| Information | 0 (0.0%) | 2 (100.0%) |
| Finance & Insurance | 23 (31.5%) | 50 (68.5%) |
| Real Estate, Rental & Leasing | 13 (100.0%) | 0 (0.0%) |
| Professional & Scientific | 6 (17.6%) | 28 (82.4%) |
| Enterprise Management | 0 (0.0%) | 0 (0.0%) |
| Administrative & Support | 21 (65.6%) | 11 (34.4%) |
| Educational Services | 9 (10.2%) | 79 (89.8%) |
| Health Care & Social Assistance | 10 (19.6%) | 41 (80.4%) |
| Arts, Entertainment & Recreation | 3 (37.5%) | 5 (62.5%) |
| Accommodation & Food Services | 60 (60.6%) | 39 (39.4%) |
| Public Administration | 13 (68.4%) | 6 (31.6%) |
| Total | 225 (39.8%) | 340 (60.2%) |
Education in Pine Mountain
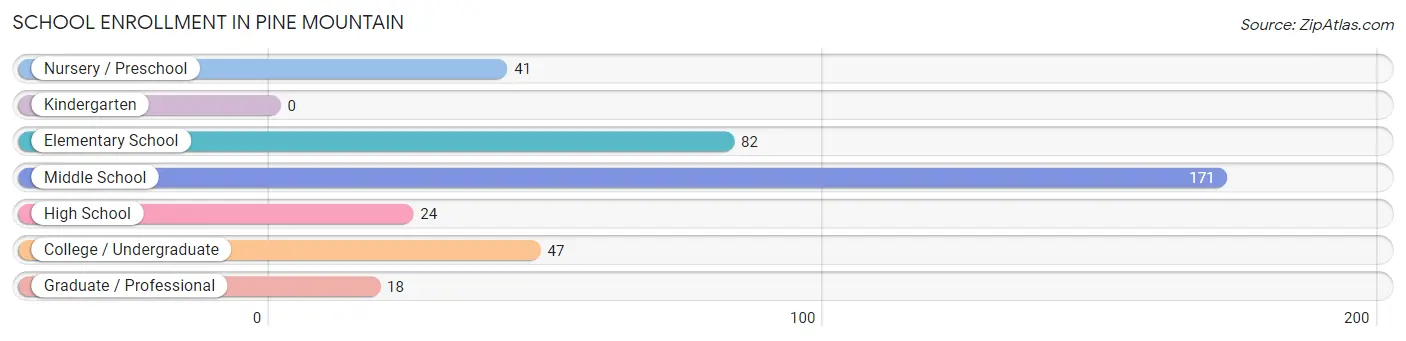
School Enrollment in Pine Mountain
The most common levels of schooling among the 383 students in Pine Mountain are middle school (171 | 44.7%), elementary school (82 | 21.4%), and college / undergraduate (47 | 12.3%).
| School Level | # Students | % Students |
| Nursery / Preschool | 41 | 10.7% |
| Kindergarten | 0 | 0.0% |
| Elementary School | 82 | 21.4% |
| Middle School | 171 | 44.7% |
| High School | 24 | 6.3% |
| College / Undergraduate | 47 | 12.3% |
| Graduate / Professional | 18 | 4.7% |
| Total | 383 | 100.0% |
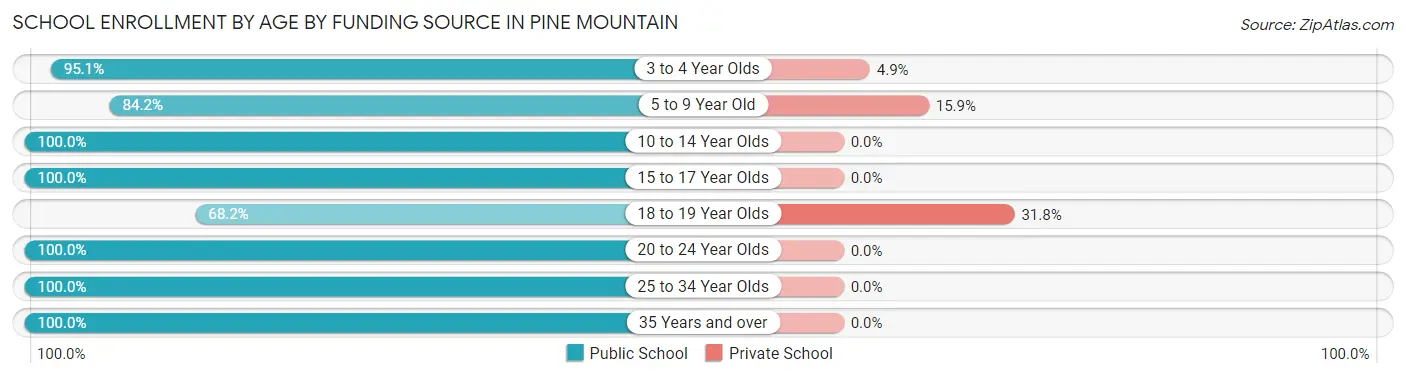
School Enrollment by Age by Funding Source in Pine Mountain
Out of a total of 383 students who are enrolled in schools in Pine Mountain, 22 (5.7%) attend a private institution, while the remaining 361 (94.3%) are enrolled in public schools. The age group of 18 to 19 year olds has the highest likelihood of being enrolled in private schools, with 7 (31.8% in the age bracket) enrolled. Conversely, the age group of 10 to 14 year olds has the lowest likelihood of being enrolled in a private school, with 171 (100.0% in the age bracket) attending a public institution.
| Age Bracket | Public School | Private School |
| 3 to 4 Year Olds | 39 (95.1%) | 2 (4.9%) |
| 5 to 9 Year Old | 69 (84.2%) | 13 (15.9%) |
| 10 to 14 Year Olds | 171 (100.0%) | 0 (0.0%) |
| 15 to 17 Year Olds | 24 (100.0%) | 0 (0.0%) |
| 18 to 19 Year Olds | 15 (68.2%) | 7 (31.8%) |
| 20 to 24 Year Olds | 7 (100.0%) | 0 (0.0%) |
| 25 to 34 Year Olds | 15 (100.0%) | 0 (0.0%) |
| 35 Years and over | 21 (100.0%) | 0 (0.0%) |
| Total | 361 (94.3%) | 22 (5.7%) |
Educational Attainment by Field of Study in Pine Mountain
Business (113 | 31.9%), education (73 | 20.6%), liberal arts & history (37 | 10.4%), science & technology (32 | 9.0%), and social sciences (20 | 5.7%) are the most common fields of study among 354 individuals in Pine Mountain who have obtained a bachelor's degree or higher.
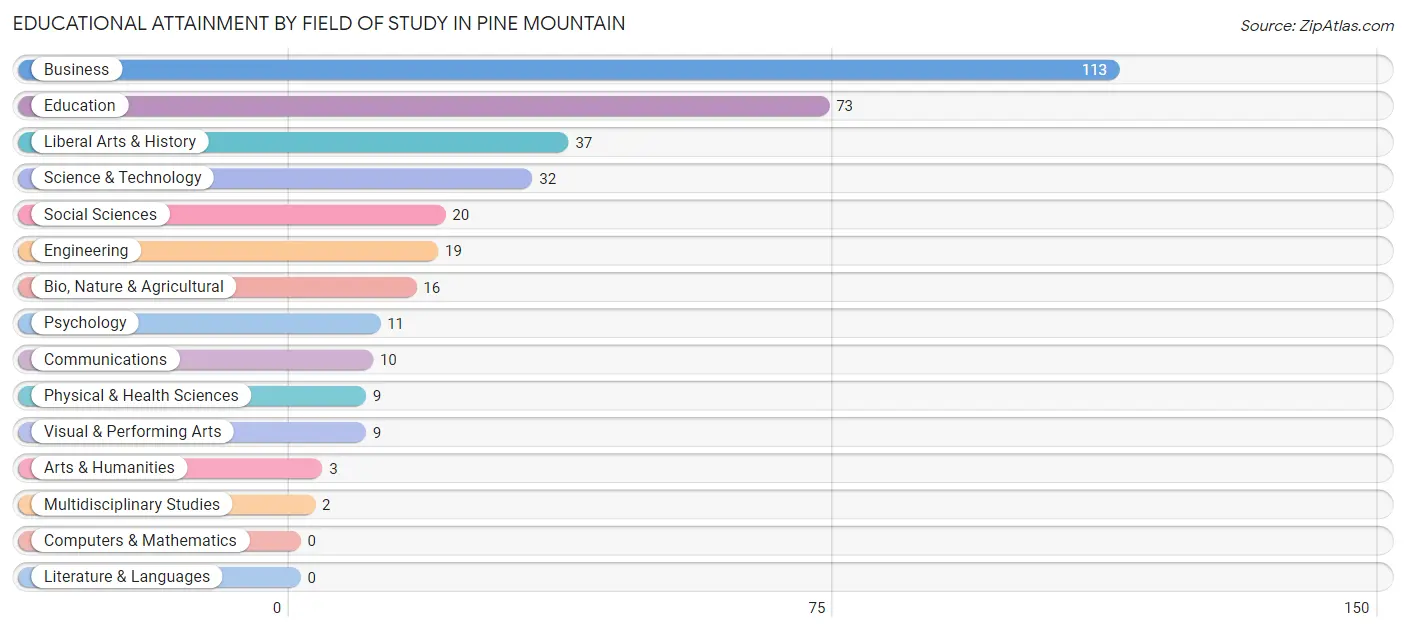
| Field of Study | # Graduates | % Graduates |
| Computers & Mathematics | 0 | 0.0% |
| Bio, Nature & Agricultural | 16 | 4.5% |
| Physical & Health Sciences | 9 | 2.5% |
| Psychology | 11 | 3.1% |
| Social Sciences | 20 | 5.7% |
| Engineering | 19 | 5.4% |
| Multidisciplinary Studies | 2 | 0.6% |
| Science & Technology | 32 | 9.0% |
| Business | 113 | 31.9% |
| Education | 73 | 20.6% |
| Literature & Languages | 0 | 0.0% |
| Liberal Arts & History | 37 | 10.4% |
| Visual & Performing Arts | 9 | 2.5% |
| Communications | 10 | 2.8% |
| Arts & Humanities | 3 | 0.9% |
| Total | 354 | 100.0% |
Transportation & Commute in Pine Mountain
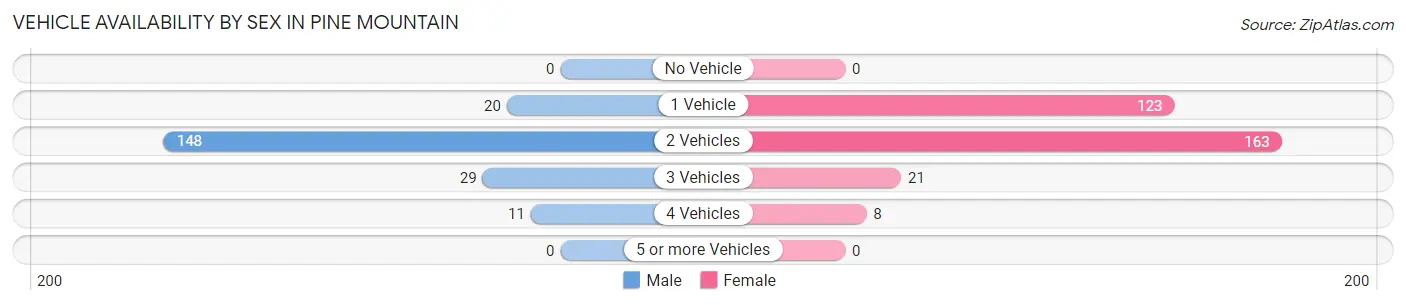
Vehicle Availability by Sex in Pine Mountain
The most prevalent vehicle ownership categories in Pine Mountain are males with 2 vehicles (148, accounting for 71.2%) and females with 2 vehicles (163, making up 47.0%).
| Vehicles Available | Male | Female |
| No Vehicle | 0 (0.0%) | 0 (0.0%) |
| 1 Vehicle | 20 (9.6%) | 123 (39.1%) |
| 2 Vehicles | 148 (71.2%) | 163 (51.7%) |
| 3 Vehicles | 29 (13.9%) | 21 (6.7%) |
| 4 Vehicles | 11 (5.3%) | 8 (2.5%) |
| 5 or more Vehicles | 0 (0.0%) | 0 (0.0%) |
| Total | 208 (100.0%) | 315 (100.0%) |
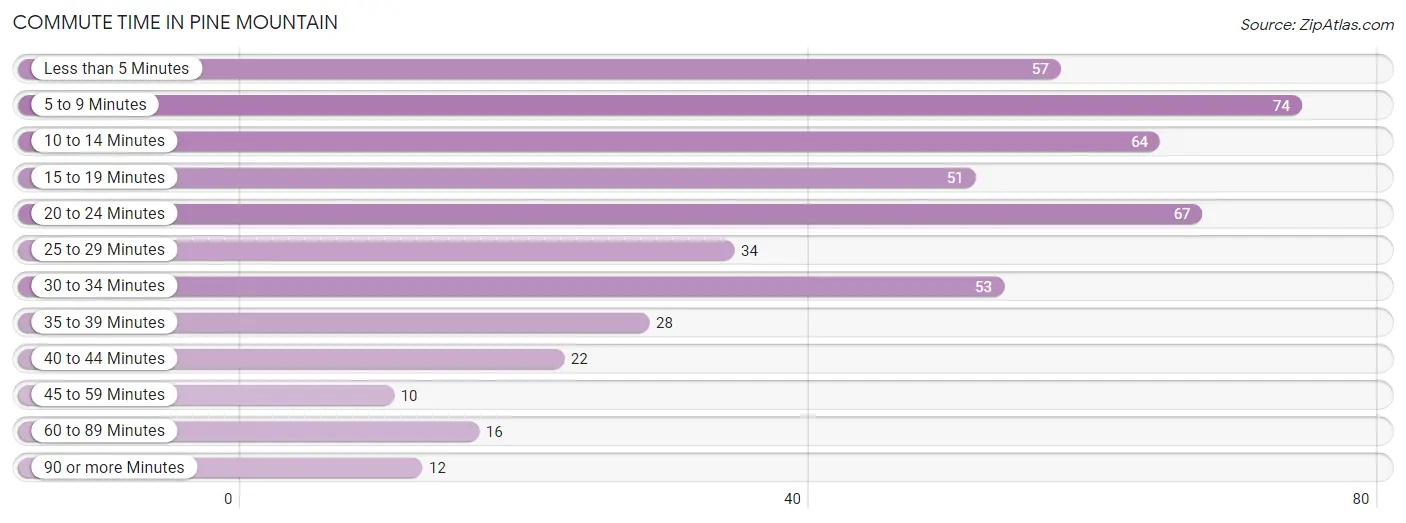
Commute Time in Pine Mountain
The most frequently occuring commute durations in Pine Mountain are 5 to 9 minutes (74 commuters, 15.2%), 20 to 24 minutes (67 commuters, 13.7%), and 10 to 14 minutes (64 commuters, 13.1%).
| Commute Time | # Commuters | % Commuters |
| Less than 5 Minutes | 57 | 11.7% |
| 5 to 9 Minutes | 74 | 15.2% |
| 10 to 14 Minutes | 64 | 13.1% |
| 15 to 19 Minutes | 51 | 10.4% |
| 20 to 24 Minutes | 67 | 13.7% |
| 25 to 29 Minutes | 34 | 7.0% |
| 30 to 34 Minutes | 53 | 10.9% |
| 35 to 39 Minutes | 28 | 5.7% |
| 40 to 44 Minutes | 22 | 4.5% |
| 45 to 59 Minutes | 10 | 2.1% |
| 60 to 89 Minutes | 16 | 3.3% |
| 90 or more Minutes | 12 | 2.5% |
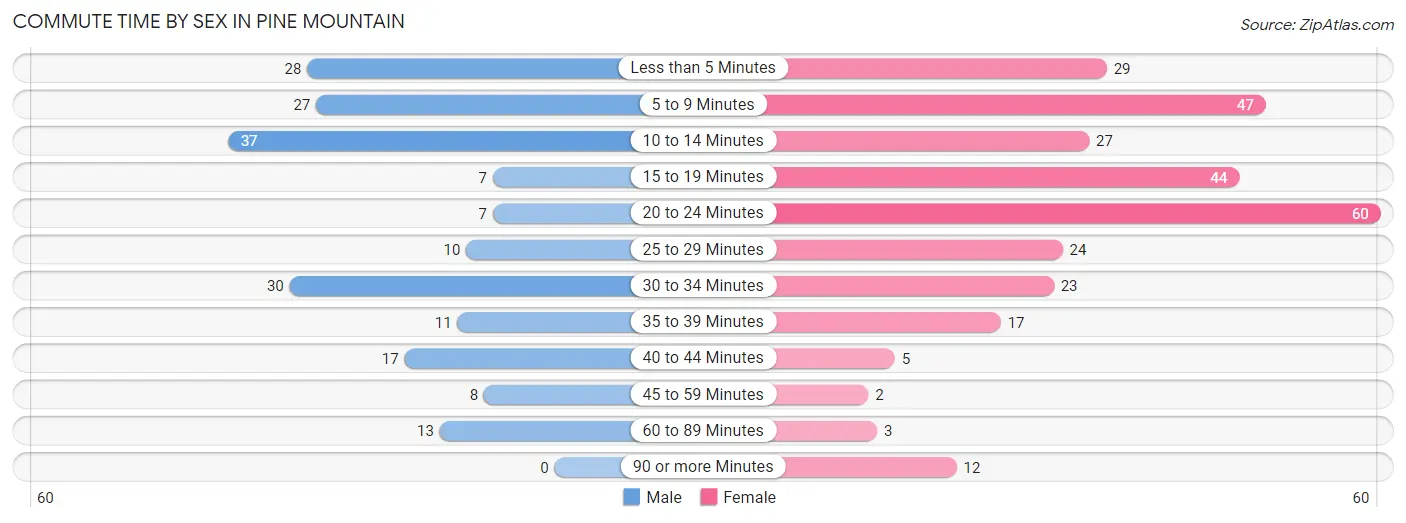
Commute Time by Sex in Pine Mountain
The most common commute times in Pine Mountain are 10 to 14 minutes (37 commuters, 19.0%) for males and 20 to 24 minutes (60 commuters, 20.5%) for females.
| Commute Time | Male | Female |
| Less than 5 Minutes | 28 (14.4%) | 29 (9.9%) |
| 5 to 9 Minutes | 27 (13.9%) | 47 (16.0%) |
| 10 to 14 Minutes | 37 (19.0%) | 27 (9.2%) |
| 15 to 19 Minutes | 7 (3.6%) | 44 (15.0%) |
| 20 to 24 Minutes | 7 (3.6%) | 60 (20.5%) |
| 25 to 29 Minutes | 10 (5.1%) | 24 (8.2%) |
| 30 to 34 Minutes | 30 (15.4%) | 23 (7.9%) |
| 35 to 39 Minutes | 11 (5.6%) | 17 (5.8%) |
| 40 to 44 Minutes | 17 (8.7%) | 5 (1.7%) |
| 45 to 59 Minutes | 8 (4.1%) | 2 (0.7%) |
| 60 to 89 Minutes | 13 (6.7%) | 3 (1.0%) |
| 90 or more Minutes | 0 (0.0%) | 12 (4.1%) |
Time of Departure to Work by Sex in Pine Mountain
The most frequent times of departure to work in Pine Mountain are 4:00 PM to 11:59 PM (44, 22.6%) for males and 7:00 AM to 7:29 AM (66, 22.5%) for females.
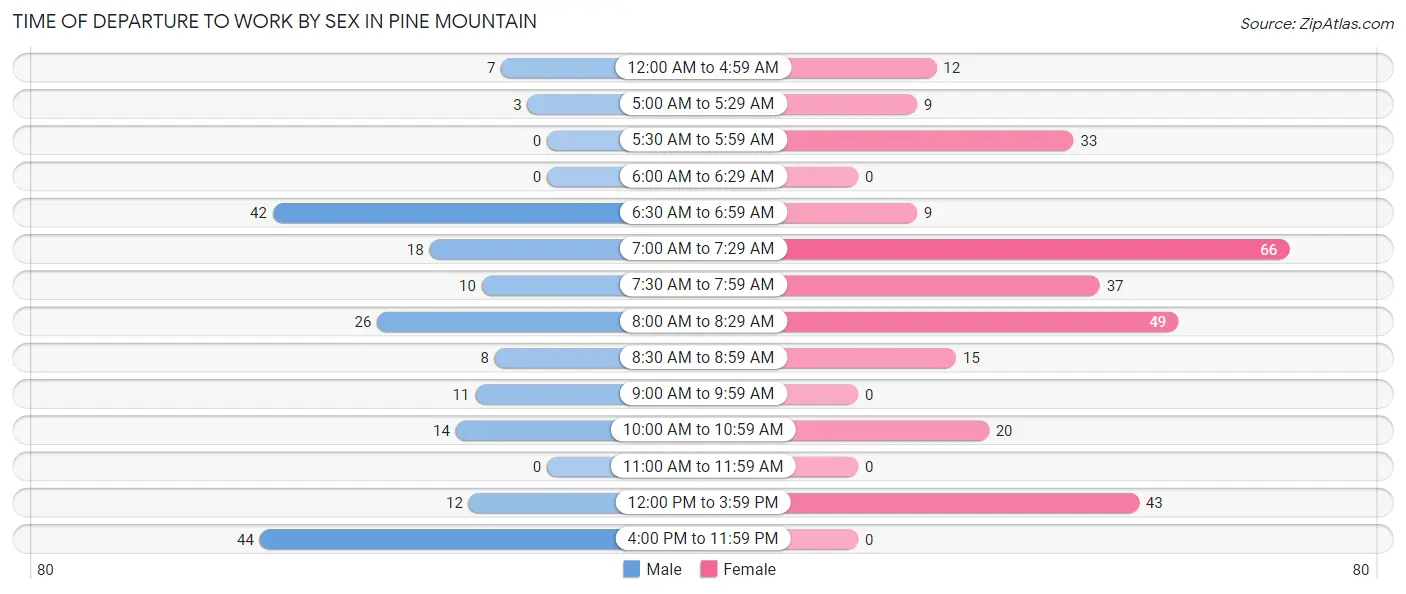
| Time of Departure | Male | Female |
| 12:00 AM to 4:59 AM | 7 (3.6%) | 12 (4.1%) |
| 5:00 AM to 5:29 AM | 3 (1.5%) | 9 (3.1%) |
| 5:30 AM to 5:59 AM | 0 (0.0%) | 33 (11.3%) |
| 6:00 AM to 6:29 AM | 0 (0.0%) | 0 (0.0%) |
| 6:30 AM to 6:59 AM | 42 (21.5%) | 9 (3.1%) |
| 7:00 AM to 7:29 AM | 18 (9.2%) | 66 (22.5%) |
| 7:30 AM to 7:59 AM | 10 (5.1%) | 37 (12.6%) |
| 8:00 AM to 8:29 AM | 26 (13.3%) | 49 (16.7%) |
| 8:30 AM to 8:59 AM | 8 (4.1%) | 15 (5.1%) |
| 9:00 AM to 9:59 AM | 11 (5.6%) | 0 (0.0%) |
| 10:00 AM to 10:59 AM | 14 (7.2%) | 20 (6.8%) |
| 11:00 AM to 11:59 AM | 0 (0.0%) | 0 (0.0%) |
| 12:00 PM to 3:59 PM | 12 (6.1%) | 43 (14.7%) |
| 4:00 PM to 11:59 PM | 44 (22.6%) | 0 (0.0%) |
| Total | 195 (100.0%) | 293 (100.0%) |
Housing Occupancy in Pine Mountain
Occupancy by Ownership in Pine Mountain
Of the total 499 dwellings in Pine Mountain, owner-occupied units account for 290 (58.1%), while renter-occupied units make up 209 (41.9%).
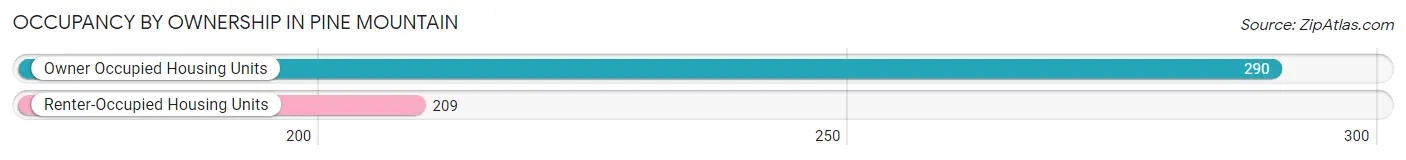
| Occupancy | # Housing Units | % Housing Units |
| Owner Occupied Housing Units | 290 | 58.1% |
| Renter-Occupied Housing Units | 209 | 41.9% |
| Total Occupied Housing Units | 499 | 100.0% |
Occupancy by Household Size in Pine Mountain
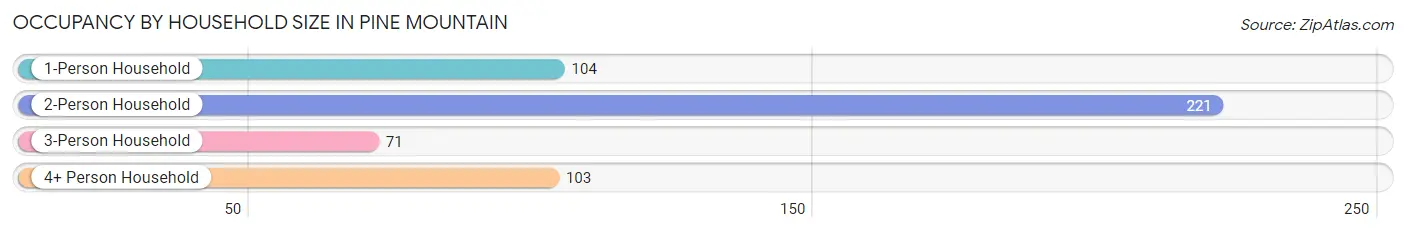
| Household Size | # Housing Units | % Housing Units |
| 1-Person Household | 104 | 20.8% |
| 2-Person Household | 221 | 44.3% |
| 3-Person Household | 71 | 14.2% |
| 4+ Person Household | 103 | 20.6% |
| Total Housing Units | 499 | 100.0% |
Occupancy by Ownership by Household Size in Pine Mountain
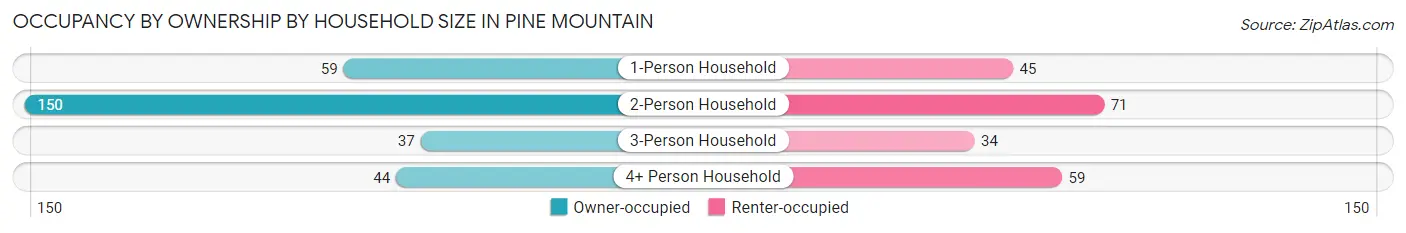
| Household Size | Owner-occupied | Renter-occupied |
| 1-Person Household | 59 (56.7%) | 45 (43.3%) |
| 2-Person Household | 150 (67.9%) | 71 (32.1%) |
| 3-Person Household | 37 (52.1%) | 34 (47.9%) |
| 4+ Person Household | 44 (42.7%) | 59 (57.3%) |
| Total Housing Units | 290 (58.1%) | 209 (41.9%) |
Occupancy by Educational Attainment in Pine Mountain
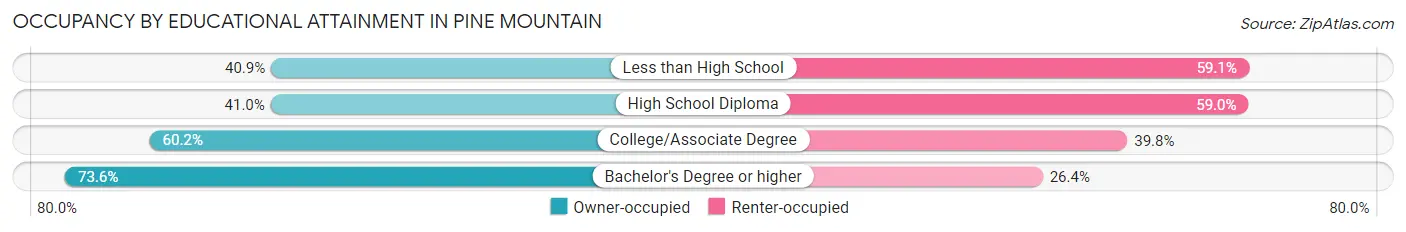
| Household Size | Owner-occupied | Renter-occupied |
| Less than High School | 27 (40.9%) | 39 (59.1%) |
| High School Diploma | 50 (41.0%) | 72 (59.0%) |
| College/Associate Degree | 71 (60.2%) | 47 (39.8%) |
| Bachelor's Degree or higher | 142 (73.6%) | 51 (26.4%) |
Occupancy by Age of Householder in Pine Mountain
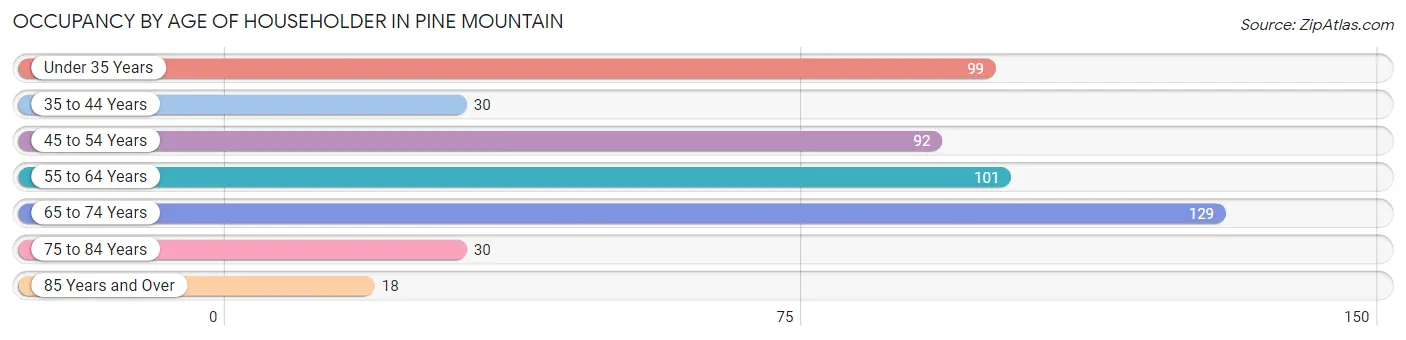
| Age Bracket | # Households | % Households |
| Under 35 Years | 99 | 19.8% |
| 35 to 44 Years | 30 | 6.0% |
| 45 to 54 Years | 92 | 18.4% |
| 55 to 64 Years | 101 | 20.2% |
| 65 to 74 Years | 129 | 25.9% |
| 75 to 84 Years | 30 | 6.0% |
| 85 Years and Over | 18 | 3.6% |
| Total | 499 | 100.0% |
Housing Finances in Pine Mountain
Median Income by Occupancy in Pine Mountain
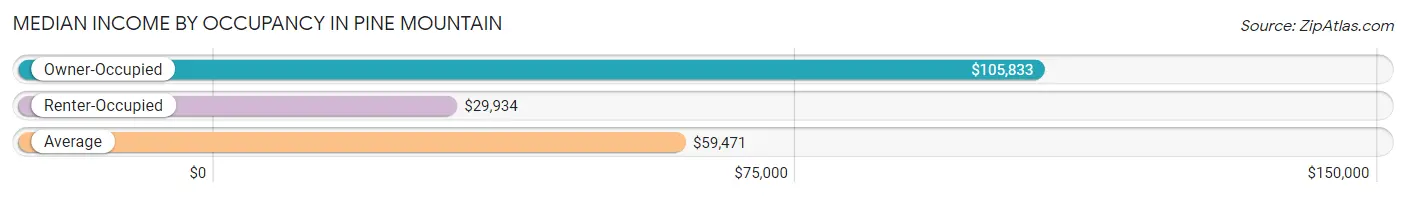
| Occupancy Type | # Households | Median Income |
| Owner-Occupied | 290 (58.1%) | $105,833 |
| Renter-Occupied | 209 (41.9%) | $29,934 |
| Average | 499 (100.0%) | $59,471 |
Occupancy by Householder Income Bracket in Pine Mountain
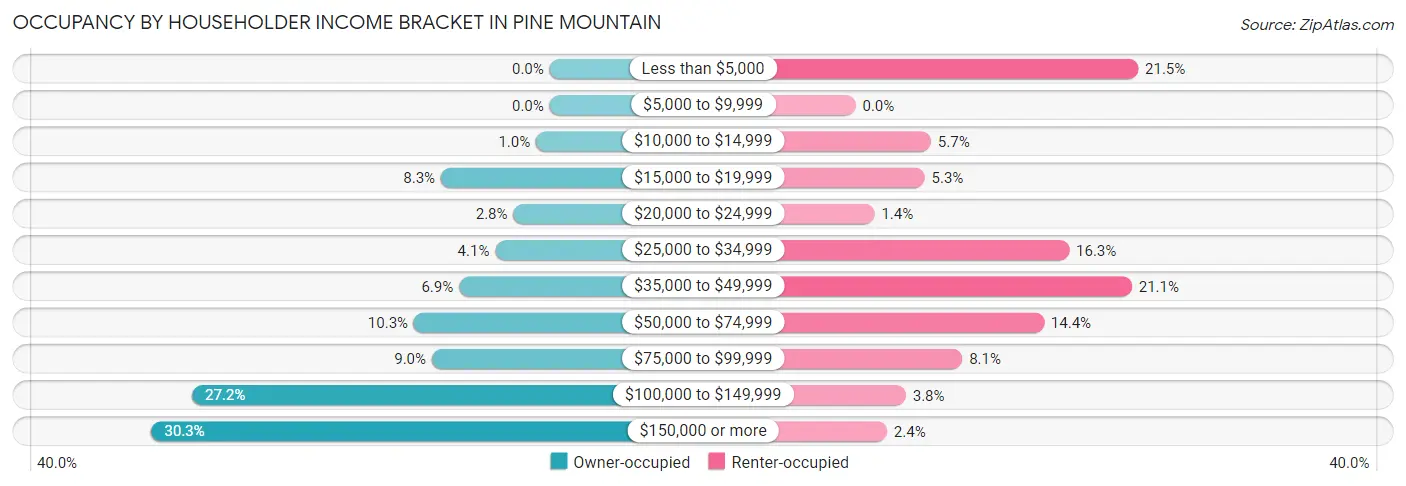
| Income Bracket | Owner-occupied | Renter-occupied |
| Less than $5,000 | 0 (0.0%) | 45 (21.5%) |
| $5,000 to $9,999 | 0 (0.0%) | 0 (0.0%) |
| $10,000 to $14,999 | 3 (1.0%) | 12 (5.7%) |
| $15,000 to $19,999 | 24 (8.3%) | 11 (5.3%) |
| $20,000 to $24,999 | 8 (2.8%) | 3 (1.4%) |
| $25,000 to $34,999 | 12 (4.1%) | 34 (16.3%) |
| $35,000 to $49,999 | 20 (6.9%) | 44 (21.0%) |
| $50,000 to $74,999 | 30 (10.3%) | 30 (14.3%) |
| $75,000 to $99,999 | 26 (9.0%) | 17 (8.1%) |
| $100,000 to $149,999 | 79 (27.2%) | 8 (3.8%) |
| $150,000 or more | 88 (30.3%) | 5 (2.4%) |
| Total | 290 (100.0%) | 209 (100.0%) |
Monthly Housing Cost Tiers in Pine Mountain
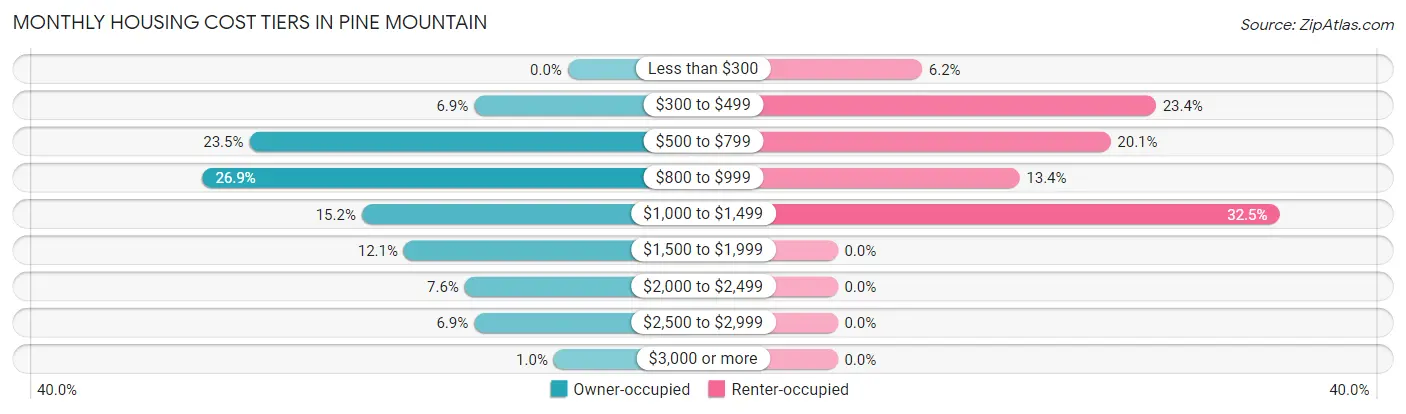
| Monthly Cost | Owner-occupied | Renter-occupied |
| Less than $300 | 0 (0.0%) | 13 (6.2%) |
| $300 to $499 | 20 (6.9%) | 49 (23.4%) |
| $500 to $799 | 68 (23.4%) | 42 (20.1%) |
| $800 to $999 | 78 (26.9%) | 28 (13.4%) |
| $1,000 to $1,499 | 44 (15.2%) | 68 (32.5%) |
| $1,500 to $1,999 | 35 (12.1%) | 0 (0.0%) |
| $2,000 to $2,499 | 22 (7.6%) | 0 (0.0%) |
| $2,500 to $2,999 | 20 (6.9%) | 0 (0.0%) |
| $3,000 or more | 3 (1.0%) | 0 (0.0%) |
| Total | 290 (100.0%) | 209 (100.0%) |
Physical Housing Characteristics in Pine Mountain
Housing Structures in Pine Mountain
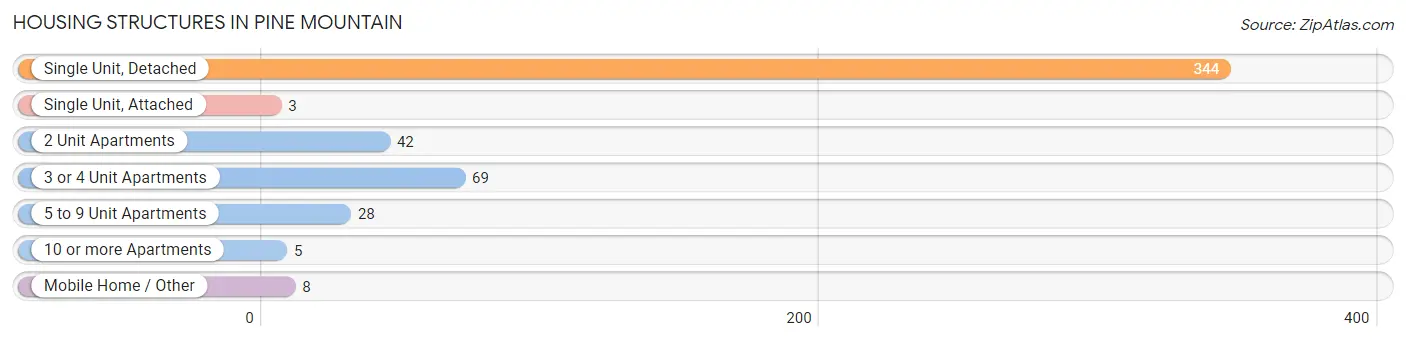
| Structure Type | # Housing Units | % Housing Units |
| Single Unit, Detached | 344 | 68.9% |
| Single Unit, Attached | 3 | 0.6% |
| 2 Unit Apartments | 42 | 8.4% |
| 3 or 4 Unit Apartments | 69 | 13.8% |
| 5 to 9 Unit Apartments | 28 | 5.6% |
| 10 or more Apartments | 5 | 1.0% |
| Mobile Home / Other | 8 | 1.6% |
| Total | 499 | 100.0% |
Housing Structures by Occupancy in Pine Mountain
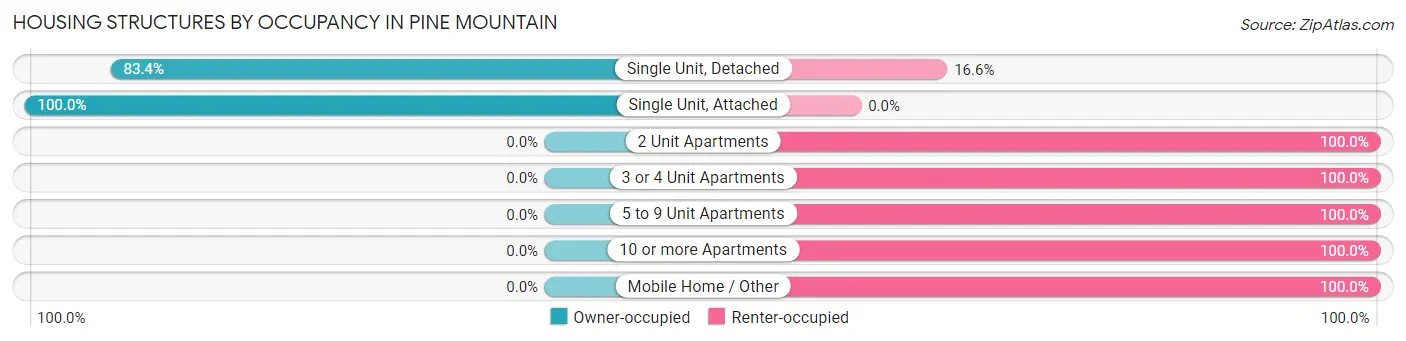
| Structure Type | Owner-occupied | Renter-occupied |
| Single Unit, Detached | 287 (83.4%) | 57 (16.6%) |
| Single Unit, Attached | 3 (100.0%) | 0 (0.0%) |
| 2 Unit Apartments | 0 (0.0%) | 42 (100.0%) |
| 3 or 4 Unit Apartments | 0 (0.0%) | 69 (100.0%) |
| 5 to 9 Unit Apartments | 0 (0.0%) | 28 (100.0%) |
| 10 or more Apartments | 0 (0.0%) | 5 (100.0%) |
| Mobile Home / Other | 0 (0.0%) | 8 (100.0%) |
| Total | 290 (58.1%) | 209 (41.9%) |
Housing Structures by Number of Rooms in Pine Mountain
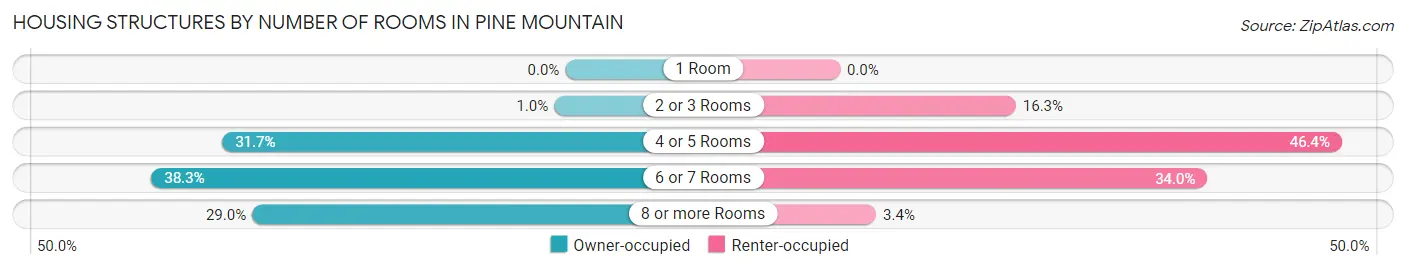
| Number of Rooms | Owner-occupied | Renter-occupied |
| 1 Room | 0 (0.0%) | 0 (0.0%) |
| 2 or 3 Rooms | 3 (1.0%) | 34 (16.3%) |
| 4 or 5 Rooms | 92 (31.7%) | 97 (46.4%) |
| 6 or 7 Rooms | 111 (38.3%) | 71 (34.0%) |
| 8 or more Rooms | 84 (29.0%) | 7 (3.4%) |
| Total | 290 (100.0%) | 209 (100.0%) |
Housing Structure by Heating Type in Pine Mountain
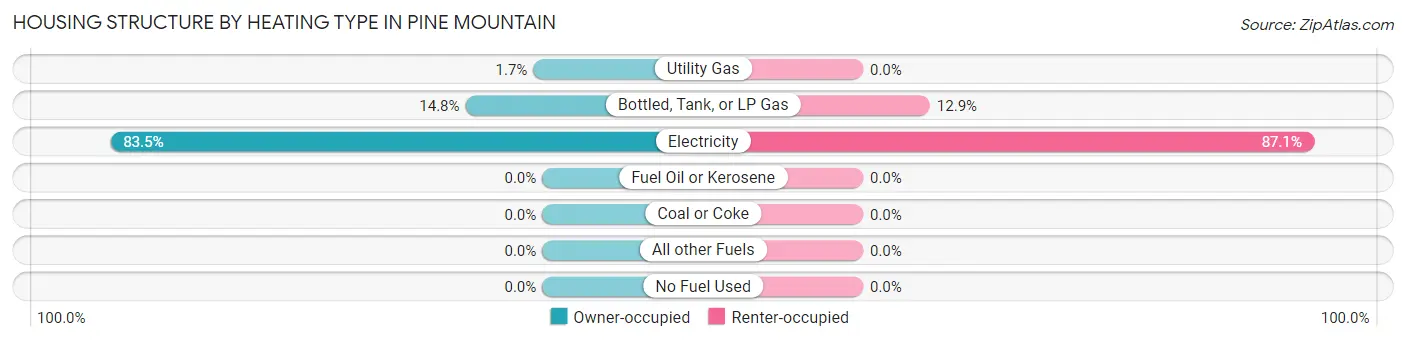
| Heating Type | Owner-occupied | Renter-occupied |
| Utility Gas | 5 (1.7%) | 0 (0.0%) |
| Bottled, Tank, or LP Gas | 43 (14.8%) | 27 (12.9%) |
| Electricity | 242 (83.5%) | 182 (87.1%) |
| Fuel Oil or Kerosene | 0 (0.0%) | 0 (0.0%) |
| Coal or Coke | 0 (0.0%) | 0 (0.0%) |
| All other Fuels | 0 (0.0%) | 0 (0.0%) |
| No Fuel Used | 0 (0.0%) | 0 (0.0%) |
| Total | 290 (100.0%) | 209 (100.0%) |
Household Vehicle Usage in Pine Mountain
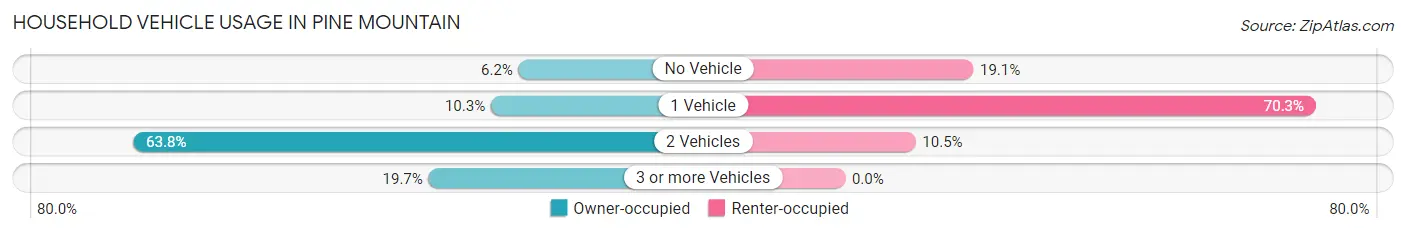
| Vehicles per Household | Owner-occupied | Renter-occupied |
| No Vehicle | 18 (6.2%) | 40 (19.1%) |
| 1 Vehicle | 30 (10.3%) | 147 (70.3%) |
| 2 Vehicles | 185 (63.8%) | 22 (10.5%) |
| 3 or more Vehicles | 57 (19.7%) | 0 (0.0%) |
| Total | 290 (100.0%) | 209 (100.0%) |
Real Estate & Mortgages in Pine Mountain
Real Estate and Mortgage Overview in Pine Mountain
| Characteristic | Without Mortgage | With Mortgage |
| Housing Units | 148 | 142 |
| Median Property Value | $304,200 | $231,800 |
| Median Household Income | $103,125 | $47 |
| Monthly Housing Costs | $722 | $3 |
| Real Estate Taxes | $2,844 | $0 |
Property Value by Mortgage Status in Pine Mountain
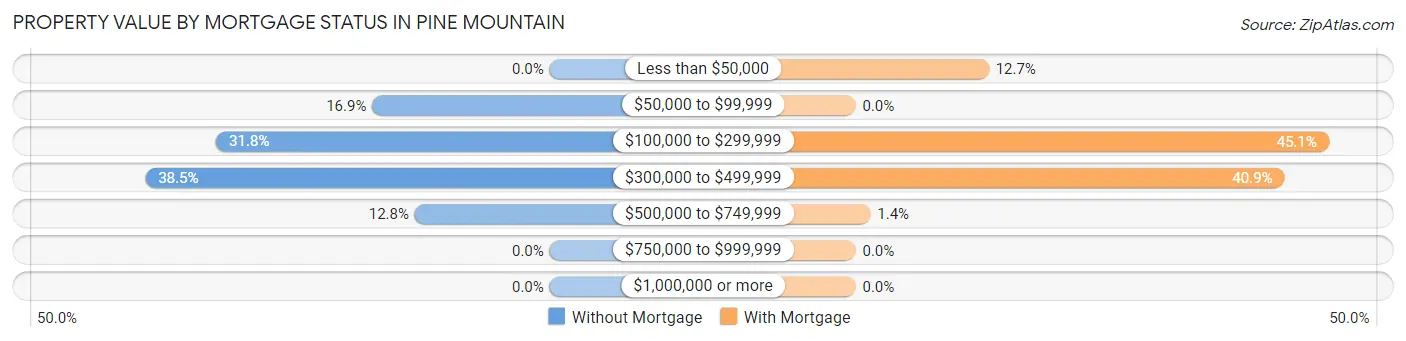
| Property Value | Without Mortgage | With Mortgage |
| Less than $50,000 | 0 (0.0%) | 18 (12.7%) |
| $50,000 to $99,999 | 25 (16.9%) | 0 (0.0%) |
| $100,000 to $299,999 | 47 (31.8%) | 64 (45.1%) |
| $300,000 to $499,999 | 57 (38.5%) | 58 (40.8%) |
| $500,000 to $749,999 | 19 (12.8%) | 2 (1.4%) |
| $750,000 to $999,999 | 0 (0.0%) | 0 (0.0%) |
| $1,000,000 or more | 0 (0.0%) | 0 (0.0%) |
| Total | 148 (100.0%) | 142 (100.0%) |
Household Income by Mortgage Status in Pine Mountain
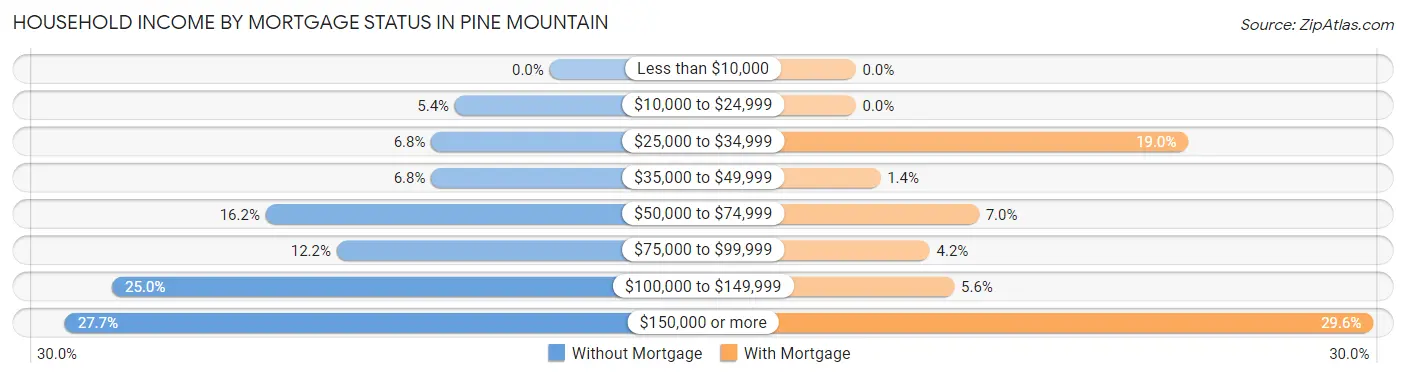
| Household Income | Without Mortgage | With Mortgage |
| Less than $10,000 | 0 (0.0%) | 0 (0.0%) |
| $10,000 to $24,999 | 8 (5.4%) | 0 (0.0%) |
| $25,000 to $34,999 | 10 (6.8%) | 27 (19.0%) |
| $35,000 to $49,999 | 10 (6.8%) | 2 (1.4%) |
| $50,000 to $74,999 | 24 (16.2%) | 10 (7.0%) |
| $75,000 to $99,999 | 18 (12.2%) | 6 (4.2%) |
| $100,000 to $149,999 | 37 (25.0%) | 8 (5.6%) |
| $150,000 or more | 41 (27.7%) | 42 (29.6%) |
| Total | 148 (100.0%) | 142 (100.0%) |
Property Value to Household Income Ratio in Pine Mountain
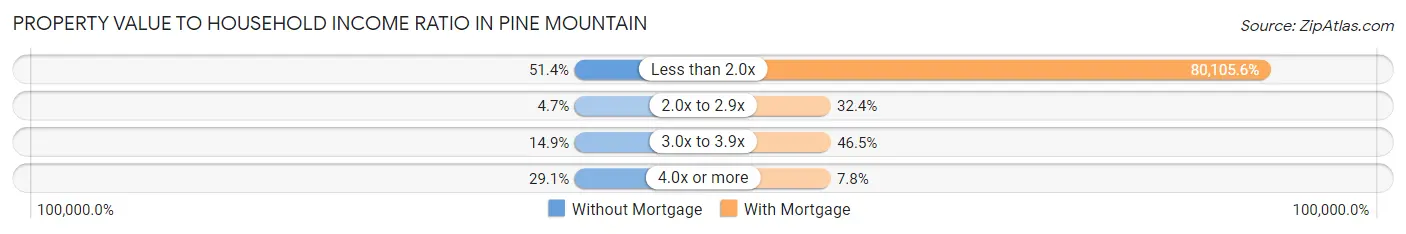
| Value-to-Income Ratio | Without Mortgage | With Mortgage |
| Less than 2.0x | 76 (51.3%) | 113,750 (80,105.6%) |
| 2.0x to 2.9x | 7 (4.7%) | 46 (32.4%) |
| 3.0x to 3.9x | 22 (14.9%) | 66 (46.5%) |
| 4.0x or more | 43 (29.0%) | 11 (7.7%) |
| Total | 148 (100.0%) | 142 (100.0%) |
Real Estate Taxes by Mortgage Status in Pine Mountain
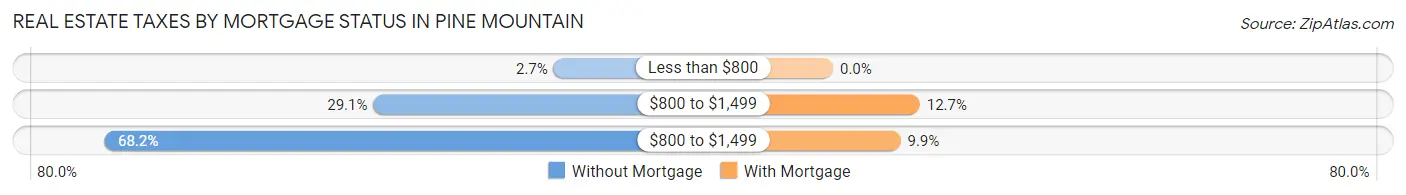
| Property Taxes | Without Mortgage | With Mortgage |
| Less than $800 | 4 (2.7%) | 0 (0.0%) |
| $800 to $1,499 | 43 (29.0%) | 18 (12.7%) |
| $800 to $1,499 | 101 (68.2%) | 14 (9.9%) |
| Total | 148 (100.0%) | 142 (100.0%) |
Health & Disability in Pine Mountain
Health Insurance Coverage by Age in Pine Mountain
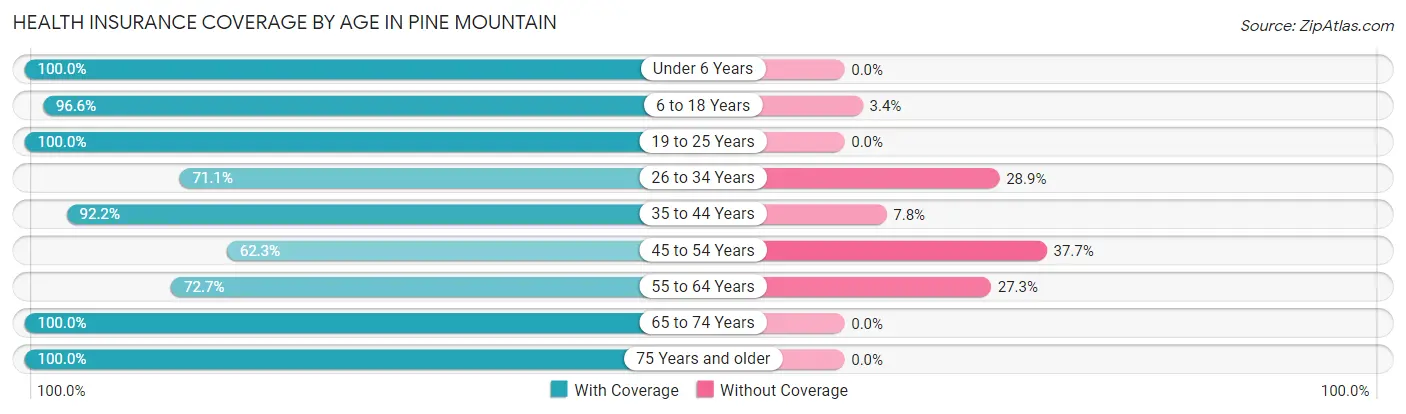
| Age Bracket | With Coverage | Without Coverage |
| Under 6 Years | 137 (100.0%) | 0 (0.0%) |
| 6 to 18 Years | 283 (96.6%) | 10 (3.4%) |
| 19 to 25 Years | 50 (100.0%) | 0 (0.0%) |
| 26 to 34 Years | 160 (71.1%) | 65 (28.9%) |
| 35 to 44 Years | 47 (92.2%) | 4 (7.8%) |
| 45 to 54 Years | 109 (62.3%) | 66 (37.7%) |
| 55 to 64 Years | 133 (72.7%) | 50 (27.3%) |
| 65 to 74 Years | 252 (100.0%) | 0 (0.0%) |
| 75 Years and older | 108 (100.0%) | 0 (0.0%) |
| Total | 1,279 (86.8%) | 195 (13.2%) |
Health Insurance Coverage by Citizenship Status in Pine Mountain
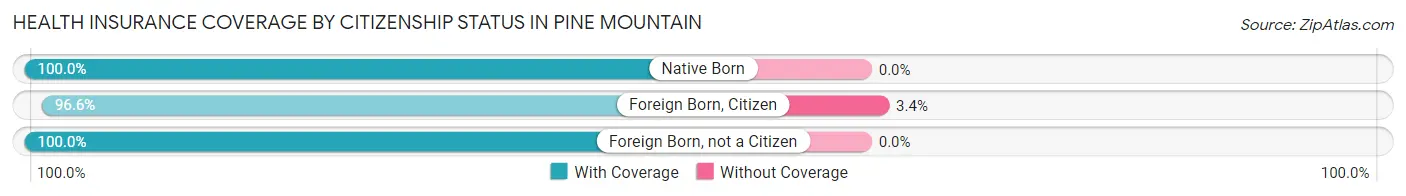
| Citizenship Status | With Coverage | Without Coverage |
| Native Born | 137 (100.0%) | 0 (0.0%) |
| Foreign Born, Citizen | 283 (96.6%) | 10 (3.4%) |
| Foreign Born, not a Citizen | 50 (100.0%) | 0 (0.0%) |
Health Insurance Coverage by Household Income in Pine Mountain
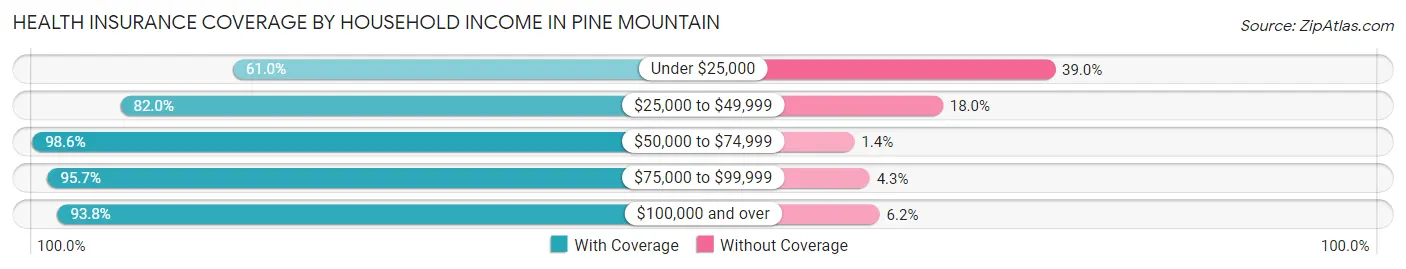
| Household Income | With Coverage | Without Coverage |
| Under $25,000 | 161 (61.0%) | 103 (39.0%) |
| $25,000 to $49,999 | 219 (82.0%) | 48 (18.0%) |
| $50,000 to $74,999 | 205 (98.6%) | 3 (1.4%) |
| $75,000 to $99,999 | 134 (95.7%) | 6 (4.3%) |
| $100,000 and over | 533 (93.8%) | 35 (6.2%) |
Public vs Private Health Insurance Coverage by Age in Pine Mountain
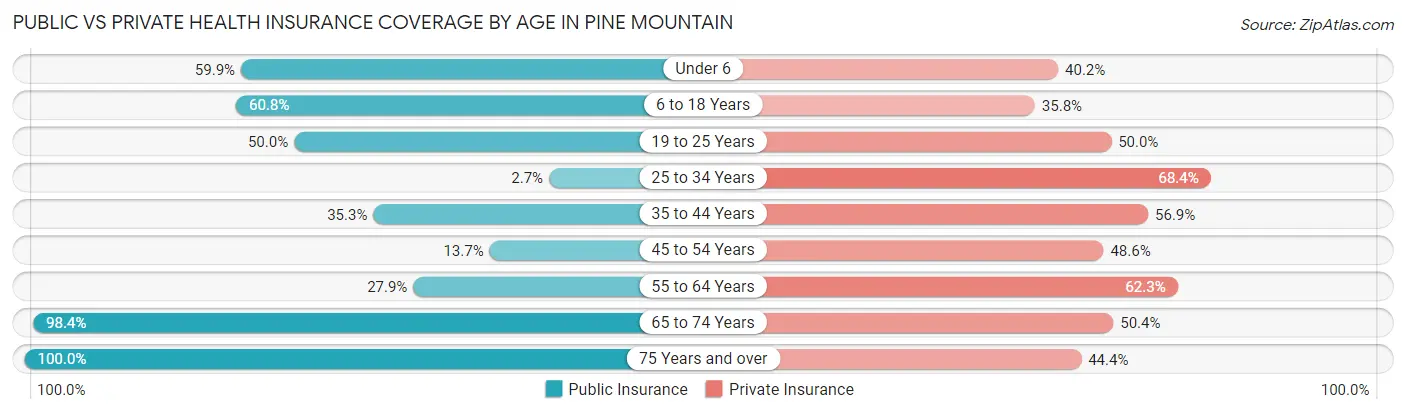
| Age Bracket | Public Insurance | Private Insurance |
| Under 6 | 82 (59.9%) | 55 (40.2%) |
| 6 to 18 Years | 178 (60.8%) | 105 (35.8%) |
| 19 to 25 Years | 25 (50.0%) | 25 (50.0%) |
| 25 to 34 Years | 6 (2.7%) | 154 (68.4%) |
| 35 to 44 Years | 18 (35.3%) | 29 (56.9%) |
| 45 to 54 Years | 24 (13.7%) | 85 (48.6%) |
| 55 to 64 Years | 51 (27.9%) | 114 (62.3%) |
| 65 to 74 Years | 248 (98.4%) | 127 (50.4%) |
| 75 Years and over | 108 (100.0%) | 48 (44.4%) |
| Total | 740 (50.2%) | 742 (50.3%) |
Disability Status by Sex by Age in Pine Mountain
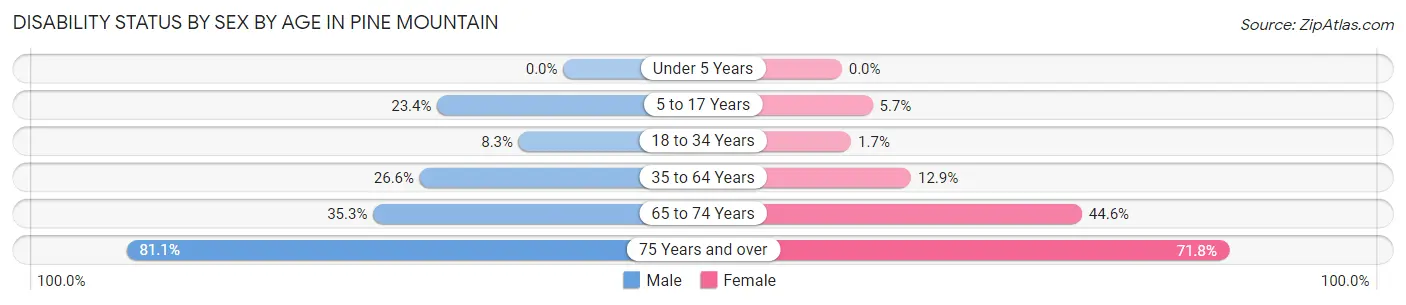
| Age Bracket | Male | Female |
| Under 5 Years | 0 (0.0%) | 0 (0.0%) |
| 5 to 17 Years | 22 (23.4%) | 11 (5.7%) |
| 18 to 34 Years | 9 (8.3%) | 3 (1.7%) |
| 35 to 64 Years | 53 (26.6%) | 27 (12.9%) |
| 65 to 74 Years | 24 (35.3%) | 82 (44.6%) |
| 75 Years and over | 30 (81.1%) | 51 (71.8%) |
Disability Class by Sex by Age in Pine Mountain
Disability Class: Hearing Difficulty

| Age Bracket | Male | Female |
| Under 5 Years | 0 (0.0%) | 0 (0.0%) |
| 5 to 17 Years | 0 (0.0%) | 0 (0.0%) |
| 18 to 34 Years | 0 (0.0%) | 0 (0.0%) |
| 35 to 64 Years | 14 (7.0%) | 8 (3.8%) |
| 65 to 74 Years | 15 (22.1%) | 21 (11.4%) |
| 75 Years and over | 21 (56.8%) | 6 (8.5%) |
Disability Class: Vision Difficulty
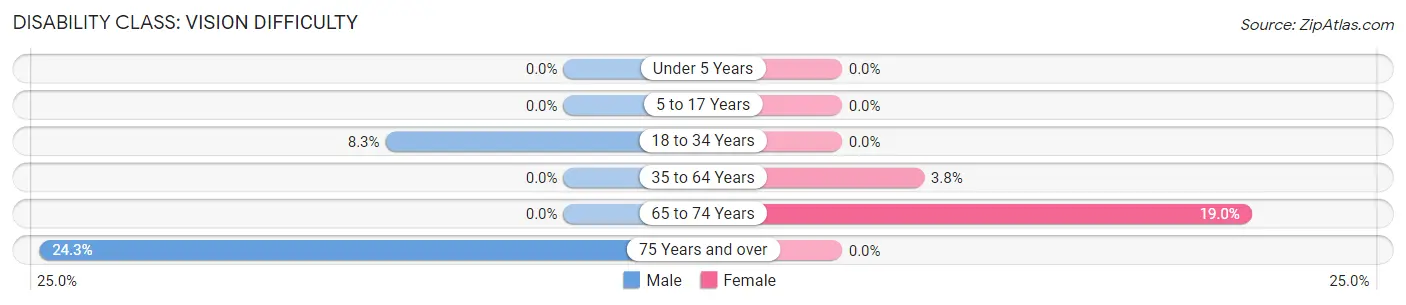
| Age Bracket | Male | Female |
| Under 5 Years | 0 (0.0%) | 0 (0.0%) |
| 5 to 17 Years | 0 (0.0%) | 0 (0.0%) |
| 18 to 34 Years | 9 (8.3%) | 0 (0.0%) |
| 35 to 64 Years | 0 (0.0%) | 8 (3.8%) |
| 65 to 74 Years | 0 (0.0%) | 35 (19.0%) |
| 75 Years and over | 9 (24.3%) | 0 (0.0%) |
Disability Class: Cognitive Difficulty
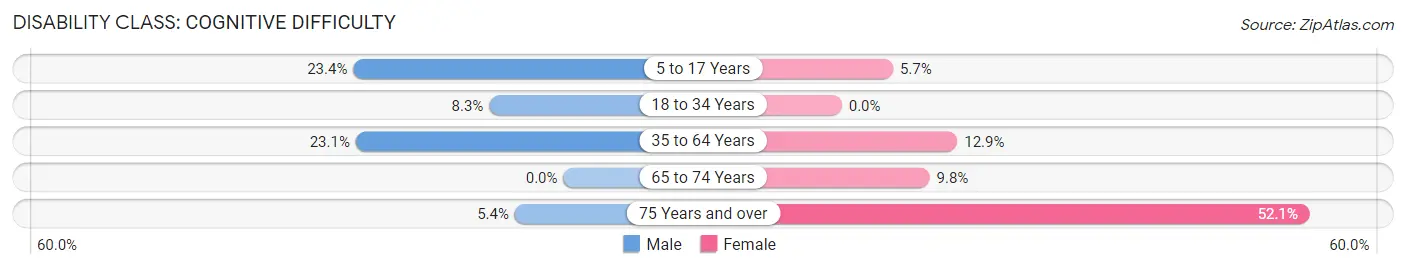
| Age Bracket | Male | Female |
| 5 to 17 Years | 22 (23.4%) | 11 (5.7%) |
| 18 to 34 Years | 9 (8.3%) | 0 (0.0%) |
| 35 to 64 Years | 46 (23.1%) | 27 (12.9%) |
| 65 to 74 Years | 0 (0.0%) | 18 (9.8%) |
| 75 Years and over | 2 (5.4%) | 37 (52.1%) |
Disability Class: Ambulatory Difficulty
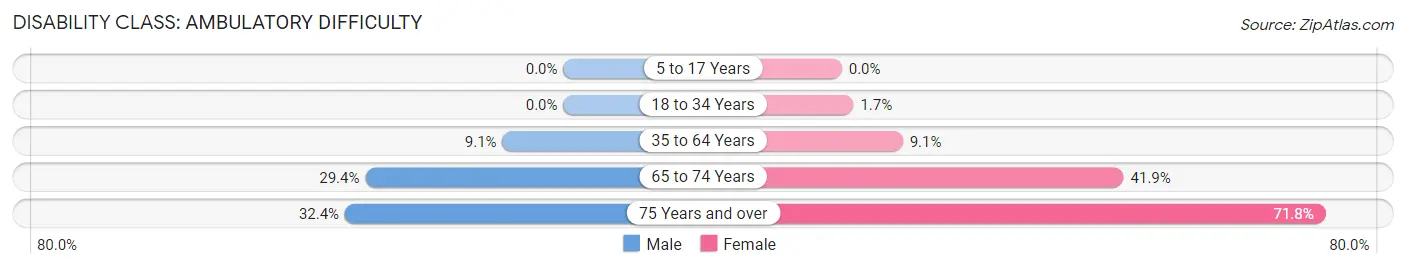
| Age Bracket | Male | Female |
| 5 to 17 Years | 0 (0.0%) | 0 (0.0%) |
| 18 to 34 Years | 0 (0.0%) | 3 (1.7%) |
| 35 to 64 Years | 18 (9.0%) | 19 (9.0%) |
| 65 to 74 Years | 20 (29.4%) | 77 (41.8%) |
| 75 Years and over | 12 (32.4%) | 51 (71.8%) |
Disability Class: Self-Care Difficulty
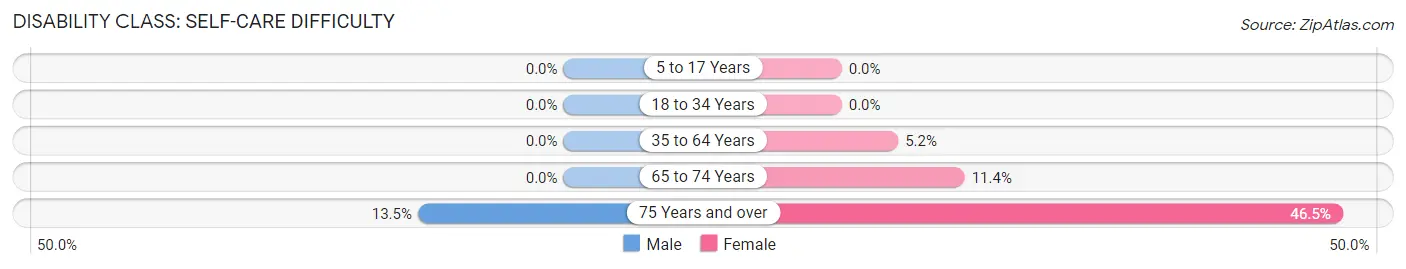
| Age Bracket | Male | Female |
| 5 to 17 Years | 0 (0.0%) | 0 (0.0%) |
| 18 to 34 Years | 0 (0.0%) | 0 (0.0%) |
| 35 to 64 Years | 0 (0.0%) | 11 (5.2%) |
| 65 to 74 Years | 0 (0.0%) | 21 (11.4%) |
| 75 Years and over | 5 (13.5%) | 33 (46.5%) |
Technology Access in Pine Mountain
Computing Device Access in Pine Mountain
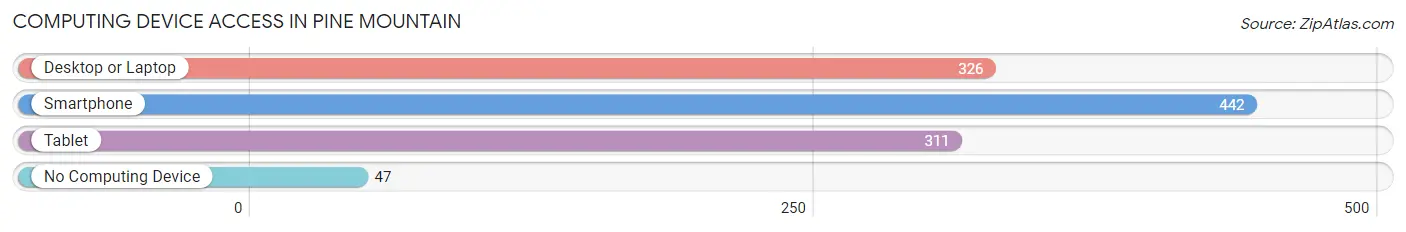
| Device Type | # Households | % Households |
| Desktop or Laptop | 326 | 65.3% |
| Smartphone | 442 | 88.6% |
| Tablet | 311 | 62.3% |
| No Computing Device | 47 | 9.4% |
| Total | 499 | 100.0% |
Internet Access in Pine Mountain
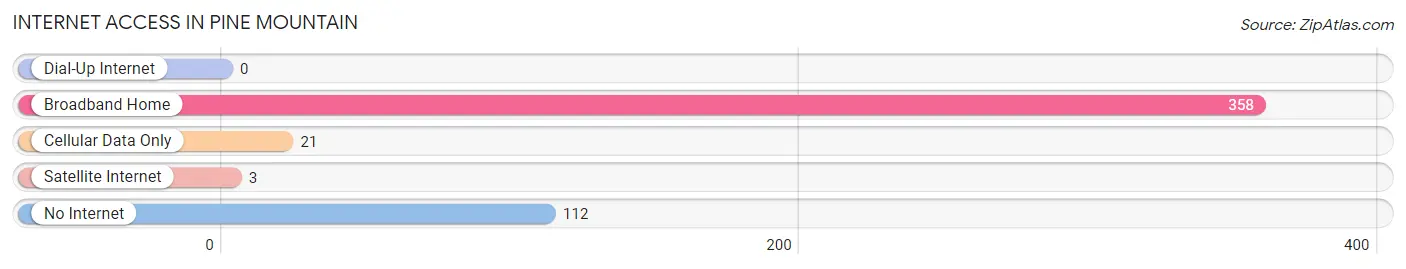
| Internet Type | # Households | % Households |
| Dial-Up Internet | 0 | 0.0% |
| Broadband Home | 358 | 71.7% |
| Cellular Data Only | 21 | 4.2% |
| Satellite Internet | 3 | 0.6% |
| No Internet | 112 | 22.4% |
| Total | 499 | 100.0% |
Pine Mountain Summary
Pine Mountain, Georgia is a small town located in Harris County, Georgia, United States. It is situated in the foothills of the Appalachian Mountains, approximately 50 miles southwest of Atlanta. The town was founded in 1883 by the Reverend John C. Harris, who named it after the nearby Pine Mountain. The town has a population of approximately 1,500 people and is known for its scenic beauty and outdoor recreation opportunities.
History
Pine Mountain was founded in 1883 by the Reverend John C. Harris, who named it after the nearby Pine Mountain. The town was originally a small farming community, but it soon became a popular tourist destination due to its scenic beauty and outdoor recreation opportunities. In the early 1900s, the town was home to a number of resorts, including the Pine Mountain Hotel, which was built in 1906 and was one of the first resorts in the area.
In the 1920s, the town began to attract more visitors due to its proximity to Callaway Gardens, a popular tourist destination. The town also became a popular destination for golfers, as the area was home to several golf courses. In the 1950s, the town began to attract more visitors due to its proximity to the nearby Callaway Gardens.
Geography
Pine Mountain is located in Harris County, Georgia, United States. It is situated in the foothills of the Appalachian Mountains, approximately 50 miles southwest of Atlanta. The town is located at an elevation of 1,000 feet above sea level and is surrounded by rolling hills and forests. The town is located near the Chattahoochee River, which provides a variety of recreational activities, including fishing, boating, and swimming.
Economy
The economy of Pine Mountain is largely based on tourism. The town is home to several resorts, including the Pine Mountain Hotel, which was built in 1906 and is one of the first resorts in the area. The town is also home to several golf courses, which attract visitors from all over the country. In addition, the town is home to several restaurants, shops, and other businesses that cater to tourists.
Demographics
As of the 2010 census, the population of Pine Mountain was 1,500 people. The racial makeup of the town was 95.3% White, 1.7% African American, 0.3% Native American, 0.7% Asian, 0.3% from other races, and 1.7% from two or more races. The median household income was $37,500 and the median family income was $45,000. The per capita income was $19,000.
Conclusion
Pine Mountain, Georgia is a small town located in Harris County, Georgia, United States. It is situated in the foothills of the Appalachian Mountains, approximately 50 miles southwest of Atlanta. The town was founded in 1883 by the Reverend John C. Harris, who named it after the nearby Pine Mountain. The town has a population of approximately 1,500 people and is known for its scenic beauty and outdoor recreation opportunities. The economy of Pine Mountain is largely based on tourism, with several resorts, golf courses, restaurants, shops, and other businesses catering to tourists. The racial makeup of the town is 95.3% White, 1.7% African American, 0.3% Native American, 0.7% Asian, 0.3% from other races, and 1.7% from two or more races. The median household income was $37,500 and the median family income was $45,000.
Common Questions
What is the Total Population of Pine Mountain?
Total Population of Pine Mountain is 1,474.
What is the Total Male Population of Pine Mountain?
Total Male Population of Pine Mountain is 556.
What is the Total Female Population of Pine Mountain?
Total Female Population of Pine Mountain is 918.
What is the Ratio of Males per 100 Females in Pine Mountain?
There are 60.57 Males per 100 Females in Pine Mountain.
What is the Ratio of Females per 100 Males in Pine Mountain?
There are 165.11 Females per 100 Males in Pine Mountain.
What is the Median Population Age in Pine Mountain?
Median Population Age in Pine Mountain is 43.4 Years.
What is the Average Family Size in Pine Mountain
Average Family Size in Pine Mountain is 3.2 People.
What is the Average Household Size in Pine Mountain
Average Household Size in Pine Mountain is 2.9 People.
What is Per Capita Income in Pine Mountain?
Per Capita income in Pine Mountain is $34,028.
What is the Median Family Income in Pine Mountain?
Median Family Income in Pine Mountain is $78,906.
What is the Median Household income in Pine Mountain?
Median Household Income in Pine Mountain is $59,471.
What is Income or Wage Gap in Pine Mountain?
Income or Wage Gap in Pine Mountain is 7.4%.
Women in Pine Mountain earn 92.6 cents for every dollar earned by a man.
What is Inequality or Gini Index in Pine Mountain?
Inequality or Gini Index in Pine Mountain is 0.51.
How Large is the Labor Force in Pine Mountain?
There are 592 People in the Labor Forcein in Pine Mountain.
What is the Percentage of People in the Labor Force in Pine Mountain?
55.2% of People are in the Labor Force in Pine Mountain.
What is the Unemployment Rate in Pine Mountain?
Unemployment Rate in Pine Mountain is 4.6%.