West Point, NY Map & Demographics
West Point Map
West Point Overview
$28,448
PER CAPITA INCOME
$134,929
AVG FAMILY INCOME
$133,844
AVG HOUSEHOLD INCOME
0.7%
WAGE / INCOME GAP [ % ]
99.3¢/ $1
WAGE / INCOME GAP [ $ ]
0.28
INEQUALITY / GINI INDEX
6,386
TOTAL POPULATION
3,757
MALE POPULATION
2,629
FEMALE POPULATION
142.91
MALES / 100 FEMALES
69.98
FEMALES / 100 MALES
21.3
MEDIAN AGE
3.9
AVG FAMILY SIZE
3.7
AVG HOUSEHOLD SIZE
3,582
LABOR FORCE [ PEOPLE ]
75.6%
PERCENT IN LABOR FORCE
3.2%
UNEMPLOYMENT RATE
West Point Zip Codes
West Point Area Codes
Income in West Point
Income Overview in West Point
Per Capita Income in West Point is $28,448, while median incomes of families and households are $134,929 and $133,844 respectively.
| Characteristic | Number | Measure |
| Per Capita Income | 6,386 | $28,448 |
| Median Family Income | 945 | $134,929 |
| Mean Family Income | 945 | $150,445 |
| Median Household Income | 1,063 | $133,844 |
| Mean Household Income | 1,063 | $145,003 |
| Income Deficit | 945 | $0 |
| Wage / Income Gap (%) | 6,386 | 0.66% |
| Wage / Income Gap ($) | 6,386 | 99.34¢ per $1 |
| Gini / Inequality Index | 6,386 | 0.28 |
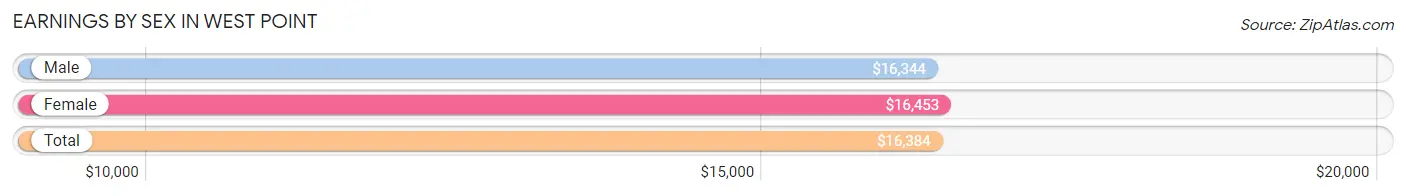
Earnings by Sex in West Point
Average Earnings in West Point are $16,384, $16,344 for men and $16,453 for women, a difference of 0.7%.
| Sex | Number | Average Earnings |
| Male | 2,331 (63.1%) | $16,344 |
| Female | 1,360 (36.8%) | $16,453 |
| Total | 3,691 (100.0%) | $16,384 |
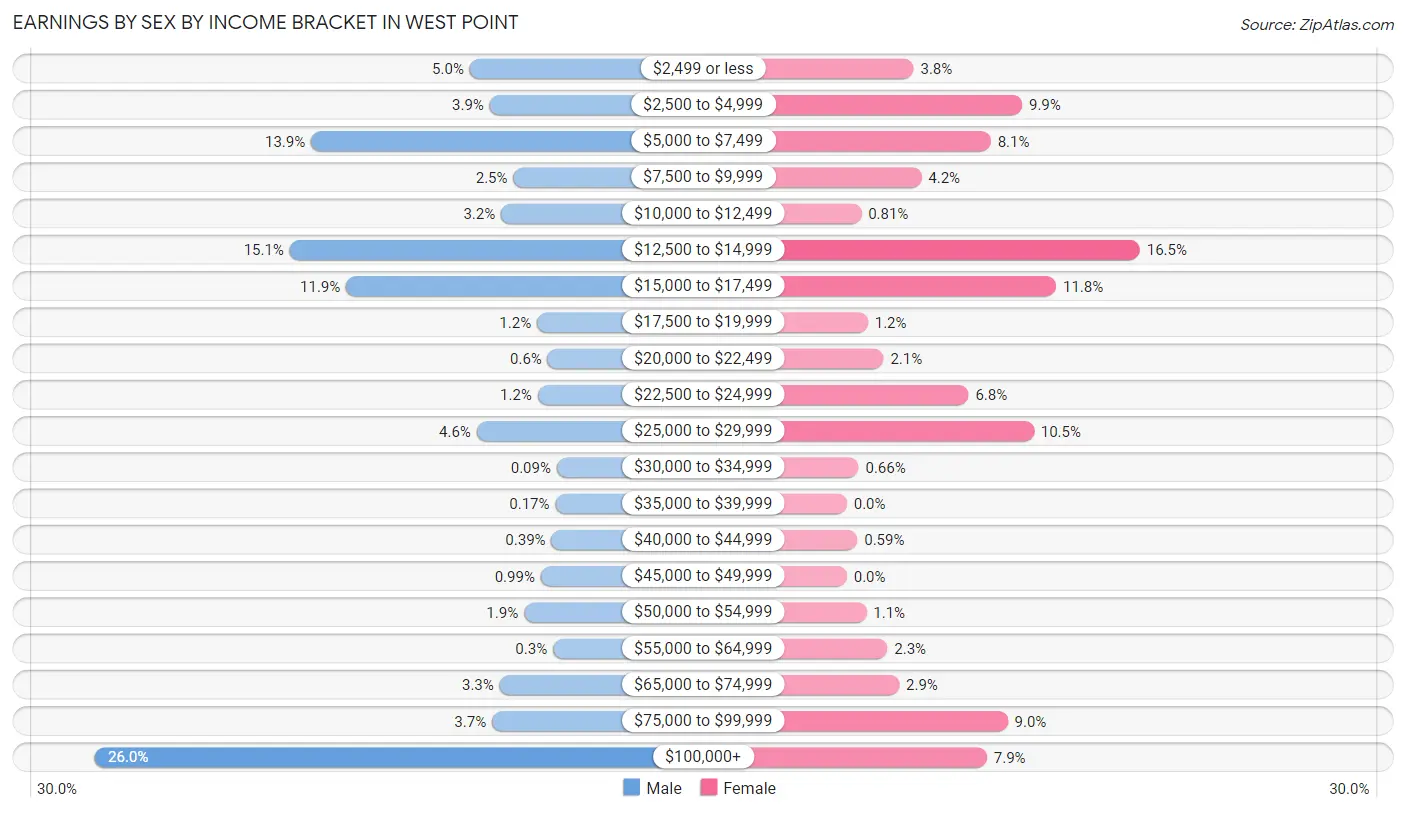
Earnings by Sex by Income Bracket in West Point
The most common earnings brackets in West Point are $100,000+ for men (607 | 26.0%) and $12,500 to $14,999 for women (224 | 16.5%).
| Income | Male | Female |
| $2,499 or less | 116 (5.0%) | 51 (3.7%) |
| $2,500 to $4,999 | 90 (3.9%) | 134 (9.9%) |
| $5,000 to $7,499 | 324 (13.9%) | 110 (8.1%) |
| $7,500 to $9,999 | 59 (2.5%) | 57 (4.2%) |
| $10,000 to $12,499 | 75 (3.2%) | 11 (0.8%) |
| $12,500 to $14,999 | 352 (15.1%) | 224 (16.5%) |
| $15,000 to $17,499 | 278 (11.9%) | 160 (11.8%) |
| $17,500 to $19,999 | 28 (1.2%) | 16 (1.2%) |
| $20,000 to $22,499 | 14 (0.6%) | 28 (2.1%) |
| $22,500 to $24,999 | 27 (1.2%) | 93 (6.8%) |
| $25,000 to $29,999 | 107 (4.6%) | 143 (10.5%) |
| $30,000 to $34,999 | 2 (0.1%) | 9 (0.7%) |
| $35,000 to $39,999 | 4 (0.2%) | 0 (0.0%) |
| $40,000 to $44,999 | 9 (0.4%) | 8 (0.6%) |
| $45,000 to $49,999 | 23 (1.0%) | 0 (0.0%) |
| $50,000 to $54,999 | 45 (1.9%) | 15 (1.1%) |
| $55,000 to $64,999 | 7 (0.3%) | 31 (2.3%) |
| $65,000 to $74,999 | 77 (3.3%) | 40 (2.9%) |
| $75,000 to $99,999 | 87 (3.7%) | 123 (9.0%) |
| $100,000+ | 607 (26.0%) | 107 (7.9%) |
| Total | 2,331 (100.0%) | 1,360 (100.0%) |
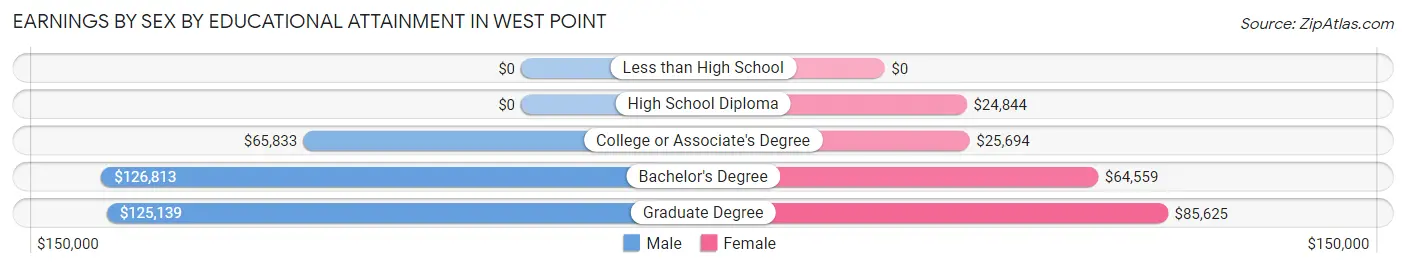
Earnings by Sex by Educational Attainment in West Point
Average earnings in West Point are $121,765 for men and $64,632 for women, a difference of 46.9%. Men with an educational attainment of bachelor's degree enjoy the highest average annual earnings of $126,813, while those with college or associate's degree education earn the least with $65,833. Women with an educational attainment of graduate degree earn the most with the average annual earnings of $85,625, while those with high school diploma education have the smallest earnings of $24,844.
| Educational Attainment | Male Income | Female Income |
| Less than High School | - | - |
| High School Diploma | - | - |
| College or Associate's Degree | $65,833 | $25,694 |
| Bachelor's Degree | $126,813 | $64,559 |
| Graduate Degree | $125,139 | $85,625 |
| Total | $121,765 | $64,632 |
Family Income in West Point
Family Income Brackets in West Point
According to the West Point family income data, there are 368 families falling into the $100,000 to $149,999 income range, which is the most common income bracket and makes up 38.9% of all families.
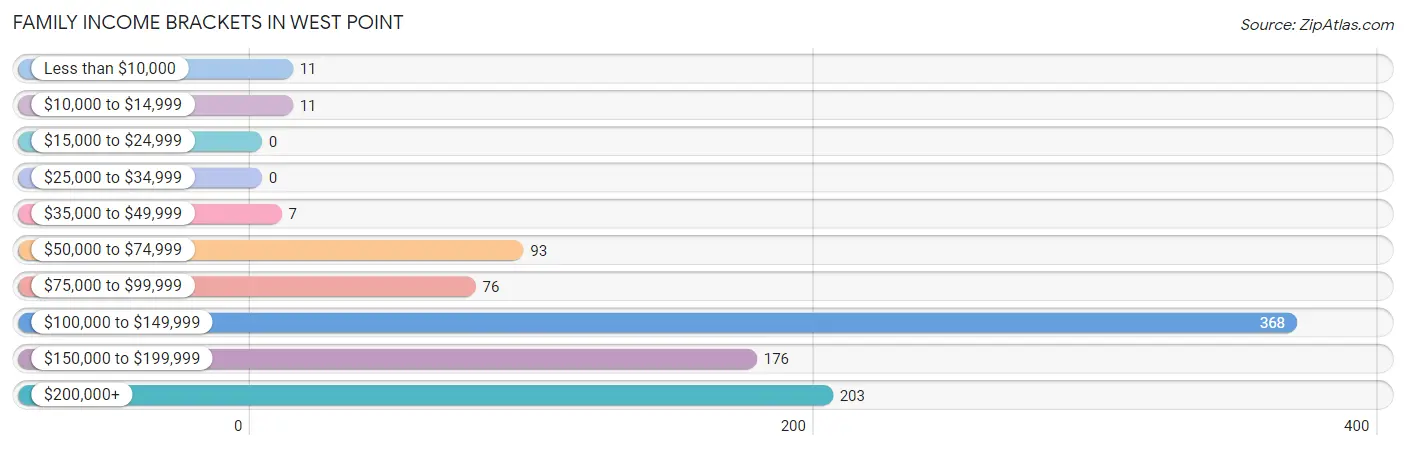
| Income Bracket | # Families | % Families |
| Less than $10,000 | 11 | 1.2% |
| $10,000 to $14,999 | 11 | 1.2% |
| $15,000 to $24,999 | 0 | 0.0% |
| $25,000 to $34,999 | 0 | 0.0% |
| $35,000 to $49,999 | 7 | 0.7% |
| $50,000 to $74,999 | 93 | 9.8% |
| $75,000 to $99,999 | 76 | 8.0% |
| $100,000 to $149,999 | 368 | 38.9% |
| $150,000 to $199,999 | 176 | 18.6% |
| $200,000+ | 203 | 21.5% |
Family Income by Famaliy Size in West Point
7+ person families (65 | 6.9%) account for the highest median family income in West Point with $196,103 per family, while 2-person families (161 | 17.0%) have the highest median income of $56,802 per family member.
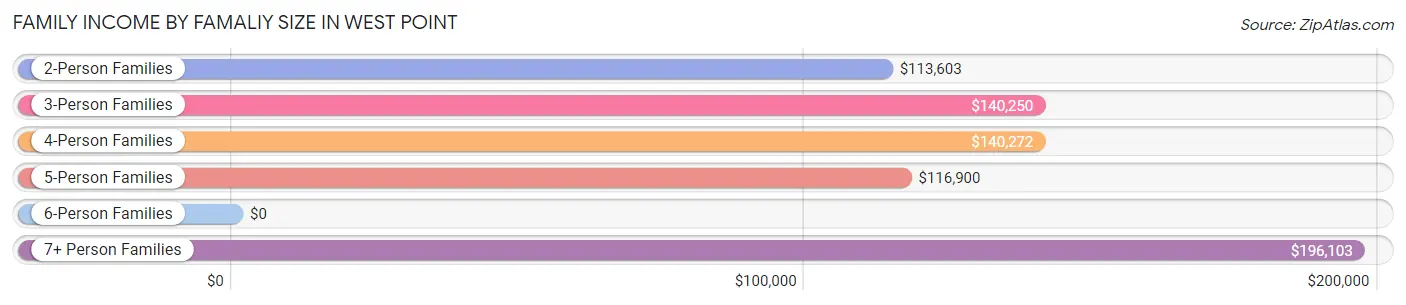
| Income Bracket | # Families | Median Income |
| 2-Person Families | 161 (17.0%) | $113,603 |
| 3-Person Families | 179 (18.9%) | $140,250 |
| 4-Person Families | 347 (36.7%) | $140,272 |
| 5-Person Families | 154 (16.3%) | $116,900 |
| 6-Person Families | 39 (4.1%) | $0 |
| 7+ Person Families | 65 (6.9%) | $196,103 |
| Total | 945 (100.0%) | $134,929 |
Family Income by Number of Earners in West Point
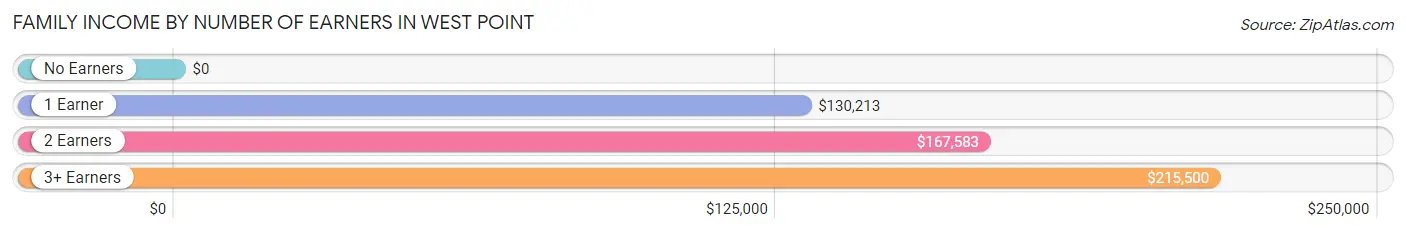
| Number of Earners | # Families | Median Income |
| No Earners | 4 (0.4%) | $0 |
| 1 Earner | 499 (52.8%) | $130,213 |
| 2 Earners | 372 (39.4%) | $167,583 |
| 3+ Earners | 70 (7.4%) | $215,500 |
| Total | 945 (100.0%) | $134,929 |
Household Income in West Point
Household Income Brackets in West Point
With 376 households falling in the category, the $100,000 to $149,999 income range is the most frequent in West Point, accounting for 35.4% of all households.
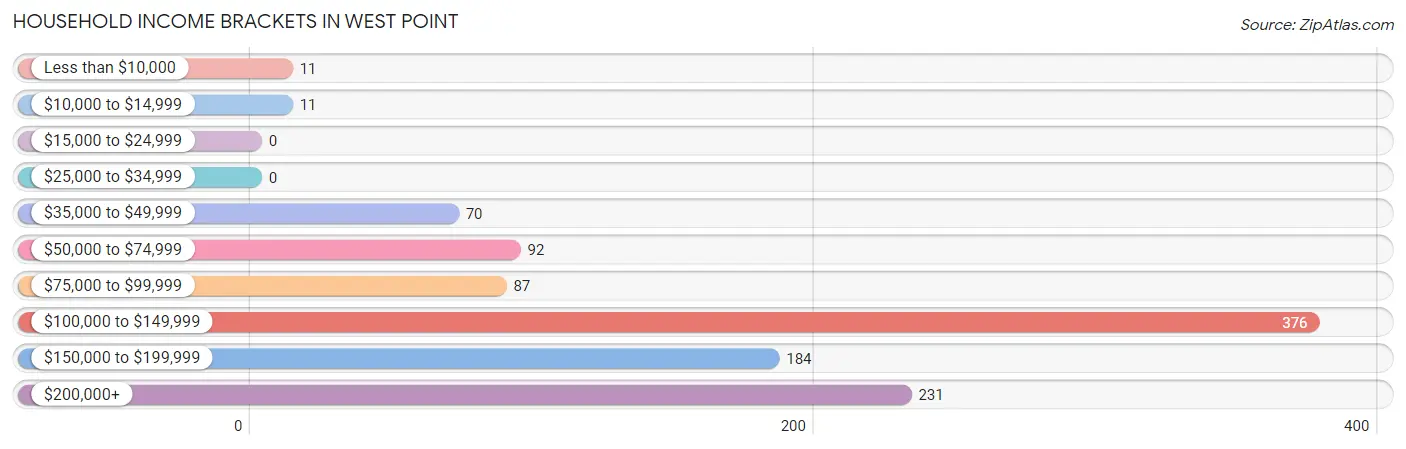
| Income Bracket | # Households | % Households |
| Less than $10,000 | 11 | 1.0% |
| $10,000 to $14,999 | 11 | 1.0% |
| $15,000 to $24,999 | 0 | 0.0% |
| $25,000 to $34,999 | 0 | 0.0% |
| $35,000 to $49,999 | 70 | 6.6% |
| $50,000 to $74,999 | 92 | 8.7% |
| $75,000 to $99,999 | 87 | 8.2% |
| $100,000 to $149,999 | 376 | 35.4% |
| $150,000 to $199,999 | 184 | 17.3% |
| $200,000+ | 231 | 21.7% |
Household Income by Householder Age in West Point
The median household income in West Point is $133,844, with the highest median household income of $189,554 found in the 45 to 64 years age bracket for the primary householder. A total of 314 households (29.5%) fall into this category. Meanwhile, the 15 to 24 years age bracket for the primary householder has the lowest median household income of $0, with 65 households (6.1%) in this group.
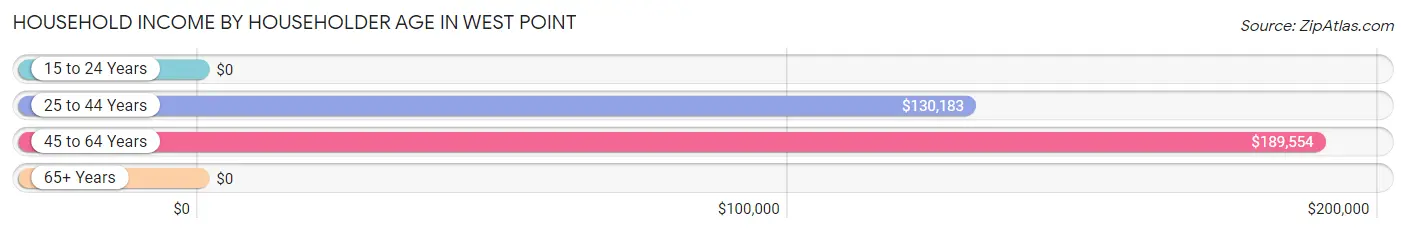
| Income Bracket | # Households | Median Income |
| 15 to 24 Years | 65 (6.1%) | $0 |
| 25 to 44 Years | 674 (63.4%) | $130,183 |
| 45 to 64 Years | 314 (29.5%) | $189,554 |
| 65+ Years | 10 (0.9%) | $0 |
| Total | 1,063 (100.0%) | $133,844 |
Poverty in West Point
Income Below Poverty by Sex and Age in West Point
With 1.7% poverty level for males and 5.6% for females among the residents of West Point, 18 to 24 year old males and 18 to 24 year old females are the most vulnerable to poverty, with 27 males (20.8%) and 84 females (29.9%) in their respective age groups living below the poverty level.
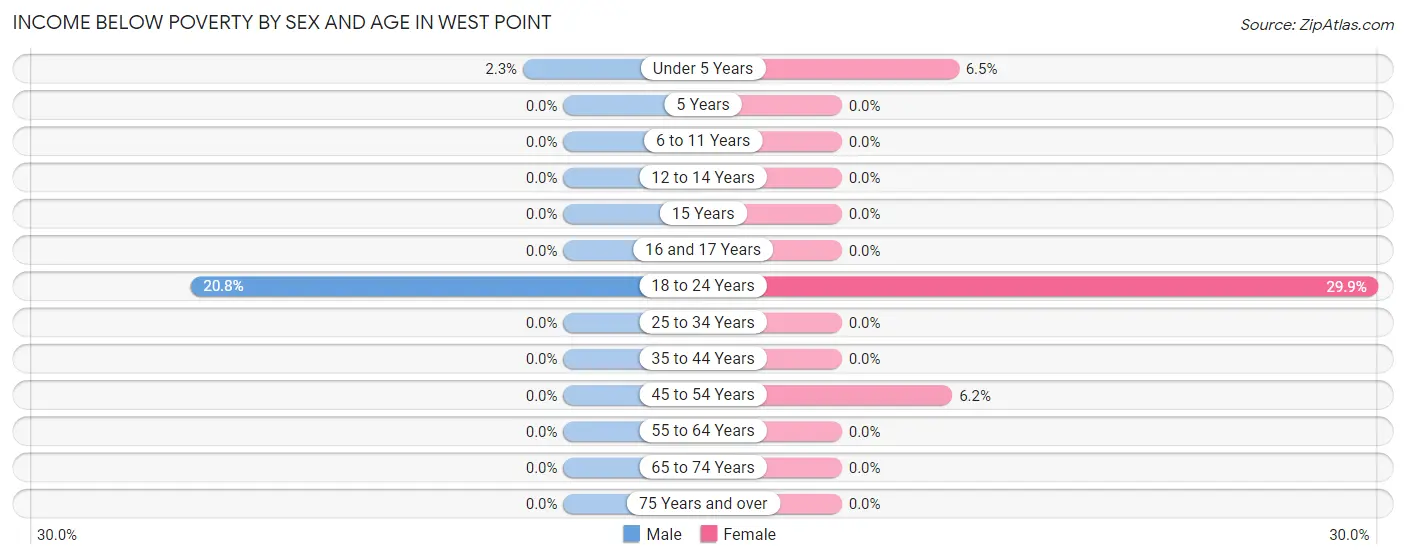
| Age Bracket | Male | Female |
| Under 5 Years | 7 (2.2%) | 14 (6.5%) |
| 5 Years | 0 (0.0%) | 0 (0.0%) |
| 6 to 11 Years | 0 (0.0%) | 0 (0.0%) |
| 12 to 14 Years | 0 (0.0%) | 0 (0.0%) |
| 15 Years | 0 (0.0%) | 0 (0.0%) |
| 16 and 17 Years | 0 (0.0%) | 0 (0.0%) |
| 18 to 24 Years | 27 (20.8%) | 84 (29.9%) |
| 25 to 34 Years | 0 (0.0%) | 0 (0.0%) |
| 35 to 44 Years | 0 (0.0%) | 0 (0.0%) |
| 45 to 54 Years | 0 (0.0%) | 11 (6.1%) |
| 55 to 64 Years | 0 (0.0%) | 0 (0.0%) |
| 65 to 74 Years | 0 (0.0%) | 0 (0.0%) |
| 75 Years and over | 0 (0.0%) | 0 (0.0%) |
| Total | 34 (1.7%) | 109 (5.6%) |
Income Above Poverty by Sex and Age in West Point
According to the poverty statistics in West Point, males aged 5 years and females aged 5 years are the age groups that are most secure financially, with 100.0% of males and 100.0% of females in these age groups living above the poverty line.
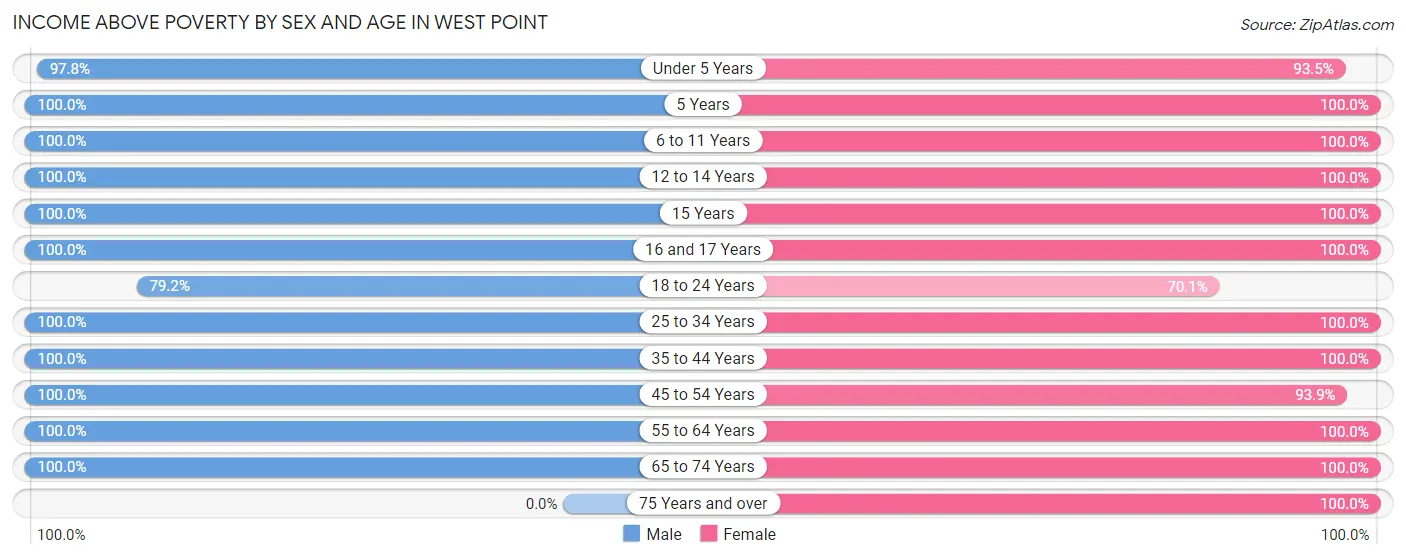
| Age Bracket | Male | Female |
| Under 5 Years | 304 (97.8%) | 201 (93.5%) |
| 5 Years | 62 (100.0%) | 90 (100.0%) |
| 6 to 11 Years | 385 (100.0%) | 217 (100.0%) |
| 12 to 14 Years | 149 (100.0%) | 141 (100.0%) |
| 15 Years | 22 (100.0%) | 49 (100.0%) |
| 16 and 17 Years | 59 (100.0%) | 25 (100.0%) |
| 18 to 24 Years | 103 (79.2%) | 197 (70.1%) |
| 25 to 34 Years | 205 (100.0%) | 255 (100.0%) |
| 35 to 44 Years | 390 (100.0%) | 396 (100.0%) |
| 45 to 54 Years | 235 (100.0%) | 168 (93.9%) |
| 55 to 64 Years | 60 (100.0%) | 79 (100.0%) |
| 65 to 74 Years | 10 (100.0%) | 8 (100.0%) |
| 75 Years and over | 0 (0.0%) | 11 (100.0%) |
| Total | 1,984 (98.3%) | 1,837 (94.4%) |
Income Below Poverty Among Married-Couple Families in West Point
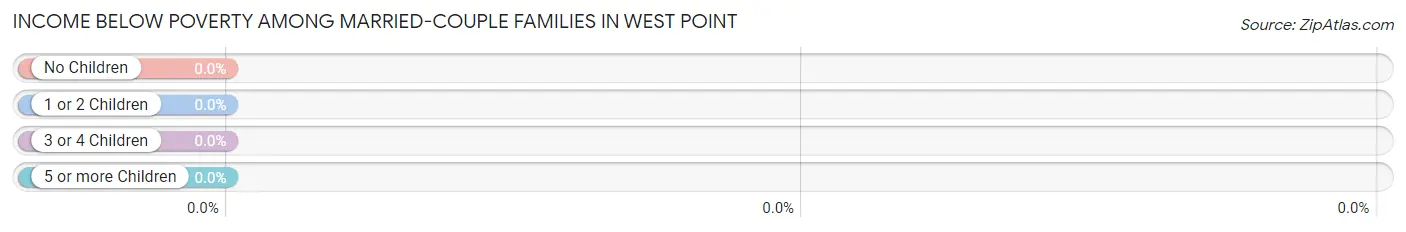
| Children | Above Poverty | Below Poverty |
| No Children | 132 (100.0%) | 0 (0.0%) |
| 1 or 2 Children | 475 (100.0%) | 0 (0.0%) |
| 3 or 4 Children | 178 (100.0%) | 0 (0.0%) |
| 5 or more Children | 42 (100.0%) | 0 (0.0%) |
| Total | 827 (100.0%) | 0 (0.0%) |
Income Below Poverty Among Single-Parent Households in West Point
According to the poverty data in West Point, 35.5% or 11 single-father households and 12.6% or 11 single-mother households are living below the poverty line. Among single-father households, those with 3 or 4 children have the highest poverty rate, with 11 households (64.7%) experiencing poverty. Likewise, among single-mother households, those with no children have the highest poverty rate, with 11 households (45.8%) falling below the poverty line.
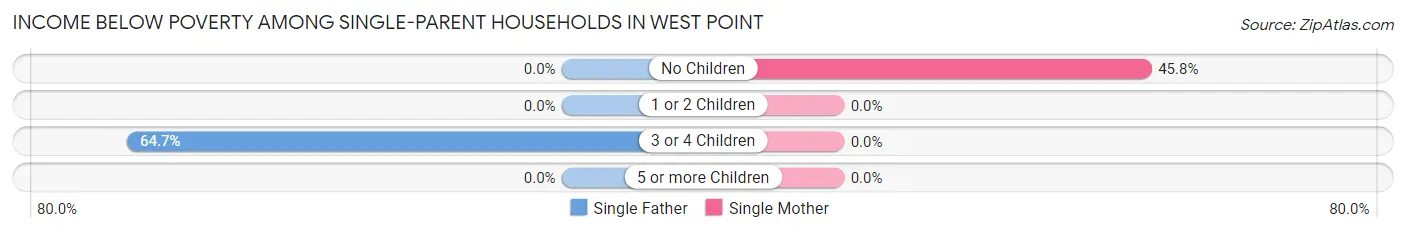
| Children | Single Father | Single Mother |
| No Children | 0 (0.0%) | 11 (45.8%) |
| 1 or 2 Children | 0 (0.0%) | 0 (0.0%) |
| 3 or 4 Children | 11 (64.7%) | 0 (0.0%) |
| 5 or more Children | 0 (0.0%) | 0 (0.0%) |
| Total | 11 (35.5%) | 11 (12.6%) |
Income Below Poverty Among Married-Couple vs Single-Parent Households in West Point
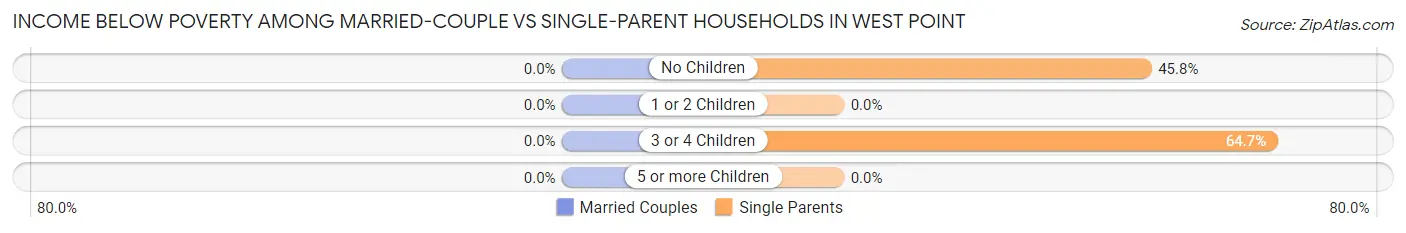
| Children | Married-Couple Families | Single-Parent Households |
| No Children | 0 (0.0%) | 11 (45.8%) |
| 1 or 2 Children | 0 (0.0%) | 0 (0.0%) |
| 3 or 4 Children | 0 (0.0%) | 11 (64.7%) |
| 5 or more Children | 0 (0.0%) | 0 (0.0%) |
| Total | 0 (0.0%) | 22 (18.6%) |
Race in West Point
The most populous races in West Point are White / Caucasian (4,730 | 74.1%), Two or more Races (749 | 11.7%), and Hispanic or Latino (689 | 10.8%).
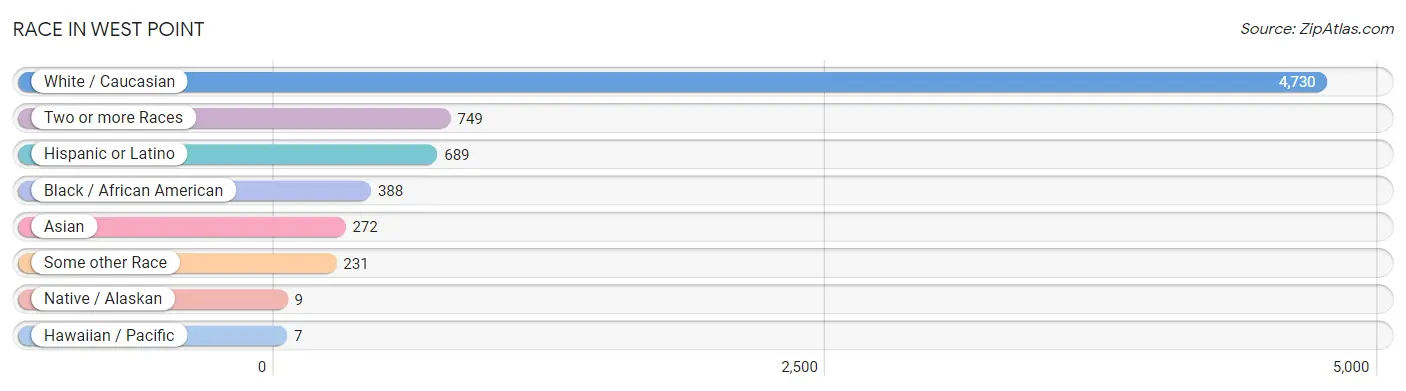
| Race | # Population | % Population |
| Asian | 272 | 4.3% |
| Black / African American | 388 | 6.1% |
| Hawaiian / Pacific | 7 | 0.1% |
| Hispanic or Latino | 689 | 10.8% |
| Native / Alaskan | 9 | 0.1% |
| White / Caucasian | 4,730 | 74.1% |
| Two or more Races | 749 | 11.7% |
| Some other Race | 231 | 3.6% |
| Total | 6,386 | 100.0% |
Ancestry in West Point
The most populous ancestries reported in West Point are Irish (1,016 | 15.9%), German (810 | 12.7%), American (526 | 8.2%), Italian (504 | 7.9%), and English (419 | 6.6%), together accounting for 51.3% of all West Point residents.
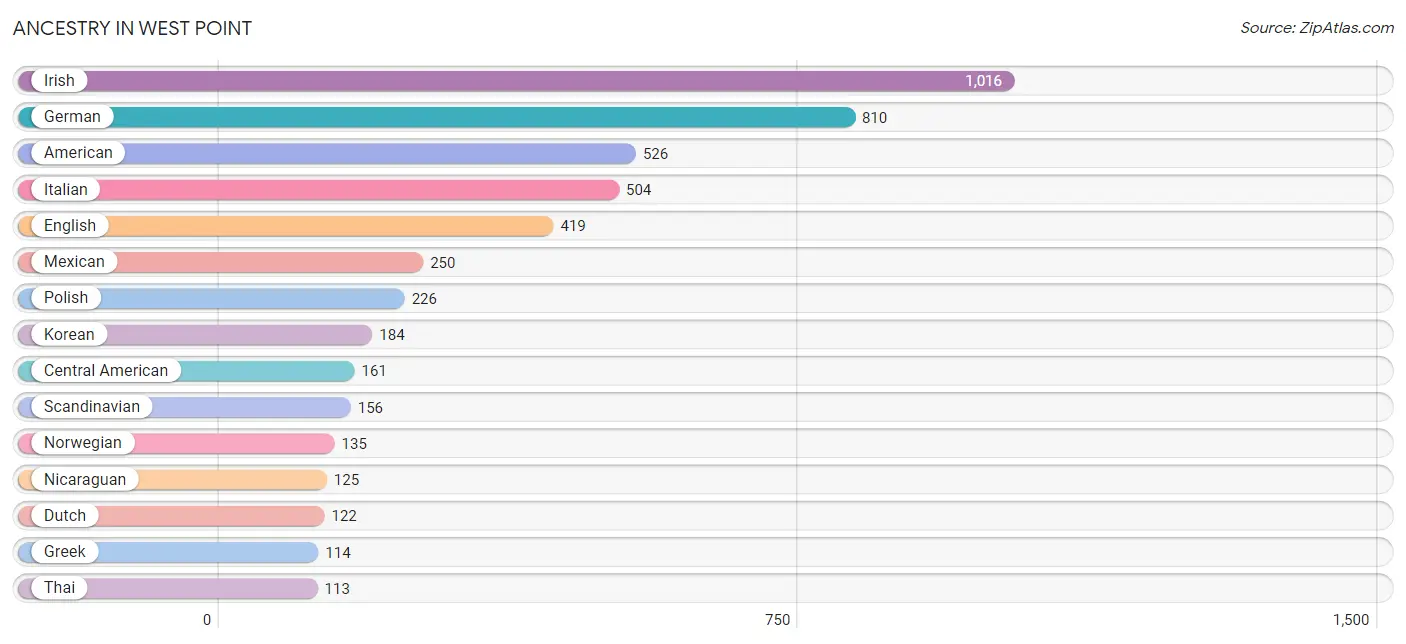
| Ancestry | # Population | % Population |
| African | 6 | 0.1% |
| American | 526 | 8.2% |
| Apache | 10 | 0.2% |
| Arab | 107 | 1.7% |
| Australian | 17 | 0.3% |
| Bhutanese | 42 | 0.7% |
| Bolivian | 7 | 0.1% |
| British | 58 | 0.9% |
| Burmese | 48 | 0.7% |
| Cajun | 17 | 0.3% |
| Cambodian | 7 | 0.1% |
| Celtic | 8 | 0.1% |
| Central American | 161 | 2.5% |
| Cherokee | 75 | 1.2% |
| Choctaw | 53 | 0.8% |
| Colombian | 21 | 0.3% |
| Croatian | 6 | 0.1% |
| Cuban | 81 | 1.3% |
| Czech | 8 | 0.1% |
| Danish | 8 | 0.1% |
| Dominican | 57 | 0.9% |
| Dutch | 122 | 1.9% |
| Eastern European | 50 | 0.8% |
| Egyptian | 16 | 0.3% |
| English | 419 | 6.6% |
| Ethiopian | 8 | 0.1% |
| European | 40 | 0.6% |
| Finnish | 4 | 0.1% |
| French | 112 | 1.8% |
| French Canadian | 107 | 1.7% |
| German | 810 | 12.7% |
| Greek | 114 | 1.8% |
| Guamanian / Chamorro | 7 | 0.1% |
| Guyanese | 3 | 0.1% |
| Haitian | 4 | 0.1% |
| Hungarian | 8 | 0.1% |
| Indian (Asian) | 69 | 1.1% |
| Iranian | 85 | 1.3% |
| Irish | 1,016 | 15.9% |
| Italian | 504 | 7.9% |
| Korean | 184 | 2.9% |
| Latvian | 20 | 0.3% |
| Lebanese | 91 | 1.4% |
| Lithuanian | 4 | 0.1% |
| Mexican | 250 | 3.9% |
| Native Hawaiian | 16 | 0.3% |
| Nicaraguan | 125 | 2.0% |
| Nigerian | 7 | 0.1% |
| Norwegian | 135 | 2.1% |
| Panamanian | 21 | 0.3% |
| Polish | 226 | 3.5% |
| Portuguese | 44 | 0.7% |
| Puerto Rican | 77 | 1.2% |
| Russian | 35 | 0.5% |
| Salvadoran | 15 | 0.2% |
| Scandinavian | 156 | 2.4% |
| Scotch-Irish | 10 | 0.2% |
| Scottish | 77 | 1.2% |
| Slovak | 10 | 0.2% |
| South American | 44 | 0.7% |
| Spaniard | 11 | 0.2% |
| Sri Lankan | 11 | 0.2% |
| Subsaharan African | 97 | 1.5% |
| Swedish | 108 | 1.7% |
| Swiss | 15 | 0.2% |
| Thai | 113 | 1.8% |
| Trinidadian and Tobagonian | 7 | 0.1% |
| Ukrainian | 14 | 0.2% |
| Venezuelan | 16 | 0.3% |
| Welsh | 14 | 0.2% | View All 70 Rows |
Immigrants in West Point
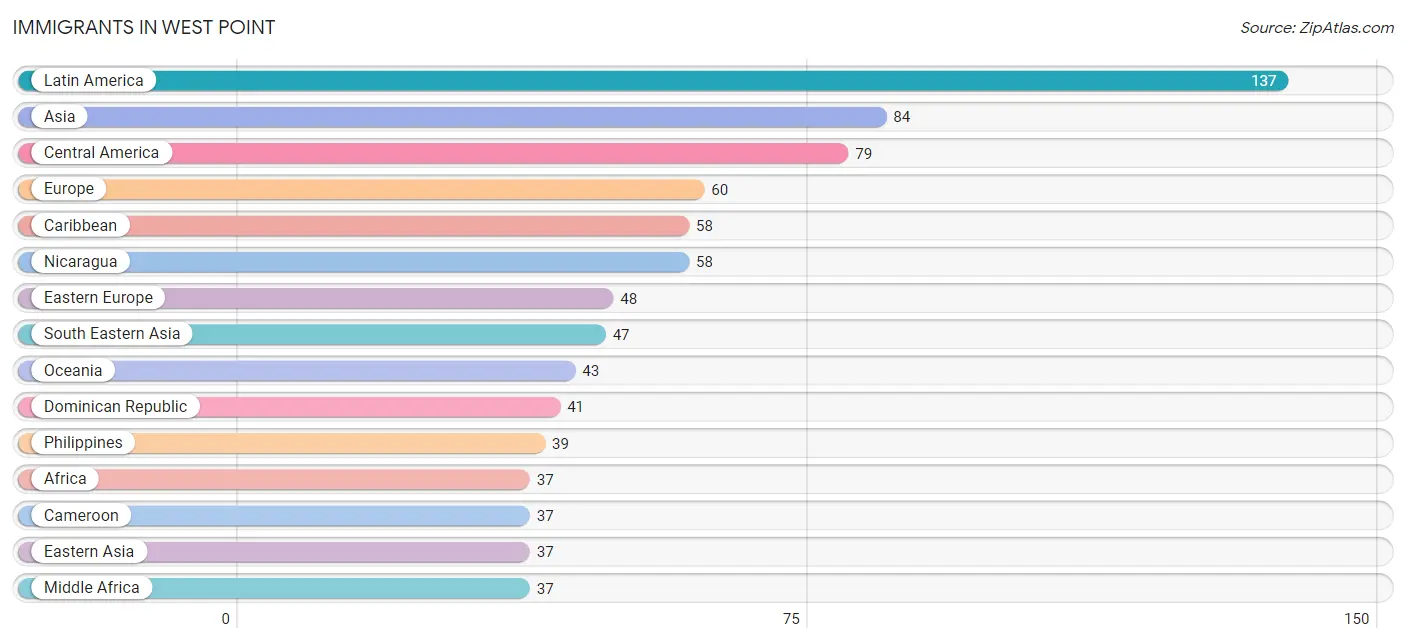
The most numerous immigrant groups reported in West Point came from Latin America (137 | 2.1%), Asia (84 | 1.3%), Central America (79 | 1.2%), Europe (60 | 0.9%), and Caribbean (58 | 0.9%), together accounting for 6.6% of all West Point residents.
| Immigration Origin | # Population | % Population |
| Africa | 37 | 0.6% |
| Asia | 84 | 1.3% |
| Australia | 6 | 0.1% |
| Cameroon | 37 | 0.6% |
| Canada | 18 | 0.3% |
| Caribbean | 58 | 0.9% |
| Central America | 79 | 1.2% |
| Cuba | 13 | 0.2% |
| Dominican Republic | 41 | 0.6% |
| Eastern Asia | 37 | 0.6% |
| Eastern Europe | 48 | 0.7% |
| Europe | 60 | 0.9% |
| Germany | 5 | 0.1% |
| Haiti | 4 | 0.1% |
| Ireland | 7 | 0.1% |
| Japan | 14 | 0.2% |
| Korea | 16 | 0.3% |
| Latin America | 137 | 2.1% |
| Middle Africa | 37 | 0.6% |
| Nicaragua | 58 | 0.9% |
| Northern Europe | 7 | 0.1% |
| Oceania | 43 | 0.7% |
| Panama | 21 | 0.3% |
| Philippines | 39 | 0.6% |
| Poland | 14 | 0.2% |
| Russia | 6 | 0.1% |
| Singapore | 8 | 0.1% |
| South Eastern Asia | 47 | 0.7% |
| Ukraine | 10 | 0.2% |
| Western Europe | 5 | 0.1% | View All 30 Rows |
Sex and Age in West Point
Sex and Age in West Point
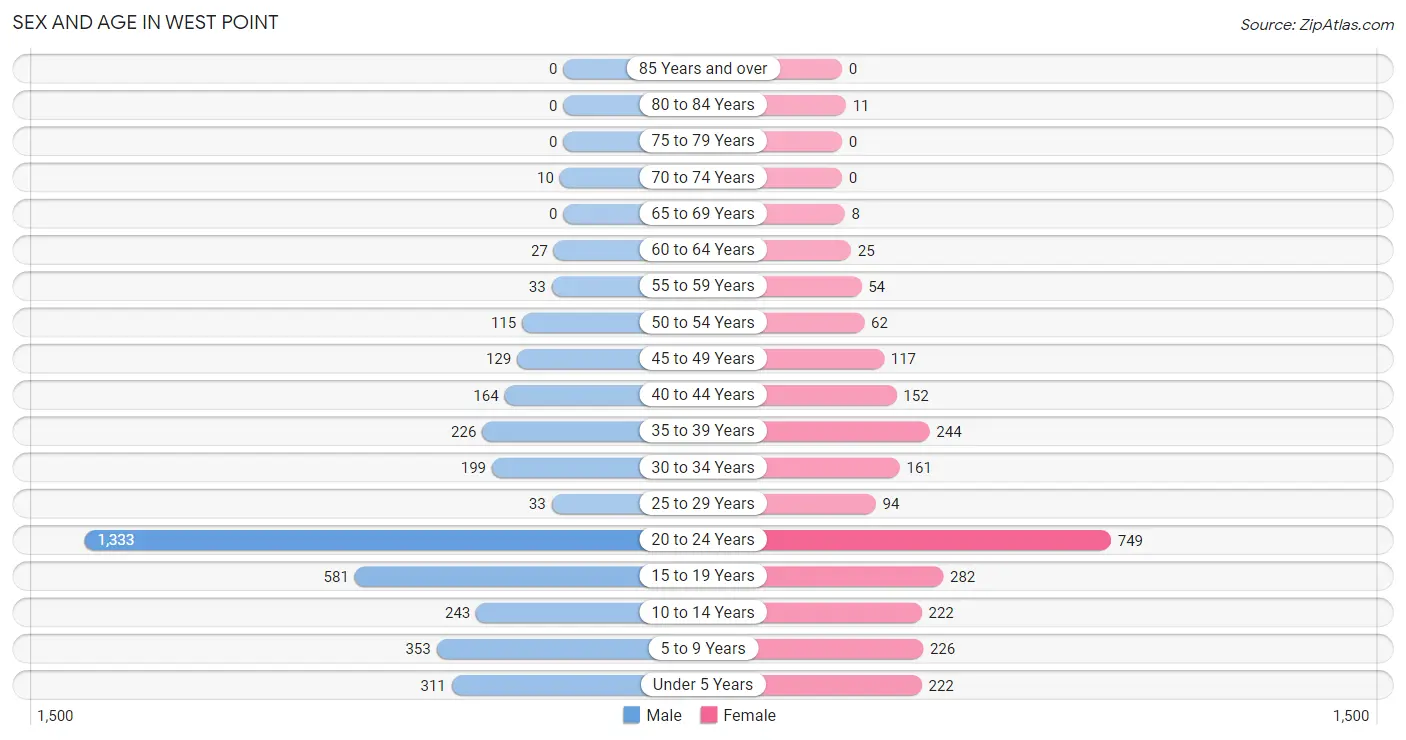
The most populous age groups in West Point are 20 to 24 Years (1,333 | 35.5%) for men and 20 to 24 Years (749 | 28.5%) for women.
| Age Bracket | Male | Female |
| Under 5 Years | 311 (8.3%) | 222 (8.4%) |
| 5 to 9 Years | 353 (9.4%) | 226 (8.6%) |
| 10 to 14 Years | 243 (6.5%) | 222 (8.4%) |
| 15 to 19 Years | 581 (15.5%) | 282 (10.7%) |
| 20 to 24 Years | 1,333 (35.5%) | 749 (28.5%) |
| 25 to 29 Years | 33 (0.9%) | 94 (3.6%) |
| 30 to 34 Years | 199 (5.3%) | 161 (6.1%) |
| 35 to 39 Years | 226 (6.0%) | 244 (9.3%) |
| 40 to 44 Years | 164 (4.4%) | 152 (5.8%) |
| 45 to 49 Years | 129 (3.4%) | 117 (4.4%) |
| 50 to 54 Years | 115 (3.1%) | 62 (2.4%) |
| 55 to 59 Years | 33 (0.9%) | 54 (2.1%) |
| 60 to 64 Years | 27 (0.7%) | 25 (0.9%) |
| 65 to 69 Years | 0 (0.0%) | 8 (0.3%) |
| 70 to 74 Years | 10 (0.3%) | 0 (0.0%) |
| 75 to 79 Years | 0 (0.0%) | 0 (0.0%) |
| 80 to 84 Years | 0 (0.0%) | 11 (0.4%) |
| 85 Years and over | 0 (0.0%) | 0 (0.0%) |
| Total | 3,757 (100.0%) | 2,629 (100.0%) |
Families and Households in West Point
Median Family Size in West Point
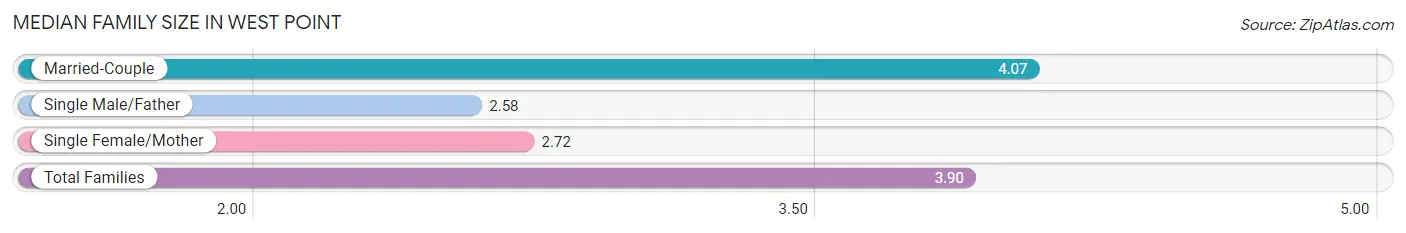
The median family size in West Point is 3.90 persons per family, with married-couple families (827 | 87.5%) accounting for the largest median family size of 4.07 persons per family. On the other hand, single male/father families (31 | 3.3%) represent the smallest median family size with 2.58 persons per family.
| Family Type | # Families | Family Size |
| Married-Couple | 827 (87.5%) | 4.07 |
| Single Male/Father | 31 (3.3%) | 2.58 |
| Single Female/Mother | 87 (9.2%) | 2.72 |
| Total Families | 945 (100.0%) | 3.90 |
Median Household Size in West Point
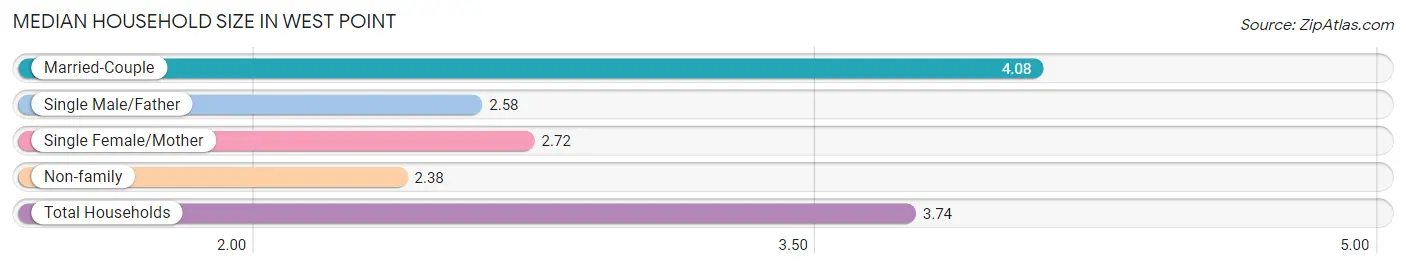
The median household size in West Point is 3.74 persons per household, with married-couple households (827 | 77.8%) accounting for the largest median household size of 4.08 persons per household. non-family households (118 | 11.1%) represent the smallest median household size with 2.38 persons per household.
| Household Type | # Households | Household Size |
| Married-Couple | 827 (77.8%) | 4.08 |
| Single Male/Father | 31 (2.9%) | 2.58 |
| Single Female/Mother | 87 (8.2%) | 2.72 |
| Non-family | 118 (11.1%) | 2.38 |
| Total Households | 1,063 (100.0%) | 3.74 |
Household Size by Marriage Status in West Point
Out of a total of 1,063 households in West Point, 945 (88.9%) are family households, while 118 (11.1%) are nonfamily households. The most numerous type of family households are 4-person households, comprising 347, and the most common type of nonfamily households are 4-person households, comprising 54.
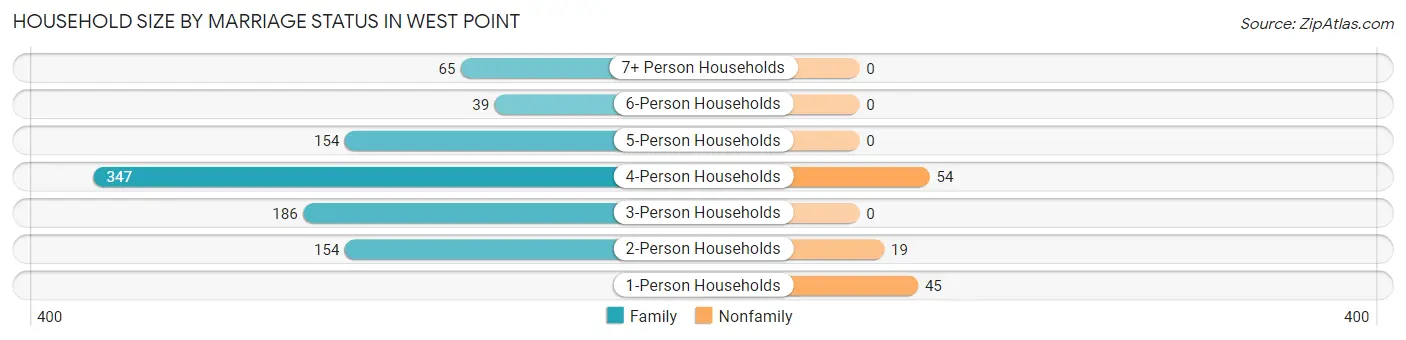
| Household Size | Family Households | Nonfamily Households |
| 1-Person Households | - | 45 (4.2%) |
| 2-Person Households | 154 (14.5%) | 19 (1.8%) |
| 3-Person Households | 186 (17.5%) | 0 (0.0%) |
| 4-Person Households | 347 (32.6%) | 54 (5.1%) |
| 5-Person Households | 154 (14.5%) | 0 (0.0%) |
| 6-Person Households | 39 (3.7%) | 0 (0.0%) |
| 7+ Person Households | 65 (6.1%) | 0 (0.0%) |
| Total | 945 (88.9%) | 118 (11.1%) |
Female Fertility in West Point
Fertility by Age in West Point
Average fertility rate in West Point is 43.0 births per 1,000 women. Women in the age bracket of 20 to 34 years have the highest fertility rate with 59.0 births per 1,000 women. Women in the age bracket of 20 to 34 years acount for 75.6% of all women with births.
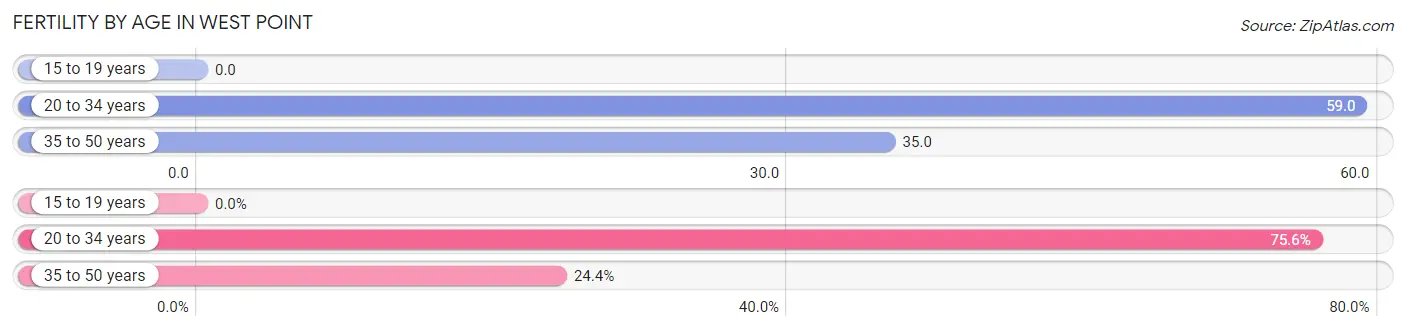
| Age Bracket | Women with Births | Births / 1,000 Women |
| 15 to 19 years | 0 (0.0%) | 0.0 |
| 20 to 34 years | 59 (75.6%) | 59.0 |
| 35 to 50 years | 19 (24.4%) | 35.0 |
| Total | 78 (100.0%) | 43.0 |
Fertility by Age by Marriage Status in West Point
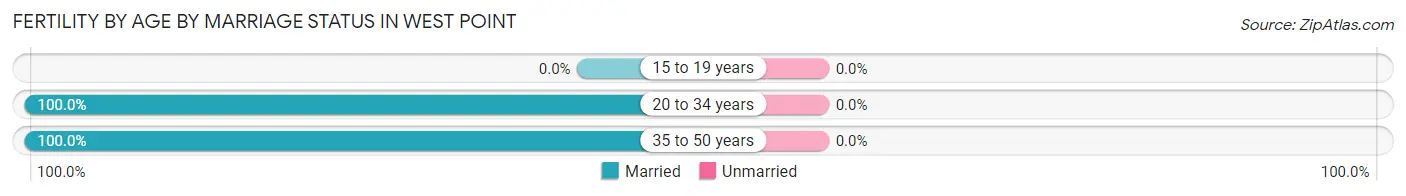
| Age Bracket | Married | Unmarried |
| 15 to 19 years | 0 (0.0%) | 0 (0.0%) |
| 20 to 34 years | 59 (100.0%) | 0 (0.0%) |
| 35 to 50 years | 19 (100.0%) | 0 (0.0%) |
| Total | 78 (100.0%) | 0 (0.0%) |
Fertility by Education in West Point
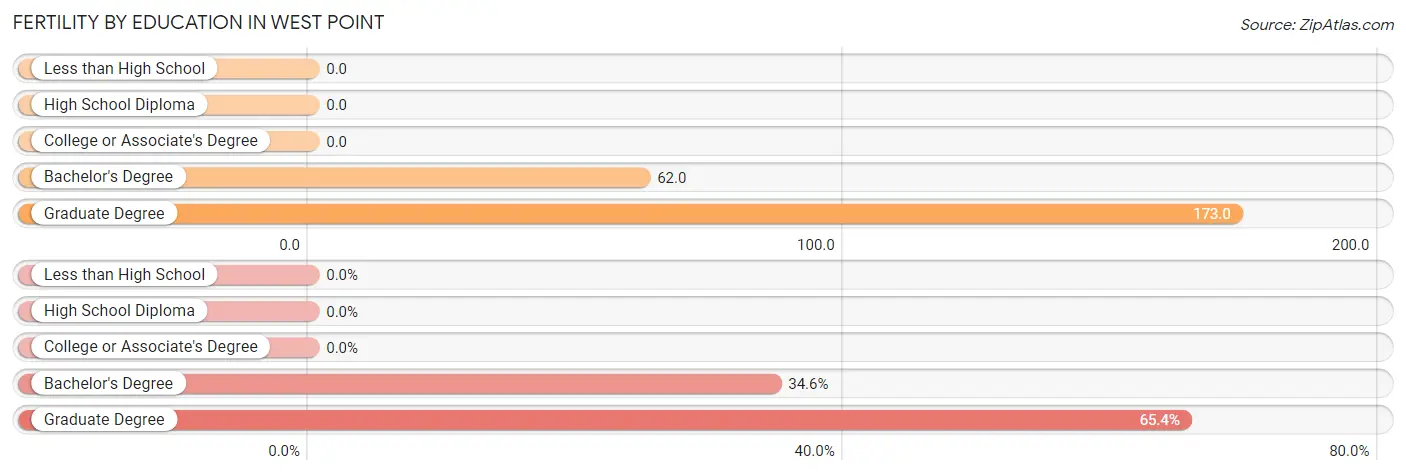
| Educational Attainment | Women with Births | Births / 1,000 Women |
| Less than High School | 0 (0.0%) | 0.0 |
| High School Diploma | 0 (0.0%) | 0.0 |
| College or Associate's Degree | 0 (0.0%) | 0.0 |
| Bachelor's Degree | 27 (34.6%) | 62.0 |
| Graduate Degree | 51 (65.4%) | 173.0 |
| Total | 78 (100.0%) | 43.0 |
Fertility by Education by Marriage Status in West Point
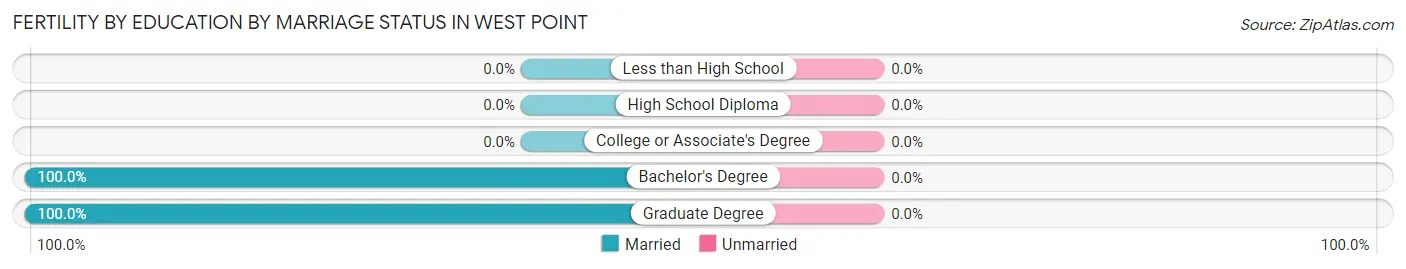
| Educational Attainment | Married | Unmarried |
| Less than High School | 0 (0.0%) | 0 (0.0%) |
| High School Diploma | 0 (0.0%) | 0 (0.0%) |
| College or Associate's Degree | 0 (0.0%) | 0 (0.0%) |
| Bachelor's Degree | 27 (100.0%) | 0 (0.0%) |
| Graduate Degree | 51 (100.0%) | 0 (0.0%) |
| Total | 78 (100.0%) | 0 (0.0%) |
Employment Characteristics in West Point
Employment by Class of Employer in West Point
Among the 3,364 employed individuals in West Point, federal government employees (2,712 | 80.6%), private company employees (386 | 11.5%), and not-for-profit organizations (85 | 2.5%) make up the most common classes of employment.
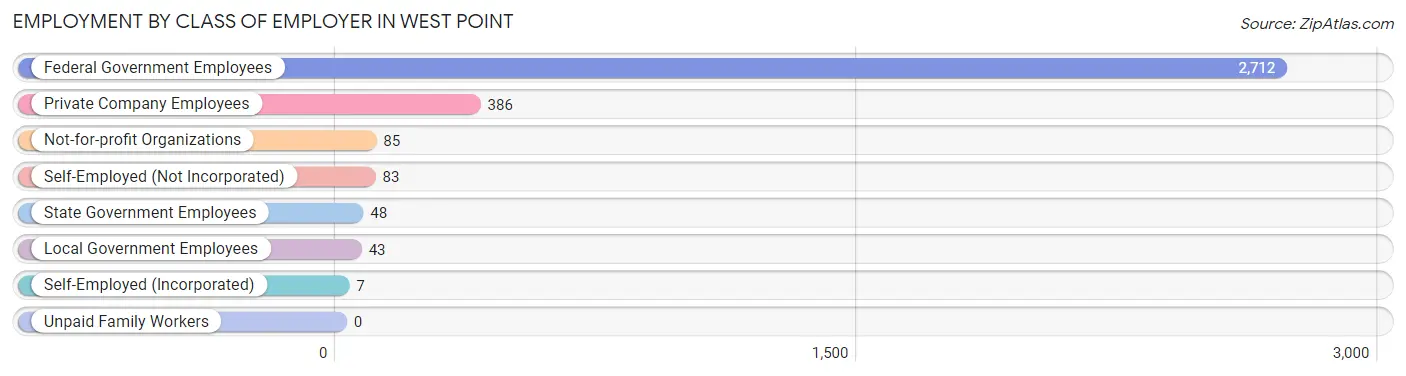
| Employer Class | # Employees | % Employees |
| Private Company Employees | 386 | 11.5% |
| Self-Employed (Incorporated) | 7 | 0.2% |
| Self-Employed (Not Incorporated) | 83 | 2.5% |
| Not-for-profit Organizations | 85 | 2.5% |
| Local Government Employees | 43 | 1.3% |
| State Government Employees | 48 | 1.4% |
| Federal Government Employees | 2,712 | 80.6% |
| Unpaid Family Workers | 0 | 0.0% |
| Total | 3,364 | 100.0% |
Employment Status by Age in West Point
According to the labor force statistics for West Point, out of the total population over 16 years of age (4,738), 75.6% or 3,582 individuals are in the labor force, with 3.2% or 115 of them unemployed. The age group with the highest labor force participation rate is 45 to 54 years, with 89.6% or 379 individuals in the labor force. Within the labor force, the 16 to 19 years age range has the highest percentage of unemployed individuals, with 22.1% or 82 of them being unemployed.
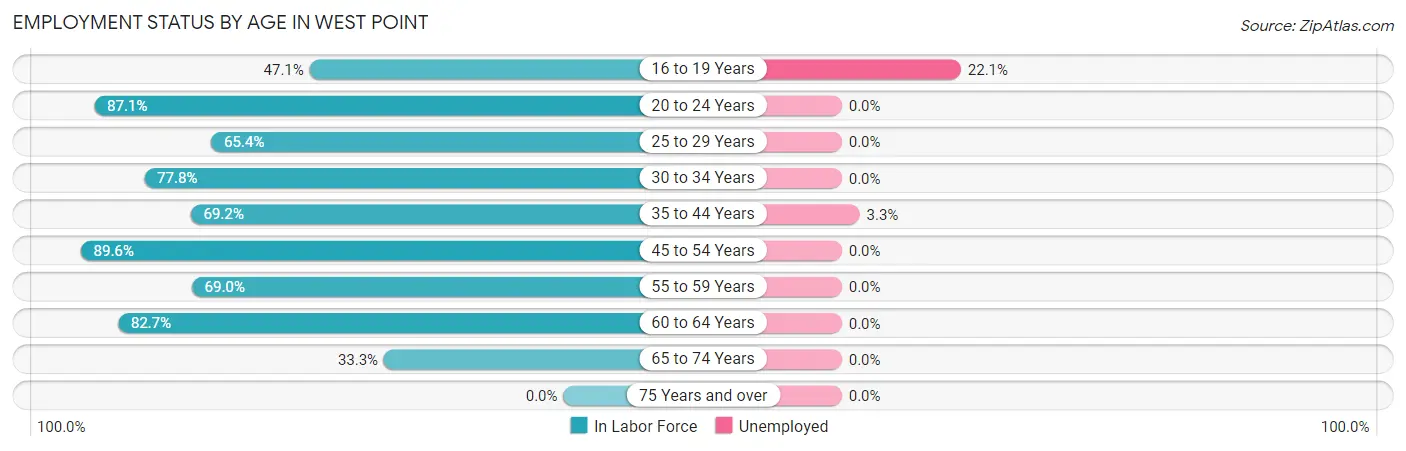
| Age Bracket | In Labor Force | Unemployed |
| 16 to 19 Years | 373 (47.1%) | 82 (22.1%) |
| 20 to 24 Years | 1,813 (87.1%) | 0 (0.0%) |
| 25 to 29 Years | 83 (65.4%) | 0 (0.0%) |
| 30 to 34 Years | 280 (77.8%) | 0 (0.0%) |
| 35 to 44 Years | 544 (69.2%) | 18 (3.3%) |
| 45 to 54 Years | 379 (89.6%) | 0 (0.0%) |
| 55 to 59 Years | 60 (69.0%) | 0 (0.0%) |
| 60 to 64 Years | 43 (82.7%) | 0 (0.0%) |
| 65 to 74 Years | 6 (33.3%) | 0 (0.0%) |
| 75 Years and over | 0 (0.0%) | 0 (0.0%) |
| Total | 3,582 (75.6%) | 115 (3.2%) |
Employment Status by Educational Attainment in West Point
According to labor force statistics for West Point, 75.7% of individuals (1,389) out of the total population between 25 and 64 years of age (1,835) are in the labor force, with 1.2% or 17 of them being unemployed. The group with the highest labor force participation rate are those with the educational attainment of less than high school, with 100.0% or 7 individuals in the labor force. Within the labor force, individuals with bachelor's degree or higher education have the highest percentage of unemployment, with 1.5% or 17 of them being unemployed.
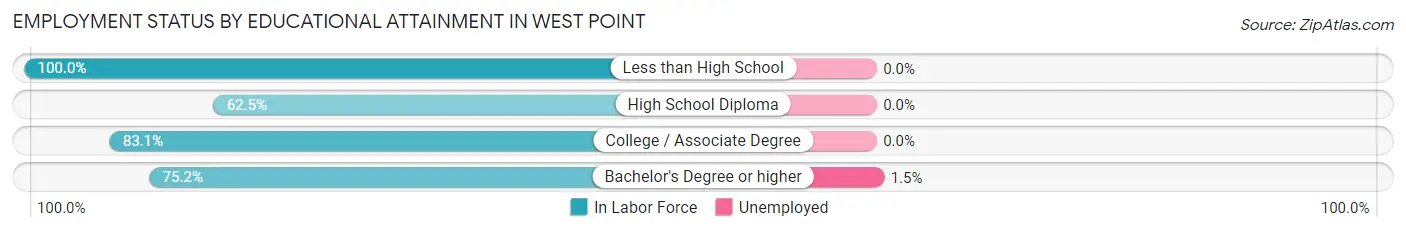
| Educational Attainment | In Labor Force | Unemployed |
| Less than High School | 7 (100.0%) | 0 (0.0%) |
| High School Diploma | 60 (62.5%) | 0 (0.0%) |
| College / Associate Degree | 202 (83.1%) | 0 (0.0%) |
| Bachelor's Degree or higher | 1,120 (75.2%) | 22 (1.5%) |
| Total | 1,389 (75.7%) | 22 (1.2%) |
Employment Occupations by Sex in West Point
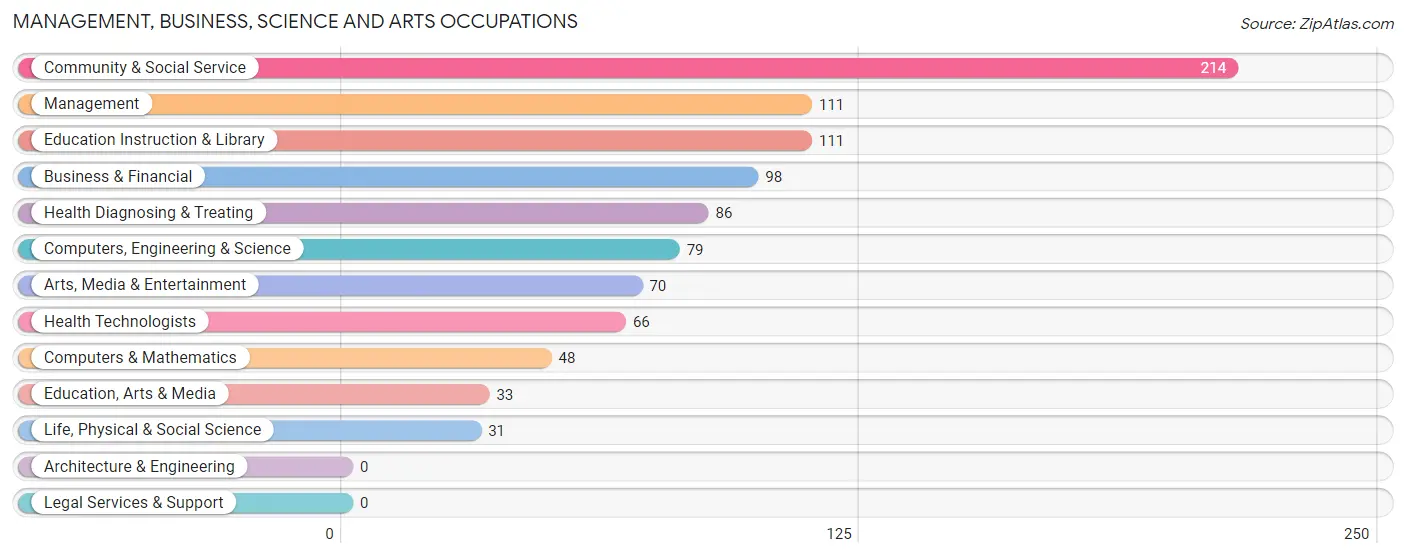
Management, Business, Science and Arts Occupations
The most common Management, Business, Science and Arts occupations in West Point are Community & Social Service (214 | 17.5%), Management (111 | 9.1%), Education Instruction & Library (111 | 9.1%), Business & Financial (98 | 8.0%), and Health Diagnosing & Treating (86 | 7.0%).
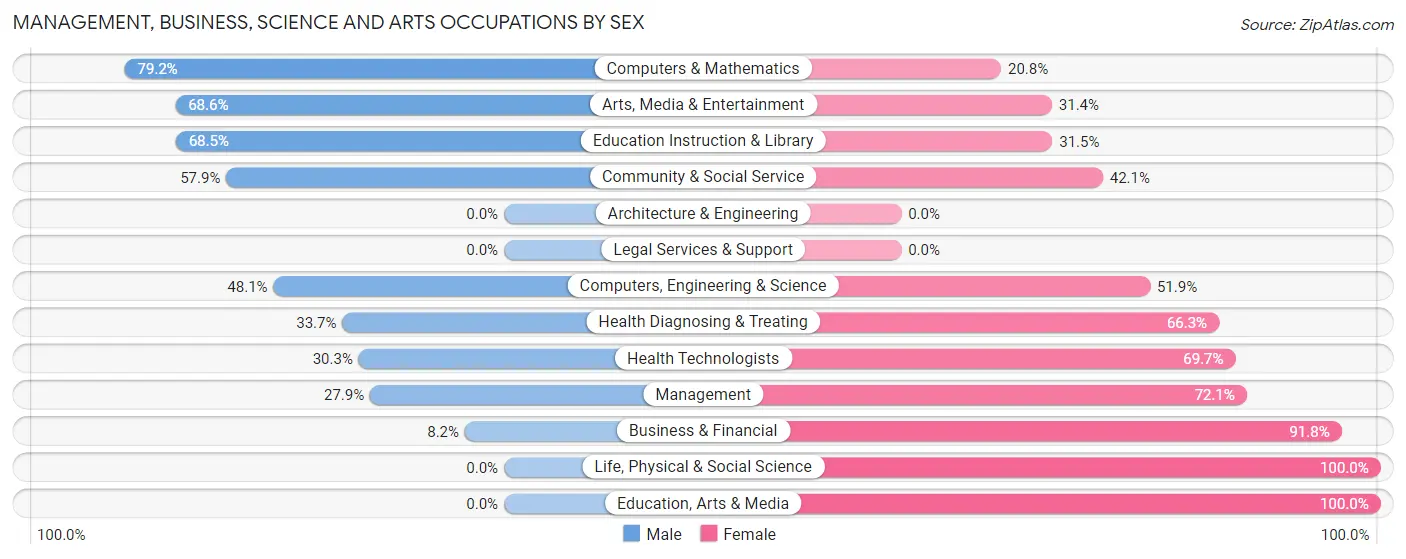
Management, Business, Science and Arts Occupations by Sex
Within the Management, Business, Science and Arts occupations in West Point, the most male-oriented occupations are Computers & Mathematics (79.2%), Arts, Media & Entertainment (68.6%), and Education Instruction & Library (68.5%), while the most female-oriented occupations are Life, Physical & Social Science (100.0%), Education, Arts & Media (100.0%), and Business & Financial (91.8%).
| Occupation | Male | Female |
| Management | 31 (27.9%) | 80 (72.1%) |
| Business & Financial | 8 (8.2%) | 90 (91.8%) |
| Computers, Engineering & Science | 38 (48.1%) | 41 (51.9%) |
| Computers & Mathematics | 38 (79.2%) | 10 (20.8%) |
| Architecture & Engineering | 0 (0.0%) | 0 (0.0%) |
| Life, Physical & Social Science | 0 (0.0%) | 31 (100.0%) |
| Community & Social Service | 124 (57.9%) | 90 (42.1%) |
| Education, Arts & Media | 0 (0.0%) | 33 (100.0%) |
| Legal Services & Support | 0 (0.0%) | 0 (0.0%) |
| Education Instruction & Library | 76 (68.5%) | 35 (31.5%) |
| Arts, Media & Entertainment | 48 (68.6%) | 22 (31.4%) |
| Health Diagnosing & Treating | 29 (33.7%) | 57 (66.3%) |
| Health Technologists | 20 (30.3%) | 46 (69.7%) |
| Total (Category) | 230 (39.1%) | 358 (60.9%) |
| Total (Overall) | 504 (41.2%) | 719 (58.8%) |
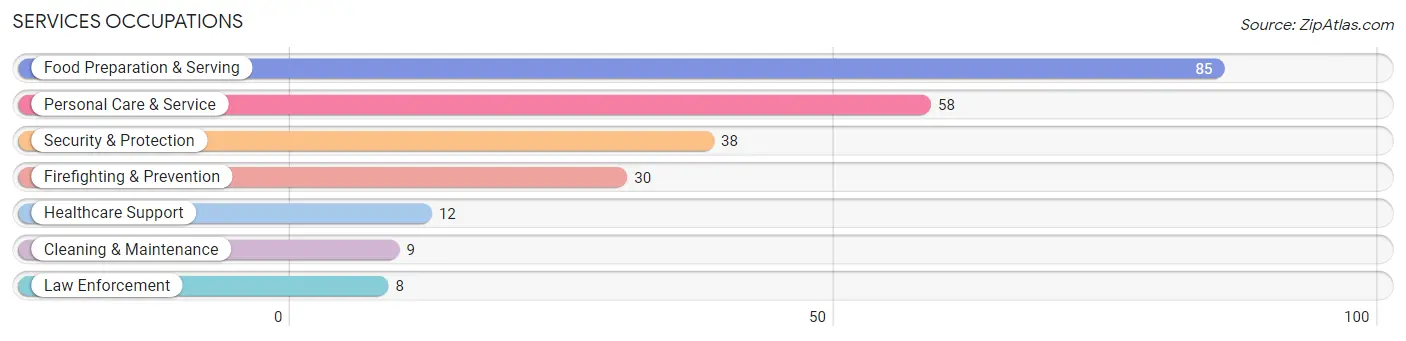
Services Occupations
The most common Services occupations in West Point are Food Preparation & Serving (85 | 7.0%), Personal Care & Service (58 | 4.7%), Security & Protection (38 | 3.1%), Firefighting & Prevention (30 | 2.5%), and Healthcare Support (12 | 1.0%).
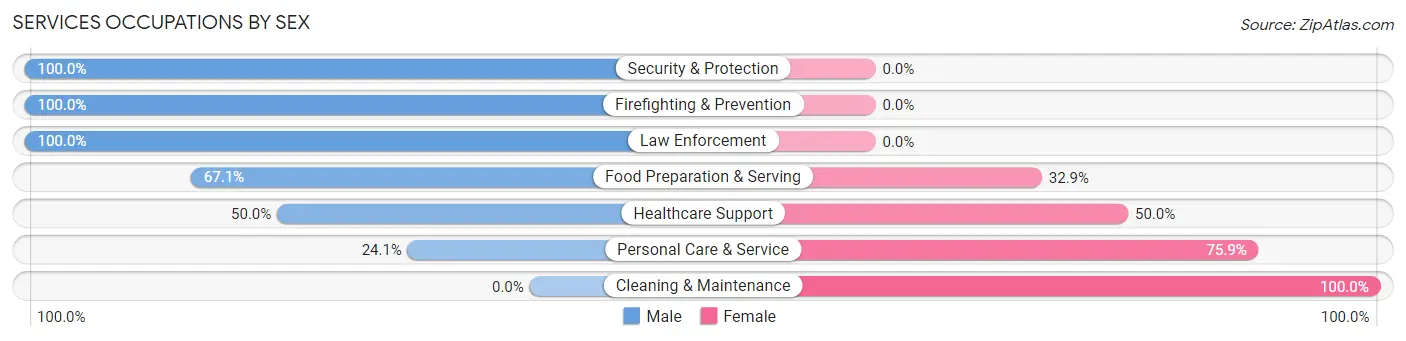
Services Occupations by Sex
Within the Services occupations in West Point, the most male-oriented occupations are Security & Protection (100.0%), Firefighting & Prevention (100.0%), and Law Enforcement (100.0%), while the most female-oriented occupations are Cleaning & Maintenance (100.0%), Personal Care & Service (75.9%), and Healthcare Support (50.0%).
| Occupation | Male | Female |
| Healthcare Support | 6 (50.0%) | 6 (50.0%) |
| Security & Protection | 38 (100.0%) | 0 (0.0%) |
| Firefighting & Prevention | 30 (100.0%) | 0 (0.0%) |
| Law Enforcement | 8 (100.0%) | 0 (0.0%) |
| Food Preparation & Serving | 57 (67.1%) | 28 (32.9%) |
| Cleaning & Maintenance | 0 (0.0%) | 9 (100.0%) |
| Personal Care & Service | 14 (24.1%) | 44 (75.9%) |
| Total (Category) | 115 (56.9%) | 87 (43.1%) |
| Total (Overall) | 504 (41.2%) | 719 (58.8%) |
Sales and Office Occupations
The most common Sales and Office occupations in West Point are Office & Administration (170 | 13.9%), and Sales & Related (58 | 4.7%).
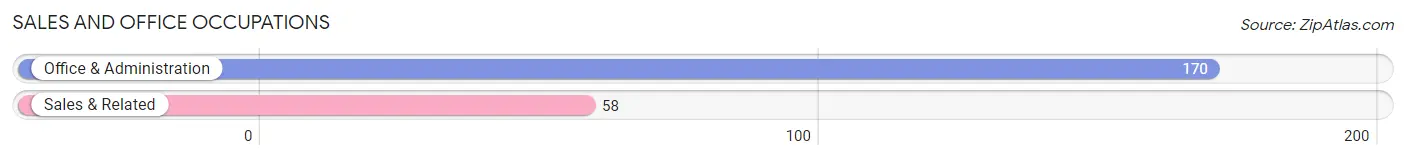
Sales and Office Occupations by Sex
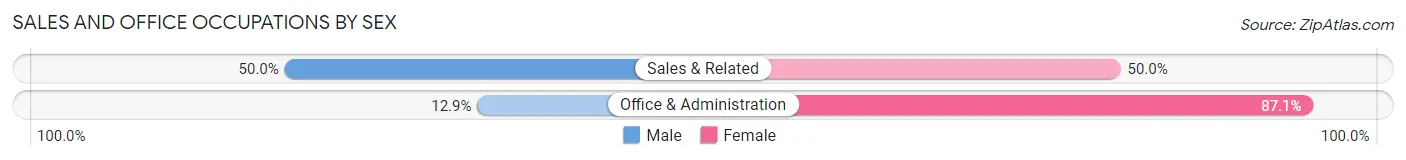
| Occupation | Male | Female |
| Sales & Related | 29 (50.0%) | 29 (50.0%) |
| Office & Administration | 22 (12.9%) | 148 (87.1%) |
| Total (Category) | 51 (22.4%) | 177 (77.6%) |
| Total (Overall) | 504 (41.2%) | 719 (58.8%) |
Natural Resources, Construction and Maintenance Occupations
The most common Natural Resources, Construction and Maintenance occupations in West Point are Construction & Extraction (17 | 1.4%), and Installation, Maintenance & Repair (12 | 1.0%).
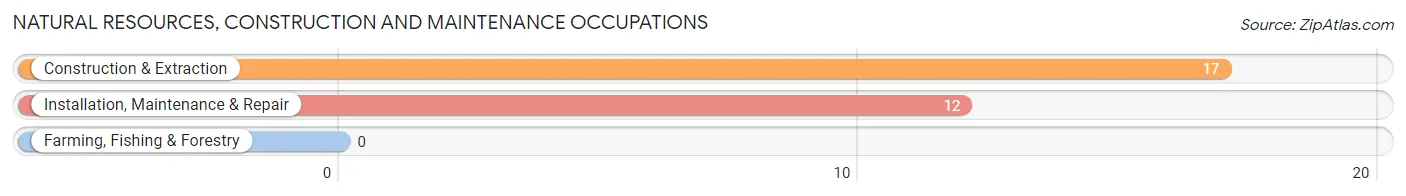
Natural Resources, Construction and Maintenance Occupations by Sex
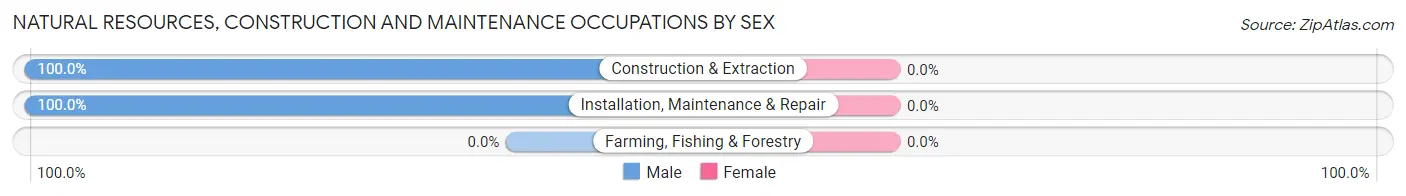
| Occupation | Male | Female |
| Farming, Fishing & Forestry | 0 (0.0%) | 0 (0.0%) |
| Construction & Extraction | 17 (100.0%) | 0 (0.0%) |
| Installation, Maintenance & Repair | 12 (100.0%) | 0 (0.0%) |
| Total (Category) | 29 (100.0%) | 0 (0.0%) |
| Total (Overall) | 504 (41.2%) | 719 (58.8%) |
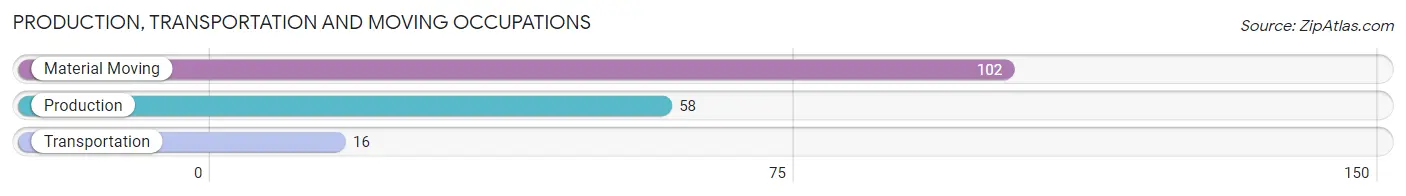
Production, Transportation and Moving Occupations
The most common Production, Transportation and Moving occupations in West Point are Material Moving (102 | 8.3%), Production (58 | 4.7%), and Transportation (16 | 1.3%).
Production, Transportation and Moving Occupations by Sex
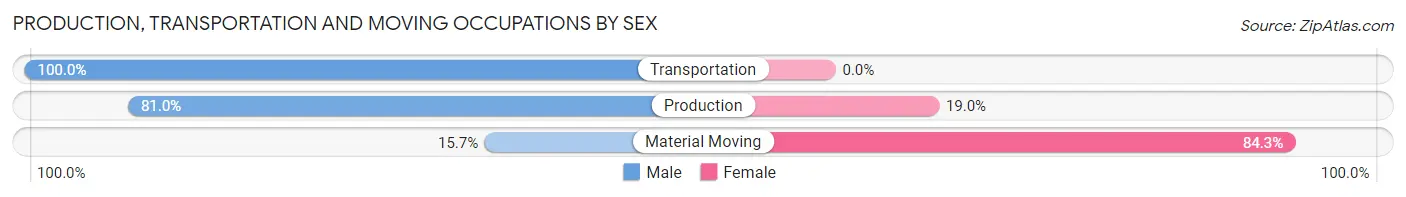
| Occupation | Male | Female |
| Production | 47 (81.0%) | 11 (19.0%) |
| Transportation | 16 (100.0%) | 0 (0.0%) |
| Material Moving | 16 (15.7%) | 86 (84.3%) |
| Total (Category) | 79 (44.9%) | 97 (55.1%) |
| Total (Overall) | 504 (41.2%) | 719 (58.8%) |
Employment Industries by Sex in West Point
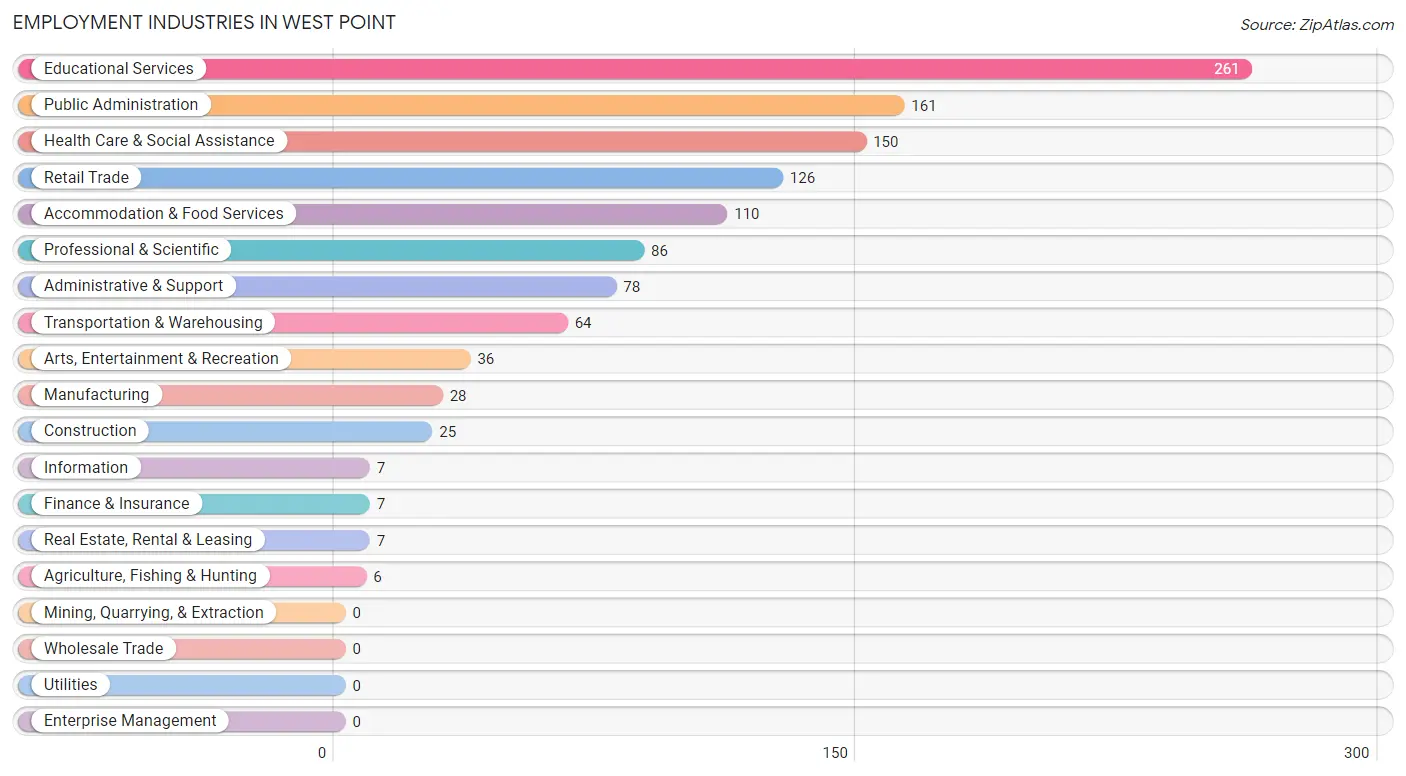
Employment Industries in West Point
The major employment industries in West Point include Educational Services (261 | 21.3%), Public Administration (161 | 13.2%), Health Care & Social Assistance (150 | 12.3%), Retail Trade (126 | 10.3%), and Accommodation & Food Services (110 | 9.0%).
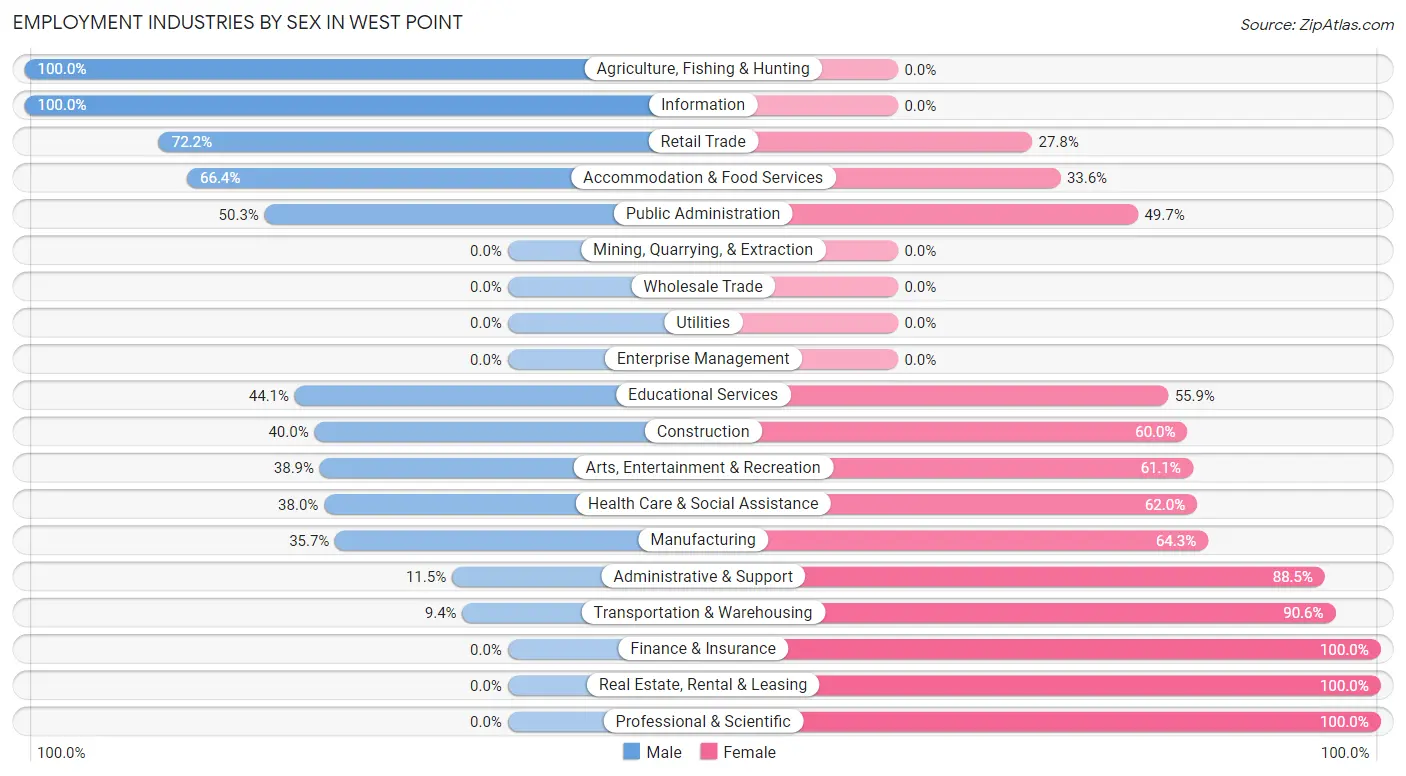
Employment Industries by Sex in West Point
The West Point industries that see more men than women are Agriculture, Fishing & Hunting (100.0%), Information (100.0%), and Retail Trade (72.2%), whereas the industries that tend to have a higher number of women are Finance & Insurance (100.0%), Real Estate, Rental & Leasing (100.0%), and Professional & Scientific (100.0%).
| Industry | Male | Female |
| Agriculture, Fishing & Hunting | 6 (100.0%) | 0 (0.0%) |
| Mining, Quarrying, & Extraction | 0 (0.0%) | 0 (0.0%) |
| Construction | 10 (40.0%) | 15 (60.0%) |
| Manufacturing | 10 (35.7%) | 18 (64.3%) |
| Wholesale Trade | 0 (0.0%) | 0 (0.0%) |
| Retail Trade | 91 (72.2%) | 35 (27.8%) |
| Transportation & Warehousing | 6 (9.4%) | 58 (90.6%) |
| Utilities | 0 (0.0%) | 0 (0.0%) |
| Information | 7 (100.0%) | 0 (0.0%) |
| Finance & Insurance | 0 (0.0%) | 7 (100.0%) |
| Real Estate, Rental & Leasing | 0 (0.0%) | 7 (100.0%) |
| Professional & Scientific | 0 (0.0%) | 86 (100.0%) |
| Enterprise Management | 0 (0.0%) | 0 (0.0%) |
| Administrative & Support | 9 (11.5%) | 69 (88.5%) |
| Educational Services | 115 (44.1%) | 146 (55.9%) |
| Health Care & Social Assistance | 57 (38.0%) | 93 (62.0%) |
| Arts, Entertainment & Recreation | 14 (38.9%) | 22 (61.1%) |
| Accommodation & Food Services | 73 (66.4%) | 37 (33.6%) |
| Public Administration | 81 (50.3%) | 80 (49.7%) |
| Total | 504 (41.2%) | 719 (58.8%) |
Education in West Point
School Enrollment in West Point
The most common levels of schooling among the 4,019 students in West Point are college / undergraduate (2,623 | 65.3%), elementary school (416 | 10.3%), and middle school (379 | 9.4%).
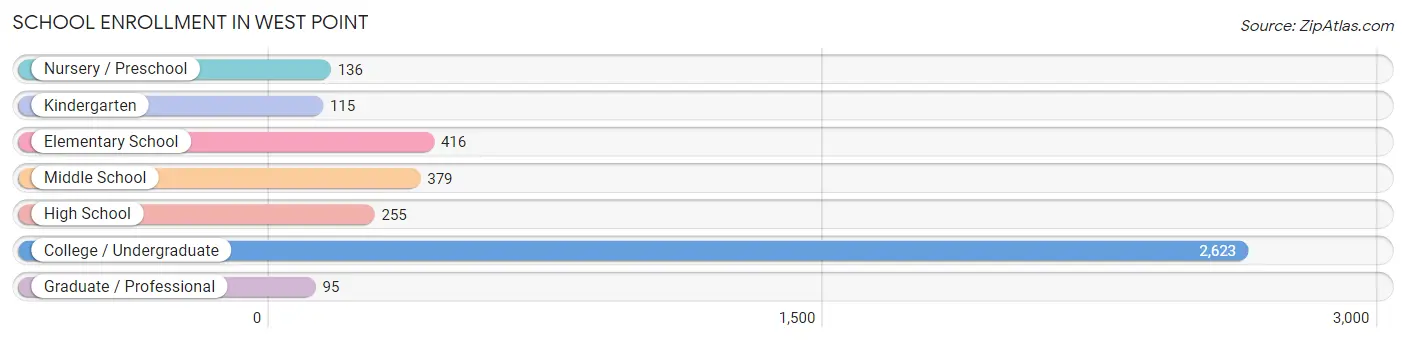
| School Level | # Students | % Students |
| Nursery / Preschool | 136 | 3.4% |
| Kindergarten | 115 | 2.9% |
| Elementary School | 416 | 10.3% |
| Middle School | 379 | 9.4% |
| High School | 255 | 6.3% |
| College / Undergraduate | 2,623 | 65.3% |
| Graduate / Professional | 95 | 2.4% |
| Total | 4,019 | 100.0% |
School Enrollment by Age by Funding Source in West Point
Out of a total of 4,019 students who are enrolled in schools in West Point, 474 (11.8%) attend a private institution, while the remaining 3,545 (88.2%) are enrolled in public schools. The age group of 25 to 34 year olds has the highest likelihood of being enrolled in private schools, with 35 (32.1% in the age bracket) enrolled. Conversely, the age group of 18 to 19 year olds has the lowest likelihood of being enrolled in a private school, with 598 (93.6% in the age bracket) attending a public institution.
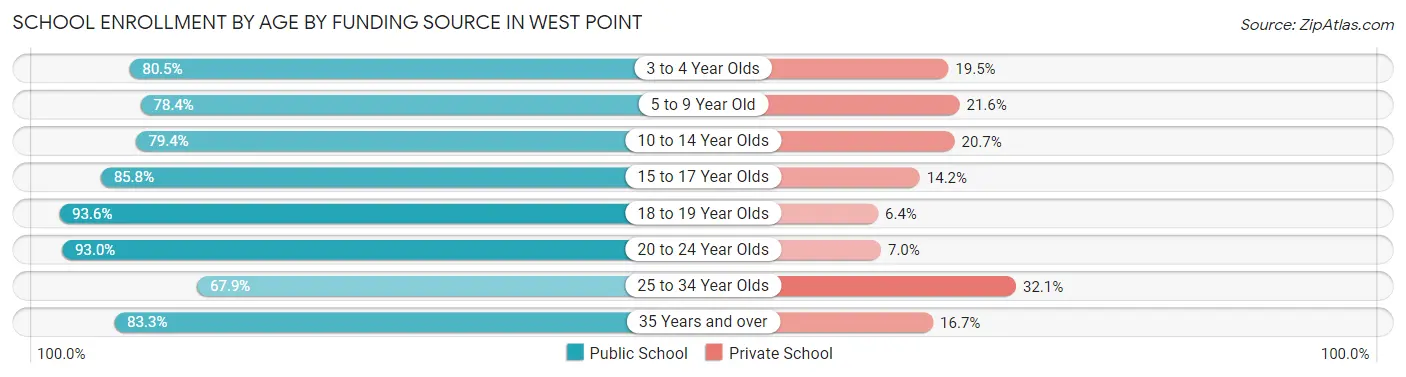
| Age Bracket | Public School | Private School |
| 3 to 4 Year Olds | 99 (80.5%) | 24 (19.5%) |
| 5 to 9 Year Old | 396 (78.4%) | 109 (21.6%) |
| 10 to 14 Year Olds | 369 (79.3%) | 96 (20.6%) |
| 15 to 17 Year Olds | 133 (85.8%) | 22 (14.2%) |
| 18 to 19 Year Olds | 598 (93.6%) | 41 (6.4%) |
| 20 to 24 Year Olds | 1,804 (93.0%) | 135 (7.0%) |
| 25 to 34 Year Olds | 74 (67.9%) | 35 (32.1%) |
| 35 Years and over | 70 (83.3%) | 14 (16.7%) |
| Total | 3,545 (88.2%) | 474 (11.8%) |
Educational Attainment by Field of Study in West Point
Social sciences (254 | 15.7%), engineering (231 | 14.3%), business (201 | 12.4%), literature & languages (158 | 9.8%), and liberal arts & history (115 | 7.1%) are the most common fields of study among 1,618 individuals in West Point who have obtained a bachelor's degree or higher.
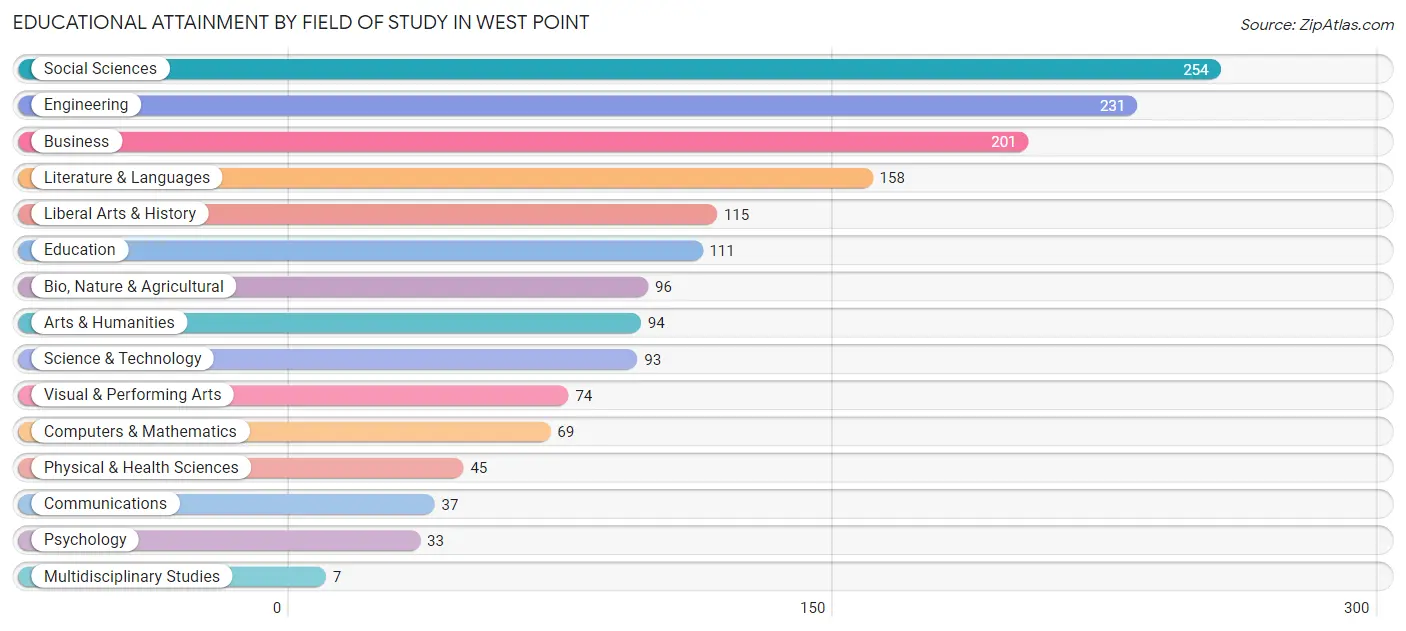
| Field of Study | # Graduates | % Graduates |
| Computers & Mathematics | 69 | 4.3% |
| Bio, Nature & Agricultural | 96 | 5.9% |
| Physical & Health Sciences | 45 | 2.8% |
| Psychology | 33 | 2.0% |
| Social Sciences | 254 | 15.7% |
| Engineering | 231 | 14.3% |
| Multidisciplinary Studies | 7 | 0.4% |
| Science & Technology | 93 | 5.8% |
| Business | 201 | 12.4% |
| Education | 111 | 6.9% |
| Literature & Languages | 158 | 9.8% |
| Liberal Arts & History | 115 | 7.1% |
| Visual & Performing Arts | 74 | 4.6% |
| Communications | 37 | 2.3% |
| Arts & Humanities | 94 | 5.8% |
| Total | 1,618 | 100.0% |
Transportation & Commute in West Point
Vehicle Availability by Sex in West Point
The most prevalent vehicle ownership categories in West Point are males with 2 vehicles (695, accounting for 77.4%) and females with 2 vehicles (366, making up 92.0%).
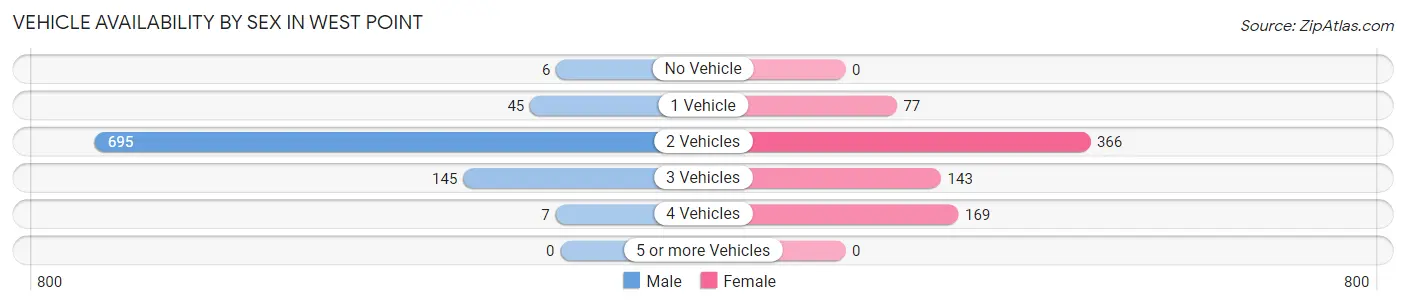
| Vehicles Available | Male | Female |
| No Vehicle | 6 (0.7%) | 0 (0.0%) |
| 1 Vehicle | 45 (5.0%) | 77 (10.2%) |
| 2 Vehicles | 695 (77.4%) | 366 (48.5%) |
| 3 Vehicles | 145 (16.2%) | 143 (18.9%) |
| 4 Vehicles | 7 (0.8%) | 169 (22.4%) |
| 5 or more Vehicles | 0 (0.0%) | 0 (0.0%) |
| Total | 898 (100.0%) | 755 (100.0%) |
Commute Time in West Point
The most frequently occuring commute durations in West Point are 5 to 9 minutes (1,221 commuters, 48.1%), 10 to 14 minutes (589 commuters, 23.2%), and less than 5 minutes (356 commuters, 14.0%).
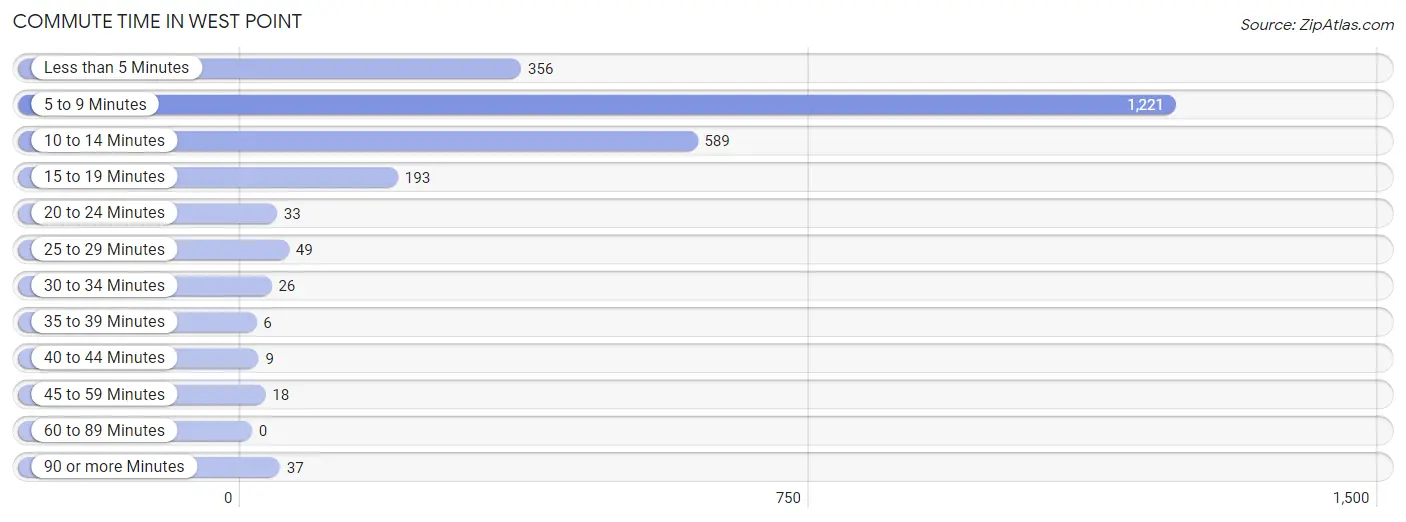
| Commute Time | # Commuters | % Commuters |
| Less than 5 Minutes | 356 | 14.0% |
| 5 to 9 Minutes | 1,221 | 48.1% |
| 10 to 14 Minutes | 589 | 23.2% |
| 15 to 19 Minutes | 193 | 7.6% |
| 20 to 24 Minutes | 33 | 1.3% |
| 25 to 29 Minutes | 49 | 1.9% |
| 30 to 34 Minutes | 26 | 1.0% |
| 35 to 39 Minutes | 6 | 0.2% |
| 40 to 44 Minutes | 9 | 0.4% |
| 45 to 59 Minutes | 18 | 0.7% |
| 60 to 89 Minutes | 0 | 0.0% |
| 90 or more Minutes | 37 | 1.5% |
Commute Time by Sex in West Point
The most common commute times in West Point are 5 to 9 minutes (846 commuters, 52.4%) for males and 5 to 9 minutes (375 commuters, 40.6%) for females.
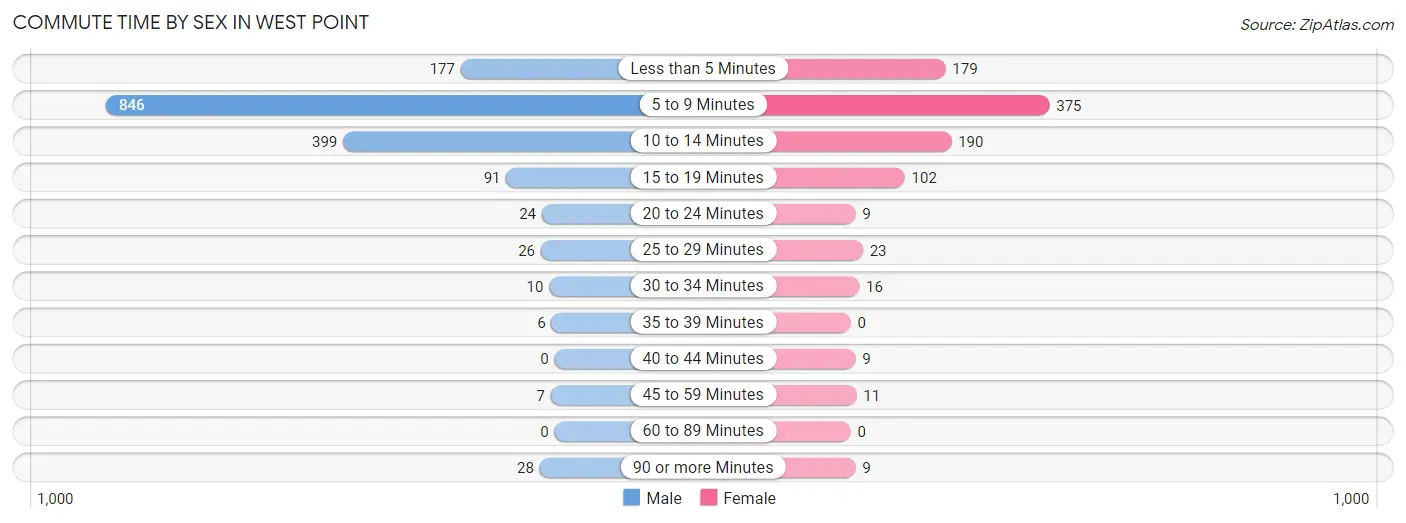
| Commute Time | Male | Female |
| Less than 5 Minutes | 177 (11.0%) | 179 (19.4%) |
| 5 to 9 Minutes | 846 (52.4%) | 375 (40.6%) |
| 10 to 14 Minutes | 399 (24.7%) | 190 (20.6%) |
| 15 to 19 Minutes | 91 (5.6%) | 102 (11.1%) |
| 20 to 24 Minutes | 24 (1.5%) | 9 (1.0%) |
| 25 to 29 Minutes | 26 (1.6%) | 23 (2.5%) |
| 30 to 34 Minutes | 10 (0.6%) | 16 (1.7%) |
| 35 to 39 Minutes | 6 (0.4%) | 0 (0.0%) |
| 40 to 44 Minutes | 0 (0.0%) | 9 (1.0%) |
| 45 to 59 Minutes | 7 (0.4%) | 11 (1.2%) |
| 60 to 89 Minutes | 0 (0.0%) | 0 (0.0%) |
| 90 or more Minutes | 28 (1.7%) | 9 (1.0%) |
Time of Departure to Work by Sex in West Point
The most frequent times of departure to work in West Point are 6:30 AM to 6:59 AM (360, 22.3%) for males and 6:30 AM to 6:59 AM (230, 24.9%) for females.
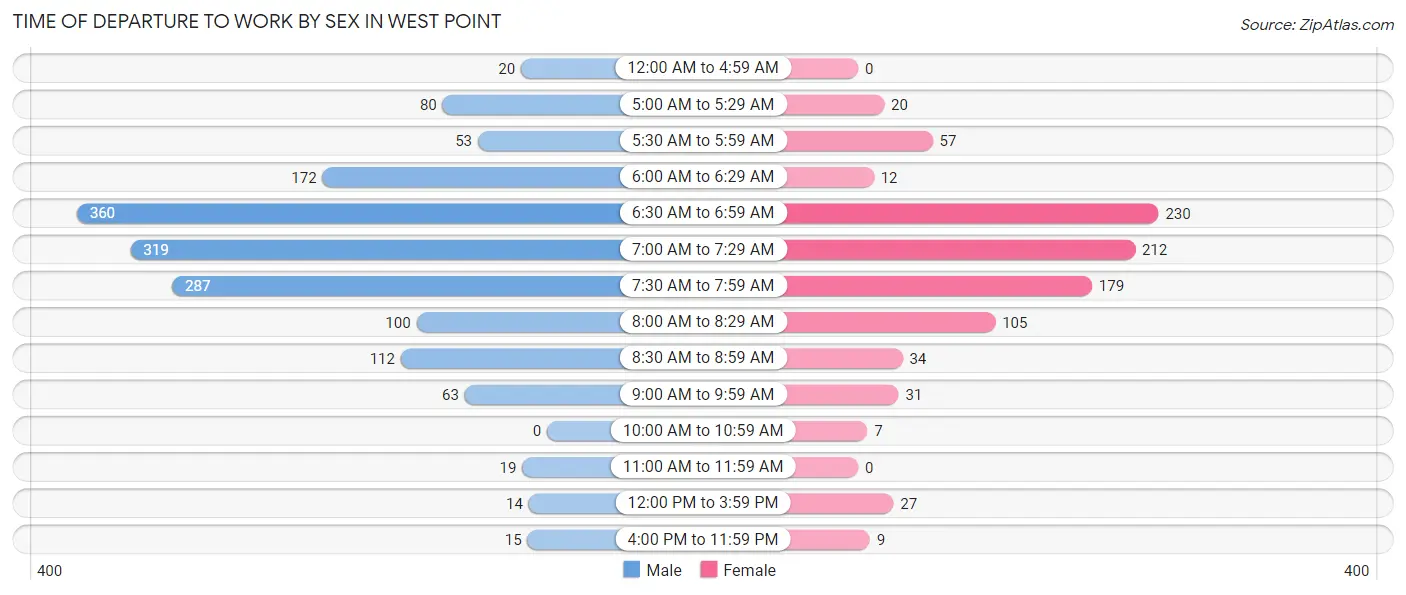
| Time of Departure | Male | Female |
| 12:00 AM to 4:59 AM | 20 (1.2%) | 0 (0.0%) |
| 5:00 AM to 5:29 AM | 80 (5.0%) | 20 (2.2%) |
| 5:30 AM to 5:59 AM | 53 (3.3%) | 57 (6.2%) |
| 6:00 AM to 6:29 AM | 172 (10.7%) | 12 (1.3%) |
| 6:30 AM to 6:59 AM | 360 (22.3%) | 230 (24.9%) |
| 7:00 AM to 7:29 AM | 319 (19.8%) | 212 (23.0%) |
| 7:30 AM to 7:59 AM | 287 (17.8%) | 179 (19.4%) |
| 8:00 AM to 8:29 AM | 100 (6.2%) | 105 (11.4%) |
| 8:30 AM to 8:59 AM | 112 (6.9%) | 34 (3.7%) |
| 9:00 AM to 9:59 AM | 63 (3.9%) | 31 (3.4%) |
| 10:00 AM to 10:59 AM | 0 (0.0%) | 7 (0.8%) |
| 11:00 AM to 11:59 AM | 19 (1.2%) | 0 (0.0%) |
| 12:00 PM to 3:59 PM | 14 (0.9%) | 27 (2.9%) |
| 4:00 PM to 11:59 PM | 15 (0.9%) | 9 (1.0%) |
| Total | 1,614 (100.0%) | 923 (100.0%) |
Housing Occupancy in West Point
Occupancy by Ownership in West Point
Of the total 1,063 dwellings in West Point, owner-occupied units account for 0 (0.0%), while renter-occupied units make up 1,063 (100.0%).
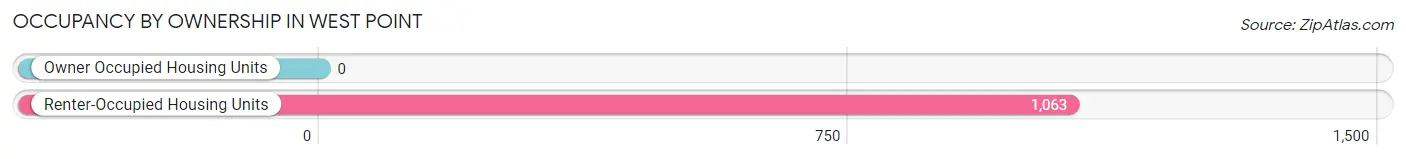
| Occupancy | # Housing Units | % Housing Units |
| Owner Occupied Housing Units | 0 | 0.0% |
| Renter-Occupied Housing Units | 1,063 | 100.0% |
| Total Occupied Housing Units | 1,063 | 100.0% |
Occupancy by Household Size in West Point
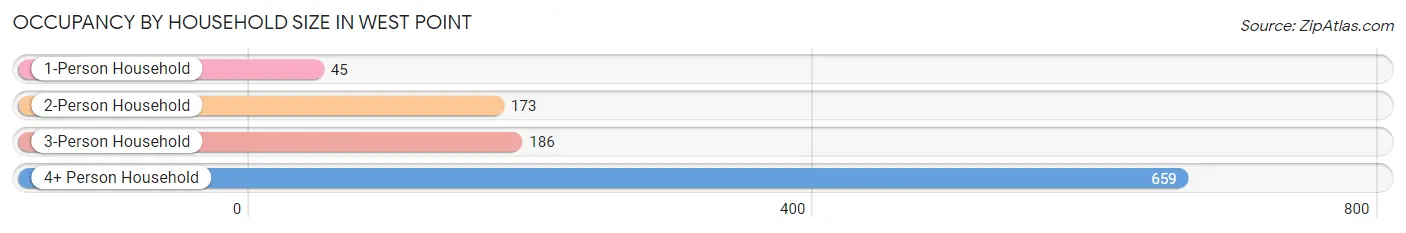
| Household Size | # Housing Units | % Housing Units |
| 1-Person Household | 45 | 4.2% |
| 2-Person Household | 173 | 16.3% |
| 3-Person Household | 186 | 17.5% |
| 4+ Person Household | 659 | 62.0% |
| Total Housing Units | 1,063 | 100.0% |
Occupancy by Ownership by Household Size in West Point
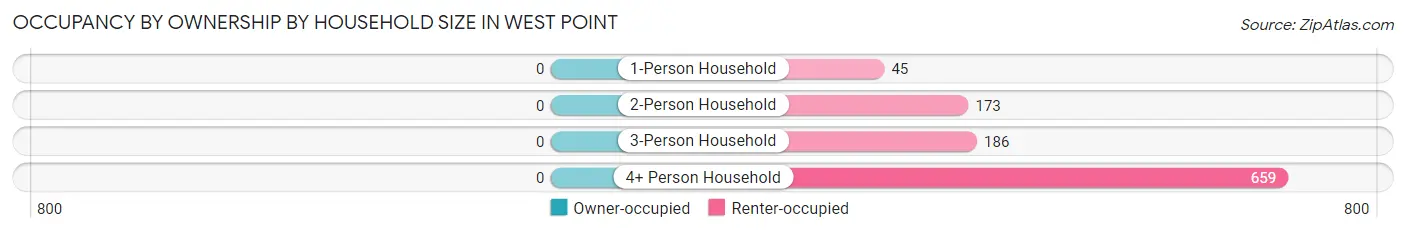
| Household Size | Owner-occupied | Renter-occupied |
| 1-Person Household | 0 (0.0%) | 45 (100.0%) |
| 2-Person Household | 0 (0.0%) | 173 (100.0%) |
| 3-Person Household | 0 (0.0%) | 186 (100.0%) |
| 4+ Person Household | 0 (0.0%) | 659 (100.0%) |
| Total Housing Units | 0 (0.0%) | 1,063 (100.0%) |
Occupancy by Educational Attainment in West Point
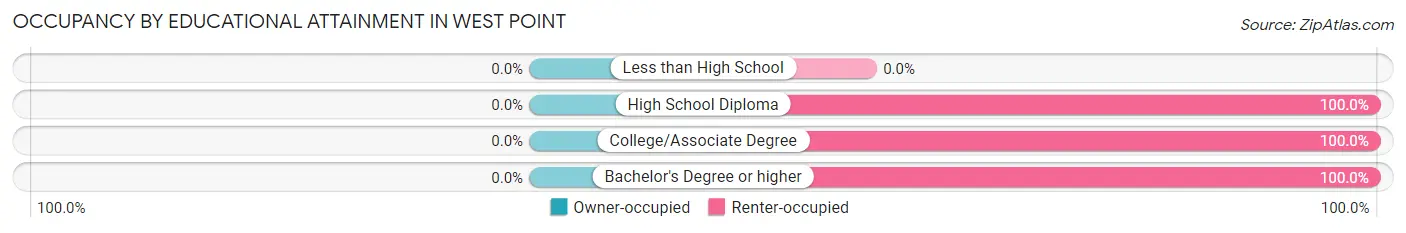
| Household Size | Owner-occupied | Renter-occupied |
| Less than High School | 0 (0.0%) | 0 (0.0%) |
| High School Diploma | 0 (0.0%) | 52 (100.0%) |
| College/Associate Degree | 0 (0.0%) | 202 (100.0%) |
| Bachelor's Degree or higher | 0 (0.0%) | 809 (100.0%) |
Occupancy by Age of Householder in West Point
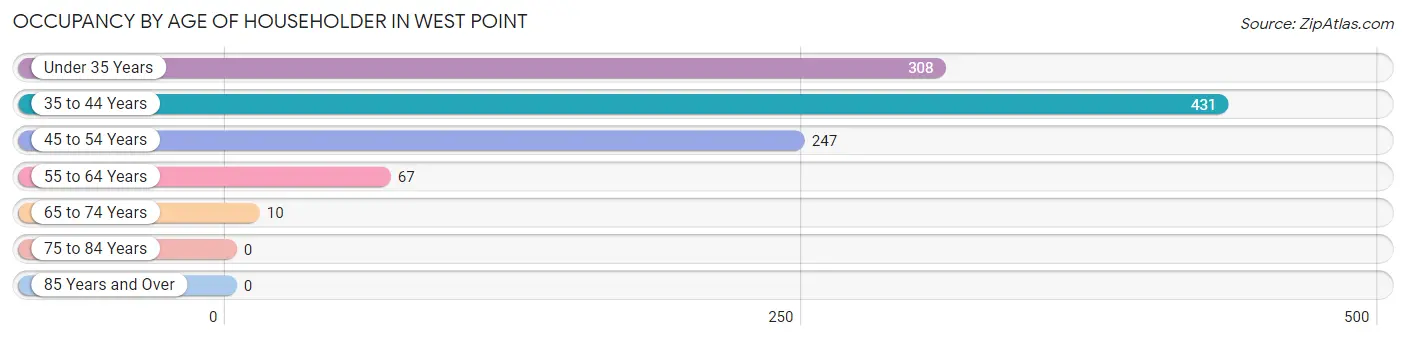
| Age Bracket | # Households | % Households |
| Under 35 Years | 308 | 29.0% |
| 35 to 44 Years | 431 | 40.6% |
| 45 to 54 Years | 247 | 23.2% |
| 55 to 64 Years | 67 | 6.3% |
| 65 to 74 Years | 10 | 0.9% |
| 75 to 84 Years | 0 | 0.0% |
| 85 Years and Over | 0 | 0.0% |
| Total | 1,063 | 100.0% |
Housing Finances in West Point
Median Income by Occupancy in West Point
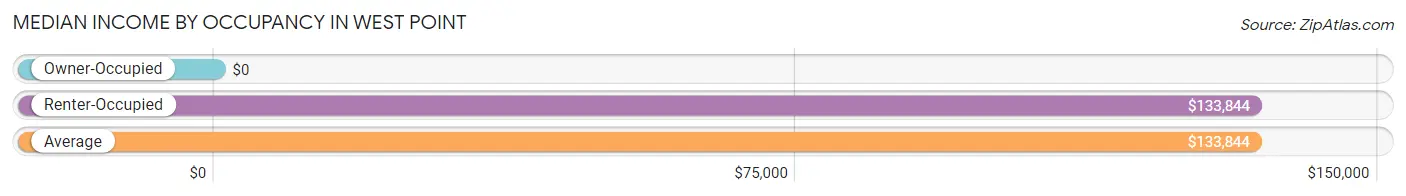
| Occupancy Type | # Households | Median Income |
| Owner-Occupied | 0 (0.0%) | $0 |
| Renter-Occupied | 1,063 (100.0%) | $133,844 |
| Average | 1,063 (100.0%) | $133,844 |
Occupancy by Householder Income Bracket in West Point
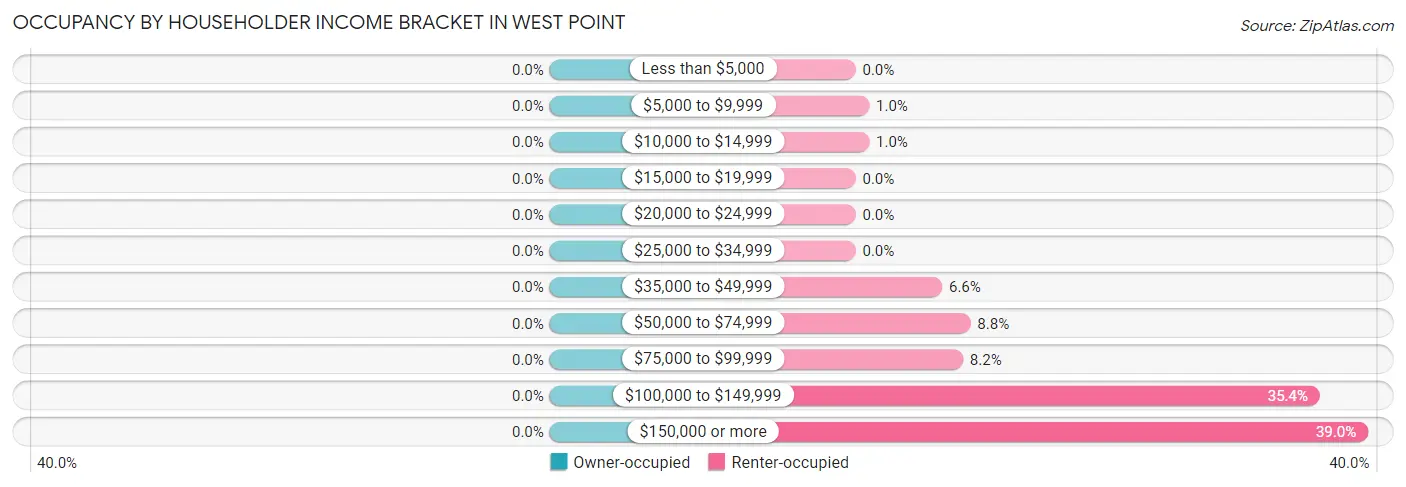
| Income Bracket | Owner-occupied | Renter-occupied |
| Less than $5,000 | 0 (0.0%) | 0 (0.0%) |
| $5,000 to $9,999 | 0 (0.0%) | 11 (1.0%) |
| $10,000 to $14,999 | 0 (0.0%) | 11 (1.0%) |
| $15,000 to $19,999 | 0 (0.0%) | 0 (0.0%) |
| $20,000 to $24,999 | 0 (0.0%) | 0 (0.0%) |
| $25,000 to $34,999 | 0 (0.0%) | 0 (0.0%) |
| $35,000 to $49,999 | 0 (0.0%) | 70 (6.6%) |
| $50,000 to $74,999 | 0 (0.0%) | 93 (8.7%) |
| $75,000 to $99,999 | 0 (0.0%) | 87 (8.2%) |
| $100,000 to $149,999 | 0 (0.0%) | 376 (35.4%) |
| $150,000 or more | 0 (0.0%) | 415 (39.0%) |
| Total | 0 (0.0%) | 1,063 (100.0%) |
Monthly Housing Cost Tiers in West Point
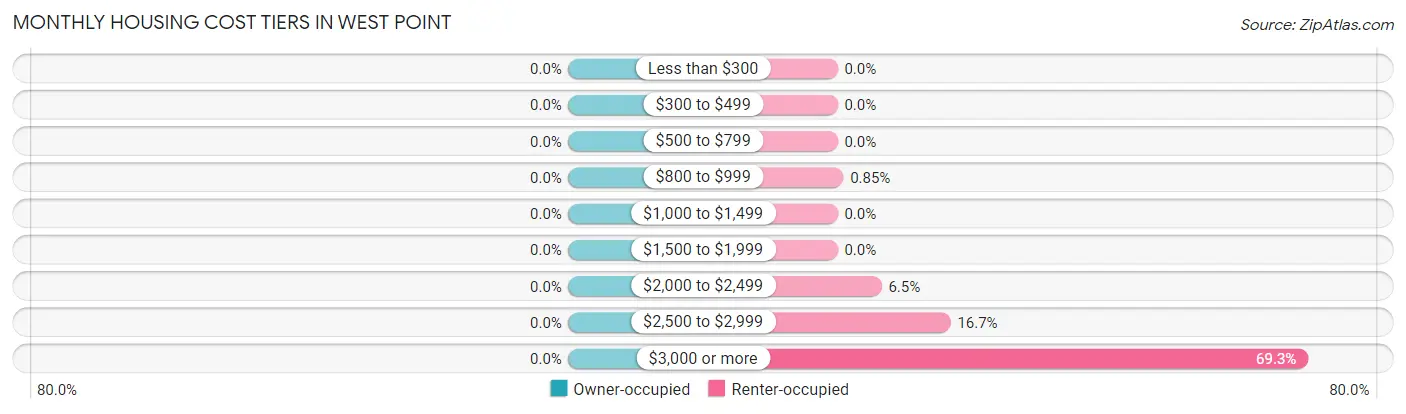
| Monthly Cost | Owner-occupied | Renter-occupied |
| Less than $300 | 0 (0.0%) | 0 (0.0%) |
| $300 to $499 | 0 (0.0%) | 0 (0.0%) |
| $500 to $799 | 0 (0.0%) | 0 (0.0%) |
| $800 to $999 | 0 (0.0%) | 9 (0.9%) |
| $1,000 to $1,499 | 0 (0.0%) | 0 (0.0%) |
| $1,500 to $1,999 | 0 (0.0%) | 0 (0.0%) |
| $2,000 to $2,499 | 0 (0.0%) | 69 (6.5%) |
| $2,500 to $2,999 | 0 (0.0%) | 177 (16.7%) |
| $3,000 or more | 0 (0.0%) | 737 (69.3%) |
| Total | 0 (0.0%) | 1,063 (100.0%) |
Physical Housing Characteristics in West Point
Housing Structures in West Point
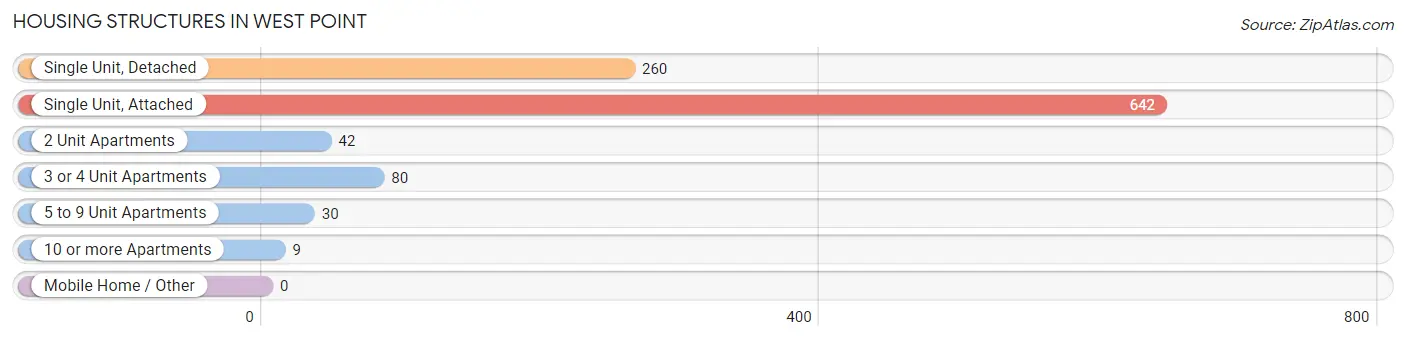
| Structure Type | # Housing Units | % Housing Units |
| Single Unit, Detached | 260 | 24.5% |
| Single Unit, Attached | 642 | 60.4% |
| 2 Unit Apartments | 42 | 4.0% |
| 3 or 4 Unit Apartments | 80 | 7.5% |
| 5 to 9 Unit Apartments | 30 | 2.8% |
| 10 or more Apartments | 9 | 0.9% |
| Mobile Home / Other | 0 | 0.0% |
| Total | 1,063 | 100.0% |
Housing Structures by Occupancy in West Point
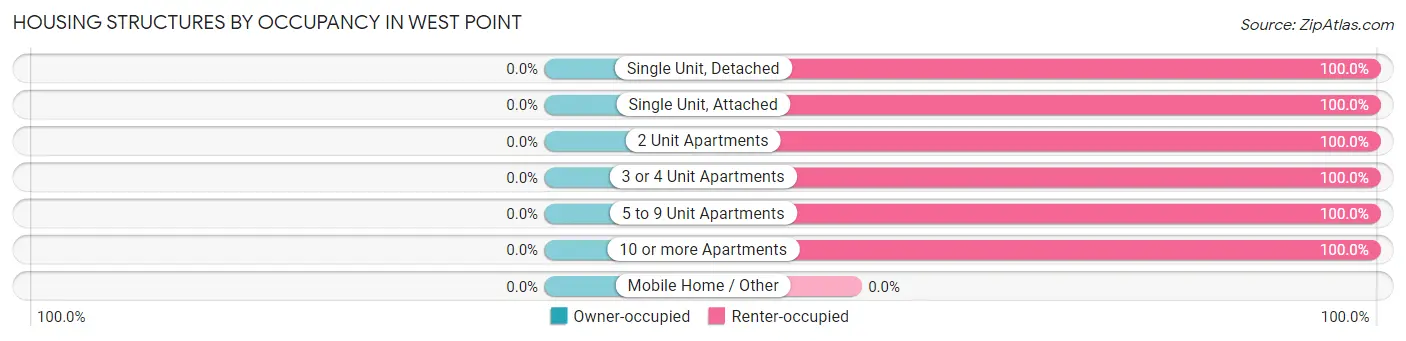
| Structure Type | Owner-occupied | Renter-occupied |
| Single Unit, Detached | 0 (0.0%) | 260 (100.0%) |
| Single Unit, Attached | 0 (0.0%) | 642 (100.0%) |
| 2 Unit Apartments | 0 (0.0%) | 42 (100.0%) |
| 3 or 4 Unit Apartments | 0 (0.0%) | 80 (100.0%) |
| 5 to 9 Unit Apartments | 0 (0.0%) | 30 (100.0%) |
| 10 or more Apartments | 0 (0.0%) | 9 (100.0%) |
| Mobile Home / Other | 0 (0.0%) | 0 (0.0%) |
| Total | 0 (0.0%) | 1,063 (100.0%) |
Housing Structures by Number of Rooms in West Point
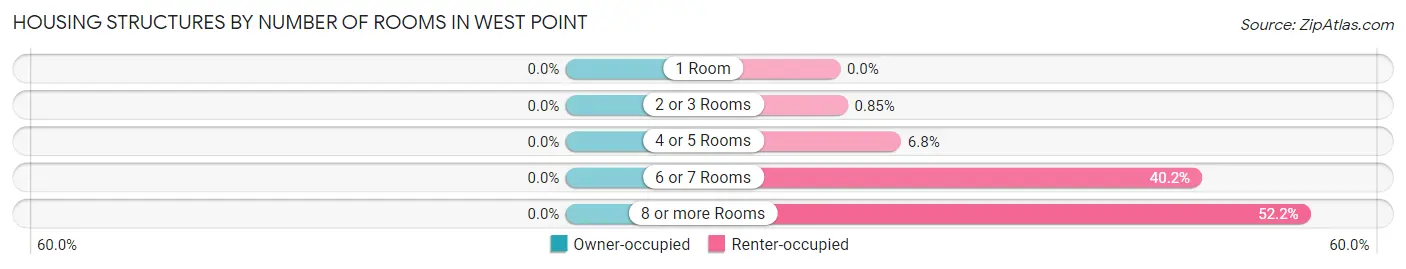
| Number of Rooms | Owner-occupied | Renter-occupied |
| 1 Room | 0 (0.0%) | 0 (0.0%) |
| 2 or 3 Rooms | 0 (0.0%) | 9 (0.9%) |
| 4 or 5 Rooms | 0 (0.0%) | 72 (6.8%) |
| 6 or 7 Rooms | 0 (0.0%) | 427 (40.2%) |
| 8 or more Rooms | 0 (0.0%) | 555 (52.2%) |
| Total | 0 (0.0%) | 1,063 (100.0%) |
Housing Structure by Heating Type in West Point
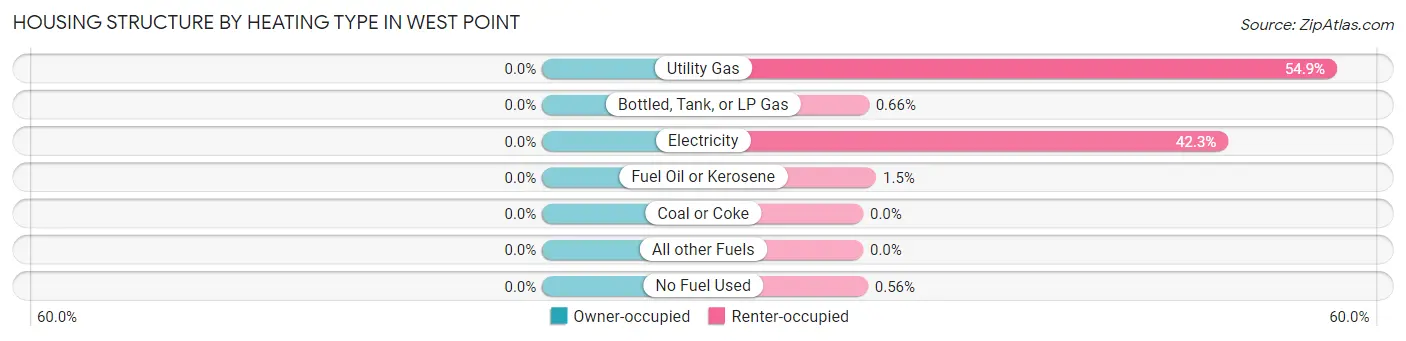
| Heating Type | Owner-occupied | Renter-occupied |
| Utility Gas | 0 (0.0%) | 584 (54.9%) |
| Bottled, Tank, or LP Gas | 0 (0.0%) | 7 (0.7%) |
| Electricity | 0 (0.0%) | 450 (42.3%) |
| Fuel Oil or Kerosene | 0 (0.0%) | 16 (1.5%) |
| Coal or Coke | 0 (0.0%) | 0 (0.0%) |
| All other Fuels | 0 (0.0%) | 0 (0.0%) |
| No Fuel Used | 0 (0.0%) | 6 (0.6%) |
| Total | 0 (0.0%) | 1,063 (100.0%) |
Household Vehicle Usage in West Point
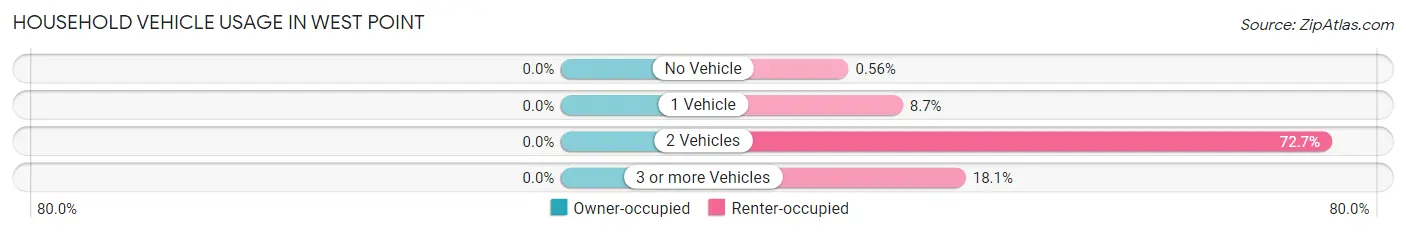
| Vehicles per Household | Owner-occupied | Renter-occupied |
| No Vehicle | 0 (0.0%) | 6 (0.6%) |
| 1 Vehicle | 0 (0.0%) | 92 (8.6%) |
| 2 Vehicles | 0 (0.0%) | 773 (72.7%) |
| 3 or more Vehicles | 0 (0.0%) | 192 (18.1%) |
| Total | 0 (0.0%) | 1,063 (100.0%) |
Real Estate & Mortgages in West Point
Real Estate and Mortgage Overview in West Point
| Characteristic | Without Mortgage | With Mortgage |
| Housing Units | 0 | 0 |
| Median Property Value | - | - |
| Median Household Income | - | - |
| Monthly Housing Costs | - | - |
| Real Estate Taxes | - | - |
Property Value by Mortgage Status in West Point
| Property Value | Without Mortgage | With Mortgage |
| Less than $50,000 | 0 (0.0%) | 0 (0.0%) |
| $50,000 to $99,999 | 0 (0.0%) | 0 (0.0%) |
| $100,000 to $299,999 | 0 (0.0%) | 0 (0.0%) |
| $300,000 to $499,999 | 0 (0.0%) | 0 (0.0%) |
| $500,000 to $749,999 | 0 (0.0%) | 0 (0.0%) |
| $750,000 to $999,999 | 0 (0.0%) | 0 (0.0%) |
| $1,000,000 or more | 0 (0.0%) | 0 (0.0%) |
| Total | 0 (0.0%) | 0 (0.0%) |
Household Income by Mortgage Status in West Point
| Household Income | Without Mortgage | With Mortgage |
| Less than $10,000 | 0 (0.0%) | 0 (0.0%) |
| $10,000 to $24,999 | 0 (0.0%) | 0 (0.0%) |
| $25,000 to $34,999 | 0 (0.0%) | 0 (0.0%) |
| $35,000 to $49,999 | 0 (0.0%) | 0 (0.0%) |
| $50,000 to $74,999 | 0 (0.0%) | 0 (0.0%) |
| $75,000 to $99,999 | 0 (0.0%) | 0 (0.0%) |
| $100,000 to $149,999 | 0 (0.0%) | 0 (0.0%) |
| $150,000 or more | 0 (0.0%) | 0 (0.0%) |
| Total | 0 (0.0%) | 0 (0.0%) |
Property Value to Household Income Ratio in West Point
| Value-to-Income Ratio | Without Mortgage | With Mortgage |
| Less than 2.0x | 0 (0.0%) | 0 (0.0%) |
| 2.0x to 2.9x | 0 (0.0%) | 0 (0.0%) |
| 3.0x to 3.9x | 0 (0.0%) | 0 (0.0%) |
| 4.0x or more | 0 (0.0%) | 0 (0.0%) |
| Total | 0 (0.0%) | 0 (0.0%) |
Real Estate Taxes by Mortgage Status in West Point
| Property Taxes | Without Mortgage | With Mortgage |
| Less than $800 | 0 (0.0%) | 0 (0.0%) |
| $800 to $1,499 | 0 (0.0%) | 0 (0.0%) |
| $800 to $1,499 | 0 (0.0%) | 0 (0.0%) |
| Total | 0 (0.0%) | 0 (0.0%) |
Health & Disability in West Point
Health Insurance Coverage by Age in West Point
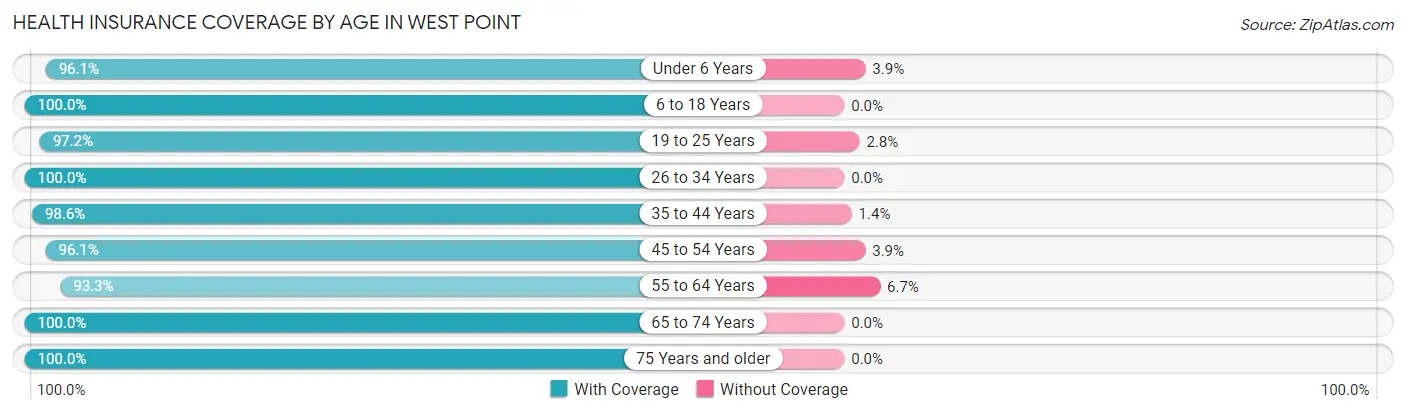
| Age Bracket | With Coverage | Without Coverage |
| Under 6 Years | 658 (96.1%) | 27 (3.9%) |
| 6 to 18 Years | 1,095 (100.0%) | 0 (0.0%) |
| 19 to 25 Years | 309 (97.2%) | 9 (2.8%) |
| 26 to 34 Years | 270 (100.0%) | 0 (0.0%) |
| 35 to 44 Years | 504 (98.6%) | 7 (1.4%) |
| 45 to 54 Years | 246 (96.1%) | 10 (3.9%) |
| 55 to 64 Years | 112 (93.3%) | 8 (6.7%) |
| 65 to 74 Years | 18 (100.0%) | 0 (0.0%) |
| 75 Years and older | 11 (100.0%) | 0 (0.0%) |
| Total | 3,223 (98.1%) | 61 (1.9%) |
Health Insurance Coverage by Citizenship Status in West Point
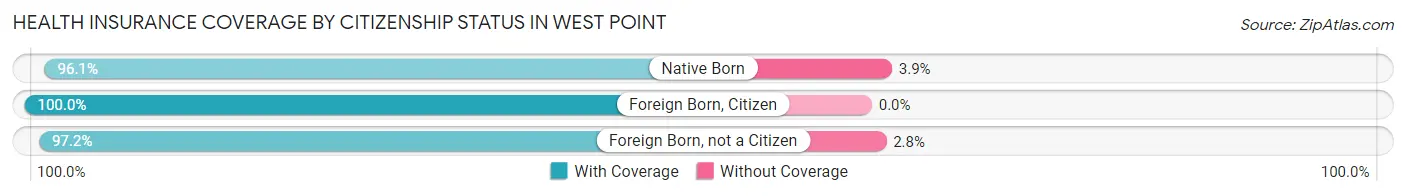
| Citizenship Status | With Coverage | Without Coverage |
| Native Born | 658 (96.1%) | 27 (3.9%) |
| Foreign Born, Citizen | 1,095 (100.0%) | 0 (0.0%) |
| Foreign Born, not a Citizen | 309 (97.2%) | 9 (2.8%) |
Health Insurance Coverage by Household Income in West Point
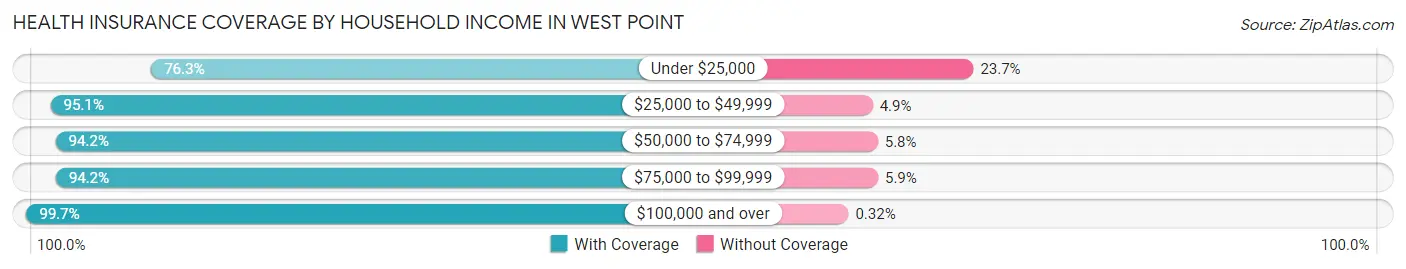
| Household Income | With Coverage | Without Coverage |
| Under $25,000 | 45 (76.3%) | 14 (23.7%) |
| $25,000 to $49,999 | 176 (95.1%) | 9 (4.9%) |
| $50,000 to $74,999 | 325 (94.2%) | 20 (5.8%) |
| $75,000 to $99,999 | 161 (94.2%) | 10 (5.9%) |
| $100,000 and over | 2,516 (99.7%) | 8 (0.3%) |
Public vs Private Health Insurance Coverage by Age in West Point
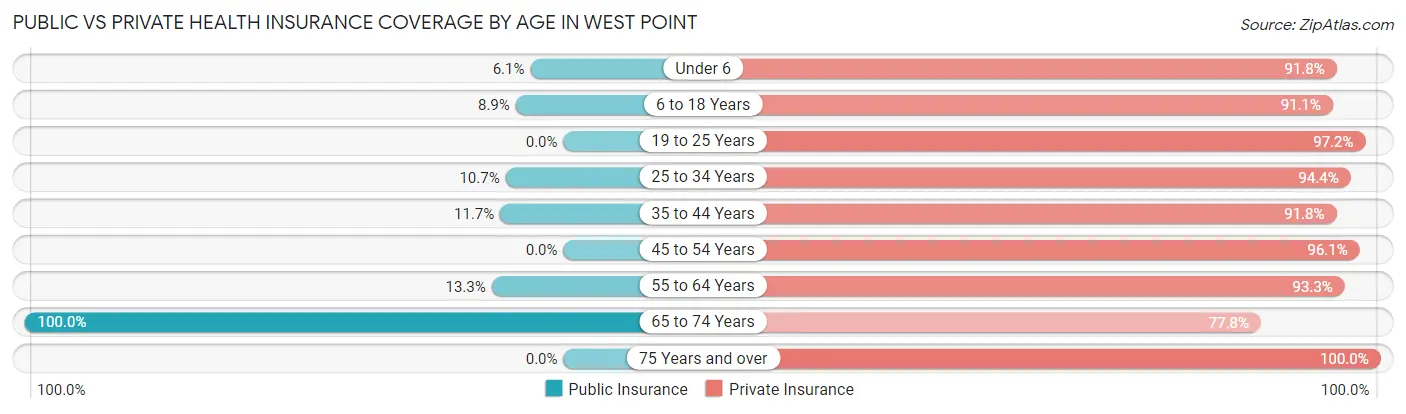
| Age Bracket | Public Insurance | Private Insurance |
| Under 6 | 42 (6.1%) | 629 (91.8%) |
| 6 to 18 Years | 97 (8.9%) | 998 (91.1%) |
| 19 to 25 Years | 0 (0.0%) | 309 (97.2%) |
| 25 to 34 Years | 29 (10.7%) | 255 (94.4%) |
| 35 to 44 Years | 60 (11.7%) | 469 (91.8%) |
| 45 to 54 Years | 0 (0.0%) | 246 (96.1%) |
| 55 to 64 Years | 16 (13.3%) | 112 (93.3%) |
| 65 to 74 Years | 18 (100.0%) | 14 (77.8%) |
| 75 Years and over | 0 (0.0%) | 11 (100.0%) |
| Total | 262 (8.0%) | 3,043 (92.7%) |
Disability Status by Sex by Age in West Point
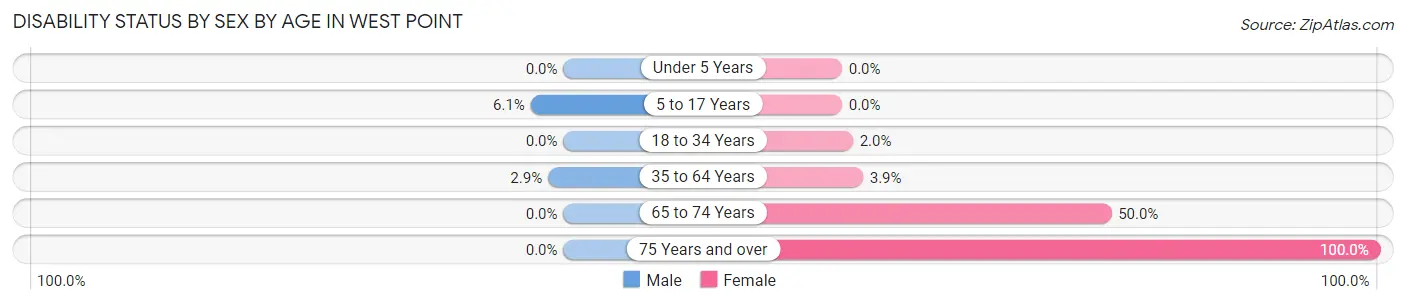
| Age Bracket | Male | Female |
| Under 5 Years | 0 (0.0%) | 0 (0.0%) |
| 5 to 17 Years | 41 (6.1%) | 0 (0.0%) |
| 18 to 34 Years | 0 (0.0%) | 9 (2.0%) |
| 35 to 64 Years | 7 (2.9%) | 25 (3.9%) |
| 65 to 74 Years | 0 (0.0%) | 4 (50.0%) |
| 75 Years and over | 0 (0.0%) | 11 (100.0%) |
Disability Class by Sex by Age in West Point
Disability Class: Hearing Difficulty
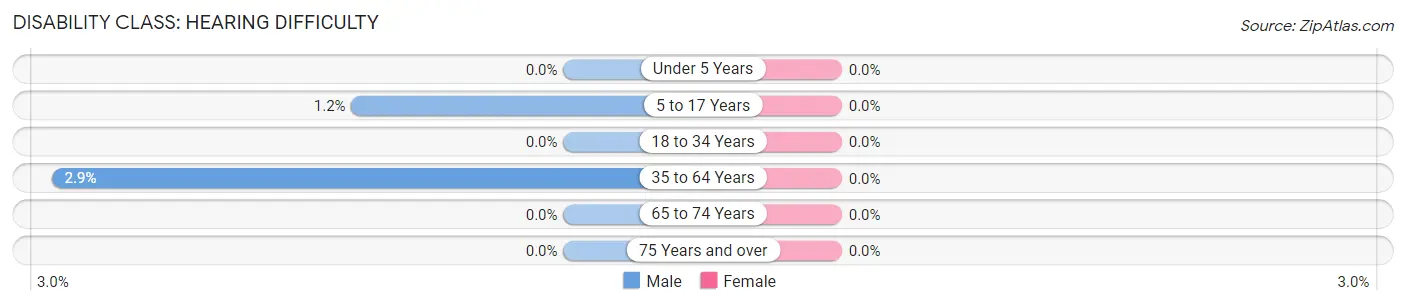
| Age Bracket | Male | Female |
| Under 5 Years | 0 (0.0%) | 0 (0.0%) |
| 5 to 17 Years | 8 (1.2%) | 0 (0.0%) |
| 18 to 34 Years | 0 (0.0%) | 0 (0.0%) |
| 35 to 64 Years | 7 (2.9%) | 0 (0.0%) |
| 65 to 74 Years | 0 (0.0%) | 0 (0.0%) |
| 75 Years and over | 0 (0.0%) | 0 (0.0%) |
Disability Class: Vision Difficulty
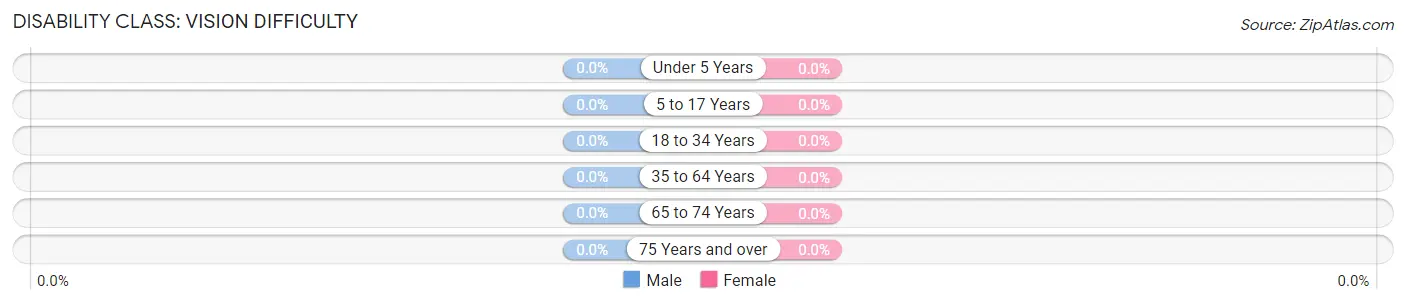
| Age Bracket | Male | Female |
| Under 5 Years | 0 (0.0%) | 0 (0.0%) |
| 5 to 17 Years | 0 (0.0%) | 0 (0.0%) |
| 18 to 34 Years | 0 (0.0%) | 0 (0.0%) |
| 35 to 64 Years | 0 (0.0%) | 0 (0.0%) |
| 65 to 74 Years | 0 (0.0%) | 0 (0.0%) |
| 75 Years and over | 0 (0.0%) | 0 (0.0%) |
Disability Class: Cognitive Difficulty
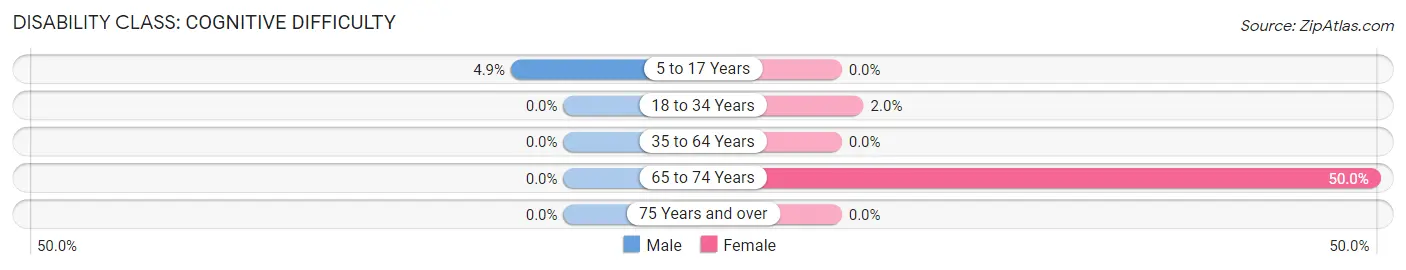
| Age Bracket | Male | Female |
| 5 to 17 Years | 33 (4.9%) | 0 (0.0%) |
| 18 to 34 Years | 0 (0.0%) | 9 (2.0%) |
| 35 to 64 Years | 0 (0.0%) | 0 (0.0%) |
| 65 to 74 Years | 0 (0.0%) | 4 (50.0%) |
| 75 Years and over | 0 (0.0%) | 0 (0.0%) |
Disability Class: Ambulatory Difficulty
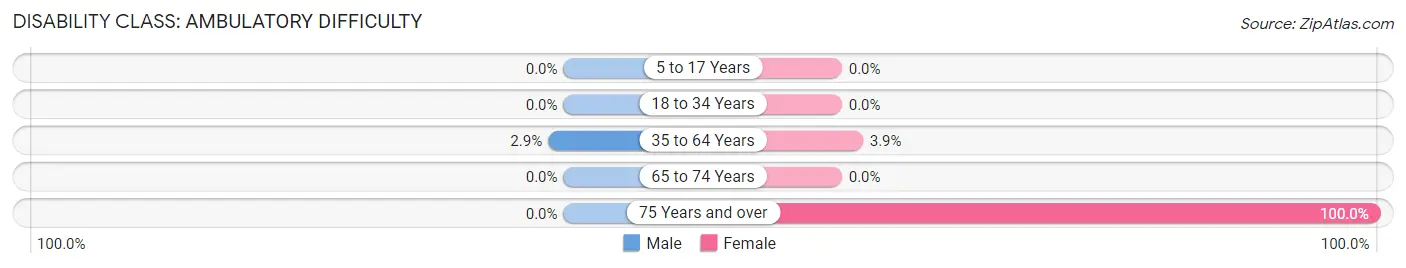
| Age Bracket | Male | Female |
| 5 to 17 Years | 0 (0.0%) | 0 (0.0%) |
| 18 to 34 Years | 0 (0.0%) | 0 (0.0%) |
| 35 to 64 Years | 7 (2.9%) | 25 (3.9%) |
| 65 to 74 Years | 0 (0.0%) | 0 (0.0%) |
| 75 Years and over | 0 (0.0%) | 11 (100.0%) |
Disability Class: Self-Care Difficulty
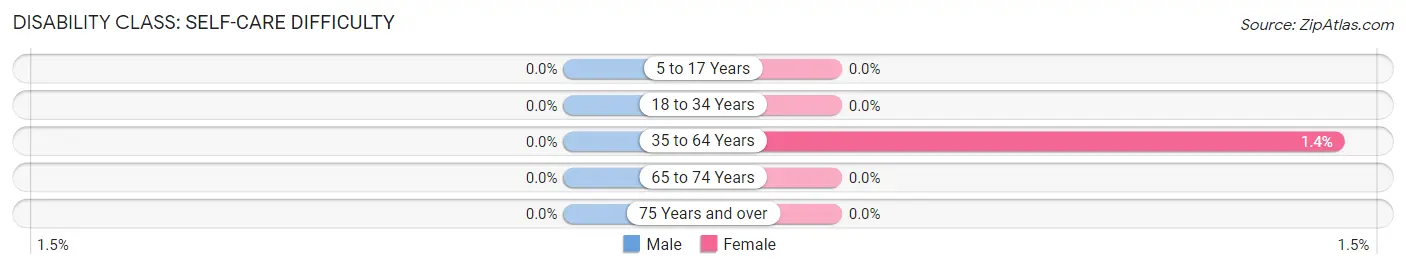
| Age Bracket | Male | Female |
| 5 to 17 Years | 0 (0.0%) | 0 (0.0%) |
| 18 to 34 Years | 0 (0.0%) | 0 (0.0%) |
| 35 to 64 Years | 0 (0.0%) | 9 (1.4%) |
| 65 to 74 Years | 0 (0.0%) | 0 (0.0%) |
| 75 Years and over | 0 (0.0%) | 0 (0.0%) |
Technology Access in West Point
Computing Device Access in West Point
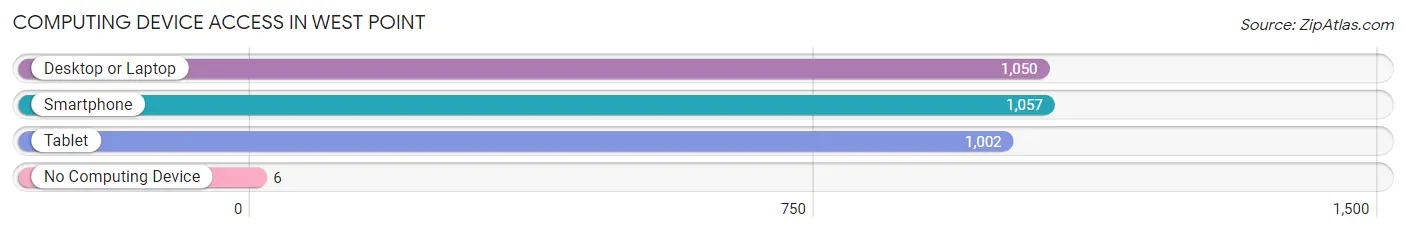
| Device Type | # Households | % Households |
| Desktop or Laptop | 1,050 | 98.8% |
| Smartphone | 1,057 | 99.4% |
| Tablet | 1,002 | 94.3% |
| No Computing Device | 6 | 0.6% |
| Total | 1,063 | 100.0% |
Internet Access in West Point
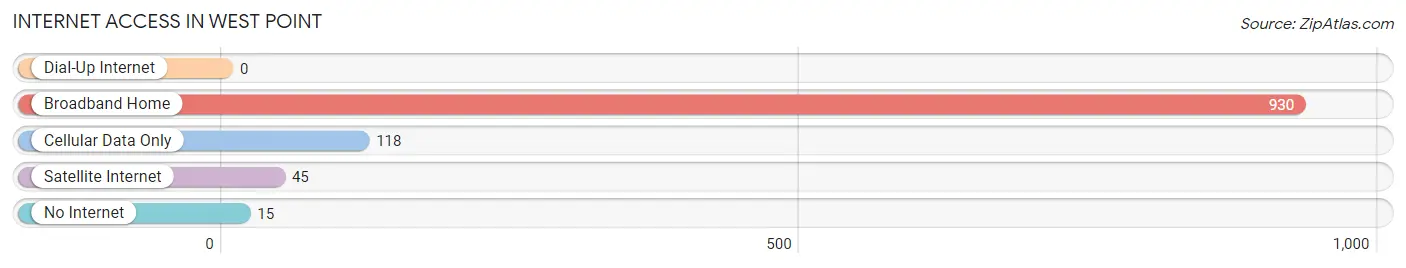
| Internet Type | # Households | % Households |
| Dial-Up Internet | 0 | 0.0% |
| Broadband Home | 930 | 87.5% |
| Cellular Data Only | 118 | 11.1% |
| Satellite Internet | 45 | 4.2% |
| No Internet | 15 | 1.4% |
| Total | 1,063 | 100.0% |
West Point Summary
West Point, NY is a small town located in Orange County, New York. It is situated on the west bank of the Hudson River, approximately 50 miles north of New York City. The town is home to the United States Military Academy, which is the oldest military academy in the United States. West Point is a popular tourist destination, and is known for its scenic views of the Hudson River and the surrounding mountains.
History
West Point was originally inhabited by the Lenape Native Americans, who called the area “Apasin.” The first European settlers arrived in the area in the late 17th century, and the town was officially established in 1778. During the Revolutionary War, the Continental Army established a fort at West Point to protect the Hudson River from British ships. The fort was later named Fort Clinton, and it was the site of several important battles during the war.
In 1802, President Thomas Jefferson established the United States Military Academy at West Point. The academy has since become one of the most prestigious military schools in the world, and it has produced many of the nation’s most famous military leaders, including Ulysses S. Grant and Dwight D. Eisenhower.
Geography
West Point is located in the Hudson Valley region of New York, approximately 50 miles north of New York City. The town is situated on the west bank of the Hudson River, and it is surrounded by the Hudson Highlands. The town is also home to several lakes, including Lake Popolopen and Lake Frederick.
The town has a total area of 8.2 square miles, of which 7.9 square miles is land and 0.3 square miles is water. The town is located at an elevation of approximately 500 feet above sea level.
Economy
West Point is primarily a tourist destination, and the town’s economy is largely dependent on the United States Military Academy. The academy is the town’s largest employer, and it provides jobs for many of the town’s residents. The town is also home to several small businesses, including restaurants, shops, and hotels.
Demographics
As of the 2010 census, West Point had a population of 7,621. The town has a median household income of $76,945, and the median age is 24. The town is predominantly white (94.3%), with small percentages of African American (2.2%), Asian (1.3%), and Hispanic (1.2%) residents.
West Point is a small town with a rich history and a vibrant economy. The town is home to the United States Military Academy, which is one of the most prestigious military schools in the world. The town is also a popular tourist destination, and it is known for its scenic views of the Hudson River and the surrounding mountains. West Point is a diverse community, with a population that is predominantly white, but also includes small percentages of African American, Asian, and Hispanic residents.
Common Questions
What is Per Capita Income in West Point?
Per Capita income in West Point is $28,448.
What is the Median Family Income in West Point?
Median Family Income in West Point is $134,929.
What is the Median Household income in West Point?
Median Household Income in West Point is $133,844.
What is Income or Wage Gap in West Point?
Income or Wage Gap in West Point is 0.7%.
Women in West Point earn 99.3 cents for every dollar earned by a man.
What is Inequality or Gini Index in West Point?
Inequality or Gini Index in West Point is 0.28.
What is the Total Population of West Point?
Total Population of West Point is 6,386.
What is the Total Male Population of West Point?
Total Male Population of West Point is 3,757.
What is the Total Female Population of West Point?
Total Female Population of West Point is 2,629.
What is the Ratio of Males per 100 Females in West Point?
There are 142.91 Males per 100 Females in West Point.
What is the Ratio of Females per 100 Males in West Point?
There are 69.98 Females per 100 Males in West Point.
What is the Median Population Age in West Point?
Median Population Age in West Point is 21.3 Years.
What is the Average Family Size in West Point
Average Family Size in West Point is 3.9 People.
What is the Average Household Size in West Point
Average Household Size in West Point is 3.7 People.
How Large is the Labor Force in West Point?
There are 3,582 People in the Labor Forcein in West Point.
What is the Percentage of People in the Labor Force in West Point?
75.6% of People are in the Labor Force in West Point.
What is the Unemployment Rate in West Point?
Unemployment Rate in West Point is 3.2%.