Berlin borough, NJ Map & Demographics
Berlin borough Overview
$45,214
PER CAPITA INCOME
$128,958
AVG FAMILY INCOME
$98,706
AVG HOUSEHOLD INCOME
41.6%
WAGE / INCOME GAP [ % ]
58.4¢/ $1
WAGE / INCOME GAP [ $ ]
0.41
INEQUALITY / GINI INDEX
7,489
TOTAL POPULATION
3,385
MALE POPULATION
4,104
FEMALE POPULATION
82.48
MALES / 100 FEMALES
121.24
FEMALES / 100 MALES
40.4
MEDIAN AGE
3.3
AVG FAMILY SIZE
2.6
AVG HOUSEHOLD SIZE
4,118
LABOR FORCE [ PEOPLE ]
66.6%
PERCENT IN LABOR FORCE
1.8%
UNEMPLOYMENT RATE
Income in Berlin borough
Income Overview in Berlin borough
Per Capita Income in Berlin borough is $45,214, while median incomes of families and households are $128,958 and $98,706 respectively.
| Characteristic | Number | Measure |
| Per Capita Income | 7,489 | $45,214 |
| Median Family Income | 1,871 | $128,958 |
| Mean Family Income | 1,871 | $138,373 |
| Median Household Income | 2,835 | $98,706 |
| Mean Household Income | 2,835 | $115,738 |
| Income Deficit | 1,871 | $0 |
| Wage / Income Gap (%) | 7,489 | 41.65% |
| Wage / Income Gap ($) | 7,489 | 58.35¢ per $1 |
| Gini / Inequality Index | 7,489 | 0.41 |
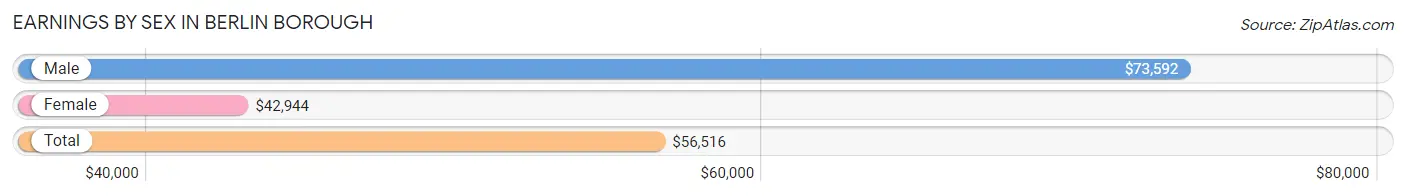
Earnings by Sex in Berlin borough
Average Earnings in Berlin borough are $56,516, $73,592 for men and $42,944 for women, a difference of 41.6%.
| Sex | Number | Average Earnings |
| Male | 2,163 (49.7%) | $73,592 |
| Female | 2,192 (50.3%) | $42,944 |
| Total | 4,355 (100.0%) | $56,516 |
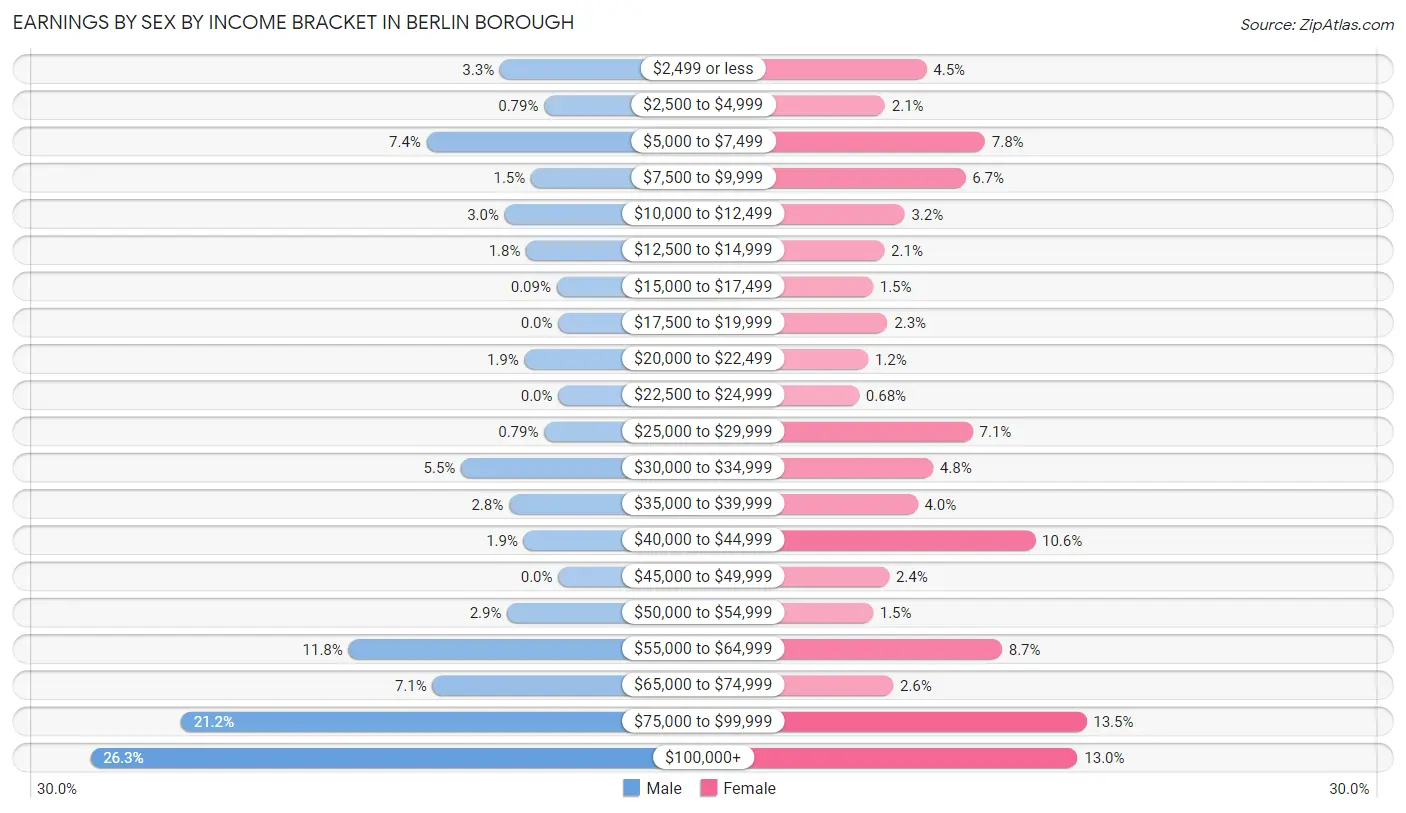
Earnings by Sex by Income Bracket in Berlin borough
The most common earnings brackets in Berlin borough are $100,000+ for men (569 | 26.3%) and $75,000 to $99,999 for women (295 | 13.5%).
| Income | Male | Female |
| $2,499 or less | 71 (3.3%) | 98 (4.5%) |
| $2,500 to $4,999 | 17 (0.8%) | 47 (2.1%) |
| $5,000 to $7,499 | 160 (7.4%) | 170 (7.8%) |
| $7,500 to $9,999 | 33 (1.5%) | 146 (6.7%) |
| $10,000 to $12,499 | 65 (3.0%) | 71 (3.2%) |
| $12,500 to $14,999 | 39 (1.8%) | 46 (2.1%) |
| $15,000 to $17,499 | 2 (0.1%) | 32 (1.5%) |
| $17,500 to $19,999 | 0 (0.0%) | 50 (2.3%) |
| $20,000 to $22,499 | 41 (1.9%) | 26 (1.2%) |
| $22,500 to $24,999 | 0 (0.0%) | 15 (0.7%) |
| $25,000 to $29,999 | 17 (0.8%) | 155 (7.1%) |
| $30,000 to $34,999 | 118 (5.5%) | 106 (4.8%) |
| $35,000 to $39,999 | 60 (2.8%) | 87 (4.0%) |
| $40,000 to $44,999 | 42 (1.9%) | 232 (10.6%) |
| $45,000 to $49,999 | 0 (0.0%) | 52 (2.4%) |
| $50,000 to $54,999 | 62 (2.9%) | 32 (1.5%) |
| $55,000 to $64,999 | 255 (11.8%) | 191 (8.7%) |
| $65,000 to $74,999 | 153 (7.1%) | 57 (2.6%) |
| $75,000 to $99,999 | 459 (21.2%) | 295 (13.5%) |
| $100,000+ | 569 (26.3%) | 284 (13.0%) |
| Total | 2,163 (100.0%) | 2,192 (100.0%) |
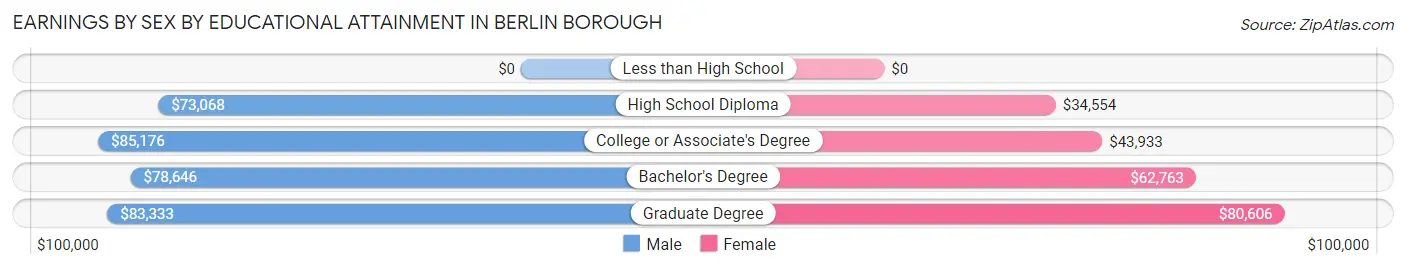
Earnings by Sex by Educational Attainment in Berlin borough
Average earnings in Berlin borough are $78,690 for men and $44,417 for women, a difference of 43.5%. Men with an educational attainment of college or associate's degree enjoy the highest average annual earnings of $85,176, while those with high school diploma education earn the least with $73,068. Women with an educational attainment of graduate degree earn the most with the average annual earnings of $80,606, while those with high school diploma education have the smallest earnings of $34,554.
| Educational Attainment | Male Income | Female Income |
| Less than High School | - | - |
| High School Diploma | $73,068 | $34,554 |
| College or Associate's Degree | $85,176 | $43,933 |
| Bachelor's Degree | $78,646 | $62,763 |
| Graduate Degree | $83,333 | $80,606 |
| Total | $78,690 | $44,417 |
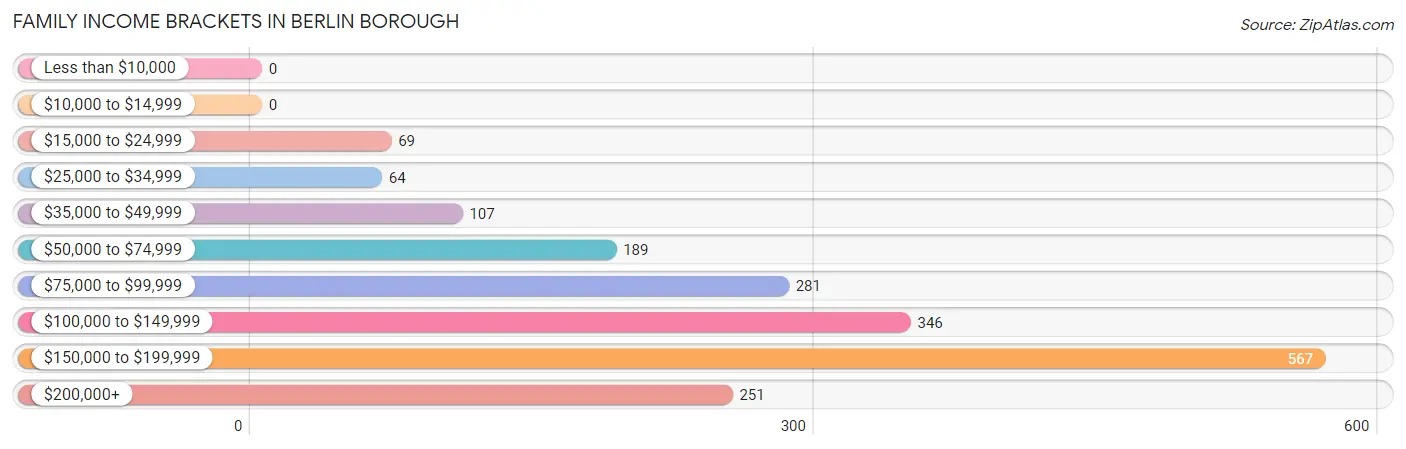
Family Income in Berlin borough
Family Income Brackets in Berlin borough
According to the Berlin borough family income data, there are 567 families falling into the $150,000 to $199,999 income range, which is the most common income bracket and makes up 30.3% of all families.
| Income Bracket | # Families | % Families |
| Less than $10,000 | 0 | 0.0% |
| $10,000 to $14,999 | 0 | 0.0% |
| $15,000 to $24,999 | 69 | 3.7% |
| $25,000 to $34,999 | 64 | 3.4% |
| $35,000 to $49,999 | 107 | 5.7% |
| $50,000 to $74,999 | 189 | 10.1% |
| $75,000 to $99,999 | 281 | 15.0% |
| $100,000 to $149,999 | 346 | 18.5% |
| $150,000 to $199,999 | 567 | 30.3% |
| $200,000+ | 251 | 13.4% |
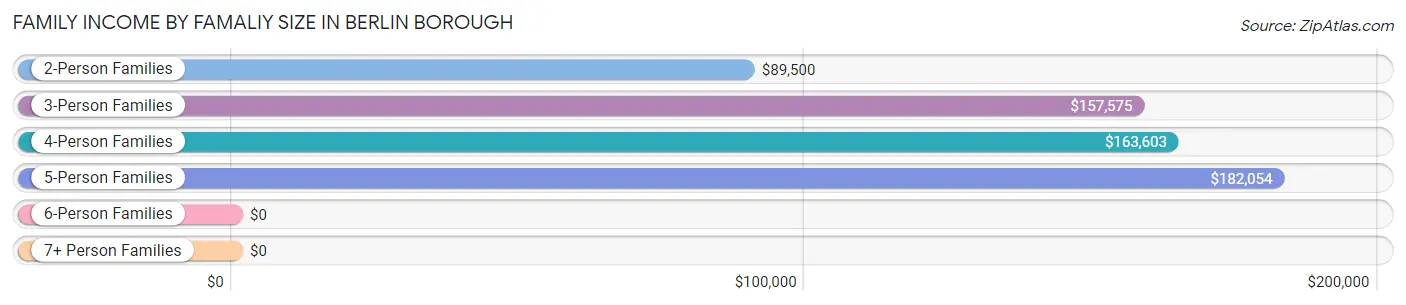
Family Income by Famaliy Size in Berlin borough
5-person families (212 | 11.3%) account for the highest median family income in Berlin borough with $182,054 per family, while 3-person families (255 | 13.6%) have the highest median income of $52,525 per family member.
| Income Bracket | # Families | Median Income |
| 2-Person Families | 944 (50.4%) | $89,500 |
| 3-Person Families | 255 (13.6%) | $157,575 |
| 4-Person Families | 393 (21.0%) | $163,603 |
| 5-Person Families | 212 (11.3%) | $182,054 |
| 6-Person Families | 38 (2.0%) | $0 |
| 7+ Person Families | 29 (1.5%) | $0 |
| Total | 1,871 (100.0%) | $128,958 |
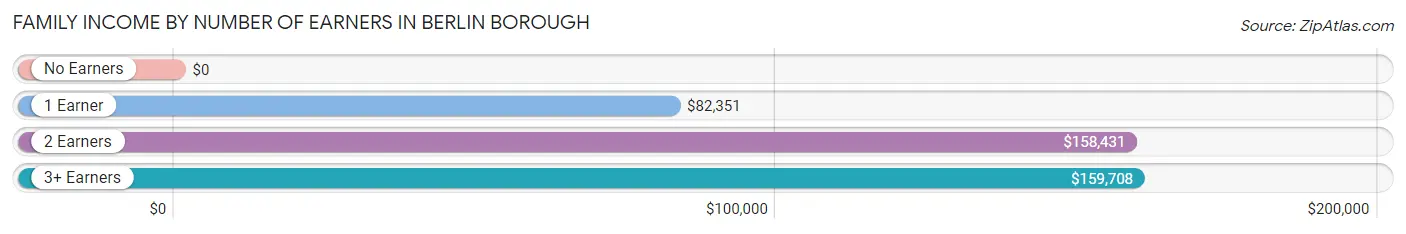
Family Income by Number of Earners in Berlin borough
| Number of Earners | # Families | Median Income |
| No Earners | 80 (4.3%) | $0 |
| 1 Earner | 609 (32.6%) | $82,351 |
| 2 Earners | 892 (47.7%) | $158,431 |
| 3+ Earners | 290 (15.5%) | $159,708 |
| Total | 1,871 (100.0%) | $128,958 |
Household Income in Berlin borough
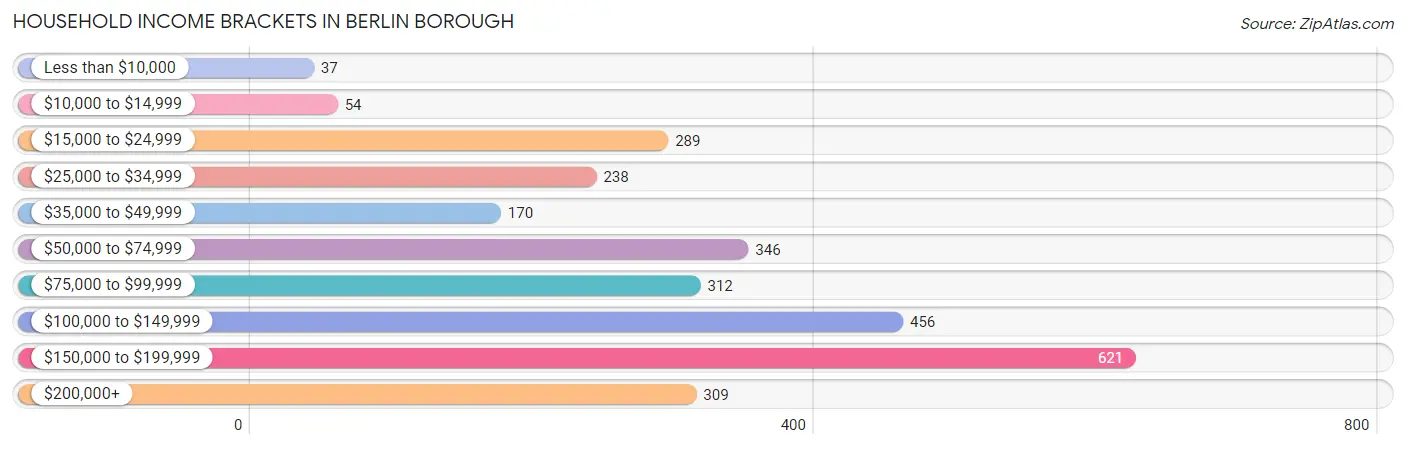
Household Income Brackets in Berlin borough
With 621 households falling in the category, the $150,000 to $199,999 income range is the most frequent in Berlin borough, accounting for 21.9% of all households. In contrast, only 37 households (1.3%) fall into the less than $10,000 income bracket, making it the least populous group.
| Income Bracket | # Households | % Households |
| Less than $10,000 | 37 | 1.3% |
| $10,000 to $14,999 | 54 | 1.9% |
| $15,000 to $24,999 | 289 | 10.2% |
| $25,000 to $34,999 | 238 | 8.4% |
| $35,000 to $49,999 | 170 | 6.0% |
| $50,000 to $74,999 | 346 | 12.2% |
| $75,000 to $99,999 | 312 | 11.0% |
| $100,000 to $149,999 | 456 | 16.1% |
| $150,000 to $199,999 | 621 | 21.9% |
| $200,000+ | 309 | 10.9% |
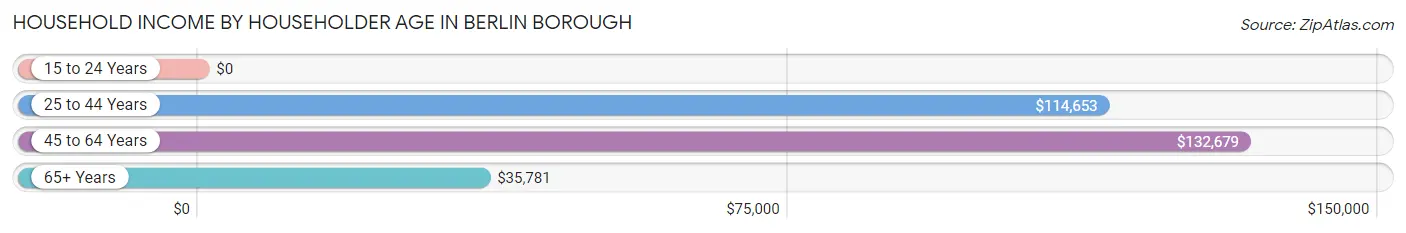
Household Income by Householder Age in Berlin borough
The median household income in Berlin borough is $98,706, with the highest median household income of $132,679 found in the 45 to 64 years age bracket for the primary householder. A total of 1,312 households (46.3%) fall into this category.
| Income Bracket | # Households | Median Income |
| 15 to 24 Years | 0 (0.0%) | $0 |
| 25 to 44 Years | 712 (25.1%) | $114,653 |
| 45 to 64 Years | 1,312 (46.3%) | $132,679 |
| 65+ Years | 811 (28.6%) | $35,781 |
| Total | 2,835 (100.0%) | $98,706 |
Poverty in Berlin borough
Income Below Poverty by Sex and Age in Berlin borough
With 1.7% poverty level for males and 5.7% for females among the residents of Berlin borough, 55 to 64 year old males and 12 to 14 year old females are the most vulnerable to poverty, with 56 males (8.7%) and 69 females (24.5%) in their respective age groups living below the poverty level.
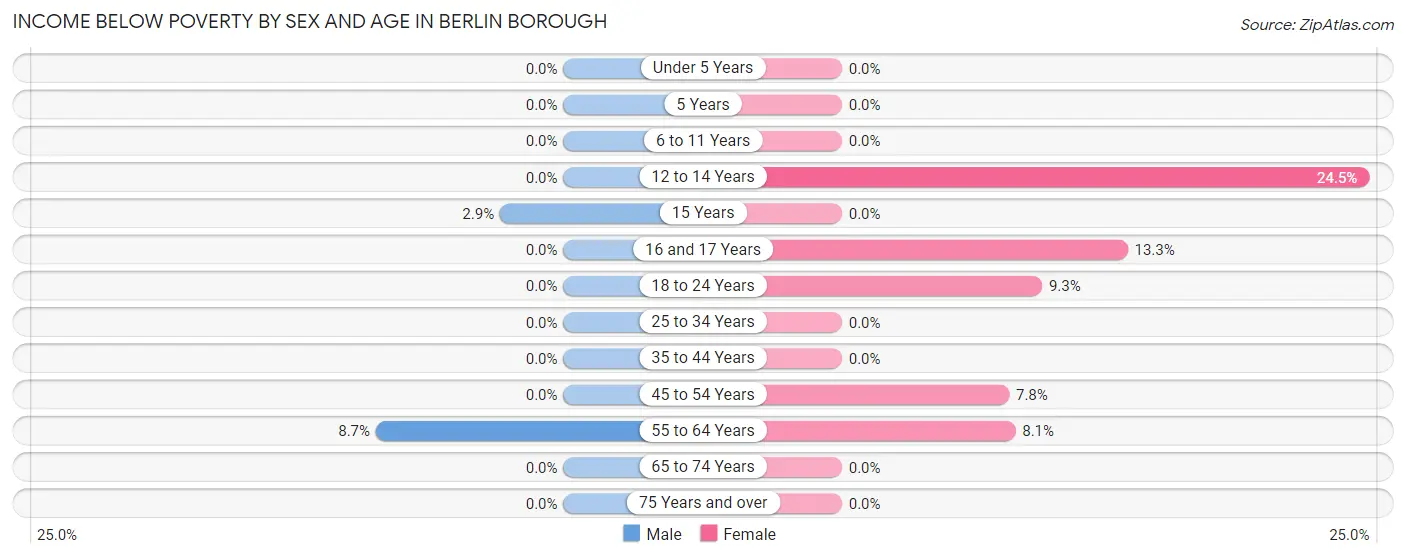
| Age Bracket | Male | Female |
| Under 5 Years | 0 (0.0%) | 0 (0.0%) |
| 5 Years | 0 (0.0%) | 0 (0.0%) |
| 6 to 11 Years | 0 (0.0%) | 0 (0.0%) |
| 12 to 14 Years | 0 (0.0%) | 69 (24.5%) |
| 15 Years | 1 (2.9%) | 0 (0.0%) |
| 16 and 17 Years | 0 (0.0%) | 24 (13.3%) |
| 18 to 24 Years | 0 (0.0%) | 39 (9.3%) |
| 25 to 34 Years | 0 (0.0%) | 0 (0.0%) |
| 35 to 44 Years | 0 (0.0%) | 0 (0.0%) |
| 45 to 54 Years | 0 (0.0%) | 70 (7.8%) |
| 55 to 64 Years | 56 (8.7%) | 28 (8.1%) |
| 65 to 74 Years | 0 (0.0%) | 0 (0.0%) |
| 75 Years and over | 0 (0.0%) | 0 (0.0%) |
| Total | 57 (1.7%) | 230 (5.7%) |
Income Above Poverty by Sex and Age in Berlin borough
According to the poverty statistics in Berlin borough, males aged under 5 years and females aged under 5 years are the age groups that are most secure financially, with 100.0% of males and 100.0% of females in these age groups living above the poverty line.
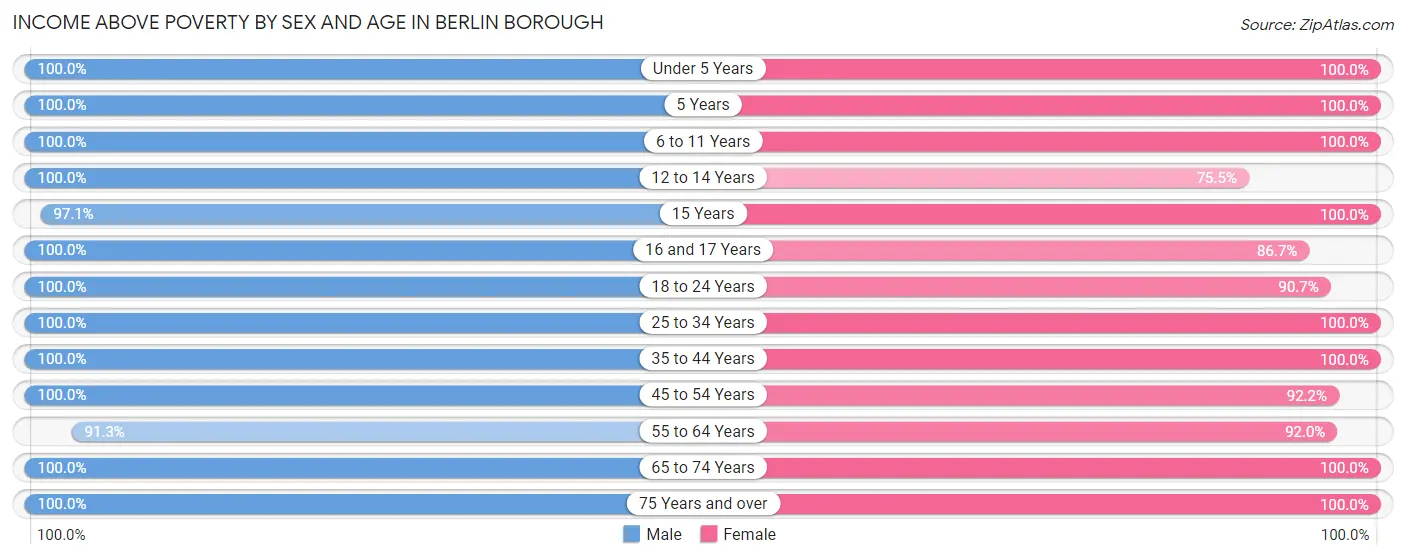
| Age Bracket | Male | Female |
| Under 5 Years | 160 (100.0%) | 51 (100.0%) |
| 5 Years | 37 (100.0%) | 19 (100.0%) |
| 6 to 11 Years | 224 (100.0%) | 223 (100.0%) |
| 12 to 14 Years | 156 (100.0%) | 213 (75.5%) |
| 15 Years | 33 (97.1%) | 97 (100.0%) |
| 16 and 17 Years | 107 (100.0%) | 157 (86.7%) |
| 18 to 24 Years | 383 (100.0%) | 381 (90.7%) |
| 25 to 34 Years | 370 (100.0%) | 546 (100.0%) |
| 35 to 44 Years | 385 (100.0%) | 261 (100.0%) |
| 45 to 54 Years | 465 (100.0%) | 832 (92.2%) |
| 55 to 64 Years | 588 (91.3%) | 320 (91.9%) |
| 65 to 74 Years | 251 (100.0%) | 338 (100.0%) |
| 75 Years and over | 130 (100.0%) | 375 (100.0%) |
| Total | 3,289 (98.3%) | 3,813 (94.3%) |
Income Below Poverty Among Married-Couple Families in Berlin borough
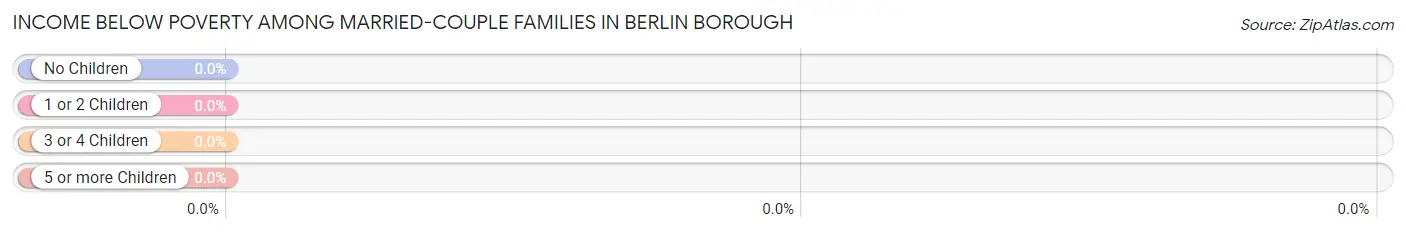
| Children | Above Poverty | Below Poverty |
| No Children | 739 (100.0%) | 0 (0.0%) |
| 1 or 2 Children | 440 (100.0%) | 0 (0.0%) |
| 3 or 4 Children | 55 (100.0%) | 0 (0.0%) |
| 5 or more Children | 29 (100.0%) | 0 (0.0%) |
| Total | 1,263 (100.0%) | 0 (0.0%) |
Income Below Poverty Among Single-Parent Households in Berlin borough
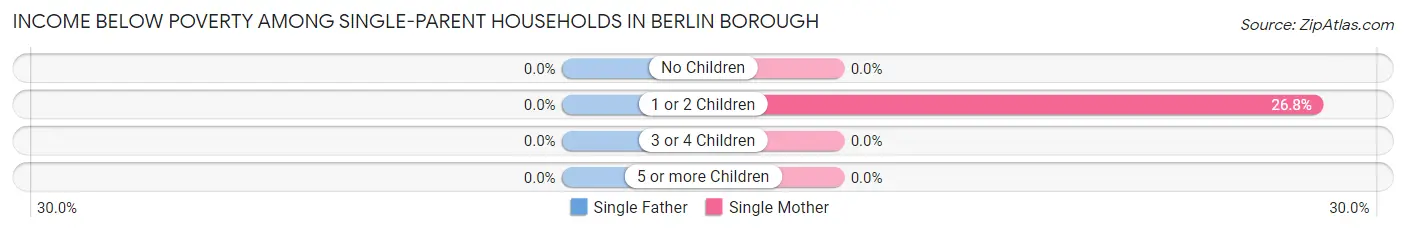
| Children | Single Father | Single Mother |
| No Children | 0 (0.0%) | 0 (0.0%) |
| 1 or 2 Children | 0 (0.0%) | 70 (26.8%) |
| 3 or 4 Children | 0 (0.0%) | 0 (0.0%) |
| 5 or more Children | 0 (0.0%) | 0 (0.0%) |
| Total | 0 (0.0%) | 70 (16.7%) |
Income Below Poverty Among Married-Couple vs Single-Parent Households in Berlin borough
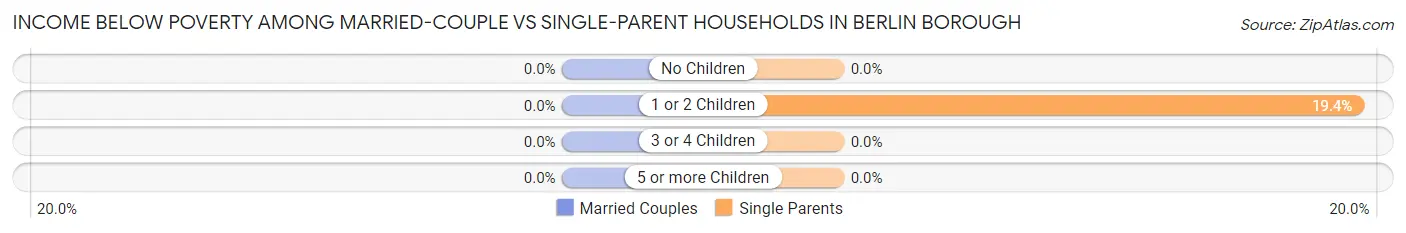
| Children | Married-Couple Families | Single-Parent Households |
| No Children | 0 (0.0%) | 0 (0.0%) |
| 1 or 2 Children | 0 (0.0%) | 70 (19.4%) |
| 3 or 4 Children | 0 (0.0%) | 0 (0.0%) |
| 5 or more Children | 0 (0.0%) | 0 (0.0%) |
| Total | 0 (0.0%) | 70 (11.5%) |
Race in Berlin borough
The most populous races in Berlin borough are White / Caucasian (5,766 | 77.0%), Black / African American (935 | 12.5%), and Two or more Races (467 | 6.2%).
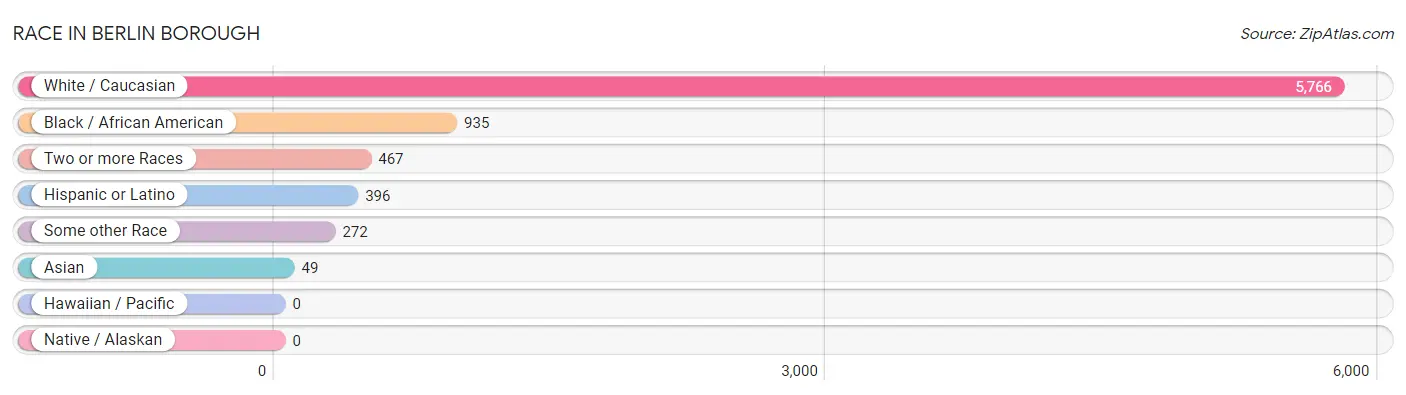
| Race | # Population | % Population |
| Asian | 49 | 0.6% |
| Black / African American | 935 | 12.5% |
| Hawaiian / Pacific | 0 | 0.0% |
| Hispanic or Latino | 396 | 5.3% |
| Native / Alaskan | 0 | 0.0% |
| White / Caucasian | 5,766 | 77.0% |
| Two or more Races | 467 | 6.2% |
| Some other Race | 272 | 3.6% |
| Total | 7,489 | 100.0% |
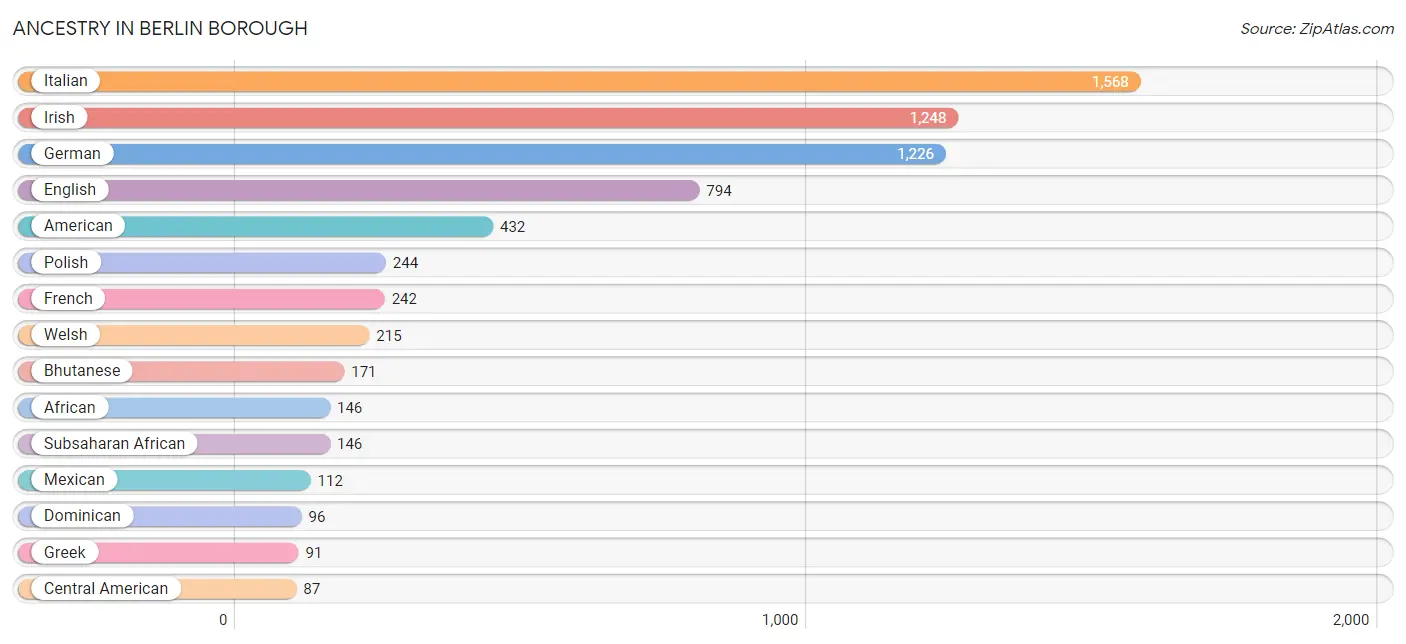
Ancestry in Berlin borough
The most populous ancestries reported in Berlin borough are Italian (1,568 | 20.9%), Irish (1,248 | 16.7%), German (1,226 | 16.4%), English (794 | 10.6%), and American (432 | 5.8%), together accounting for 70.3% of all Berlin borough residents.
| Ancestry | # Population | % Population |
| African | 146 | 1.9% |
| American | 432 | 5.8% |
| Arab | 15 | 0.2% |
| Austrian | 20 | 0.3% |
| Bhutanese | 171 | 2.3% |
| Canadian | 15 | 0.2% |
| Central American | 87 | 1.2% |
| Cherokee | 9 | 0.1% |
| Cuban | 25 | 0.3% |
| Czech | 13 | 0.2% |
| Danish | 23 | 0.3% |
| Dominican | 96 | 1.3% |
| Dutch | 47 | 0.6% |
| English | 794 | 10.6% |
| European | 76 | 1.0% |
| French | 242 | 3.2% |
| French Canadian | 24 | 0.3% |
| German | 1,226 | 16.4% |
| Greek | 91 | 1.2% |
| Irish | 1,248 | 16.7% |
| Italian | 1,568 | 20.9% |
| Lebanese | 15 | 0.2% |
| Lithuanian | 15 | 0.2% |
| Mexican | 112 | 1.5% |
| Native Hawaiian | 40 | 0.5% |
| Norwegian | 40 | 0.5% |
| Polish | 244 | 3.3% |
| Puerto Rican | 76 | 1.0% |
| Romanian | 50 | 0.7% |
| Russian | 65 | 0.9% |
| Salvadoran | 87 | 1.2% |
| Scandinavian | 16 | 0.2% |
| Scottish | 26 | 0.4% |
| Slovak | 84 | 1.1% |
| Subsaharan African | 146 | 1.9% |
| Swedish | 67 | 0.9% |
| Thai | 49 | 0.6% |
| Ukrainian | 43 | 0.6% |
| Welsh | 215 | 2.9% |
| Yugoslavian | 13 | 0.2% | View All 40 Rows |
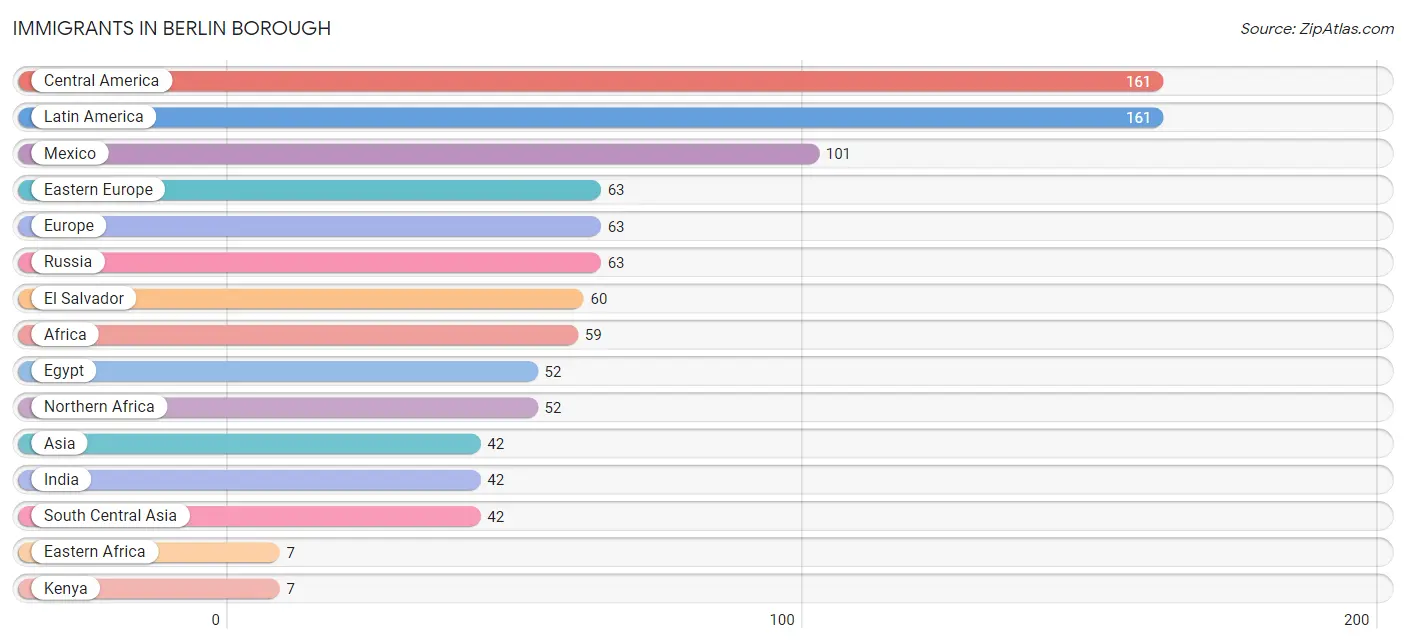
Immigrants in Berlin borough
The most numerous immigrant groups reported in Berlin borough came from Central America (161 | 2.1%), Latin America (161 | 2.1%), Mexico (101 | 1.3%), Eastern Europe (63 | 0.8%), and Europe (63 | 0.8%), together accounting for 7.3% of all Berlin borough residents.
| Immigration Origin | # Population | % Population |
| Africa | 59 | 0.8% |
| Asia | 42 | 0.6% |
| Central America | 161 | 2.1% |
| Eastern Africa | 7 | 0.1% |
| Eastern Europe | 63 | 0.8% |
| Egypt | 52 | 0.7% |
| El Salvador | 60 | 0.8% |
| Europe | 63 | 0.8% |
| India | 42 | 0.6% |
| Kenya | 7 | 0.1% |
| Latin America | 161 | 2.1% |
| Mexico | 101 | 1.3% |
| Northern Africa | 52 | 0.7% |
| Russia | 63 | 0.8% |
| South Central Asia | 42 | 0.6% | View All 15 Rows |
Sex and Age in Berlin borough
Sex and Age in Berlin borough
The most populous age groups in Berlin borough are 15 to 19 Years (348 | 10.3%) for men and 50 to 54 Years (512 | 12.5%) for women.
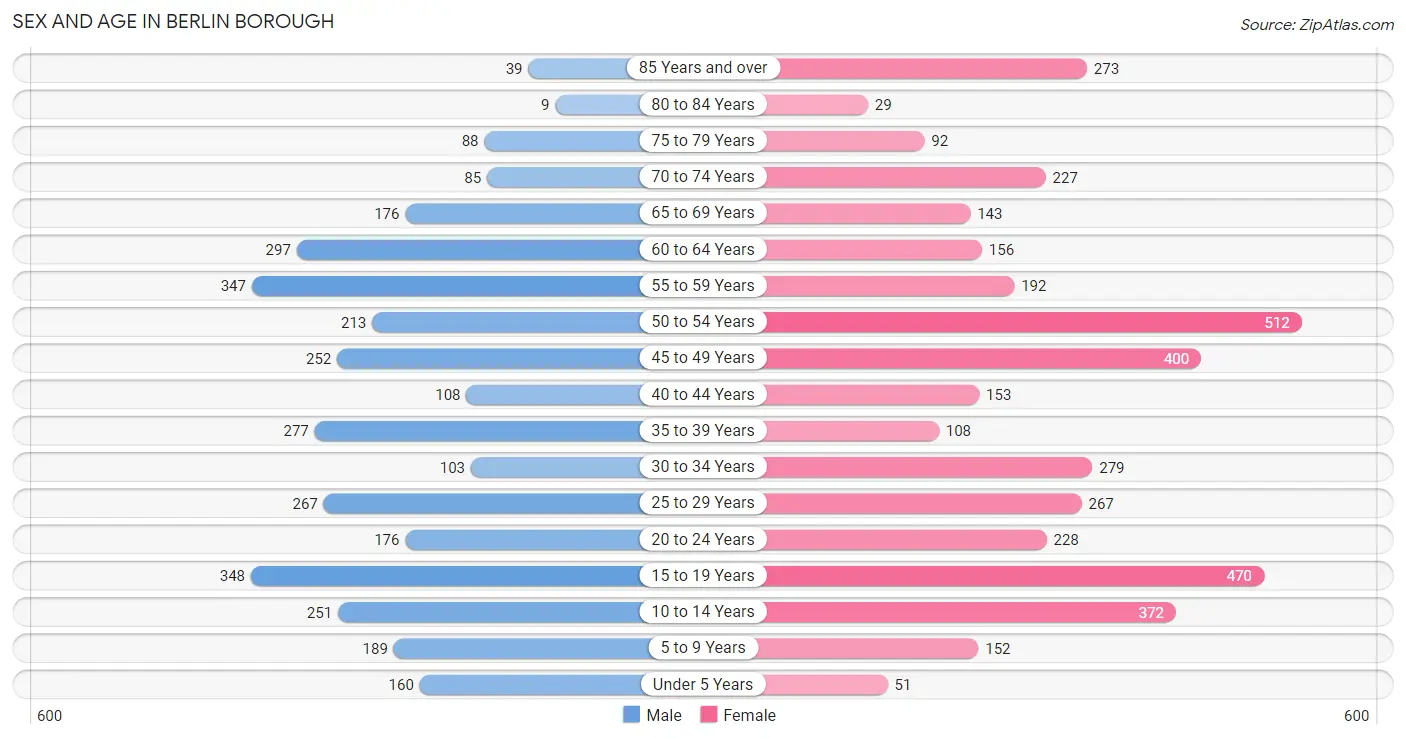
| Age Bracket | Male | Female |
| Under 5 Years | 160 (4.7%) | 51 (1.2%) |
| 5 to 9 Years | 189 (5.6%) | 152 (3.7%) |
| 10 to 14 Years | 251 (7.4%) | 372 (9.1%) |
| 15 to 19 Years | 348 (10.3%) | 470 (11.5%) |
| 20 to 24 Years | 176 (5.2%) | 228 (5.6%) |
| 25 to 29 Years | 267 (7.9%) | 267 (6.5%) |
| 30 to 34 Years | 103 (3.0%) | 279 (6.8%) |
| 35 to 39 Years | 277 (8.2%) | 108 (2.6%) |
| 40 to 44 Years | 108 (3.2%) | 153 (3.7%) |
| 45 to 49 Years | 252 (7.4%) | 400 (9.8%) |
| 50 to 54 Years | 213 (6.3%) | 512 (12.5%) |
| 55 to 59 Years | 347 (10.2%) | 192 (4.7%) |
| 60 to 64 Years | 297 (8.8%) | 156 (3.8%) |
| 65 to 69 Years | 176 (5.2%) | 143 (3.5%) |
| 70 to 74 Years | 85 (2.5%) | 227 (5.5%) |
| 75 to 79 Years | 88 (2.6%) | 92 (2.2%) |
| 80 to 84 Years | 9 (0.3%) | 29 (0.7%) |
| 85 Years and over | 39 (1.1%) | 273 (6.7%) |
| Total | 3,385 (100.0%) | 4,104 (100.0%) |
Families and Households in Berlin borough
Median Family Size in Berlin borough
The median family size in Berlin borough is 3.26 persons per family, with married-couple families (1,263 | 67.5%) accounting for the largest median family size of 3.5 persons per family. On the other hand, single male/father families (189 | 10.1%) represent the smallest median family size with 2.24 persons per family.
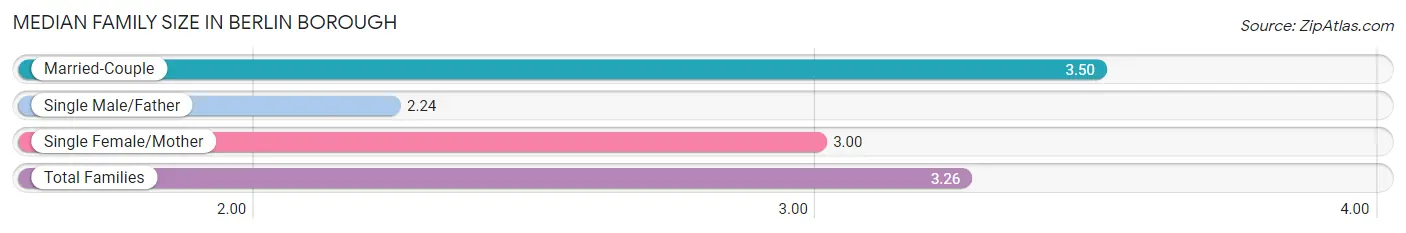
| Family Type | # Families | Family Size |
| Married-Couple | 1,263 (67.5%) | 3.50 |
| Single Male/Father | 189 (10.1%) | 2.24 |
| Single Female/Mother | 419 (22.4%) | 3.00 |
| Total Families | 1,871 (100.0%) | 3.26 |
Median Household Size in Berlin borough
The median household size in Berlin borough is 2.61 persons per household, with married-couple households (1,263 | 44.6%) accounting for the largest median household size of 3.5 persons per household. non-family households (964 | 34.0%) represent the smallest median household size with 1.22 persons per household.
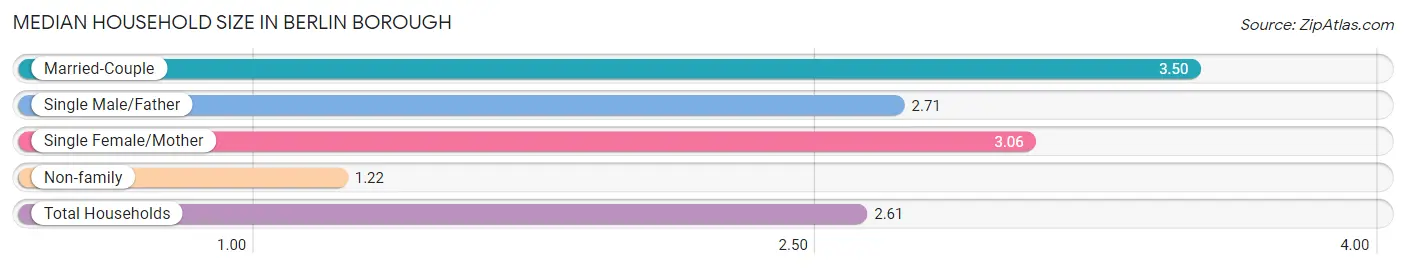
| Household Type | # Households | Household Size |
| Married-Couple | 1,263 (44.6%) | 3.50 |
| Single Male/Father | 189 (6.7%) | 2.71 |
| Single Female/Mother | 419 (14.8%) | 3.06 |
| Non-family | 964 (34.0%) | 1.22 |
| Total Households | 2,835 (100.0%) | 2.61 |
Household Size by Marriage Status in Berlin borough
Out of a total of 2,835 households in Berlin borough, 1,871 (66.0%) are family households, while 964 (34.0%) are nonfamily households. The most numerous type of family households are 2-person households, comprising 842, and the most common type of nonfamily households are 1-person households, comprising 842.
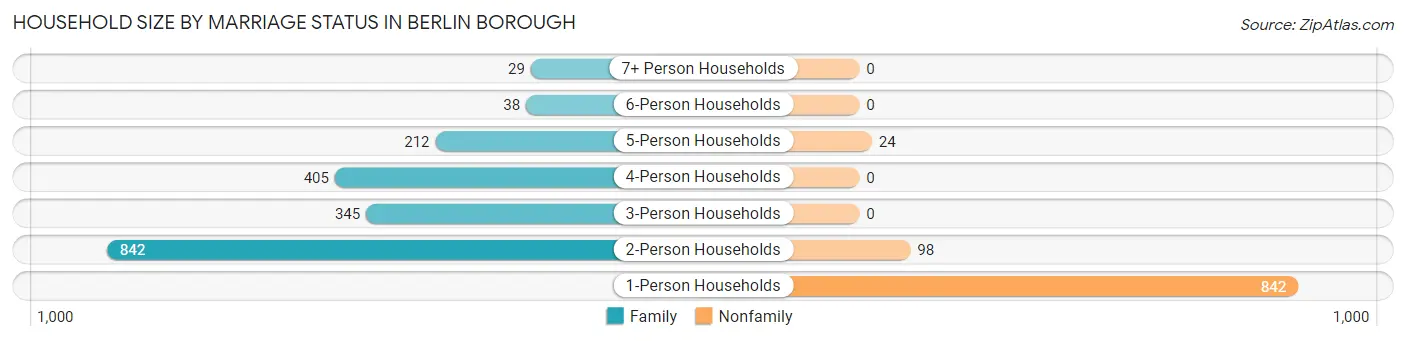
| Household Size | Family Households | Nonfamily Households |
| 1-Person Households | - | 842 (29.7%) |
| 2-Person Households | 842 (29.7%) | 98 (3.5%) |
| 3-Person Households | 345 (12.2%) | 0 (0.0%) |
| 4-Person Households | 405 (14.3%) | 0 (0.0%) |
| 5-Person Households | 212 (7.5%) | 24 (0.9%) |
| 6-Person Households | 38 (1.3%) | 0 (0.0%) |
| 7+ Person Households | 29 (1.0%) | 0 (0.0%) |
| Total | 1,871 (66.0%) | 964 (34.0%) |
Female Fertility in Berlin borough
Fertility by Age in Berlin borough
Average fertility rate in Berlin borough is 71.0 births per 1,000 women. Women in the age bracket of 35 to 50 years have the highest fertility rate with 123.0 births per 1,000 women. Women in the age bracket of 35 to 50 years acount for 72.0% of all women with births.
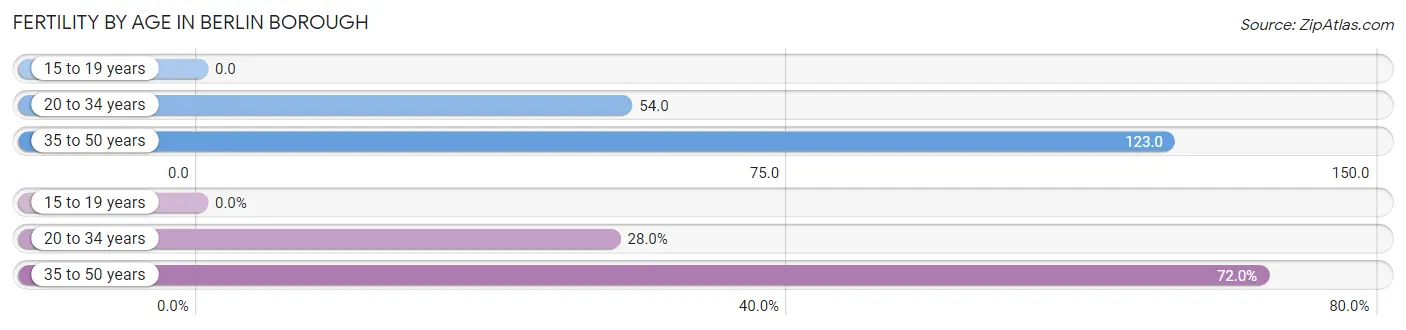
| Age Bracket | Women with Births | Births / 1,000 Women |
| 15 to 19 years | 0 (0.0%) | 0.0 |
| 20 to 34 years | 42 (28.0%) | 54.0 |
| 35 to 50 years | 108 (72.0%) | 123.0 |
| Total | 150 (100.0%) | 71.0 |
Fertility by Age by Marriage Status in Berlin borough
53.3% of women with births (150) in Berlin borough are married. The highest percentage of unmarried women with births falls into 35 to 50 years age bracket with 64.8% of them unmarried at the time of birth, while the lowest percentage of unmarried women with births belong to 20 to 34 years age bracket with 0.0% of them unmarried.
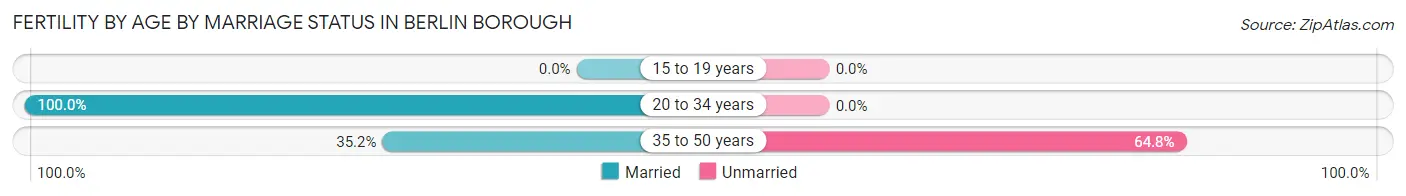
| Age Bracket | Married | Unmarried |
| 15 to 19 years | 0 (0.0%) | 0 (0.0%) |
| 20 to 34 years | 42 (100.0%) | 0 (0.0%) |
| 35 to 50 years | 38 (35.2%) | 70 (64.8%) |
| Total | 80 (53.3%) | 70 (46.7%) |
Fertility by Education in Berlin borough
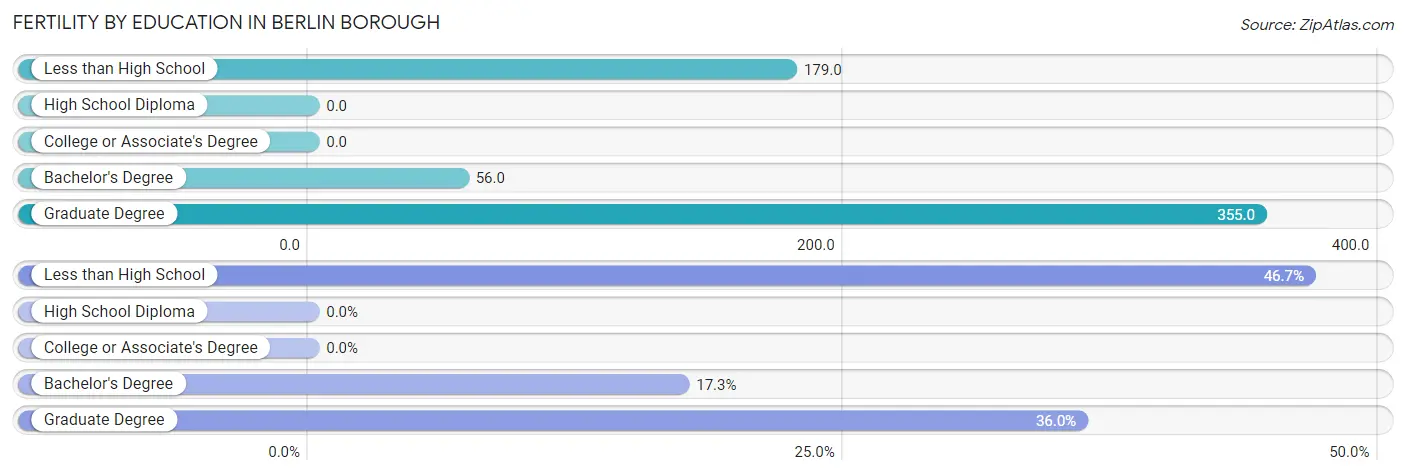
| Educational Attainment | Women with Births | Births / 1,000 Women |
| Less than High School | 70 (46.7%) | 179.0 |
| High School Diploma | 0 (0.0%) | 0.0 |
| College or Associate's Degree | 0 (0.0%) | 0.0 |
| Bachelor's Degree | 26 (17.3%) | 56.0 |
| Graduate Degree | 54 (36.0%) | 355.0 |
| Total | 150 (100.0%) | 71.0 |
Fertility by Education by Marriage Status in Berlin borough
46.7% of women with births in Berlin borough are unmarried. Women with the educational attainment of bachelor's degree are most likely to be married with 100.0% of them married at childbirth, while women with the educational attainment of less than high school are least likely to be married with 100.0% of them unmarried at childbirth.
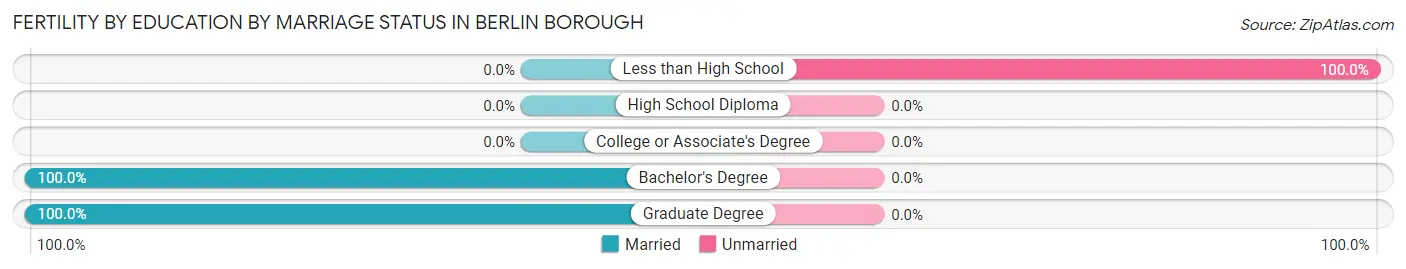
| Educational Attainment | Married | Unmarried |
| Less than High School | 0 (0.0%) | 70 (100.0%) |
| High School Diploma | 0 (0.0%) | 0 (0.0%) |
| College or Associate's Degree | 0 (0.0%) | 0 (0.0%) |
| Bachelor's Degree | 26 (100.0%) | 0 (0.0%) |
| Graduate Degree | 54 (100.0%) | 0 (0.0%) |
| Total | 80 (53.3%) | 70 (46.7%) |
Employment Characteristics in Berlin borough
Employment by Class of Employer in Berlin borough
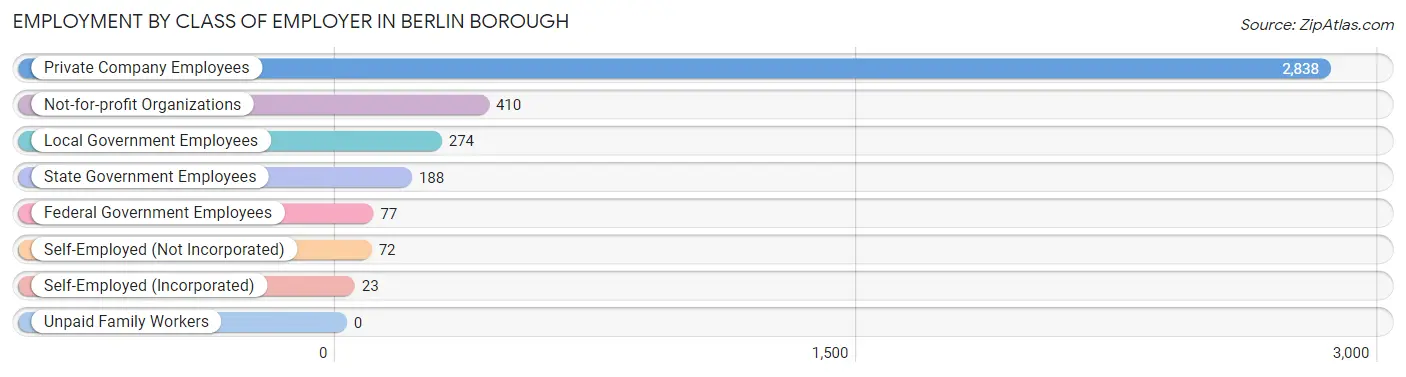
Among the 3,882 employed individuals in Berlin borough, private company employees (2,838 | 73.1%), not-for-profit organizations (410 | 10.6%), and local government employees (274 | 7.1%) make up the most common classes of employment.
| Employer Class | # Employees | % Employees |
| Private Company Employees | 2,838 | 73.1% |
| Self-Employed (Incorporated) | 23 | 0.6% |
| Self-Employed (Not Incorporated) | 72 | 1.8% |
| Not-for-profit Organizations | 410 | 10.6% |
| Local Government Employees | 274 | 7.1% |
| State Government Employees | 188 | 4.8% |
| Federal Government Employees | 77 | 2.0% |
| Unpaid Family Workers | 0 | 0.0% |
| Total | 3,882 | 100.0% |
Employment Status by Age in Berlin borough
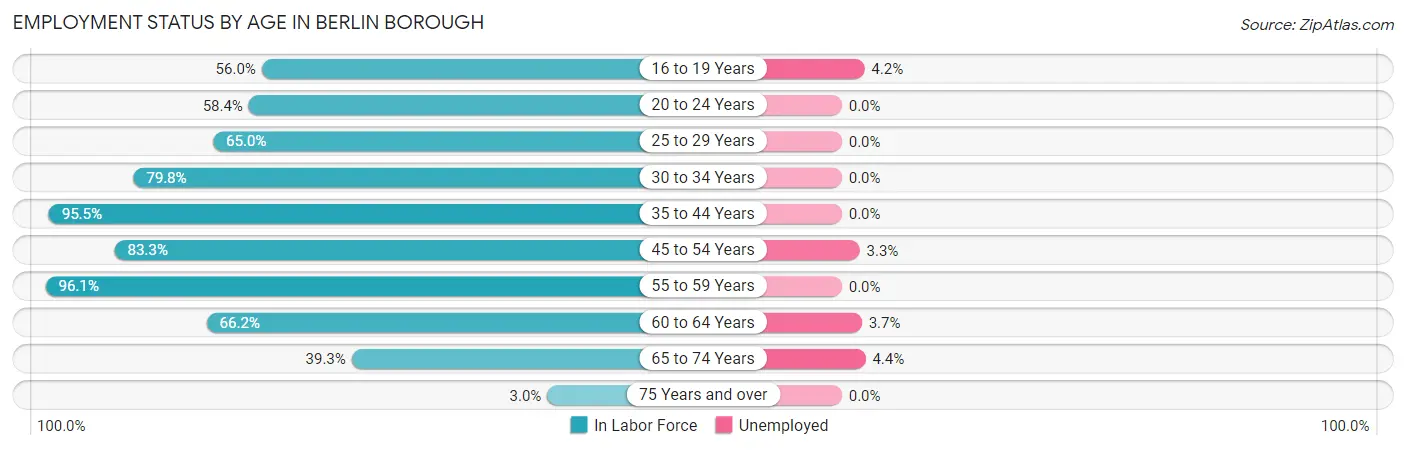
According to the labor force statistics for Berlin borough, out of the total population over 16 years of age (6,183), 66.6% or 4,118 individuals are in the labor force, with 1.8% or 74 of them unemployed. The age group with the highest labor force participation rate is 55 to 59 years, with 96.1% or 518 individuals in the labor force. Within the labor force, the 65 to 74 years age range has the highest percentage of unemployed individuals, with 4.4% or 11 of them being unemployed.
| Age Bracket | In Labor Force | Unemployed |
| 16 to 19 Years | 385 (56.0%) | 16 (4.2%) |
| 20 to 24 Years | 236 (58.4%) | 0 (0.0%) |
| 25 to 29 Years | 347 (65.0%) | 0 (0.0%) |
| 30 to 34 Years | 305 (79.8%) | 0 (0.0%) |
| 35 to 44 Years | 617 (95.5%) | 0 (0.0%) |
| 45 to 54 Years | 1,147 (83.3%) | 38 (3.3%) |
| 55 to 59 Years | 518 (96.1%) | 0 (0.0%) |
| 60 to 64 Years | 300 (66.2%) | 11 (3.7%) |
| 65 to 74 Years | 248 (39.3%) | 11 (4.4%) |
| 75 Years and over | 16 (3.0%) | 0 (0.0%) |
| Total | 4,118 (66.6%) | 74 (1.8%) |
Employment Status by Educational Attainment in Berlin borough
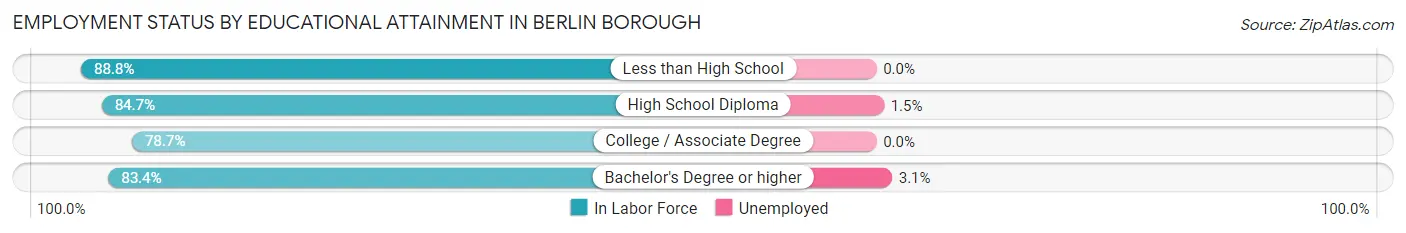
According to labor force statistics for Berlin borough, 82.3% of individuals (3,235) out of the total population between 25 and 64 years of age (3,931) are in the labor force, with 1.5% or 49 of them being unemployed. The group with the highest labor force participation rate are those with the educational attainment of less than high school, with 88.8% or 151 individuals in the labor force. Within the labor force, individuals with bachelor's degree or higher education have the highest percentage of unemployment, with 3.1% or 38 of them being unemployed.
| Educational Attainment | In Labor Force | Unemployed |
| Less than High School | 151 (88.8%) | 0 (0.0%) |
| High School Diploma | 755 (84.7%) | 13 (1.5%) |
| College / Associate Degree | 1,110 (78.7%) | 0 (0.0%) |
| Bachelor's Degree or higher | 1,218 (83.4%) | 45 (3.1%) |
| Total | 3,235 (82.3%) | 59 (1.5%) |
Employment Occupations by Sex in Berlin borough
Management, Business, Science and Arts Occupations
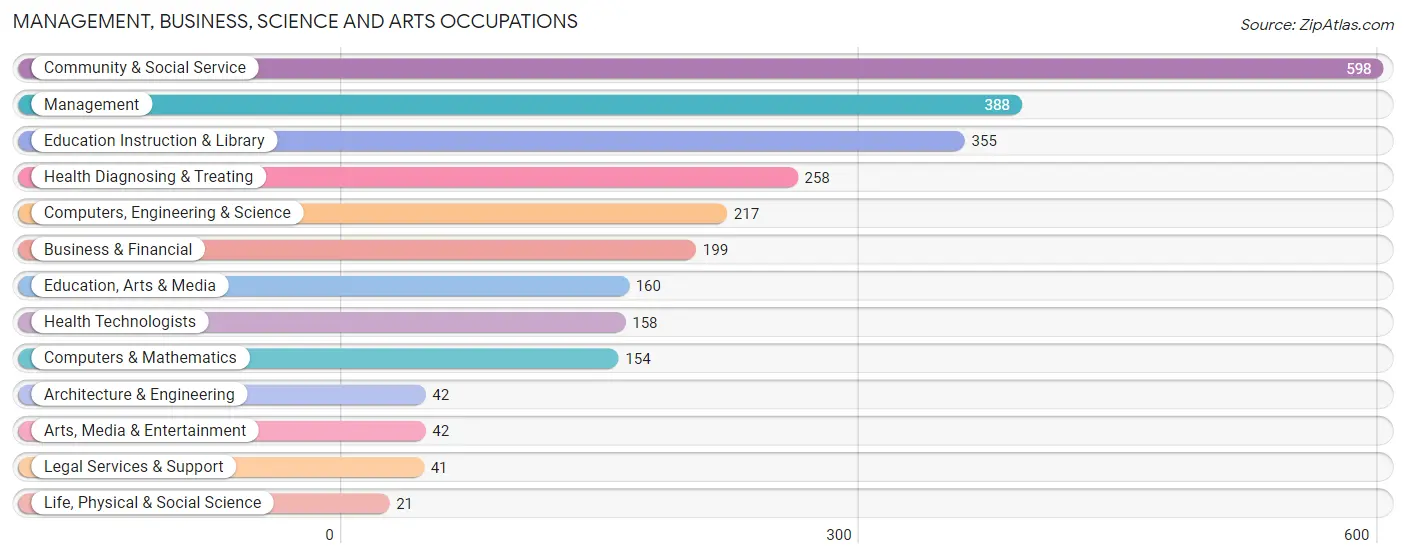
The most common Management, Business, Science and Arts occupations in Berlin borough are Community & Social Service (598 | 14.8%), Management (388 | 9.6%), Education Instruction & Library (355 | 8.8%), Health Diagnosing & Treating (258 | 6.4%), and Computers, Engineering & Science (217 | 5.4%).
Management, Business, Science and Arts Occupations by Sex
Within the Management, Business, Science and Arts occupations in Berlin borough, the most male-oriented occupations are Computers & Mathematics (100.0%), Computers, Engineering & Science (86.2%), and Business & Financial (79.9%), while the most female-oriented occupations are Education, Arts & Media (93.1%), Health Technologists (79.1%), and Community & Social Service (76.6%).
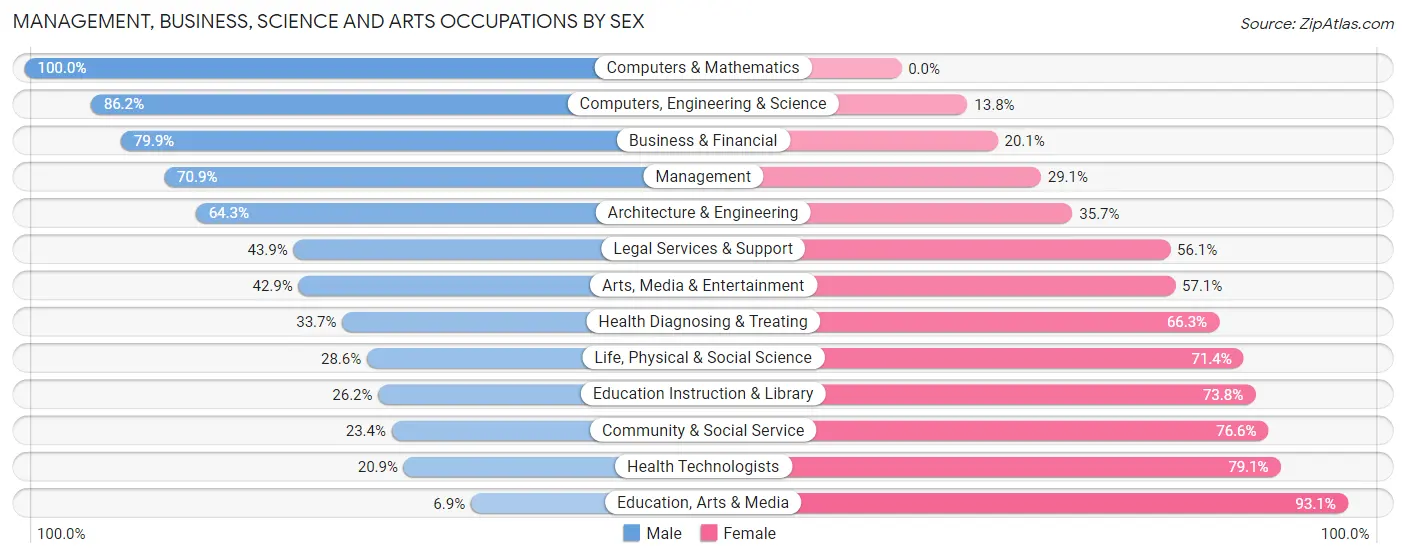
| Occupation | Male | Female |
| Management | 275 (70.9%) | 113 (29.1%) |
| Business & Financial | 159 (79.9%) | 40 (20.1%) |
| Computers, Engineering & Science | 187 (86.2%) | 30 (13.8%) |
| Computers & Mathematics | 154 (100.0%) | 0 (0.0%) |
| Architecture & Engineering | 27 (64.3%) | 15 (35.7%) |
| Life, Physical & Social Science | 6 (28.6%) | 15 (71.4%) |
| Community & Social Service | 140 (23.4%) | 458 (76.6%) |
| Education, Arts & Media | 11 (6.9%) | 149 (93.1%) |
| Legal Services & Support | 18 (43.9%) | 23 (56.1%) |
| Education Instruction & Library | 93 (26.2%) | 262 (73.8%) |
| Arts, Media & Entertainment | 18 (42.9%) | 24 (57.1%) |
| Health Diagnosing & Treating | 87 (33.7%) | 171 (66.3%) |
| Health Technologists | 33 (20.9%) | 125 (79.1%) |
| Total (Category) | 848 (51.1%) | 812 (48.9%) |
| Total (Overall) | 2,124 (52.5%) | 1,919 (47.5%) |
Services Occupations
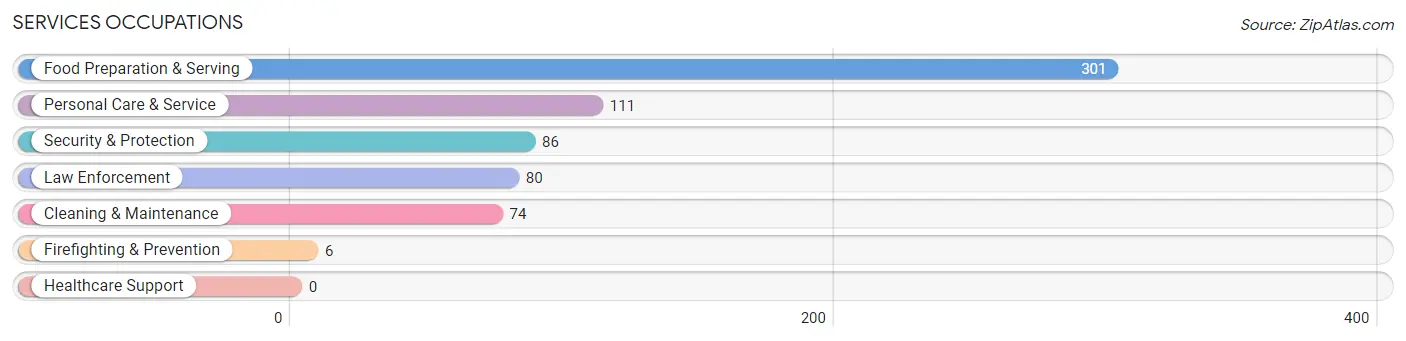
The most common Services occupations in Berlin borough are Food Preparation & Serving (301 | 7.4%), Personal Care & Service (111 | 2.8%), Security & Protection (86 | 2.1%), Law Enforcement (80 | 2.0%), and Cleaning & Maintenance (74 | 1.8%).
Services Occupations by Sex
Within the Services occupations in Berlin borough, the most male-oriented occupations are Security & Protection (100.0%), Firefighting & Prevention (100.0%), and Law Enforcement (100.0%), while the most female-oriented occupations are Personal Care & Service (82.9%), Food Preparation & Serving (70.1%), and Cleaning & Maintenance (59.5%).

| Occupation | Male | Female |
| Healthcare Support | 0 (0.0%) | 0 (0.0%) |
| Security & Protection | 86 (100.0%) | 0 (0.0%) |
| Firefighting & Prevention | 6 (100.0%) | 0 (0.0%) |
| Law Enforcement | 80 (100.0%) | 0 (0.0%) |
| Food Preparation & Serving | 90 (29.9%) | 211 (70.1%) |
| Cleaning & Maintenance | 30 (40.5%) | 44 (59.5%) |
| Personal Care & Service | 19 (17.1%) | 92 (82.9%) |
| Total (Category) | 225 (39.3%) | 347 (60.7%) |
| Total (Overall) | 2,124 (52.5%) | 1,919 (47.5%) |
Sales and Office Occupations
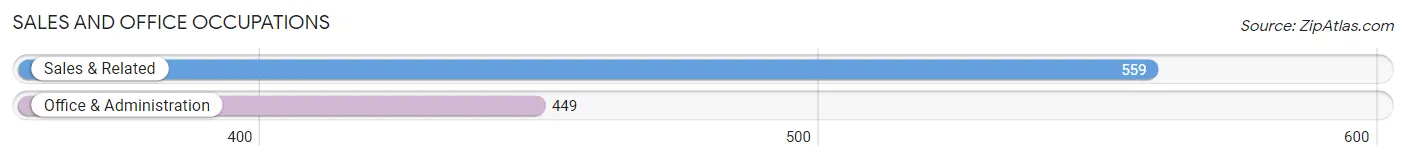
The most common Sales and Office occupations in Berlin borough are Sales & Related (559 | 13.8%), and Office & Administration (449 | 11.1%).
Sales and Office Occupations by Sex

| Occupation | Male | Female |
| Sales & Related | 257 (46.0%) | 302 (54.0%) |
| Office & Administration | 172 (38.3%) | 277 (61.7%) |
| Total (Category) | 429 (42.6%) | 579 (57.4%) |
| Total (Overall) | 2,124 (52.5%) | 1,919 (47.5%) |
Natural Resources, Construction and Maintenance Occupations
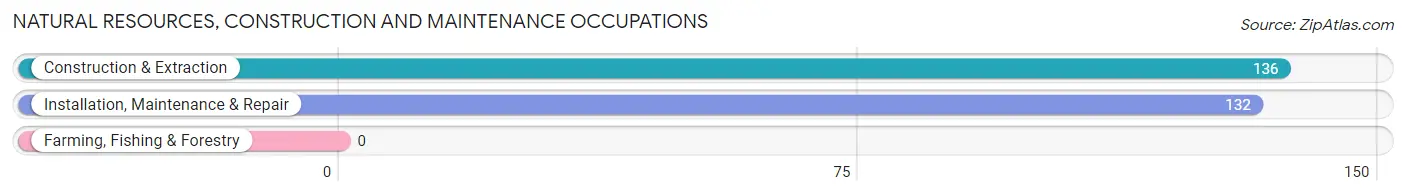
The most common Natural Resources, Construction and Maintenance occupations in Berlin borough are Construction & Extraction (136 | 3.4%), and Installation, Maintenance & Repair (132 | 3.3%).
Natural Resources, Construction and Maintenance Occupations by Sex

| Occupation | Male | Female |
| Farming, Fishing & Forestry | 0 (0.0%) | 0 (0.0%) |
| Construction & Extraction | 136 (100.0%) | 0 (0.0%) |
| Installation, Maintenance & Repair | 132 (100.0%) | 0 (0.0%) |
| Total (Category) | 268 (100.0%) | 0 (0.0%) |
| Total (Overall) | 2,124 (52.5%) | 1,919 (47.5%) |
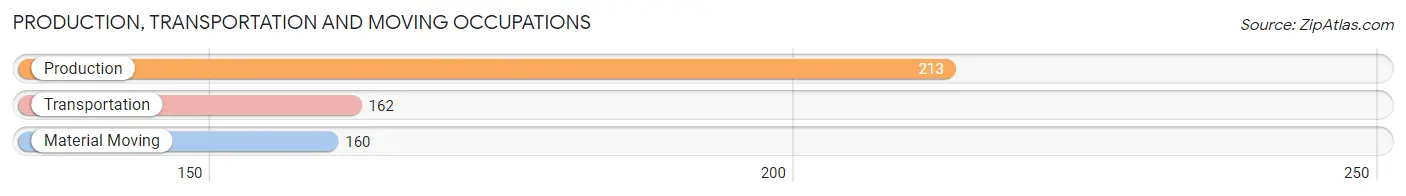
Production, Transportation and Moving Occupations
The most common Production, Transportation and Moving occupations in Berlin borough are Production (213 | 5.3%), Transportation (162 | 4.0%), and Material Moving (160 | 4.0%).
Production, Transportation and Moving Occupations by Sex
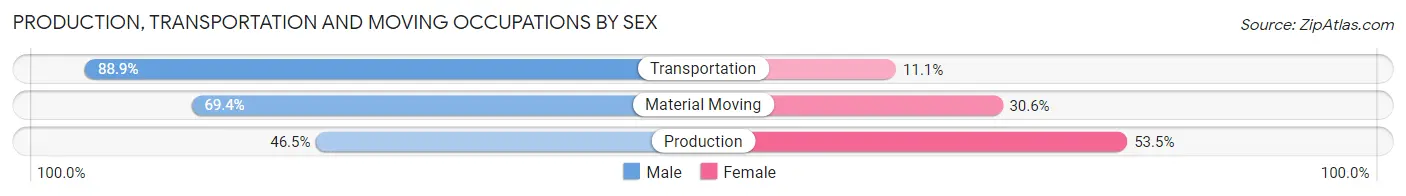
| Occupation | Male | Female |
| Production | 99 (46.5%) | 114 (53.5%) |
| Transportation | 144 (88.9%) | 18 (11.1%) |
| Material Moving | 111 (69.4%) | 49 (30.6%) |
| Total (Category) | 354 (66.2%) | 181 (33.8%) |
| Total (Overall) | 2,124 (52.5%) | 1,919 (47.5%) |
Employment Industries by Sex in Berlin borough
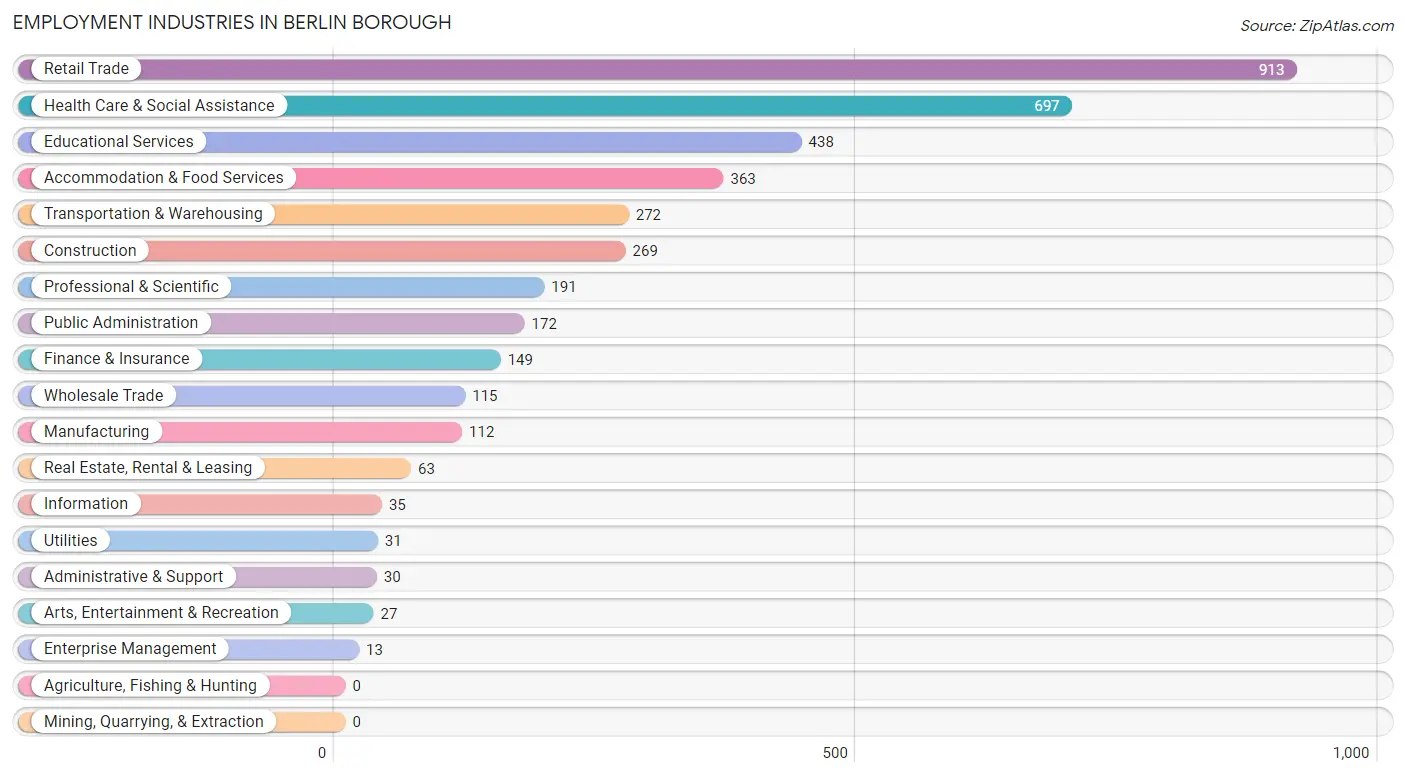
Employment Industries in Berlin borough
The major employment industries in Berlin borough include Retail Trade (913 | 22.6%), Health Care & Social Assistance (697 | 17.2%), Educational Services (438 | 10.8%), Accommodation & Food Services (363 | 9.0%), and Transportation & Warehousing (272 | 6.7%).
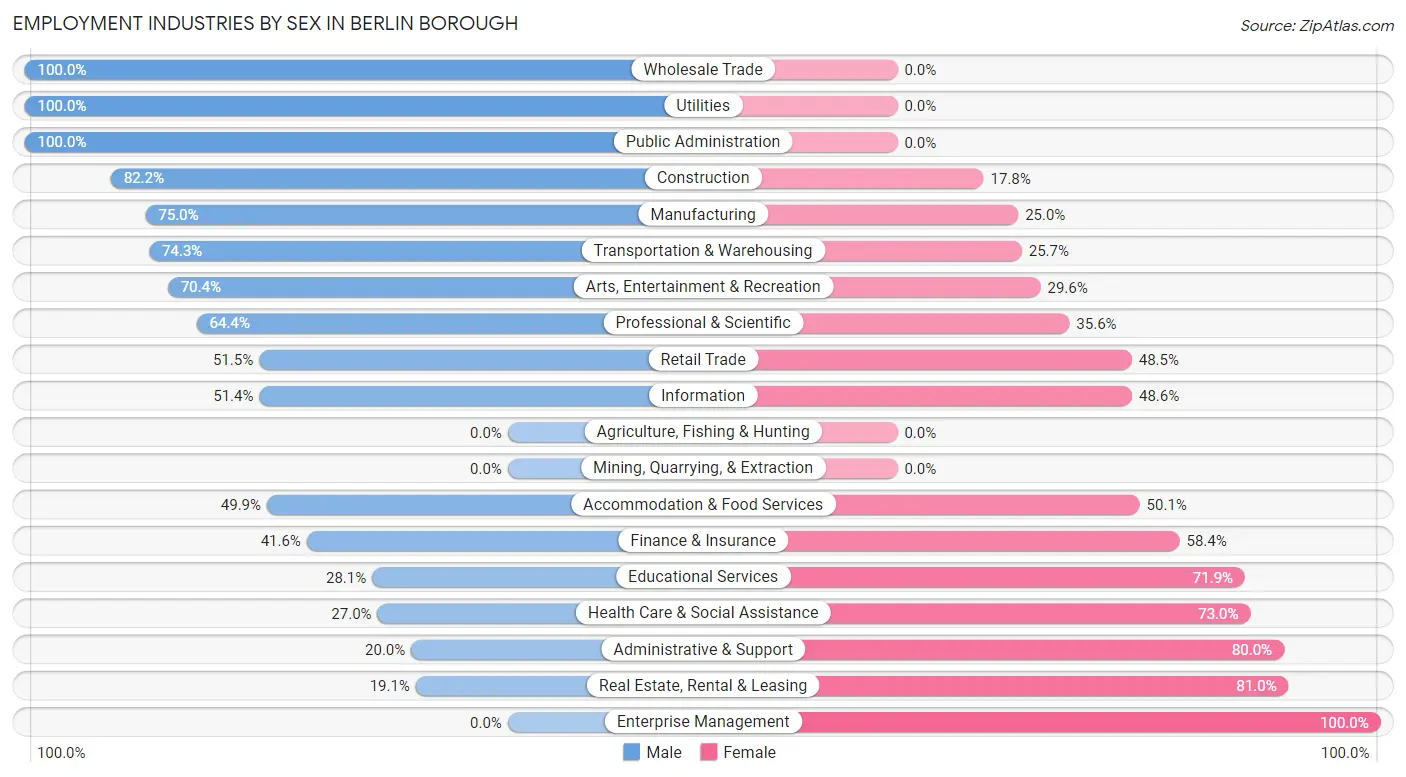
Employment Industries by Sex in Berlin borough
The Berlin borough industries that see more men than women are Wholesale Trade (100.0%), Utilities (100.0%), and Public Administration (100.0%), whereas the industries that tend to have a higher number of women are Enterprise Management (100.0%), Real Estate, Rental & Leasing (80.9%), and Administrative & Support (80.0%).
| Industry | Male | Female |
| Agriculture, Fishing & Hunting | 0 (0.0%) | 0 (0.0%) |
| Mining, Quarrying, & Extraction | 0 (0.0%) | 0 (0.0%) |
| Construction | 221 (82.2%) | 48 (17.8%) |
| Manufacturing | 84 (75.0%) | 28 (25.0%) |
| Wholesale Trade | 115 (100.0%) | 0 (0.0%) |
| Retail Trade | 470 (51.5%) | 443 (48.5%) |
| Transportation & Warehousing | 202 (74.3%) | 70 (25.7%) |
| Utilities | 31 (100.0%) | 0 (0.0%) |
| Information | 18 (51.4%) | 17 (48.6%) |
| Finance & Insurance | 62 (41.6%) | 87 (58.4%) |
| Real Estate, Rental & Leasing | 12 (19.1%) | 51 (80.9%) |
| Professional & Scientific | 123 (64.4%) | 68 (35.6%) |
| Enterprise Management | 0 (0.0%) | 13 (100.0%) |
| Administrative & Support | 6 (20.0%) | 24 (80.0%) |
| Educational Services | 123 (28.1%) | 315 (71.9%) |
| Health Care & Social Assistance | 188 (27.0%) | 509 (73.0%) |
| Arts, Entertainment & Recreation | 19 (70.4%) | 8 (29.6%) |
| Accommodation & Food Services | 181 (49.9%) | 182 (50.1%) |
| Public Administration | 172 (100.0%) | 0 (0.0%) |
| Total | 2,124 (52.5%) | 1,919 (47.5%) |
Education in Berlin borough
School Enrollment in Berlin borough
The most common levels of schooling among the 2,093 students in Berlin borough are college / undergraduate (590 | 28.2%), high school (579 | 27.7%), and middle school (450 | 21.5%).
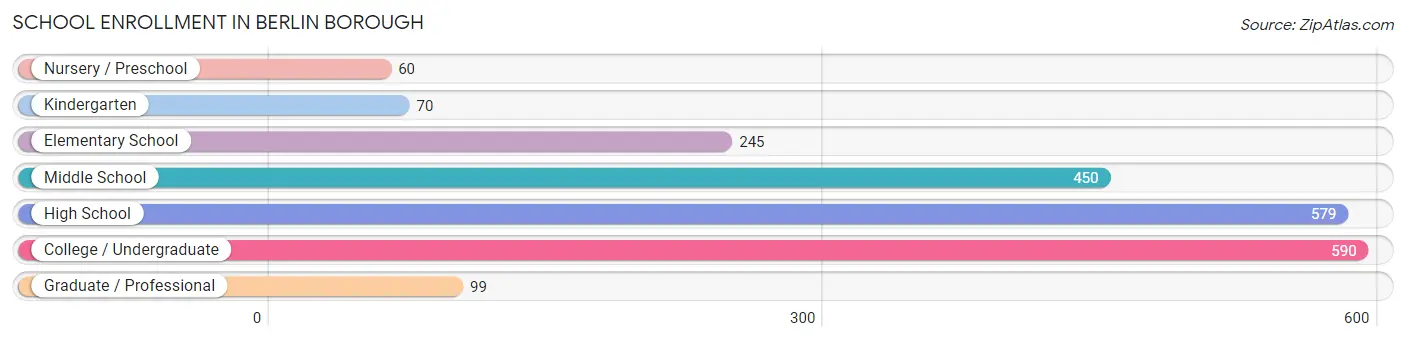
| School Level | # Students | % Students |
| Nursery / Preschool | 60 | 2.9% |
| Kindergarten | 70 | 3.3% |
| Elementary School | 245 | 11.7% |
| Middle School | 450 | 21.5% |
| High School | 579 | 27.7% |
| College / Undergraduate | 590 | 28.2% |
| Graduate / Professional | 99 | 4.7% |
| Total | 2,093 | 100.0% |
School Enrollment by Age by Funding Source in Berlin borough
Out of a total of 2,093 students who are enrolled in schools in Berlin borough, 163 (7.8%) attend a private institution, while the remaining 1,930 (92.2%) are enrolled in public schools. The age group of 35 years and over has the highest likelihood of being enrolled in private schools, with 71 (43.0% in the age bracket) enrolled. Conversely, the age group of 3 to 4 year olds has the lowest likelihood of being enrolled in a private school, with 37 (100.0% in the age bracket) attending a public institution.
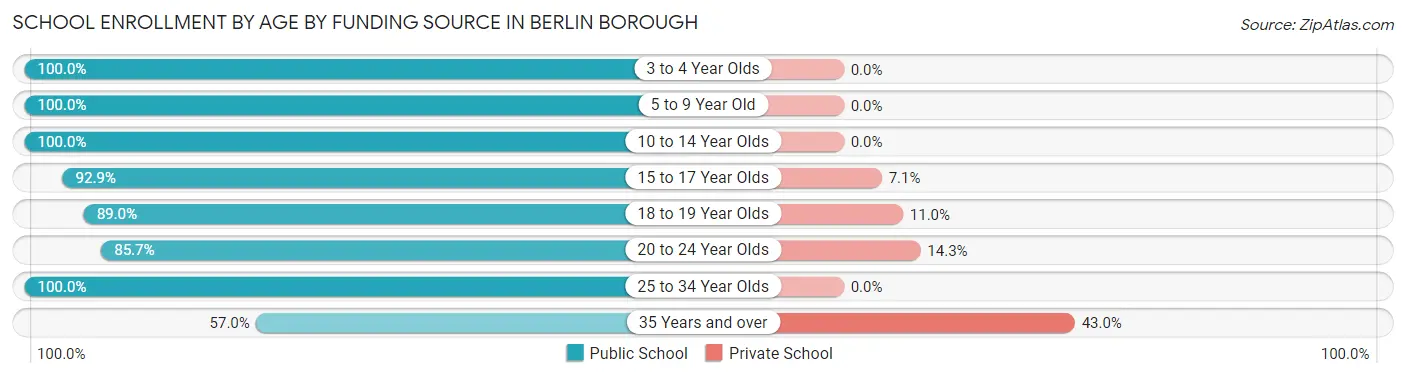
| Age Bracket | Public School | Private School |
| 3 to 4 Year Olds | 37 (100.0%) | 0 (0.0%) |
| 5 to 9 Year Old | 327 (100.0%) | 0 (0.0%) |
| 10 to 14 Year Olds | 522 (100.0%) | 0 (0.0%) |
| 15 to 17 Year Olds | 367 (92.9%) | 28 (7.1%) |
| 18 to 19 Year Olds | 226 (89.0%) | 28 (11.0%) |
| 20 to 24 Year Olds | 222 (85.7%) | 37 (14.3%) |
| 25 to 34 Year Olds | 134 (100.0%) | 0 (0.0%) |
| 35 Years and over | 94 (57.0%) | 71 (43.0%) |
| Total | 1,930 (92.2%) | 163 (7.8%) |
Educational Attainment by Field of Study in Berlin borough
Education (263 | 14.2%), science & technology (205 | 11.1%), communications (188 | 10.1%), business (182 | 9.8%), and social sciences (134 | 7.2%) are the most common fields of study among 1,856 individuals in Berlin borough who have obtained a bachelor's degree or higher.
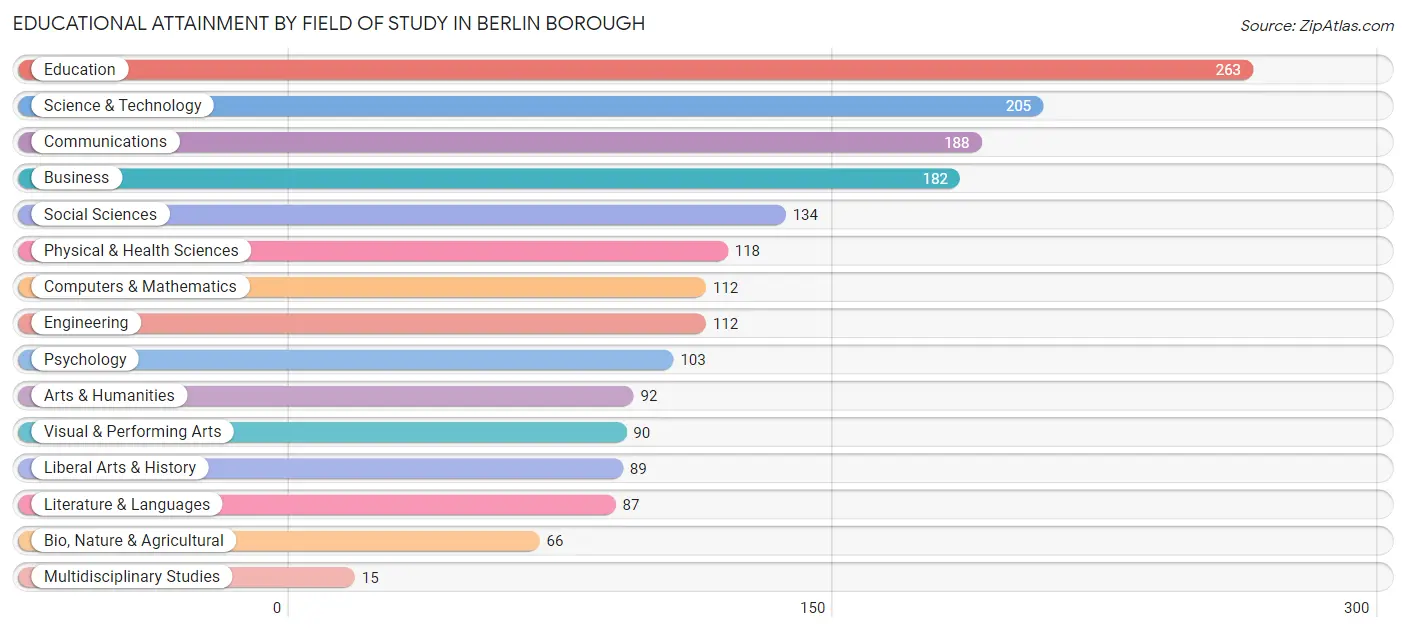
| Field of Study | # Graduates | % Graduates |
| Computers & Mathematics | 112 | 6.0% |
| Bio, Nature & Agricultural | 66 | 3.6% |
| Physical & Health Sciences | 118 | 6.4% |
| Psychology | 103 | 5.6% |
| Social Sciences | 134 | 7.2% |
| Engineering | 112 | 6.0% |
| Multidisciplinary Studies | 15 | 0.8% |
| Science & Technology | 205 | 11.1% |
| Business | 182 | 9.8% |
| Education | 263 | 14.2% |
| Literature & Languages | 87 | 4.7% |
| Liberal Arts & History | 89 | 4.8% |
| Visual & Performing Arts | 90 | 4.9% |
| Communications | 188 | 10.1% |
| Arts & Humanities | 92 | 5.0% |
| Total | 1,856 | 100.0% |
Transportation & Commute in Berlin borough
Vehicle Availability by Sex in Berlin borough
The most prevalent vehicle ownership categories in Berlin borough are males with 2 vehicles (833, accounting for 41.9%) and females with 2 vehicles (604, making up 44.0%).
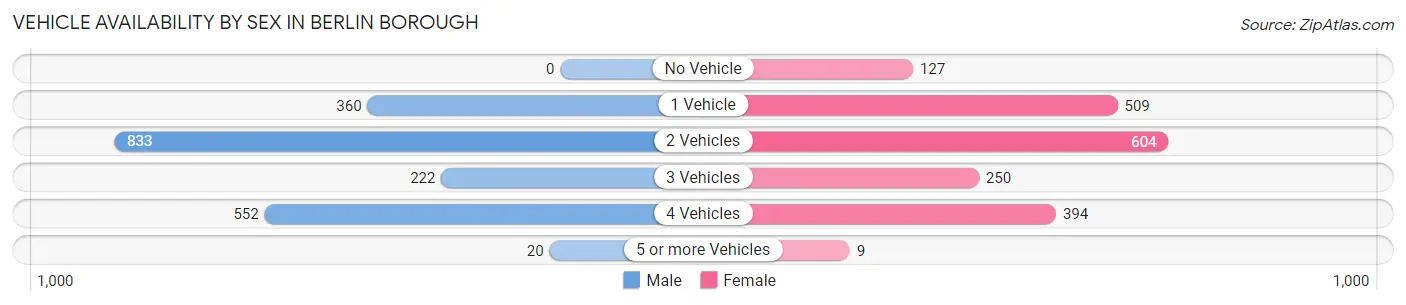
| Vehicles Available | Male | Female |
| No Vehicle | 0 (0.0%) | 127 (6.7%) |
| 1 Vehicle | 360 (18.1%) | 509 (26.9%) |
| 2 Vehicles | 833 (41.9%) | 604 (31.9%) |
| 3 Vehicles | 222 (11.2%) | 250 (13.2%) |
| 4 Vehicles | 552 (27.8%) | 394 (20.8%) |
| 5 or more Vehicles | 20 (1.0%) | 9 (0.5%) |
| Total | 1,987 (100.0%) | 1,893 (100.0%) |
Commute Time in Berlin borough
The most frequently occuring commute durations in Berlin borough are 60 to 89 minutes (620 commuters, 17.1%), 20 to 24 minutes (454 commuters, 12.5%), and 5 to 9 minutes (408 commuters, 11.2%).
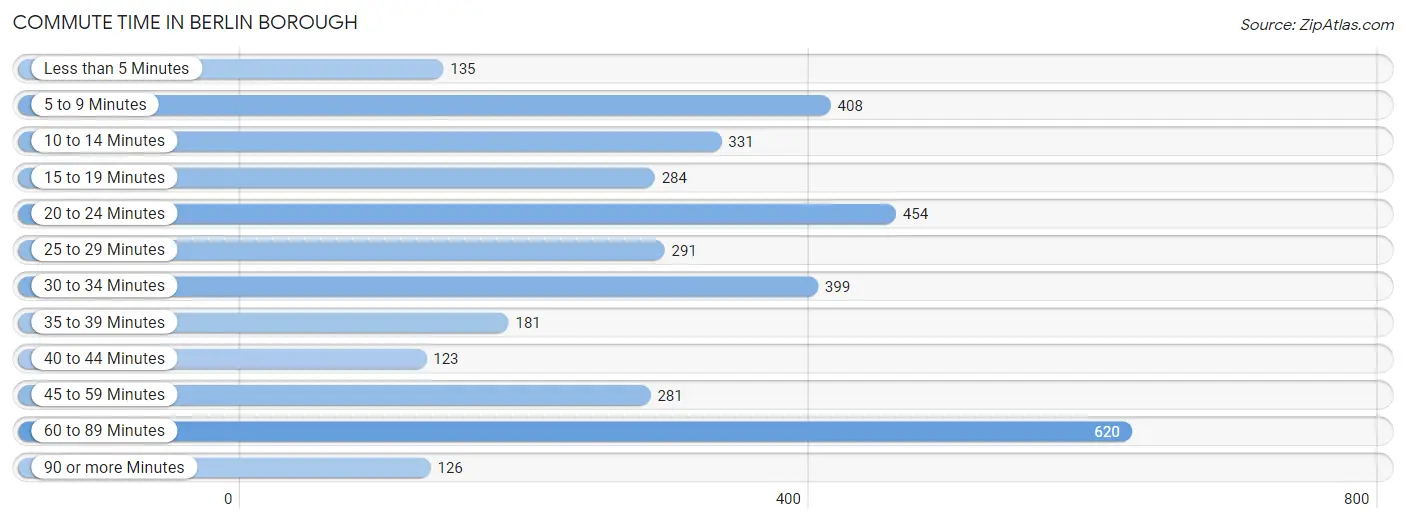
| Commute Time | # Commuters | % Commuters |
| Less than 5 Minutes | 135 | 3.7% |
| 5 to 9 Minutes | 408 | 11.2% |
| 10 to 14 Minutes | 331 | 9.1% |
| 15 to 19 Minutes | 284 | 7.8% |
| 20 to 24 Minutes | 454 | 12.5% |
| 25 to 29 Minutes | 291 | 8.0% |
| 30 to 34 Minutes | 399 | 11.0% |
| 35 to 39 Minutes | 181 | 5.0% |
| 40 to 44 Minutes | 123 | 3.4% |
| 45 to 59 Minutes | 281 | 7.7% |
| 60 to 89 Minutes | 620 | 17.1% |
| 90 or more Minutes | 126 | 3.5% |
Commute Time by Sex in Berlin borough
The most common commute times in Berlin borough are 60 to 89 minutes (325 commuters, 17.2%) for males and 20 to 24 minutes (345 commuters, 19.8%) for females.
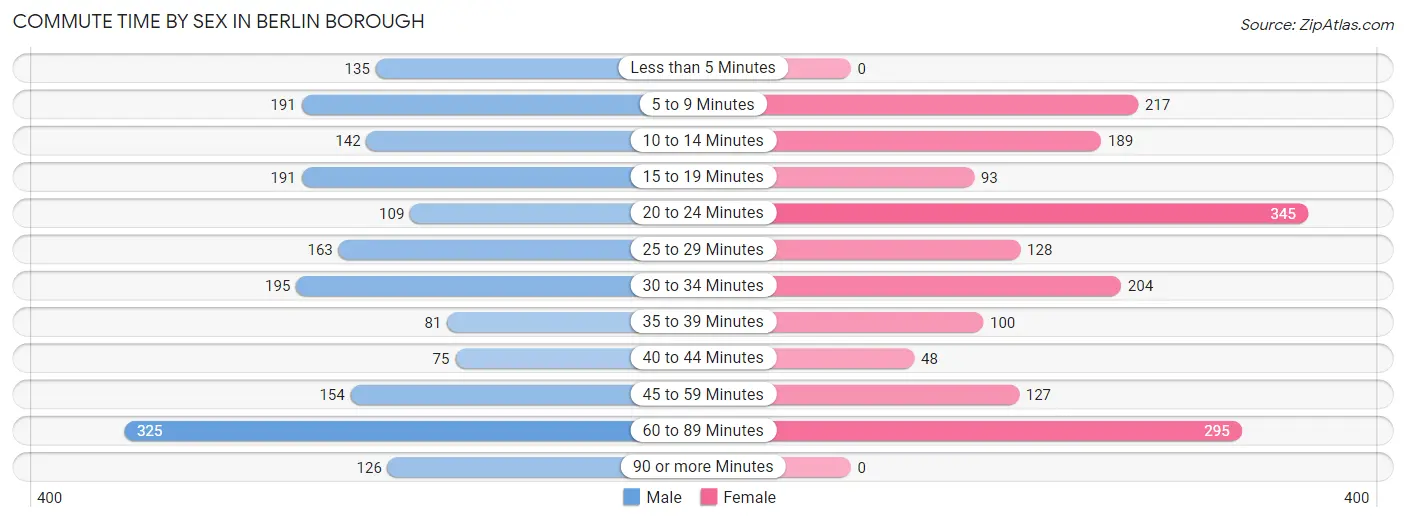
| Commute Time | Male | Female |
| Less than 5 Minutes | 135 (7.1%) | 0 (0.0%) |
| 5 to 9 Minutes | 191 (10.1%) | 217 (12.4%) |
| 10 to 14 Minutes | 142 (7.5%) | 189 (10.8%) |
| 15 to 19 Minutes | 191 (10.1%) | 93 (5.3%) |
| 20 to 24 Minutes | 109 (5.8%) | 345 (19.8%) |
| 25 to 29 Minutes | 163 (8.6%) | 128 (7.3%) |
| 30 to 34 Minutes | 195 (10.3%) | 204 (11.7%) |
| 35 to 39 Minutes | 81 (4.3%) | 100 (5.7%) |
| 40 to 44 Minutes | 75 (4.0%) | 48 (2.8%) |
| 45 to 59 Minutes | 154 (8.2%) | 127 (7.3%) |
| 60 to 89 Minutes | 325 (17.2%) | 295 (16.9%) |
| 90 or more Minutes | 126 (6.7%) | 0 (0.0%) |
Time of Departure to Work by Sex in Berlin borough
The most frequent times of departure to work in Berlin borough are 6:00 AM to 6:29 AM (335, 17.7%) for males and 7:00 AM to 7:29 AM (337, 19.3%) for females.
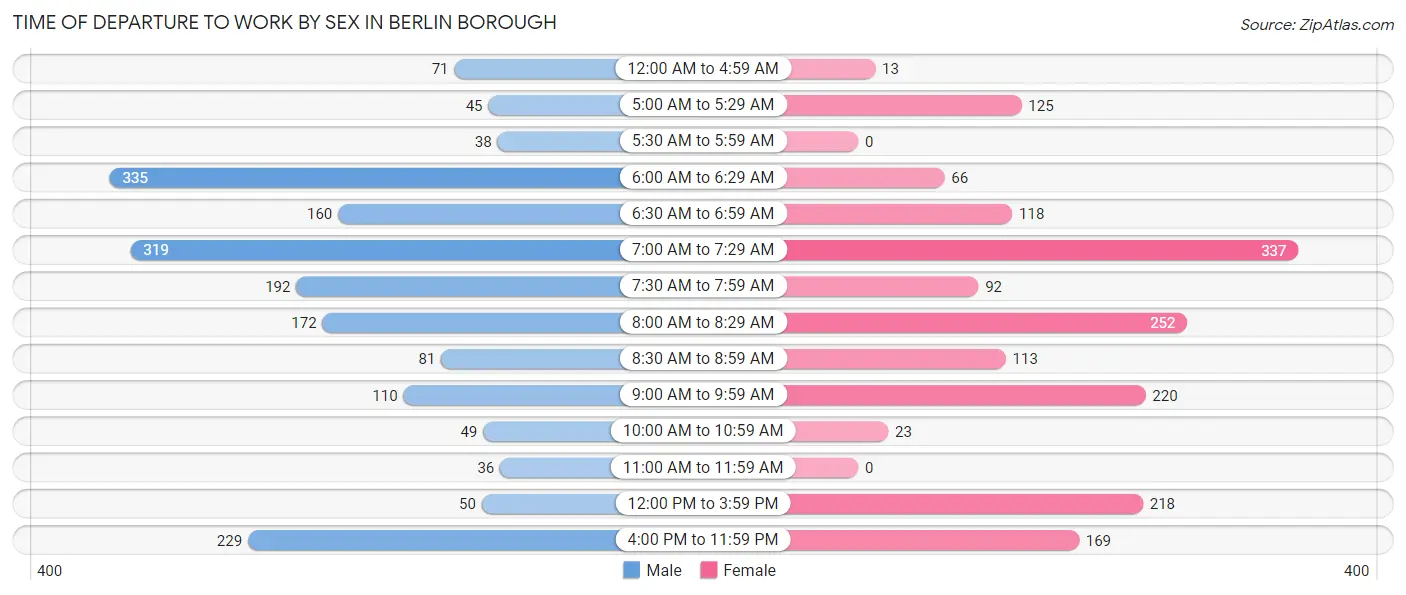
| Time of Departure | Male | Female |
| 12:00 AM to 4:59 AM | 71 (3.8%) | 13 (0.7%) |
| 5:00 AM to 5:29 AM | 45 (2.4%) | 125 (7.2%) |
| 5:30 AM to 5:59 AM | 38 (2.0%) | 0 (0.0%) |
| 6:00 AM to 6:29 AM | 335 (17.7%) | 66 (3.8%) |
| 6:30 AM to 6:59 AM | 160 (8.5%) | 118 (6.8%) |
| 7:00 AM to 7:29 AM | 319 (16.9%) | 337 (19.3%) |
| 7:30 AM to 7:59 AM | 192 (10.2%) | 92 (5.3%) |
| 8:00 AM to 8:29 AM | 172 (9.1%) | 252 (14.4%) |
| 8:30 AM to 8:59 AM | 81 (4.3%) | 113 (6.5%) |
| 9:00 AM to 9:59 AM | 110 (5.8%) | 220 (12.6%) |
| 10:00 AM to 10:59 AM | 49 (2.6%) | 23 (1.3%) |
| 11:00 AM to 11:59 AM | 36 (1.9%) | 0 (0.0%) |
| 12:00 PM to 3:59 PM | 50 (2.6%) | 218 (12.5%) |
| 4:00 PM to 11:59 PM | 229 (12.1%) | 169 (9.7%) |
| Total | 1,887 (100.0%) | 1,746 (100.0%) |
Housing Occupancy in Berlin borough
Occupancy by Ownership in Berlin borough
Of the total 2,835 dwellings in Berlin borough, owner-occupied units account for 2,247 (79.3%), while renter-occupied units make up 588 (20.7%).
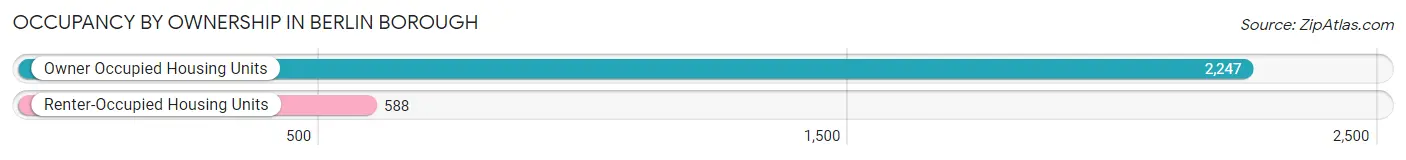
| Occupancy | # Housing Units | % Housing Units |
| Owner Occupied Housing Units | 2,247 | 79.3% |
| Renter-Occupied Housing Units | 588 | 20.7% |
| Total Occupied Housing Units | 2,835 | 100.0% |
Occupancy by Household Size in Berlin borough
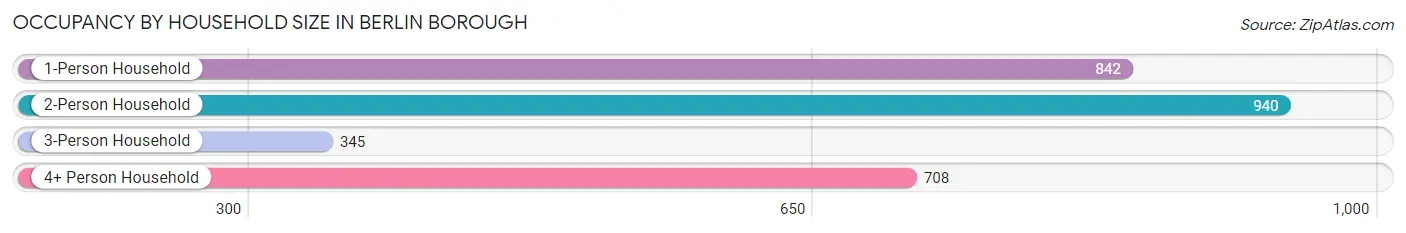
| Household Size | # Housing Units | % Housing Units |
| 1-Person Household | 842 | 29.7% |
| 2-Person Household | 940 | 33.2% |
| 3-Person Household | 345 | 12.2% |
| 4+ Person Household | 708 | 25.0% |
| Total Housing Units | 2,835 | 100.0% |
Occupancy by Ownership by Household Size in Berlin borough
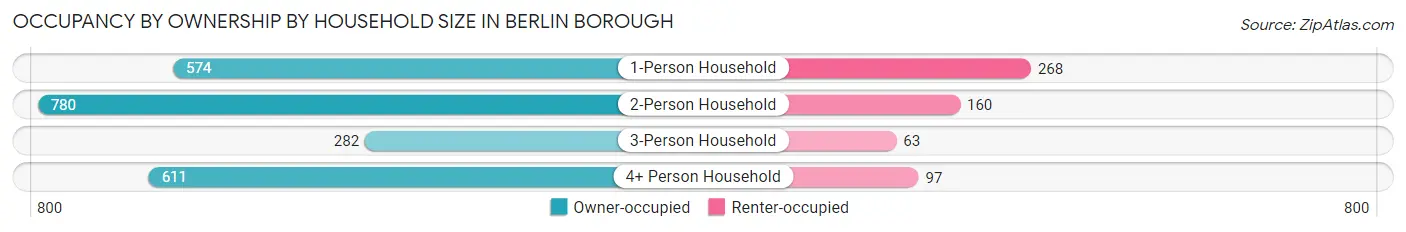
| Household Size | Owner-occupied | Renter-occupied |
| 1-Person Household | 574 (68.2%) | 268 (31.8%) |
| 2-Person Household | 780 (83.0%) | 160 (17.0%) |
| 3-Person Household | 282 (81.7%) | 63 (18.3%) |
| 4+ Person Household | 611 (86.3%) | 97 (13.7%) |
| Total Housing Units | 2,247 (79.3%) | 588 (20.7%) |
Occupancy by Educational Attainment in Berlin borough
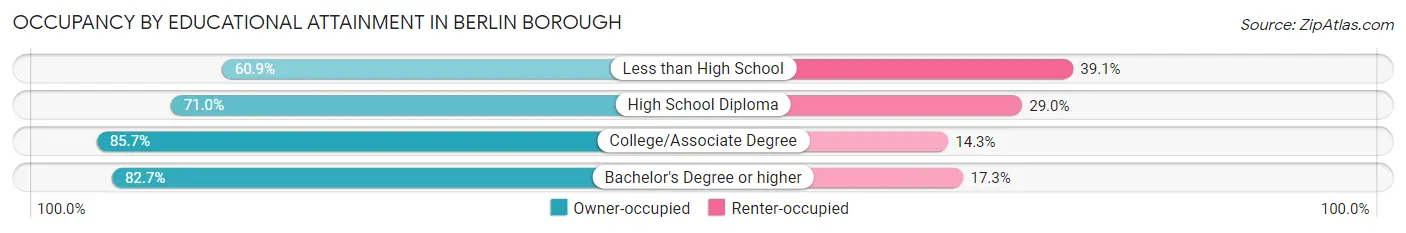
| Household Size | Owner-occupied | Renter-occupied |
| Less than High School | 137 (60.9%) | 88 (39.1%) |
| High School Diploma | 473 (71.0%) | 193 (29.0%) |
| College/Associate Degree | 850 (85.7%) | 142 (14.3%) |
| Bachelor's Degree or higher | 787 (82.7%) | 165 (17.3%) |
Occupancy by Age of Householder in Berlin borough
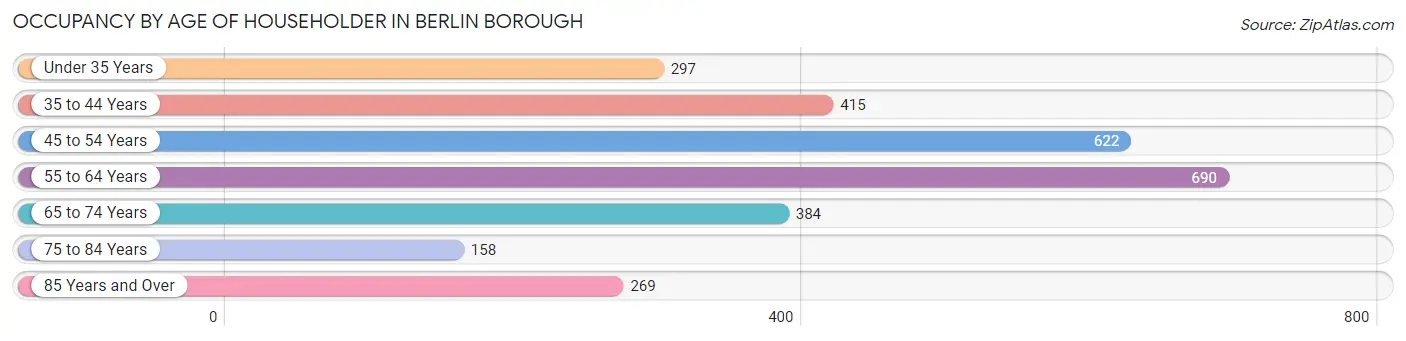
| Age Bracket | # Households | % Households |
| Under 35 Years | 297 | 10.5% |
| 35 to 44 Years | 415 | 14.6% |
| 45 to 54 Years | 622 | 21.9% |
| 55 to 64 Years | 690 | 24.3% |
| 65 to 74 Years | 384 | 13.5% |
| 75 to 84 Years | 158 | 5.6% |
| 85 Years and Over | 269 | 9.5% |
| Total | 2,835 | 100.0% |
Housing Finances in Berlin borough
Median Income by Occupancy in Berlin borough
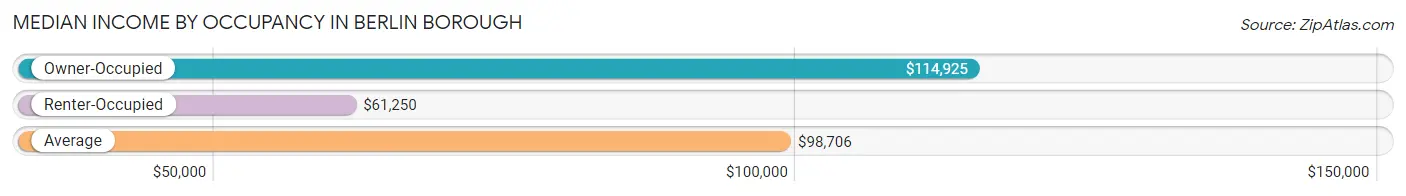
| Occupancy Type | # Households | Median Income |
| Owner-Occupied | 2,247 (79.3%) | $114,925 |
| Renter-Occupied | 588 (20.7%) | $61,250 |
| Average | 2,835 (100.0%) | $98,706 |
Occupancy by Householder Income Bracket in Berlin borough
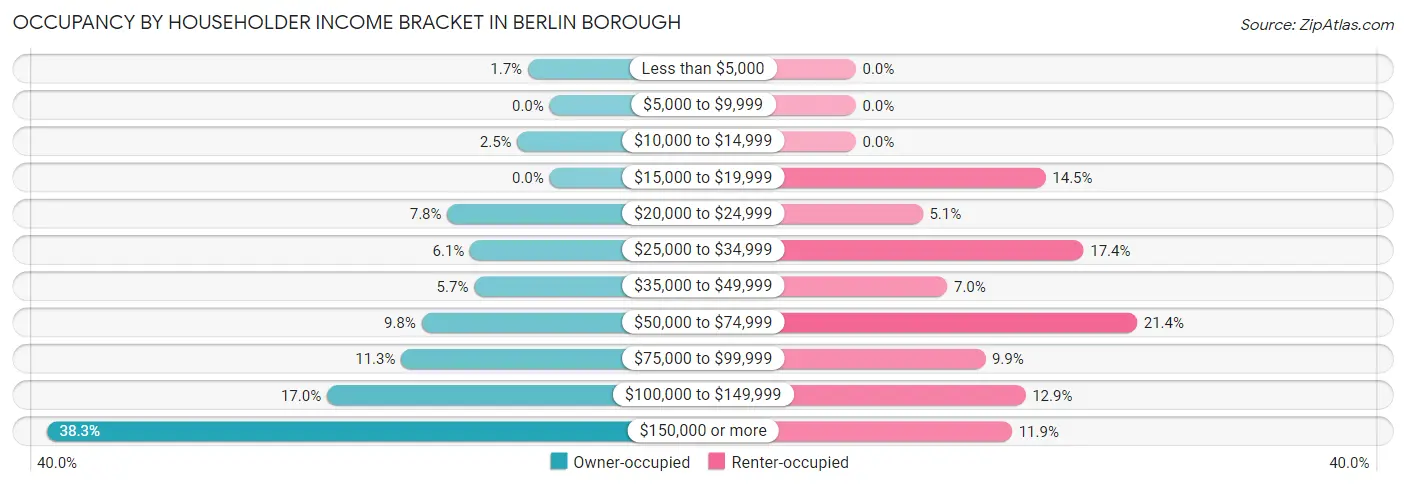
| Income Bracket | Owner-occupied | Renter-occupied |
| Less than $5,000 | 37 (1.7%) | 0 (0.0%) |
| $5,000 to $9,999 | 0 (0.0%) | 0 (0.0%) |
| $10,000 to $14,999 | 55 (2.5%) | 0 (0.0%) |
| $15,000 to $19,999 | 0 (0.0%) | 85 (14.5%) |
| $20,000 to $24,999 | 175 (7.8%) | 30 (5.1%) |
| $25,000 to $34,999 | 136 (6.0%) | 102 (17.3%) |
| $35,000 to $49,999 | 129 (5.7%) | 41 (7.0%) |
| $50,000 to $74,999 | 219 (9.8%) | 126 (21.4%) |
| $75,000 to $99,999 | 254 (11.3%) | 58 (9.9%) |
| $100,000 to $149,999 | 381 (17.0%) | 76 (12.9%) |
| $150,000 or more | 861 (38.3%) | 70 (11.9%) |
| Total | 2,247 (100.0%) | 588 (100.0%) |
Monthly Housing Cost Tiers in Berlin borough
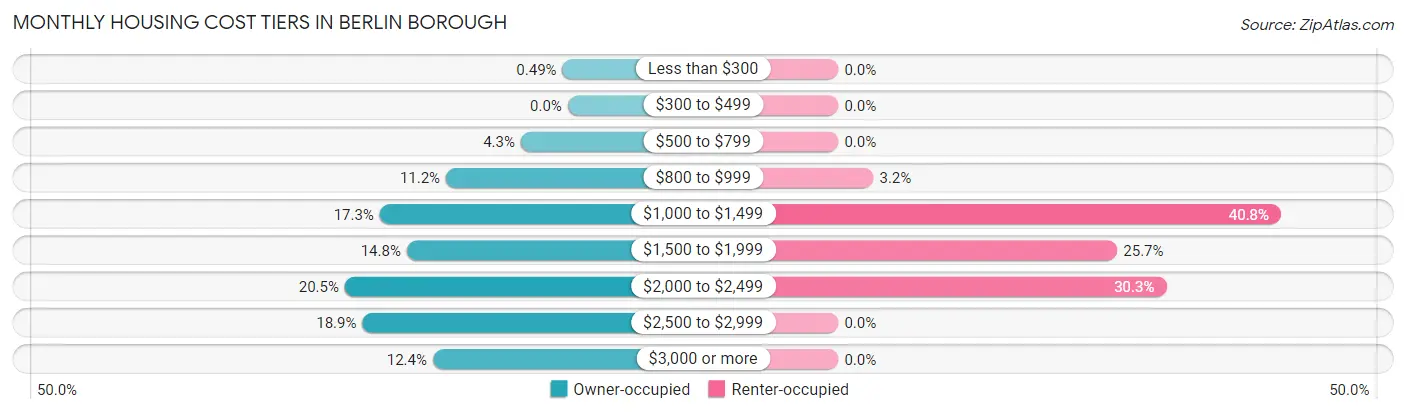
| Monthly Cost | Owner-occupied | Renter-occupied |
| Less than $300 | 11 (0.5%) | 0 (0.0%) |
| $300 to $499 | 0 (0.0%) | 0 (0.0%) |
| $500 to $799 | 97 (4.3%) | 0 (0.0%) |
| $800 to $999 | 252 (11.2%) | 19 (3.2%) |
| $1,000 to $1,499 | 389 (17.3%) | 240 (40.8%) |
| $1,500 to $1,999 | 333 (14.8%) | 151 (25.7%) |
| $2,000 to $2,499 | 461 (20.5%) | 178 (30.3%) |
| $2,500 to $2,999 | 425 (18.9%) | 0 (0.0%) |
| $3,000 or more | 279 (12.4%) | 0 (0.0%) |
| Total | 2,247 (100.0%) | 588 (100.0%) |
Physical Housing Characteristics in Berlin borough
Housing Structures in Berlin borough
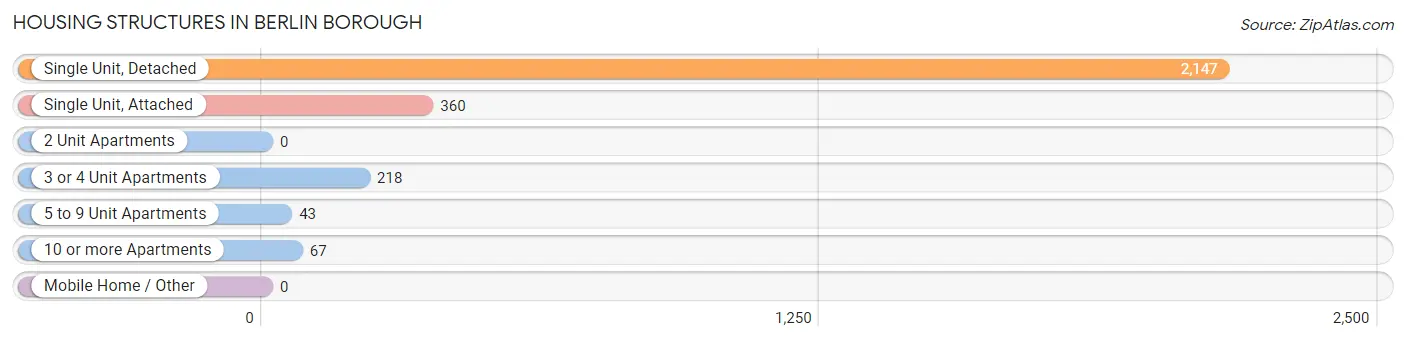
| Structure Type | # Housing Units | % Housing Units |
| Single Unit, Detached | 2,147 | 75.7% |
| Single Unit, Attached | 360 | 12.7% |
| 2 Unit Apartments | 0 | 0.0% |
| 3 or 4 Unit Apartments | 218 | 7.7% |
| 5 to 9 Unit Apartments | 43 | 1.5% |
| 10 or more Apartments | 67 | 2.4% |
| Mobile Home / Other | 0 | 0.0% |
| Total | 2,835 | 100.0% |
Housing Structures by Occupancy in Berlin borough
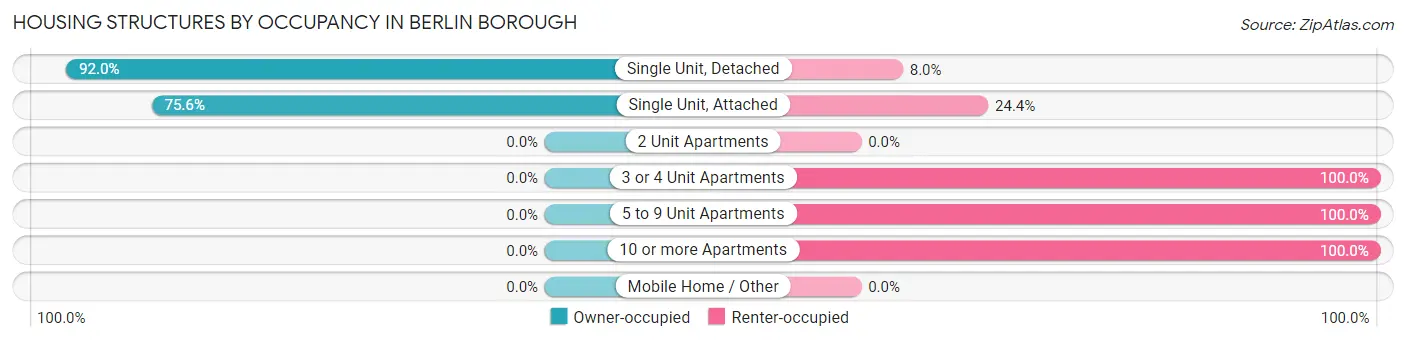
| Structure Type | Owner-occupied | Renter-occupied |
| Single Unit, Detached | 1,975 (92.0%) | 172 (8.0%) |
| Single Unit, Attached | 272 (75.6%) | 88 (24.4%) |
| 2 Unit Apartments | 0 (0.0%) | 0 (0.0%) |
| 3 or 4 Unit Apartments | 0 (0.0%) | 218 (100.0%) |
| 5 to 9 Unit Apartments | 0 (0.0%) | 43 (100.0%) |
| 10 or more Apartments | 0 (0.0%) | 67 (100.0%) |
| Mobile Home / Other | 0 (0.0%) | 0 (0.0%) |
| Total | 2,247 (79.3%) | 588 (20.7%) |
Housing Structures by Number of Rooms in Berlin borough
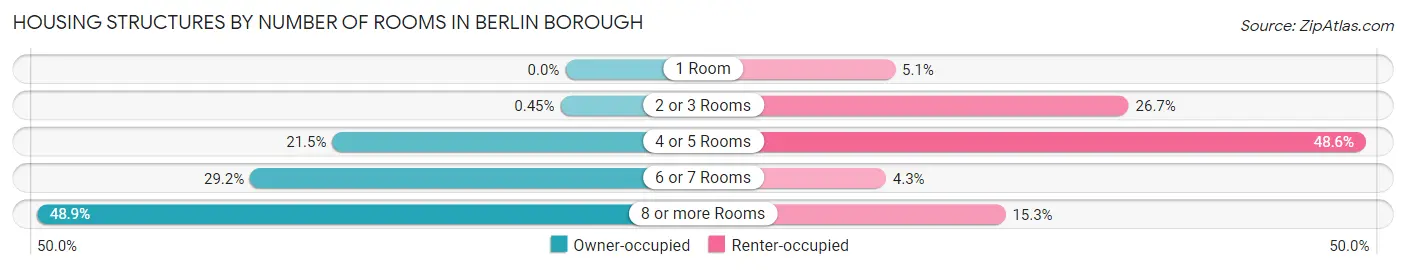
| Number of Rooms | Owner-occupied | Renter-occupied |
| 1 Room | 0 (0.0%) | 30 (5.1%) |
| 2 or 3 Rooms | 10 (0.4%) | 157 (26.7%) |
| 4 or 5 Rooms | 484 (21.5%) | 286 (48.6%) |
| 6 or 7 Rooms | 655 (29.1%) | 25 (4.3%) |
| 8 or more Rooms | 1,098 (48.9%) | 90 (15.3%) |
| Total | 2,247 (100.0%) | 588 (100.0%) |
Housing Structure by Heating Type in Berlin borough
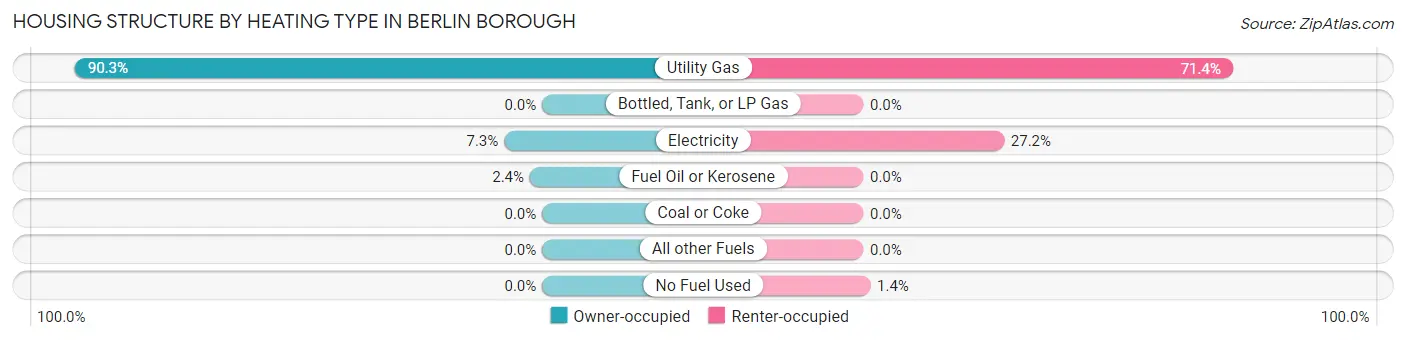
| Heating Type | Owner-occupied | Renter-occupied |
| Utility Gas | 2,029 (90.3%) | 420 (71.4%) |
| Bottled, Tank, or LP Gas | 0 (0.0%) | 0 (0.0%) |
| Electricity | 165 (7.3%) | 160 (27.2%) |
| Fuel Oil or Kerosene | 53 (2.4%) | 0 (0.0%) |
| Coal or Coke | 0 (0.0%) | 0 (0.0%) |
| All other Fuels | 0 (0.0%) | 0 (0.0%) |
| No Fuel Used | 0 (0.0%) | 8 (1.4%) |
| Total | 2,247 (100.0%) | 588 (100.0%) |
Household Vehicle Usage in Berlin borough
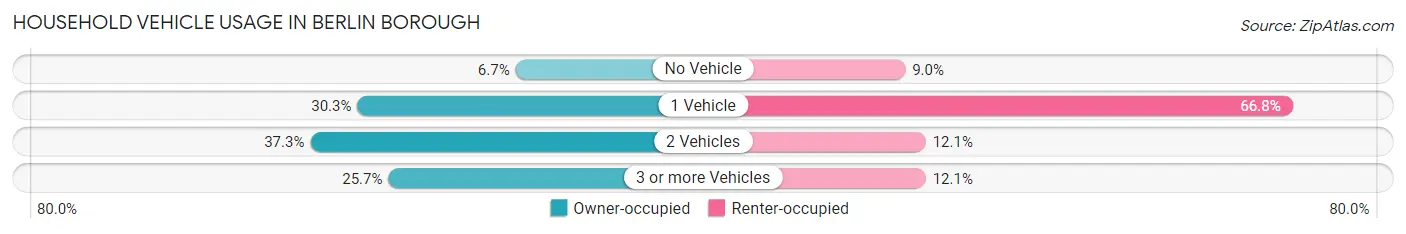
| Vehicles per Household | Owner-occupied | Renter-occupied |
| No Vehicle | 150 (6.7%) | 53 (9.0%) |
| 1 Vehicle | 681 (30.3%) | 393 (66.8%) |
| 2 Vehicles | 839 (37.3%) | 71 (12.1%) |
| 3 or more Vehicles | 577 (25.7%) | 71 (12.1%) |
| Total | 2,247 (100.0%) | 588 (100.0%) |
Real Estate & Mortgages in Berlin borough
Real Estate and Mortgage Overview in Berlin borough
| Characteristic | Without Mortgage | With Mortgage |
| Housing Units | 876 | 1,371 |
| Median Property Value | $306,300 | $279,000 |
| Median Household Income | $71,029 | $708 |
| Monthly Housing Costs | $1,131 | $279 |
| Real Estate Taxes | $8,806 | $0 |
Property Value by Mortgage Status in Berlin borough
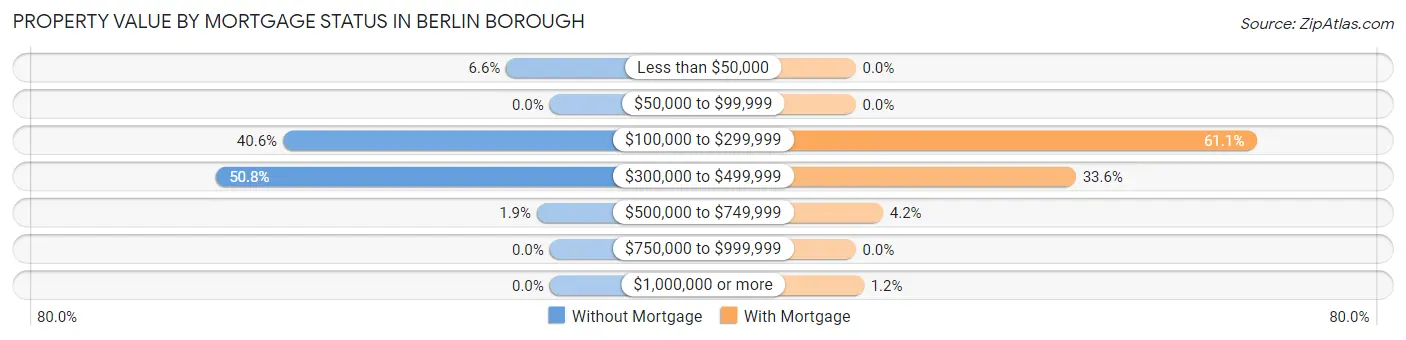
| Property Value | Without Mortgage | With Mortgage |
| Less than $50,000 | 58 (6.6%) | 0 (0.0%) |
| $50,000 to $99,999 | 0 (0.0%) | 0 (0.0%) |
| $100,000 to $299,999 | 356 (40.6%) | 837 (61.1%) |
| $300,000 to $499,999 | 445 (50.8%) | 460 (33.6%) |
| $500,000 to $749,999 | 17 (1.9%) | 57 (4.2%) |
| $750,000 to $999,999 | 0 (0.0%) | 0 (0.0%) |
| $1,000,000 or more | 0 (0.0%) | 17 (1.2%) |
| Total | 876 (100.0%) | 1,371 (100.0%) |
Household Income by Mortgage Status in Berlin borough
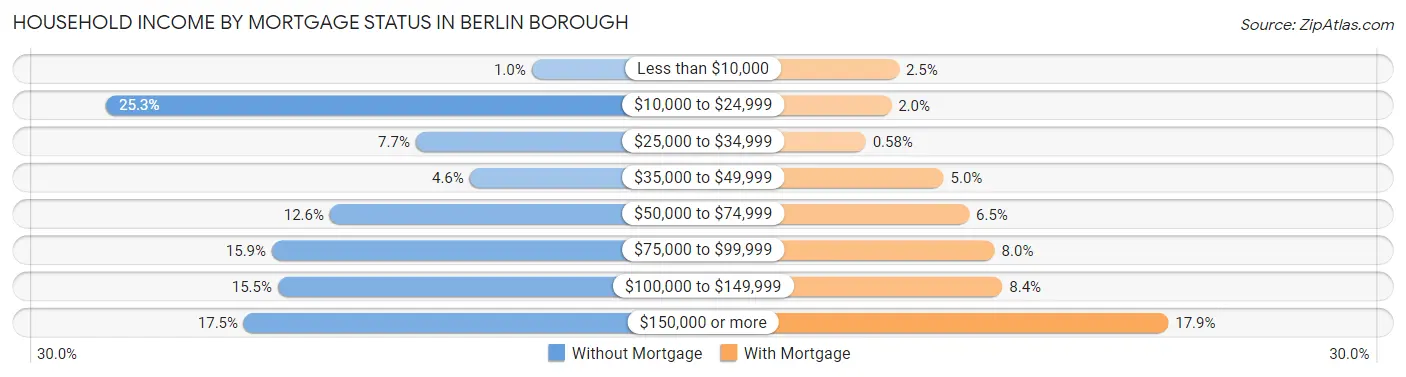
| Household Income | Without Mortgage | With Mortgage |
| Less than $10,000 | 9 (1.0%) | 34 (2.5%) |
| $10,000 to $24,999 | 222 (25.3%) | 28 (2.0%) |
| $25,000 to $34,999 | 67 (7.6%) | 8 (0.6%) |
| $35,000 to $49,999 | 40 (4.6%) | 69 (5.0%) |
| $50,000 to $74,999 | 110 (12.6%) | 89 (6.5%) |
| $75,000 to $99,999 | 139 (15.9%) | 109 (8.0%) |
| $100,000 to $149,999 | 136 (15.5%) | 115 (8.4%) |
| $150,000 or more | 153 (17.5%) | 245 (17.9%) |
| Total | 876 (100.0%) | 1,371 (100.0%) |
Property Value to Household Income Ratio in Berlin borough
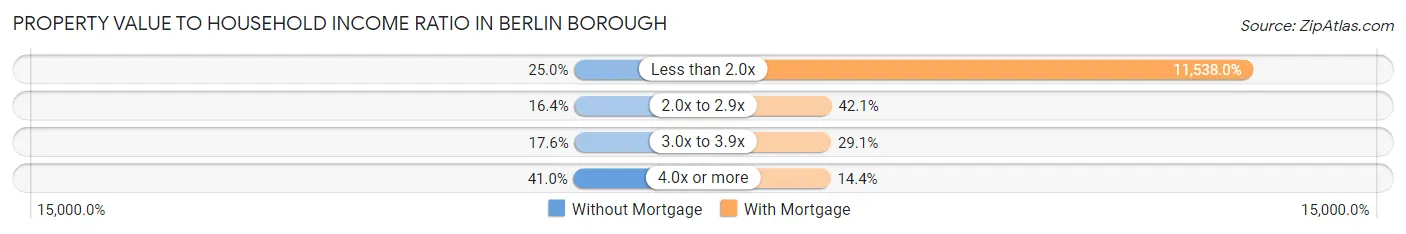
| Value-to-Income Ratio | Without Mortgage | With Mortgage |
| Less than 2.0x | 219 (25.0%) | 158,186 (11,538.0%) |
| 2.0x to 2.9x | 144 (16.4%) | 577 (42.1%) |
| 3.0x to 3.9x | 154 (17.6%) | 399 (29.1%) |
| 4.0x or more | 359 (41.0%) | 197 (14.4%) |
| Total | 876 (100.0%) | 1,371 (100.0%) |
Real Estate Taxes by Mortgage Status in Berlin borough
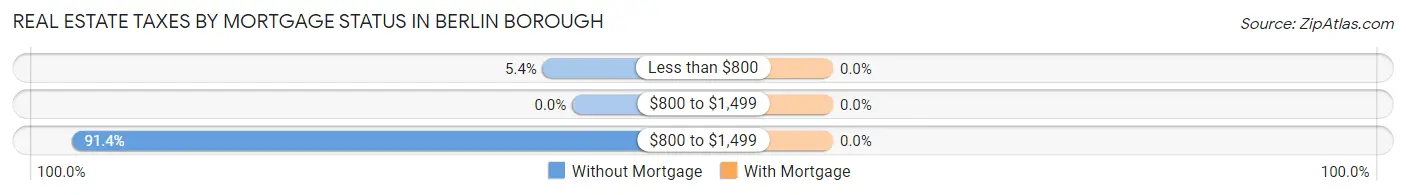
| Property Taxes | Without Mortgage | With Mortgage |
| Less than $800 | 47 (5.4%) | 0 (0.0%) |
| $800 to $1,499 | 0 (0.0%) | 0 (0.0%) |
| $800 to $1,499 | 801 (91.4%) | 0 (0.0%) |
| Total | 876 (100.0%) | 1,371 (100.0%) |
Health & Disability in Berlin borough
Health Insurance Coverage by Age in Berlin borough
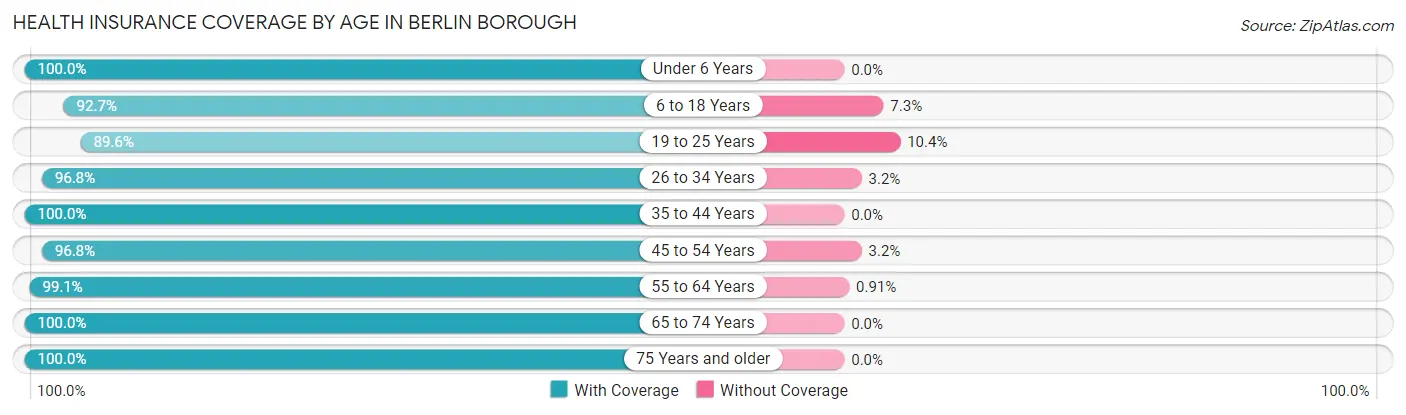
| Age Bracket | With Coverage | Without Coverage |
| Under 6 Years | 267 (100.0%) | 0 (0.0%) |
| 6 to 18 Years | 1,463 (92.7%) | 115 (7.3%) |
| 19 to 25 Years | 567 (89.6%) | 66 (10.4%) |
| 26 to 34 Years | 808 (96.8%) | 27 (3.2%) |
| 35 to 44 Years | 646 (100.0%) | 0 (0.0%) |
| 45 to 54 Years | 1,323 (96.8%) | 44 (3.2%) |
| 55 to 64 Years | 983 (99.1%) | 9 (0.9%) |
| 65 to 74 Years | 589 (100.0%) | 0 (0.0%) |
| 75 Years and older | 505 (100.0%) | 0 (0.0%) |
| Total | 7,151 (96.5%) | 261 (3.5%) |
Health Insurance Coverage by Citizenship Status in Berlin borough
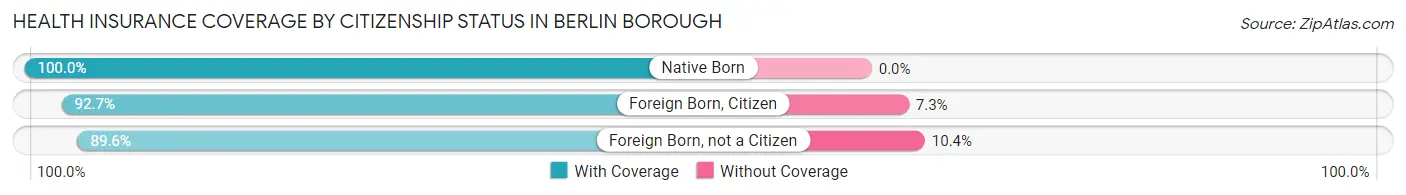
| Citizenship Status | With Coverage | Without Coverage |
| Native Born | 267 (100.0%) | 0 (0.0%) |
| Foreign Born, Citizen | 1,463 (92.7%) | 115 (7.3%) |
| Foreign Born, not a Citizen | 567 (89.6%) | 66 (10.4%) |
Health Insurance Coverage by Household Income in Berlin borough
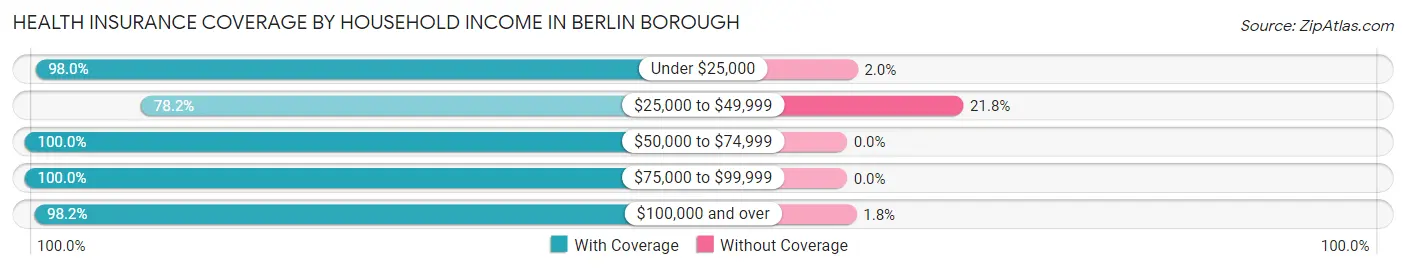
| Household Income | With Coverage | Without Coverage |
| Under $25,000 | 442 (98.0%) | 9 (2.0%) |
| $25,000 to $49,999 | 592 (78.2%) | 165 (21.8%) |
| $50,000 to $74,999 | 611 (100.0%) | 0 (0.0%) |
| $75,000 to $99,999 | 712 (100.0%) | 0 (0.0%) |
| $100,000 and over | 4,776 (98.2%) | 87 (1.8%) |
Public vs Private Health Insurance Coverage by Age in Berlin borough
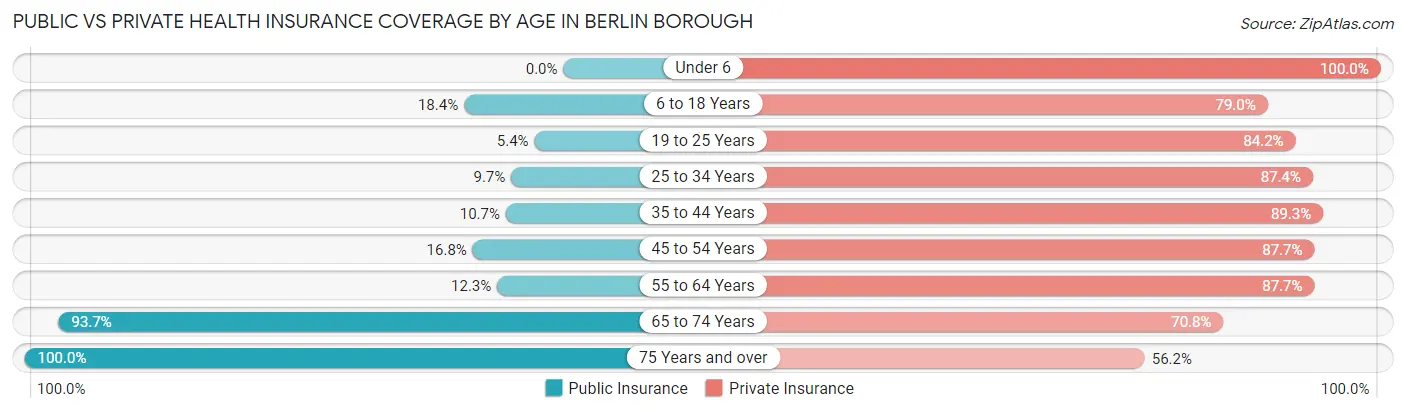
| Age Bracket | Public Insurance | Private Insurance |
| Under 6 | 0 (0.0%) | 267 (100.0%) |
| 6 to 18 Years | 291 (18.4%) | 1,247 (79.0%) |
| 19 to 25 Years | 34 (5.4%) | 533 (84.2%) |
| 25 to 34 Years | 81 (9.7%) | 730 (87.4%) |
| 35 to 44 Years | 69 (10.7%) | 577 (89.3%) |
| 45 to 54 Years | 230 (16.8%) | 1,199 (87.7%) |
| 55 to 64 Years | 122 (12.3%) | 870 (87.7%) |
| 65 to 74 Years | 552 (93.7%) | 417 (70.8%) |
| 75 Years and over | 505 (100.0%) | 284 (56.2%) |
| Total | 1,884 (25.4%) | 6,124 (82.6%) |
Disability Status by Sex by Age in Berlin borough
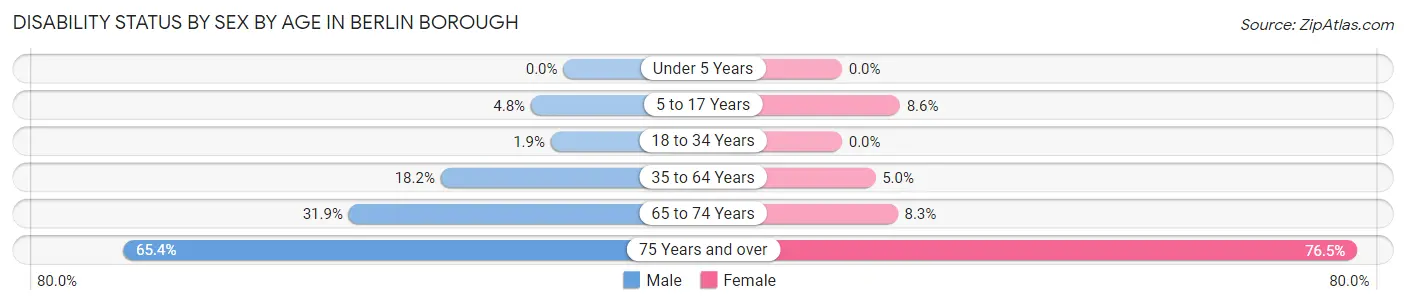
| Age Bracket | Male | Female |
| Under 5 Years | 0 (0.0%) | 0 (0.0%) |
| 5 to 17 Years | 28 (4.8%) | 69 (8.6%) |
| 18 to 34 Years | 14 (1.9%) | 0 (0.0%) |
| 35 to 64 Years | 272 (18.2%) | 75 (5.0%) |
| 65 to 74 Years | 80 (31.9%) | 28 (8.3%) |
| 75 Years and over | 85 (65.4%) | 287 (76.5%) |
Disability Class by Sex by Age in Berlin borough
Disability Class: Hearing Difficulty
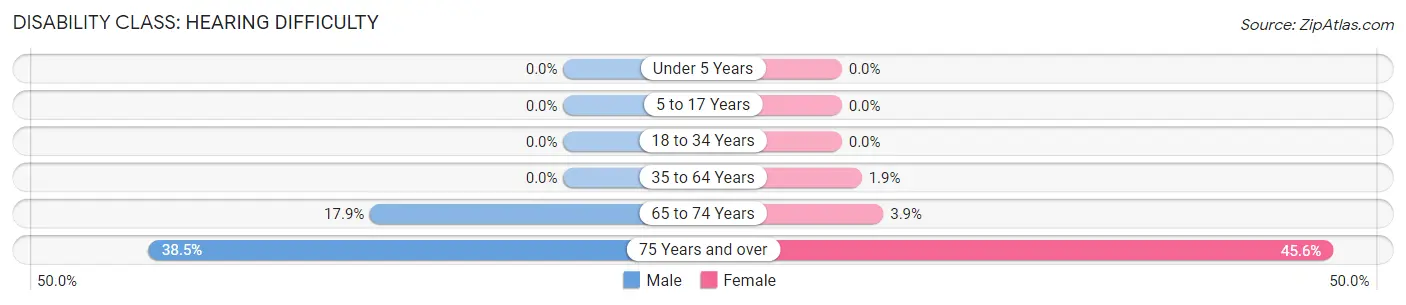
| Age Bracket | Male | Female |
| Under 5 Years | 0 (0.0%) | 0 (0.0%) |
| 5 to 17 Years | 0 (0.0%) | 0 (0.0%) |
| 18 to 34 Years | 0 (0.0%) | 0 (0.0%) |
| 35 to 64 Years | 0 (0.0%) | 28 (1.8%) |
| 65 to 74 Years | 45 (17.9%) | 13 (3.8%) |
| 75 Years and over | 50 (38.5%) | 171 (45.6%) |
Disability Class: Vision Difficulty
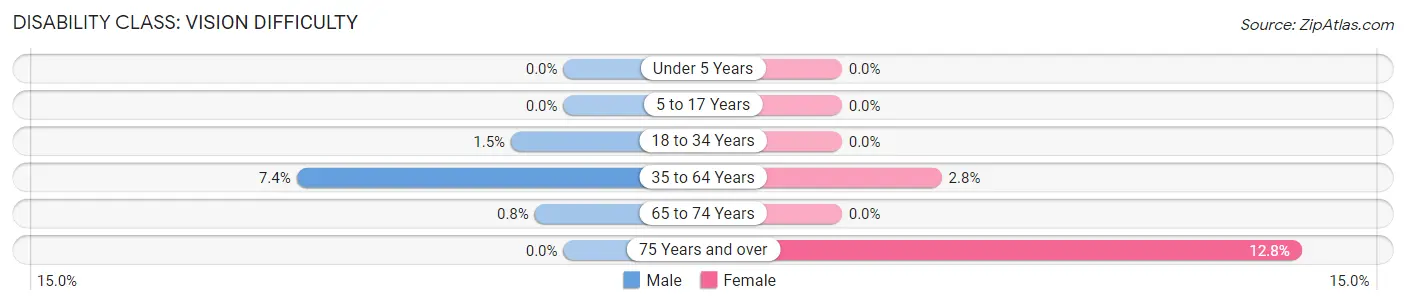
| Age Bracket | Male | Female |
| Under 5 Years | 0 (0.0%) | 0 (0.0%) |
| 5 to 17 Years | 0 (0.0%) | 0 (0.0%) |
| 18 to 34 Years | 11 (1.5%) | 0 (0.0%) |
| 35 to 64 Years | 111 (7.4%) | 42 (2.8%) |
| 65 to 74 Years | 2 (0.8%) | 0 (0.0%) |
| 75 Years and over | 0 (0.0%) | 48 (12.8%) |
Disability Class: Cognitive Difficulty
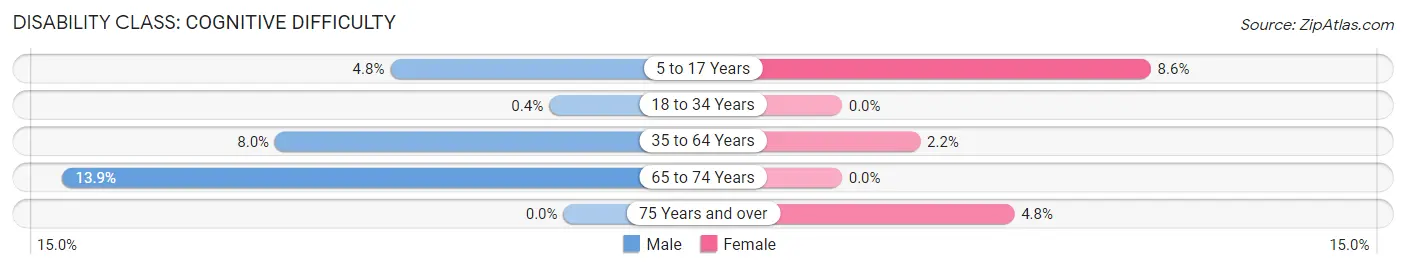
| Age Bracket | Male | Female |
| 5 to 17 Years | 28 (4.8%) | 69 (8.6%) |
| 18 to 34 Years | 3 (0.4%) | 0 (0.0%) |
| 35 to 64 Years | 120 (8.0%) | 33 (2.2%) |
| 65 to 74 Years | 35 (13.9%) | 0 (0.0%) |
| 75 Years and over | 0 (0.0%) | 18 (4.8%) |
Disability Class: Ambulatory Difficulty
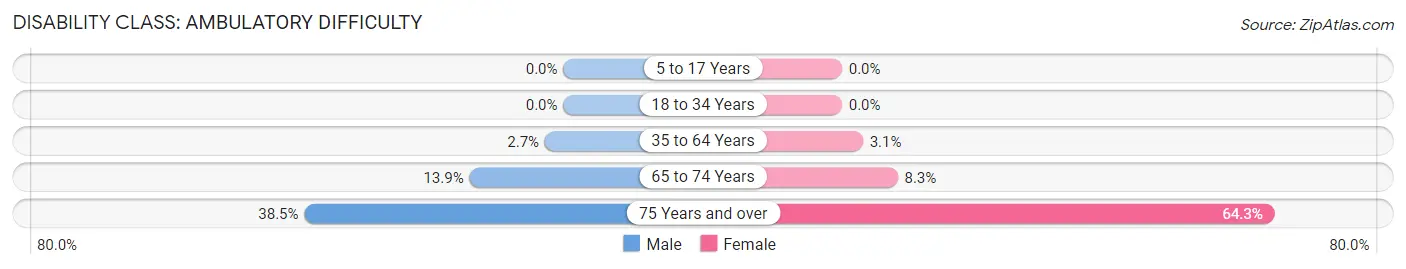
| Age Bracket | Male | Female |
| 5 to 17 Years | 0 (0.0%) | 0 (0.0%) |
| 18 to 34 Years | 0 (0.0%) | 0 (0.0%) |
| 35 to 64 Years | 41 (2.7%) | 47 (3.1%) |
| 65 to 74 Years | 35 (13.9%) | 28 (8.3%) |
| 75 Years and over | 50 (38.5%) | 241 (64.3%) |
Disability Class: Self-Care Difficulty
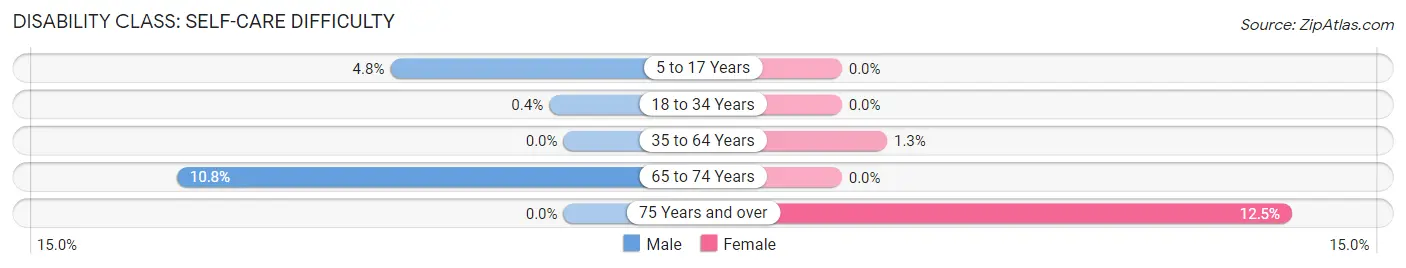
| Age Bracket | Male | Female |
| 5 to 17 Years | 28 (4.8%) | 0 (0.0%) |
| 18 to 34 Years | 3 (0.4%) | 0 (0.0%) |
| 35 to 64 Years | 0 (0.0%) | 19 (1.3%) |
| 65 to 74 Years | 27 (10.8%) | 0 (0.0%) |
| 75 Years and over | 0 (0.0%) | 47 (12.5%) |
Technology Access in Berlin borough
Computing Device Access in Berlin borough
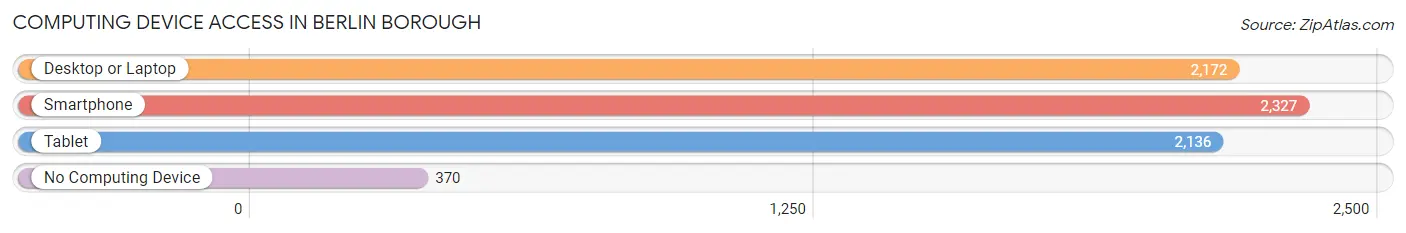
| Device Type | # Households | % Households |
| Desktop or Laptop | 2,172 | 76.6% |
| Smartphone | 2,327 | 82.1% |
| Tablet | 2,136 | 75.3% |
| No Computing Device | 370 | 13.1% |
| Total | 2,835 | 100.0% |
Internet Access in Berlin borough
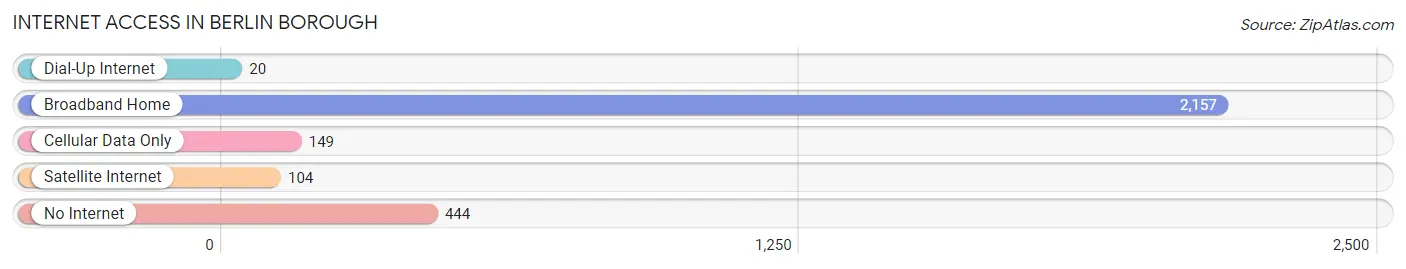
| Internet Type | # Households | % Households |
| Dial-Up Internet | 20 | 0.7% |
| Broadband Home | 2,157 | 76.1% |
| Cellular Data Only | 149 | 5.3% |
| Satellite Internet | 104 | 3.7% |
| No Internet | 444 | 15.7% |
| Total | 2,835 | 100.0% |
Berlin borough Summary
Berlin Borough is a small borough located in Camden County, New Jersey. It is situated in the southern part of the county, just north of the city of Camden. The borough is bordered by the townships of Berlin, Waterford, and Winslow. The population of Berlin Borough was 8,062 as of the 2010 census.
Geography
Berlin Borough is located at 39°48'17" North, 74°56'45" West (39.8047, -74.9457). According to the United States Census Bureau, the borough has a total area of 2.2 square miles (5.7 km2), all of which is land.
The borough is located in the Atlantic Coastal Plain, and is characterized by flat terrain. The soil is mostly sandy loam, with some areas of clay. The climate is humid subtropical, with hot, humid summers and mild winters.
Demographics
As of the 2010 census, there were 8,062 people, 3,072 households, and 2,092 families residing in the borough. The population density was 3,664.2 people per square mile (1,417.2/km2). There were 3,307 housing units at an average density of 1,502.2 per square mile (579.2/km2). The racial makeup of the borough was 79.2% White, 13.3% African American, 0.3% Native American, 2.2% Asian, 0.1% Pacific Islander, 2.7% from other races, and 2.4% from two or more races. Hispanic or Latino of any race were 8.2% of the population.
There were 3,072 households, out of which 32.2% had children under the age of 18 living with them, 46.2% were married couples living together, 15.3% had a female householder with no husband present, and 33.2% were non-families. 27.2% of all households were made up of individuals, and 10.2% had someone living alone who was 65 years of age or older. The average household size was 2.62 and the average family size was 3.20.
In the borough, the population was spread out, with 25.2% under the age of 18, 8.2% from 18 to 24, 30.2% from 25 to 44, 22.7% from 45 to 64, and 13.7% who were 65 years of age or older. The median age was 36 years. For every 100 females, there were 93.2 males. For every 100 females age 18 and over, there were 89.7 males.
The median income for a household in the borough was $50,945, and the median income for a family was $60,917. Males had a median income of $41,919 versus $31,945 for females. The per capita income for the borough was $23,945. About 4.2% of families and 6.2% of the population were below the poverty line, including 8.2% of those under age 18 and 6.2% of those age 65 or over.
Economy
Berlin Borough is home to a variety of businesses, including retail stores, restaurants, and professional services. The borough is also home to several industrial parks, which provide employment opportunities for local residents.
The borough is served by the Berlin Borough School District, which consists of three elementary schools, one middle school, and one high school. The district also operates a vocational-technical school.
The borough is served by the Berlin Borough Public Library, which is part of the Camden County Library System. The library offers a variety of services, including books, magazines, newspapers, audio books, DVDs, and online resources.
Berlin Borough is also home to several parks and recreational facilities, including a public pool, a skate park, and a community center. The borough also hosts a variety of events throughout the year, including a summer concert series, a holiday parade, and a farmers' market.
Conclusion
Berlin Borough is a small borough located in Camden County, New Jersey. It is situated in the southern part of the county, just north of the city of Camden. The borough is bordered by the townships of Berlin, Waterford, and Winslow. The population of Berlin Borough was 8,062 as of the 2010 census. The borough is located in the Atlantic Coastal Plain, and is characterized by flat terrain. The soil is mostly sandy loam, with some areas of clay. The climate is humid subtropical, with hot, humid summers and mild winters.
Berlin Borough is home to a variety of businesses, including retail stores, restaurants, and professional services. The borough is also home to several industrial parks, which provide employment opportunities for local residents. The borough is served by the Berlin Borough School District, which consists of three elementary schools, one middle school, and one high school. The district also operates a vocational-technical school. The borough is also home to several parks and recreational facilities, including a public pool, a skate park, and a community center. The borough also hosts a variety of events throughout the year, including a summer concert series, a holiday parade, and a farmers' market.
Common Questions
What is Per Capita Income in Berlin borough?
Per Capita income in Berlin borough is $45,214.
What is the Median Family Income in Berlin borough?
Median Family Income in Berlin borough is $128,958.
What is the Median Household income in Berlin borough?
Median Household Income in Berlin borough is $98,706.
What is Income or Wage Gap in Berlin borough?
Income or Wage Gap in Berlin borough is 41.6%.
Women in Berlin borough earn 58.4 cents for every dollar earned by a man.
What is Inequality or Gini Index in Berlin borough?
Inequality or Gini Index in Berlin borough is 0.41.
What is the Total Population of Berlin borough?
Total Population of Berlin borough is 7,489.
What is the Total Male Population of Berlin borough?
Total Male Population of Berlin borough is 3,385.
What is the Total Female Population of Berlin borough?
Total Female Population of Berlin borough is 4,104.
What is the Ratio of Males per 100 Females in Berlin borough?
There are 82.48 Males per 100 Females in Berlin borough.
What is the Ratio of Females per 100 Males in Berlin borough?
There are 121.24 Females per 100 Males in Berlin borough.
What is the Median Population Age in Berlin borough?
Median Population Age in Berlin borough is 40.4 Years.
What is the Average Family Size in Berlin borough
Average Family Size in Berlin borough is 3.3 People.
What is the Average Household Size in Berlin borough
Average Household Size in Berlin borough is 2.6 People.
How Large is the Labor Force in Berlin borough?
There are 4,118 People in the Labor Forcein in Berlin borough.
What is the Percentage of People in the Labor Force in Berlin borough?
66.6% of People are in the Labor Force in Berlin borough.
What is the Unemployment Rate in Berlin borough?
Unemployment Rate in Berlin borough is 1.8%.