Seal Beach, CA Map & Demographics
Seal Beach Map
Seal Beach Overview
$65,859
PER CAPITA INCOME
$142,717
AVG FAMILY INCOME
$75,507
AVG HOUSEHOLD INCOME
50.2%
WAGE / INCOME GAP [ % ]
49.8¢/ $1
WAGE / INCOME GAP [ $ ]
0.51
INEQUALITY / GINI INDEX
25,046
TOTAL POPULATION
11,098
MALE POPULATION
13,948
FEMALE POPULATION
79.57
MALES / 100 FEMALES
125.68
FEMALES / 100 MALES
60.8
MEDIAN AGE
2.8
AVG FAMILY SIZE
1.9
AVG HOUSEHOLD SIZE
9,632
LABOR FORCE [ PEOPLE ]
43.6%
PERCENT IN LABOR FORCE
4.2%
UNEMPLOYMENT RATE
Seal Beach Zip Codes
Income in Seal Beach
Income Overview in Seal Beach
Per Capita Income in Seal Beach is $65,859, while median incomes of families and households are $142,717 and $75,507 respectively.
| Characteristic | Number | Measure |
| Per Capita Income | 25,046 | $65,859 |
| Median Family Income | 6,086 | $142,717 |
| Mean Family Income | 6,086 | $176,274 |
| Median Household Income | 13,203 | $75,507 |
| Mean Household Income | 13,203 | $123,336 |
| Income Deficit | 6,086 | $0 |
| Wage / Income Gap (%) | 25,046 | 50.18% |
| Wage / Income Gap ($) | 25,046 | 49.82¢ per $1 |
| Gini / Inequality Index | 25,046 | 0.51 |
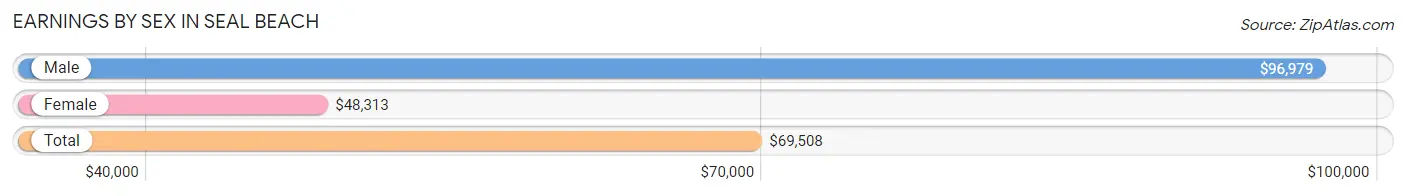
Earnings by Sex in Seal Beach
Average Earnings in Seal Beach are $69,508, $96,979 for men and $48,313 for women, a difference of 50.2%.
| Sex | Number | Average Earnings |
| Male | 5,361 (52.0%) | $96,979 |
| Female | 4,942 (48.0%) | $48,313 |
| Total | 10,303 (100.0%) | $69,508 |
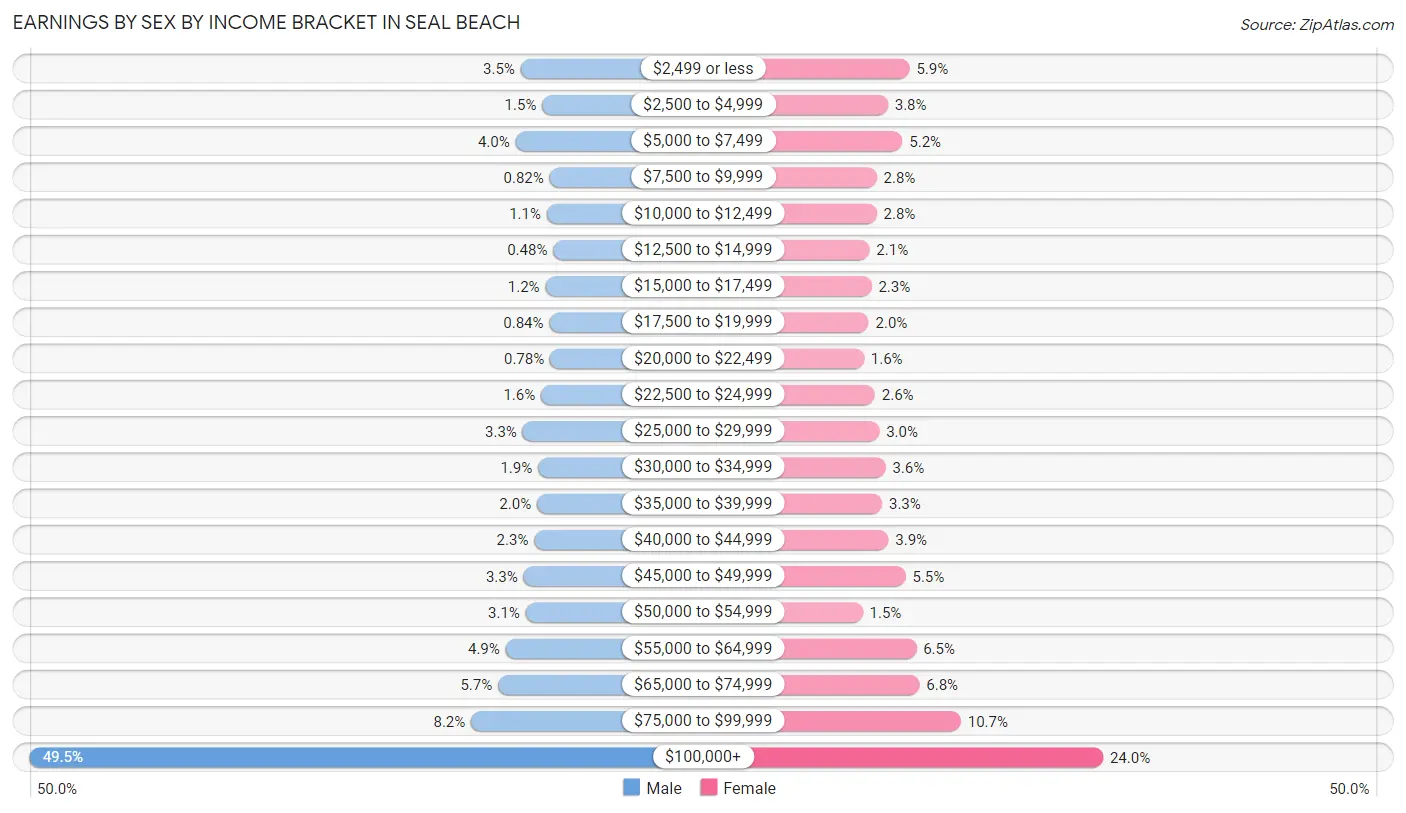
Earnings by Sex by Income Bracket in Seal Beach
The most common earnings brackets in Seal Beach are $100,000+ for men (2,655 | 49.5%) and $100,000+ for women (1,186 | 24.0%).
| Income | Male | Female |
| $2,499 or less | 189 (3.5%) | 290 (5.9%) |
| $2,500 to $4,999 | 81 (1.5%) | 190 (3.8%) |
| $5,000 to $7,499 | 215 (4.0%) | 257 (5.2%) |
| $7,500 to $9,999 | 44 (0.8%) | 138 (2.8%) |
| $10,000 to $12,499 | 58 (1.1%) | 138 (2.8%) |
| $12,500 to $14,999 | 26 (0.5%) | 105 (2.1%) |
| $15,000 to $17,499 | 65 (1.2%) | 114 (2.3%) |
| $17,500 to $19,999 | 45 (0.8%) | 101 (2.0%) |
| $20,000 to $22,499 | 42 (0.8%) | 79 (1.6%) |
| $22,500 to $24,999 | 87 (1.6%) | 130 (2.6%) |
| $25,000 to $29,999 | 179 (3.3%) | 150 (3.0%) |
| $30,000 to $34,999 | 102 (1.9%) | 179 (3.6%) |
| $35,000 to $39,999 | 107 (2.0%) | 163 (3.3%) |
| $40,000 to $44,999 | 121 (2.3%) | 192 (3.9%) |
| $45,000 to $49,999 | 175 (3.3%) | 272 (5.5%) |
| $50,000 to $54,999 | 164 (3.1%) | 73 (1.5%) |
| $55,000 to $64,999 | 265 (4.9%) | 321 (6.5%) |
| $65,000 to $74,999 | 303 (5.7%) | 336 (6.8%) |
| $75,000 to $99,999 | 438 (8.2%) | 528 (10.7%) |
| $100,000+ | 2,655 (49.5%) | 1,186 (24.0%) |
| Total | 5,361 (100.0%) | 4,942 (100.0%) |
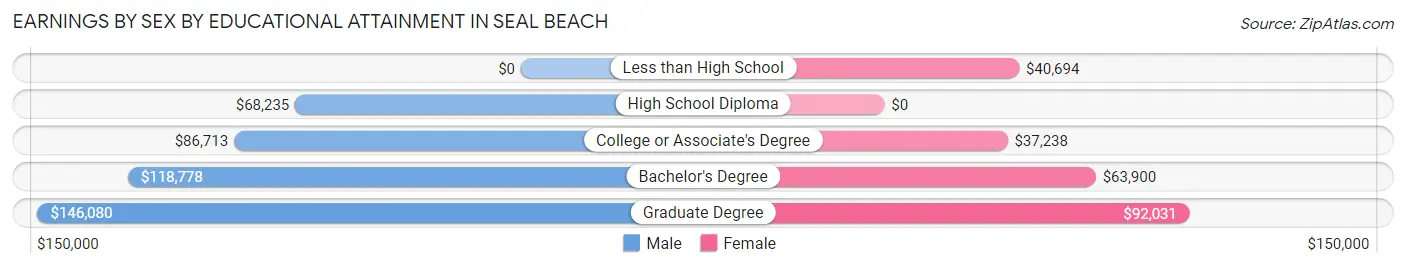
Earnings by Sex by Educational Attainment in Seal Beach
Average earnings in Seal Beach are $106,322 for men and $57,674 for women, a difference of 45.8%. Men with an educational attainment of graduate degree enjoy the highest average annual earnings of $146,080, while those with high school diploma education earn the least with $68,235. Women with an educational attainment of graduate degree earn the most with the average annual earnings of $92,031, while those with college or associate's degree education have the smallest earnings of $37,238.
| Educational Attainment | Male Income | Female Income |
| Less than High School | - | - |
| High School Diploma | $68,235 | $0 |
| College or Associate's Degree | $86,713 | $37,238 |
| Bachelor's Degree | $118,778 | $63,900 |
| Graduate Degree | $146,080 | $92,031 |
| Total | $106,322 | $57,674 |
Family Income in Seal Beach
Family Income Brackets in Seal Beach
According to the Seal Beach family income data, there are 1,978 families falling into the $200,000+ income range, which is the most common income bracket and makes up 32.5% of all families. Conversely, the less than $10,000 income bracket is the least frequent group with only 67 families (1.1%) belonging to this category.
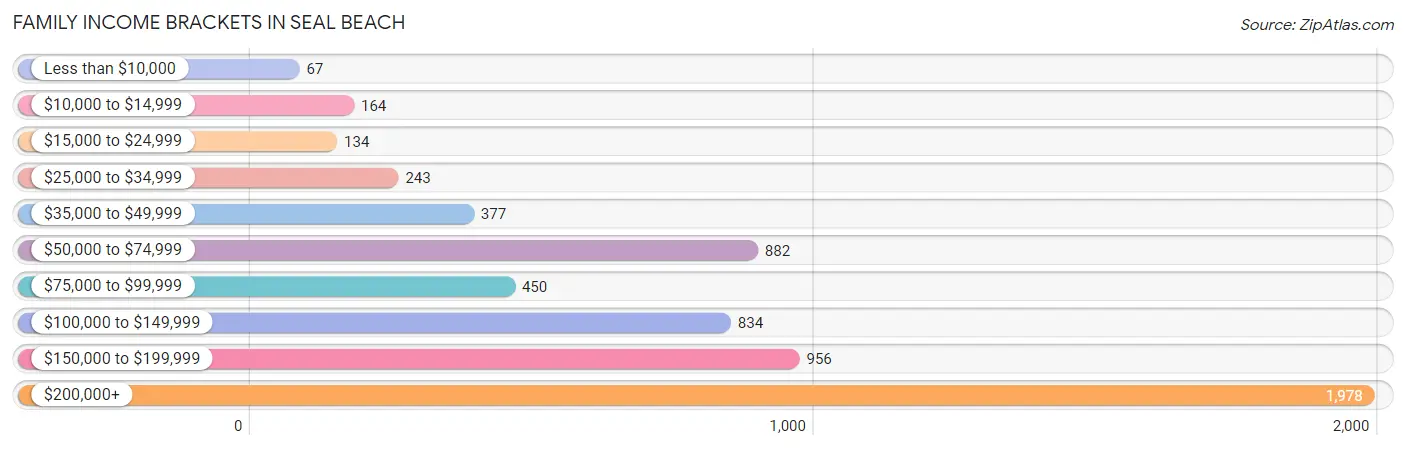
| Income Bracket | # Families | % Families |
| Less than $10,000 | 67 | 1.1% |
| $10,000 to $14,999 | 164 | 2.7% |
| $15,000 to $24,999 | 134 | 2.2% |
| $25,000 to $34,999 | 243 | 4.0% |
| $35,000 to $49,999 | 377 | 6.2% |
| $50,000 to $74,999 | 882 | 14.5% |
| $75,000 to $99,999 | 450 | 7.4% |
| $100,000 to $149,999 | 834 | 13.7% |
| $150,000 to $199,999 | 956 | 15.7% |
| $200,000+ | 1,978 | 32.5% |
Family Income by Famaliy Size in Seal Beach
6-person families (49 | 0.8%) account for the highest median family income in Seal Beach with $250,001 per family, while 3-person families (843 | 13.9%) have the highest median income of $59,010 per family member.
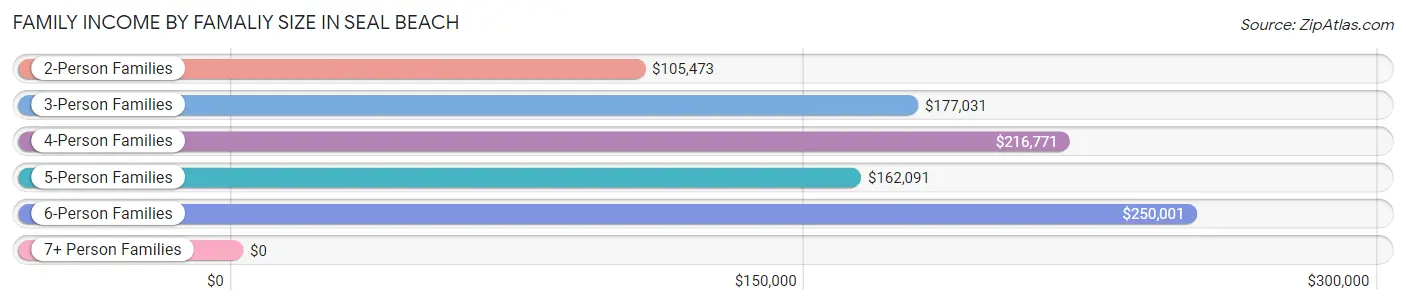
| Income Bracket | # Families | Median Income |
| 2-Person Families | 3,897 (64.0%) | $105,473 |
| 3-Person Families | 843 (13.9%) | $177,031 |
| 4-Person Families | 785 (12.9%) | $216,771 |
| 5-Person Families | 512 (8.4%) | $162,091 |
| 6-Person Families | 49 (0.8%) | $250,001 |
| 7+ Person Families | 0 (0.0%) | $0 |
| Total | 6,086 (100.0%) | $142,717 |
Family Income by Number of Earners in Seal Beach
The median family income in Seal Beach is $142,717, with families comprising 3+ earners (365) having the highest median family income of $222,354, while families with no earners (1,747) have the lowest median family income of $66,972, accounting for 6.0% and 28.7% of families, respectively.
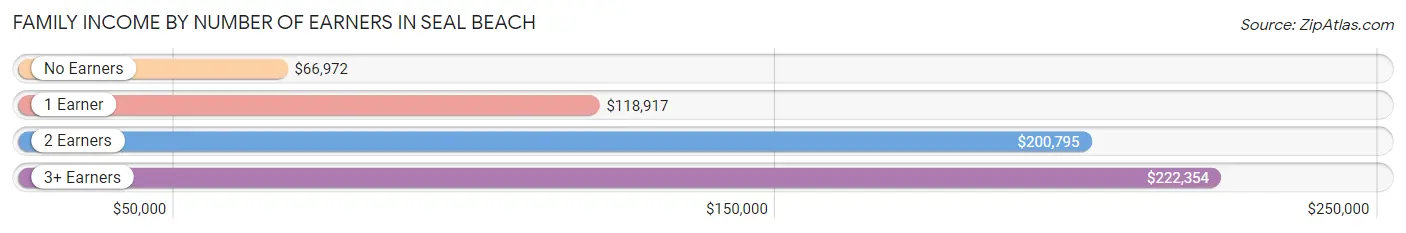
| Number of Earners | # Families | Median Income |
| No Earners | 1,747 (28.7%) | $66,972 |
| 1 Earner | 1,959 (32.2%) | $118,917 |
| 2 Earners | 2,015 (33.1%) | $200,795 |
| 3+ Earners | 365 (6.0%) | $222,354 |
| Total | 6,086 (100.0%) | $142,717 |
Household Income in Seal Beach
Household Income Brackets in Seal Beach
With 2,535 households falling in the category, the $200,000+ income range is the most frequent in Seal Beach, accounting for 19.2% of all households. In contrast, only 370 households (2.8%) fall into the $10,000 to $14,999 income bracket, making it the least populous group.
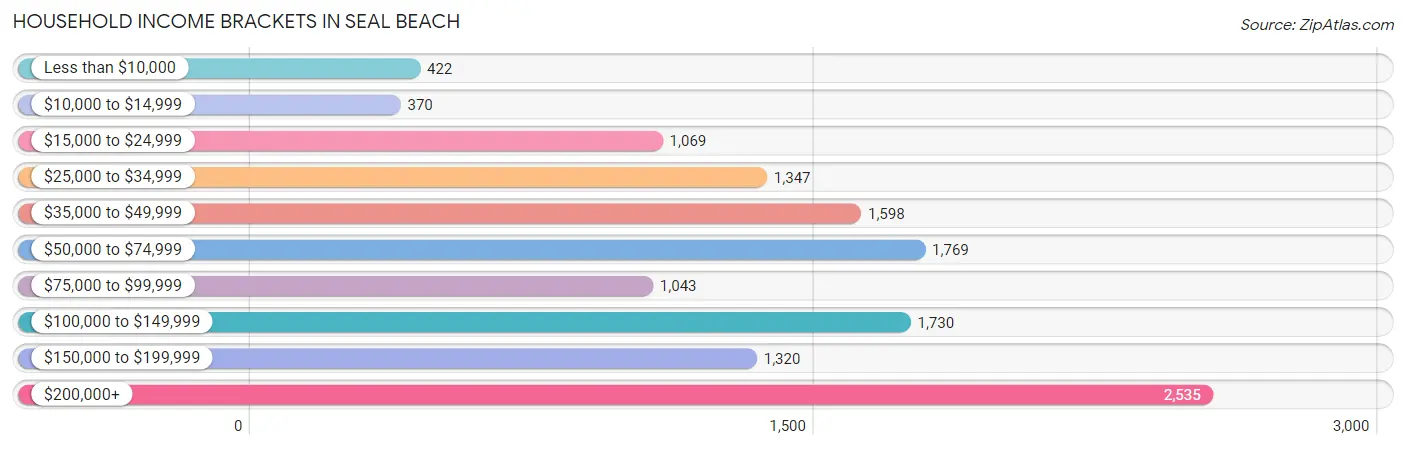
| Income Bracket | # Households | % Households |
| Less than $10,000 | 422 | 3.2% |
| $10,000 to $14,999 | 370 | 2.8% |
| $15,000 to $24,999 | 1,069 | 8.1% |
| $25,000 to $34,999 | 1,347 | 10.2% |
| $35,000 to $49,999 | 1,598 | 12.1% |
| $50,000 to $74,999 | 1,769 | 13.4% |
| $75,000 to $99,999 | 1,043 | 7.9% |
| $100,000 to $149,999 | 1,730 | 13.1% |
| $150,000 to $199,999 | 1,320 | 10.0% |
| $200,000+ | 2,535 | 19.2% |
Household Income by Householder Age in Seal Beach
The median household income in Seal Beach is $75,507, with the highest median household income of $151,230 found in the 45 to 64 years age bracket for the primary householder. A total of 3,507 households (26.6%) fall into this category. Meanwhile, the 65+ years age bracket for the primary householder has the lowest median household income of $49,908, with 7,840 households (59.4%) in this group.
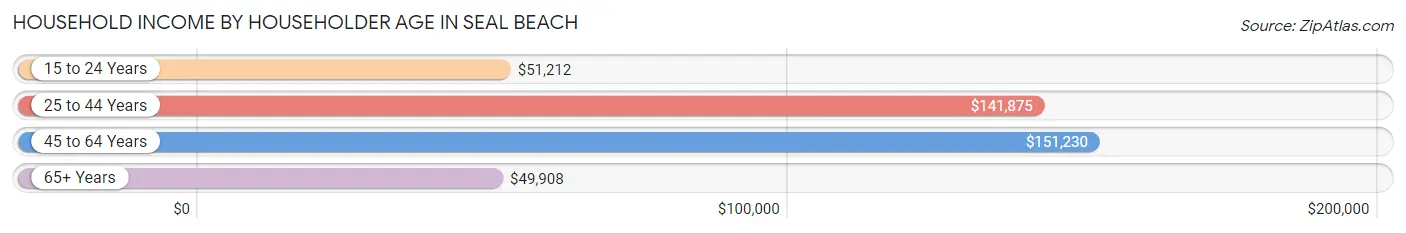
| Income Bracket | # Households | Median Income |
| 15 to 24 Years | 96 (0.7%) | $51,212 |
| 25 to 44 Years | 1,760 (13.3%) | $141,875 |
| 45 to 64 Years | 3,507 (26.6%) | $151,230 |
| 65+ Years | 7,840 (59.4%) | $49,908 |
| Total | 13,203 (100.0%) | $75,507 |
Poverty in Seal Beach
Income Below Poverty by Sex and Age in Seal Beach
With 5.5% poverty level for males and 6.8% for females among the residents of Seal Beach, 18 to 24 year old males and 75 year old and over females are the most vulnerable to poverty, with 49 males (12.9%) and 415 females (11.1%) in their respective age groups living below the poverty level.
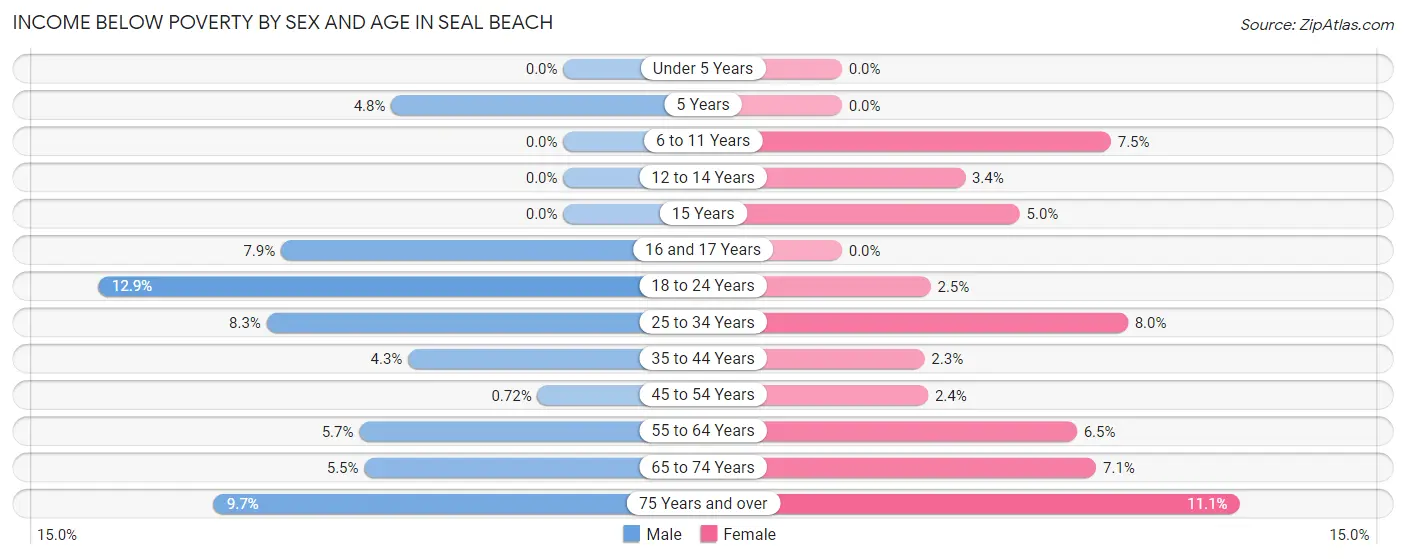
| Age Bracket | Male | Female |
| Under 5 Years | 0 (0.0%) | 0 (0.0%) |
| 5 Years | 7 (4.8%) | 0 (0.0%) |
| 6 to 11 Years | 0 (0.0%) | 42 (7.5%) |
| 12 to 14 Years | 0 (0.0%) | 8 (3.4%) |
| 15 Years | 0 (0.0%) | 9 (5.0%) |
| 16 and 17 Years | 11 (7.9%) | 0 (0.0%) |
| 18 to 24 Years | 49 (12.9%) | 9 (2.5%) |
| 25 to 34 Years | 62 (8.3%) | 87 (8.0%) |
| 35 to 44 Years | 51 (4.3%) | 25 (2.3%) |
| 45 to 54 Years | 8 (0.7%) | 30 (2.4%) |
| 55 to 64 Years | 99 (5.7%) | 113 (6.5%) |
| 65 to 74 Years | 114 (5.5%) | 212 (7.1%) |
| 75 Years and over | 200 (9.7%) | 415 (11.1%) |
| Total | 601 (5.5%) | 950 (6.8%) |
Income Above Poverty by Sex and Age in Seal Beach
According to the poverty statistics in Seal Beach, males aged under 5 years and females aged under 5 years are the age groups that are most secure financially, with 100.0% of males and 100.0% of females in these age groups living above the poverty line.
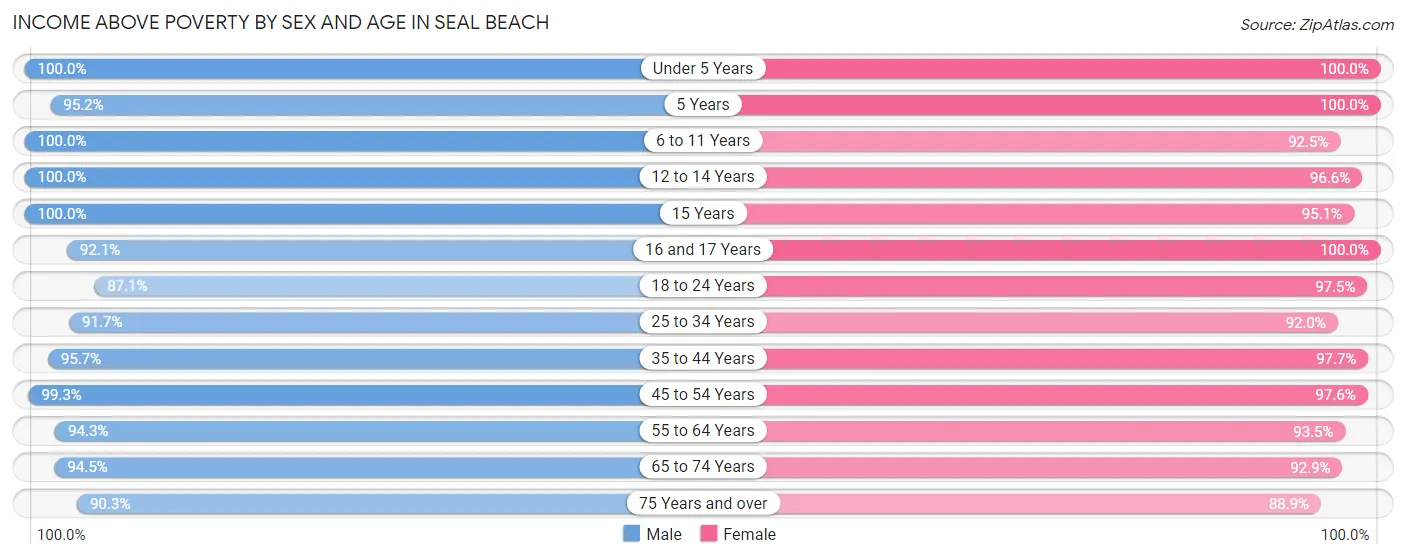
| Age Bracket | Male | Female |
| Under 5 Years | 348 (100.0%) | 341 (100.0%) |
| 5 Years | 139 (95.2%) | 85 (100.0%) |
| 6 to 11 Years | 616 (100.0%) | 519 (92.5%) |
| 12 to 14 Years | 318 (100.0%) | 225 (96.6%) |
| 15 Years | 125 (100.0%) | 173 (95.1%) |
| 16 and 17 Years | 129 (92.1%) | 241 (100.0%) |
| 18 to 24 Years | 330 (87.1%) | 356 (97.5%) |
| 25 to 34 Years | 689 (91.7%) | 1,006 (92.0%) |
| 35 to 44 Years | 1,129 (95.7%) | 1,060 (97.7%) |
| 45 to 54 Years | 1,110 (99.3%) | 1,219 (97.6%) |
| 55 to 64 Years | 1,645 (94.3%) | 1,616 (93.5%) |
| 65 to 74 Years | 1,944 (94.5%) | 2,782 (92.9%) |
| 75 Years and over | 1,855 (90.3%) | 3,334 (88.9%) |
| Total | 10,377 (94.5%) | 12,957 (93.2%) |
Income Below Poverty Among Married-Couple Families in Seal Beach
The poverty statistics for married-couple families in Seal Beach show that 4.0% or 202 of the total 5,104 families live below the poverty line. Families with no children have the highest poverty rate of 5.0%, comprising of 186 families. On the other hand, families with 3 or 4 children have the lowest poverty rate of 0.0%, which includes 0 families.
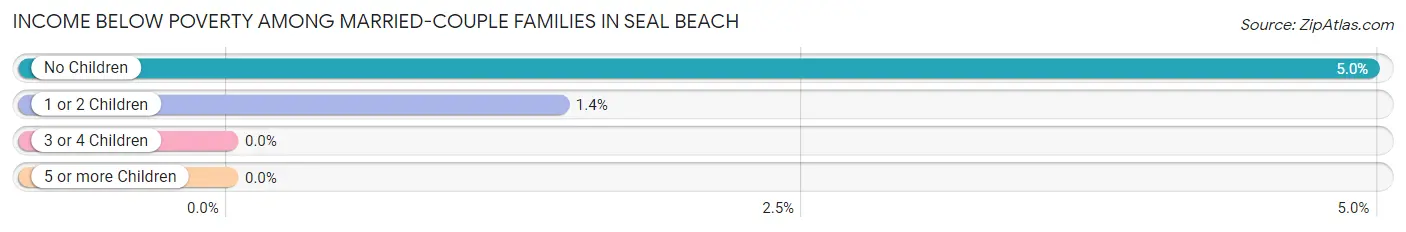
| Children | Above Poverty | Below Poverty |
| No Children | 3,553 (95.0%) | 186 (5.0%) |
| 1 or 2 Children | 1,098 (98.6%) | 16 (1.4%) |
| 3 or 4 Children | 251 (100.0%) | 0 (0.0%) |
| 5 or more Children | 0 (0.0%) | 0 (0.0%) |
| Total | 4,902 (96.0%) | 202 (4.0%) |
Income Below Poverty Among Single-Parent Households in Seal Beach
According to the poverty data in Seal Beach, 4.2% or 16 single-father households and 16.3% or 97 single-mother households are living below the poverty line. Among single-father households, those with no children have the highest poverty rate, with 8 households (9.3%) experiencing poverty. Likewise, among single-mother households, those with 1 or 2 children have the highest poverty rate, with 46 households (22.9%) falling below the poverty line.
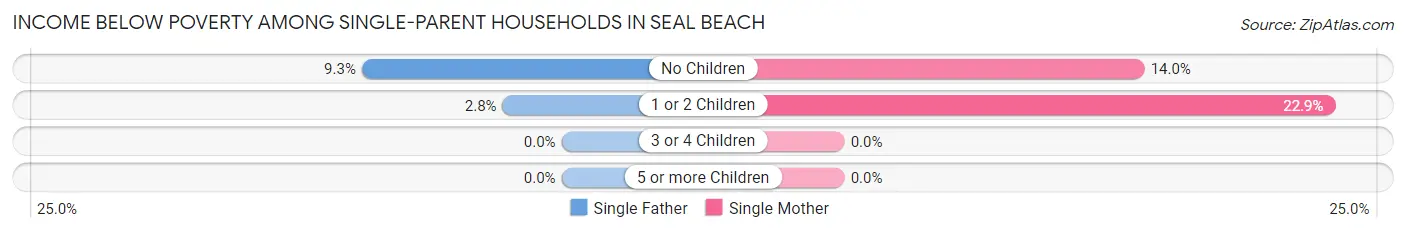
| Children | Single Father | Single Mother |
| No Children | 8 (9.3%) | 51 (14.0%) |
| 1 or 2 Children | 8 (2.8%) | 46 (22.9%) |
| 3 or 4 Children | 0 (0.0%) | 0 (0.0%) |
| 5 or more Children | 0 (0.0%) | 0 (0.0%) |
| Total | 16 (4.2%) | 97 (16.3%) |
Income Below Poverty Among Married-Couple vs Single-Parent Households in Seal Beach
The poverty data for Seal Beach shows that 202 of the married-couple family households (4.0%) and 113 of the single-parent households (11.5%) are living below the poverty level. Within the married-couple family households, those with no children have the highest poverty rate, with 186 households (5.0%) falling below the poverty line. Among the single-parent households, those with no children have the highest poverty rate, with 59 household (13.1%) living below poverty.
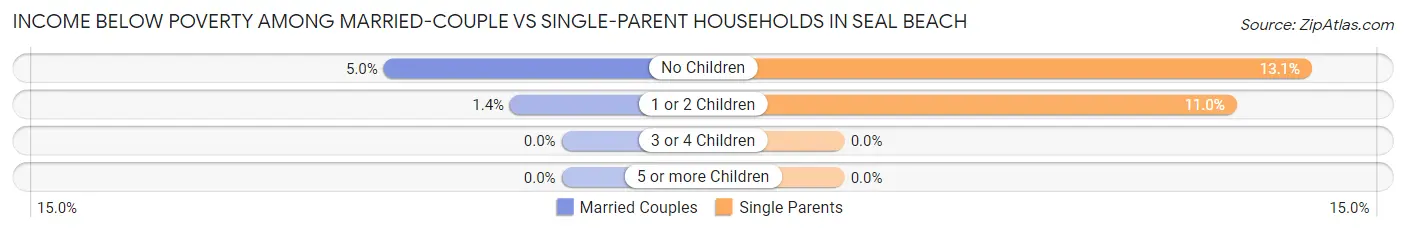
| Children | Married-Couple Families | Single-Parent Households |
| No Children | 186 (5.0%) | 59 (13.1%) |
| 1 or 2 Children | 16 (1.4%) | 54 (11.0%) |
| 3 or 4 Children | 0 (0.0%) | 0 (0.0%) |
| 5 or more Children | 0 (0.0%) | 0 (0.0%) |
| Total | 202 (4.0%) | 113 (11.5%) |
Race in Seal Beach
The most populous races in Seal Beach are White / Caucasian (18,701 | 74.7%), Asian (3,264 | 13.0%), and Hispanic or Latino (3,126 | 12.5%).
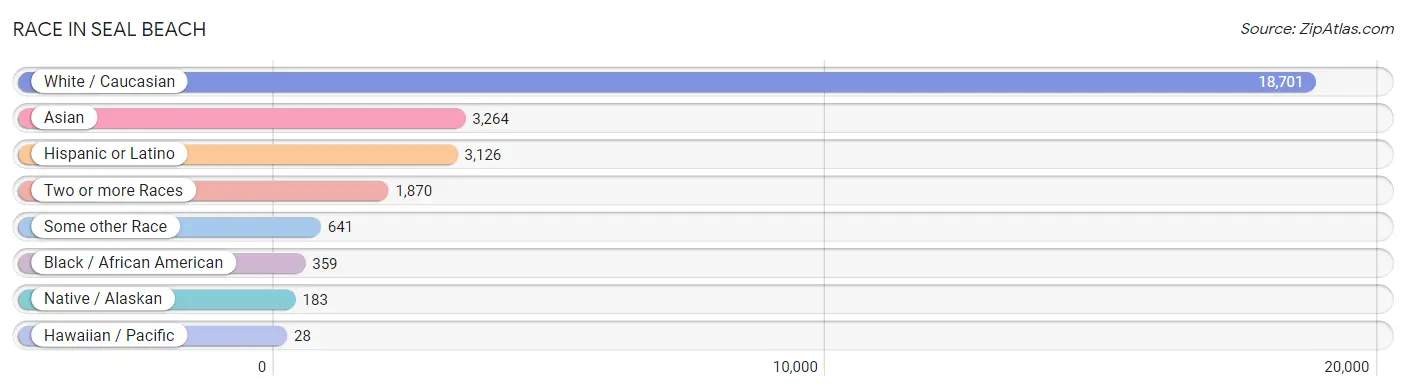
| Race | # Population | % Population |
| Asian | 3,264 | 13.0% |
| Black / African American | 359 | 1.4% |
| Hawaiian / Pacific | 28 | 0.1% |
| Hispanic or Latino | 3,126 | 12.5% |
| Native / Alaskan | 183 | 0.7% |
| White / Caucasian | 18,701 | 74.7% |
| Two or more Races | 1,870 | 7.5% |
| Some other Race | 641 | 2.6% |
| Total | 25,046 | 100.0% |
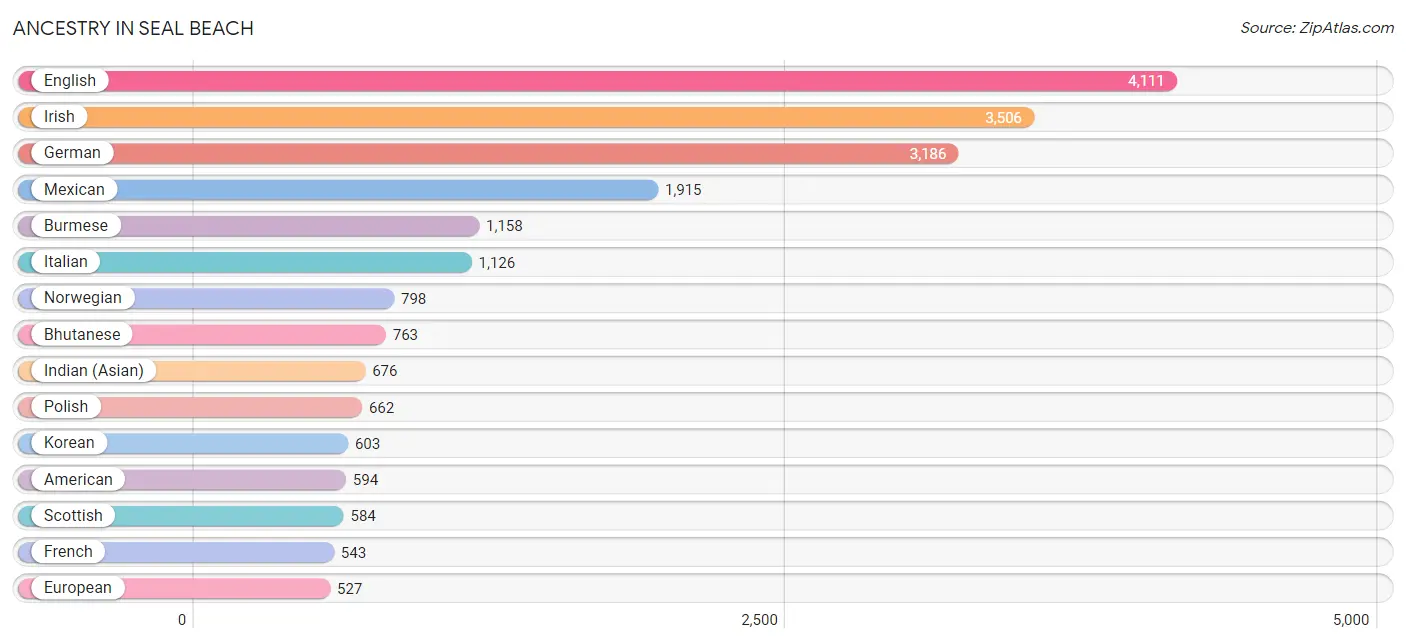
Ancestry in Seal Beach
The most populous ancestries reported in Seal Beach are English (4,111 | 16.4%), Irish (3,506 | 14.0%), German (3,186 | 12.7%), Mexican (1,915 | 7.6%), and Burmese (1,158 | 4.6%), together accounting for 55.4% of all Seal Beach residents.
| Ancestry | # Population | % Population |
| American | 594 | 2.4% |
| Arab | 187 | 0.7% |
| Argentinean | 62 | 0.3% |
| Armenian | 138 | 0.5% |
| Austrian | 72 | 0.3% |
| Barbadian | 1 | 0.0% |
| Basque | 28 | 0.1% |
| Belgian | 26 | 0.1% |
| Bhutanese | 763 | 3.0% |
| Blackfeet | 3 | 0.0% |
| Bolivian | 8 | 0.0% |
| Brazilian | 4 | 0.0% |
| British | 296 | 1.2% |
| Bulgarian | 19 | 0.1% |
| Burmese | 1,158 | 4.6% |
| Cajun | 20 | 0.1% |
| Canadian | 116 | 0.5% |
| Celtic | 13 | 0.1% |
| Central American | 265 | 1.1% |
| Central American Indian | 34 | 0.1% |
| Cherokee | 29 | 0.1% |
| Chilean | 15 | 0.1% |
| Chippewa | 7 | 0.0% |
| Colombian | 92 | 0.4% |
| Croatian | 18 | 0.1% |
| Cuban | 170 | 0.7% |
| Czech | 89 | 0.4% |
| Czechoslovakian | 23 | 0.1% |
| Danish | 182 | 0.7% |
| Delaware | 23 | 0.1% |
| Dutch | 388 | 1.5% |
| Eastern European | 144 | 0.6% |
| Egyptian | 91 | 0.4% |
| English | 4,111 | 16.4% |
| European | 527 | 2.1% |
| Filipino | 49 | 0.2% |
| Finnish | 71 | 0.3% |
| French | 543 | 2.2% |
| French Canadian | 175 | 0.7% |
| German | 3,186 | 12.7% |
| Greek | 270 | 1.1% |
| Guamanian / Chamorro | 11 | 0.0% |
| Guatemalan | 134 | 0.5% |
| Hungarian | 127 | 0.5% |
| Indian (Asian) | 676 | 2.7% |
| Iranian | 133 | 0.5% |
| Irish | 3,506 | 14.0% |
| Italian | 1,126 | 4.5% |
| Jamaican | 6 | 0.0% |
| Japanese | 20 | 0.1% |
| Jordanian | 21 | 0.1% |
| Korean | 603 | 2.4% |
| Laotian | 45 | 0.2% |
| Latvian | 23 | 0.1% |
| Lebanese | 54 | 0.2% |
| Lithuanian | 54 | 0.2% |
| Malaysian | 12 | 0.1% |
| Mexican | 1,915 | 7.6% |
| Mexican American Indian | 90 | 0.4% |
| Native Hawaiian | 51 | 0.2% |
| Nicaraguan | 46 | 0.2% |
| Nigerian | 35 | 0.1% |
| Northern European | 49 | 0.2% |
| Norwegian | 798 | 3.2% |
| Pakistani | 101 | 0.4% |
| Palestinian | 10 | 0.0% |
| Pennsylvania German | 135 | 0.5% |
| Peruvian | 57 | 0.2% |
| Polish | 662 | 2.6% |
| Portuguese | 86 | 0.3% |
| Pueblo | 25 | 0.1% |
| Puerto Rican | 161 | 0.6% |
| Romanian | 79 | 0.3% |
| Russian | 315 | 1.3% |
| Salvadoran | 85 | 0.3% |
| Scandinavian | 72 | 0.3% |
| Scotch-Irish | 174 | 0.7% |
| Scottish | 584 | 2.3% |
| Serbian | 31 | 0.1% |
| Slavic | 26 | 0.1% |
| Slovak | 42 | 0.2% |
| Slovene | 67 | 0.3% |
| South African | 4 | 0.0% |
| South American | 261 | 1.0% |
| Spaniard | 133 | 0.5% |
| Spanish | 169 | 0.7% |
| Sri Lankan | 214 | 0.9% |
| Subsaharan African | 54 | 0.2% |
| Swedish | 360 | 1.4% |
| Swiss | 107 | 0.4% |
| Thai | 251 | 1.0% |
| Turkish | 23 | 0.1% |
| Ukrainian | 58 | 0.2% |
| Venezuelan | 27 | 0.1% |
| Welsh | 255 | 1.0% |
| Yugoslavian | 37 | 0.2% | View All 96 Rows |
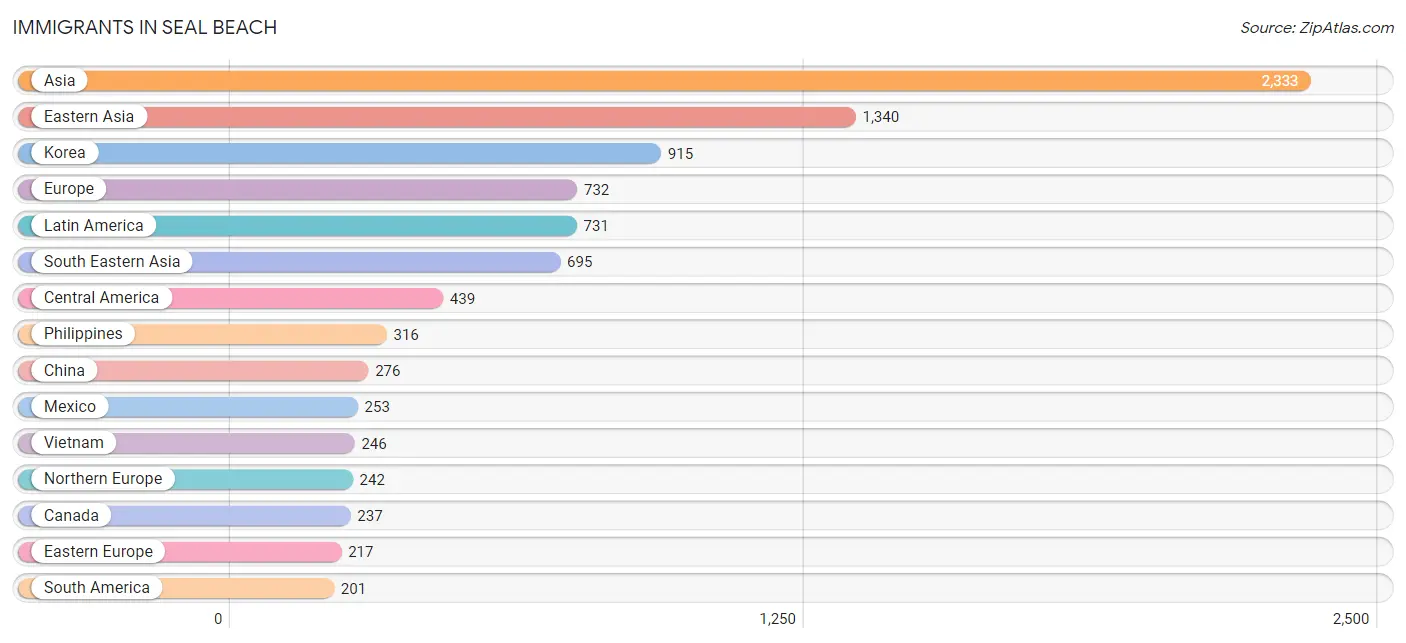
Immigrants in Seal Beach
The most numerous immigrant groups reported in Seal Beach came from Asia (2,333 | 9.3%), Eastern Asia (1,340 | 5.3%), Korea (915 | 3.6%), Europe (732 | 2.9%), and Latin America (731 | 2.9%), together accounting for 24.2% of all Seal Beach residents.
| Immigration Origin | # Population | % Population |
| Africa | 158 | 0.6% |
| Argentina | 24 | 0.1% |
| Asia | 2,333 | 9.3% |
| Australia | 131 | 0.5% |
| Austria | 9 | 0.0% |
| Barbados | 18 | 0.1% |
| Belarus | 16 | 0.1% |
| Bolivia | 8 | 0.0% |
| Brazil | 4 | 0.0% |
| Bulgaria | 8 | 0.0% |
| Cambodia | 20 | 0.1% |
| Canada | 237 | 0.9% |
| Caribbean | 91 | 0.4% |
| Central America | 439 | 1.8% |
| Chile | 15 | 0.1% |
| China | 276 | 1.1% |
| Colombia | 57 | 0.2% |
| Cuba | 73 | 0.3% |
| Denmark | 8 | 0.0% |
| Eastern Asia | 1,340 | 5.3% |
| Eastern Europe | 217 | 0.9% |
| Egypt | 147 | 0.6% |
| El Salvador | 109 | 0.4% |
| England | 53 | 0.2% |
| Europe | 732 | 2.9% |
| France | 29 | 0.1% |
| Germany | 124 | 0.5% |
| Greece | 6 | 0.0% |
| Guatemala | 29 | 0.1% |
| Hong Kong | 28 | 0.1% |
| India | 112 | 0.4% |
| Indonesia | 45 | 0.2% |
| Iran | 79 | 0.3% |
| Iraq | 12 | 0.1% |
| Ireland | 37 | 0.2% |
| Israel | 11 | 0.0% |
| Italy | 10 | 0.0% |
| Japan | 149 | 0.6% |
| Jordan | 8 | 0.0% |
| Korea | 915 | 3.6% |
| Laos | 4 | 0.0% |
| Latin America | 731 | 2.9% |
| Latvia | 8 | 0.0% |
| Lebanon | 18 | 0.1% |
| Liberia | 7 | 0.0% |
| Mexico | 253 | 1.0% |
| Netherlands | 39 | 0.2% |
| Nicaragua | 28 | 0.1% |
| Northern Africa | 147 | 0.6% |
| Northern Europe | 242 | 1.0% |
| Oceania | 131 | 0.5% |
| Panama | 20 | 0.1% |
| Peru | 57 | 0.2% |
| Philippines | 316 | 1.3% |
| Poland | 86 | 0.3% |
| Portugal | 9 | 0.0% |
| Romania | 27 | 0.1% |
| Russia | 57 | 0.2% |
| Scotland | 67 | 0.3% |
| Serbia | 15 | 0.1% |
| South Africa | 4 | 0.0% |
| South America | 201 | 0.8% |
| South Central Asia | 191 | 0.8% |
| South Eastern Asia | 695 | 2.8% |
| Southern Europe | 72 | 0.3% |
| Spain | 8 | 0.0% |
| Sweden | 6 | 0.0% |
| Taiwan | 128 | 0.5% |
| Thailand | 60 | 0.2% |
| Turkey | 58 | 0.2% |
| Venezuela | 36 | 0.1% |
| Vietnam | 246 | 1.0% |
| Western Africa | 7 | 0.0% |
| Western Asia | 107 | 0.4% |
| Western Europe | 201 | 0.8% | View All 75 Rows |
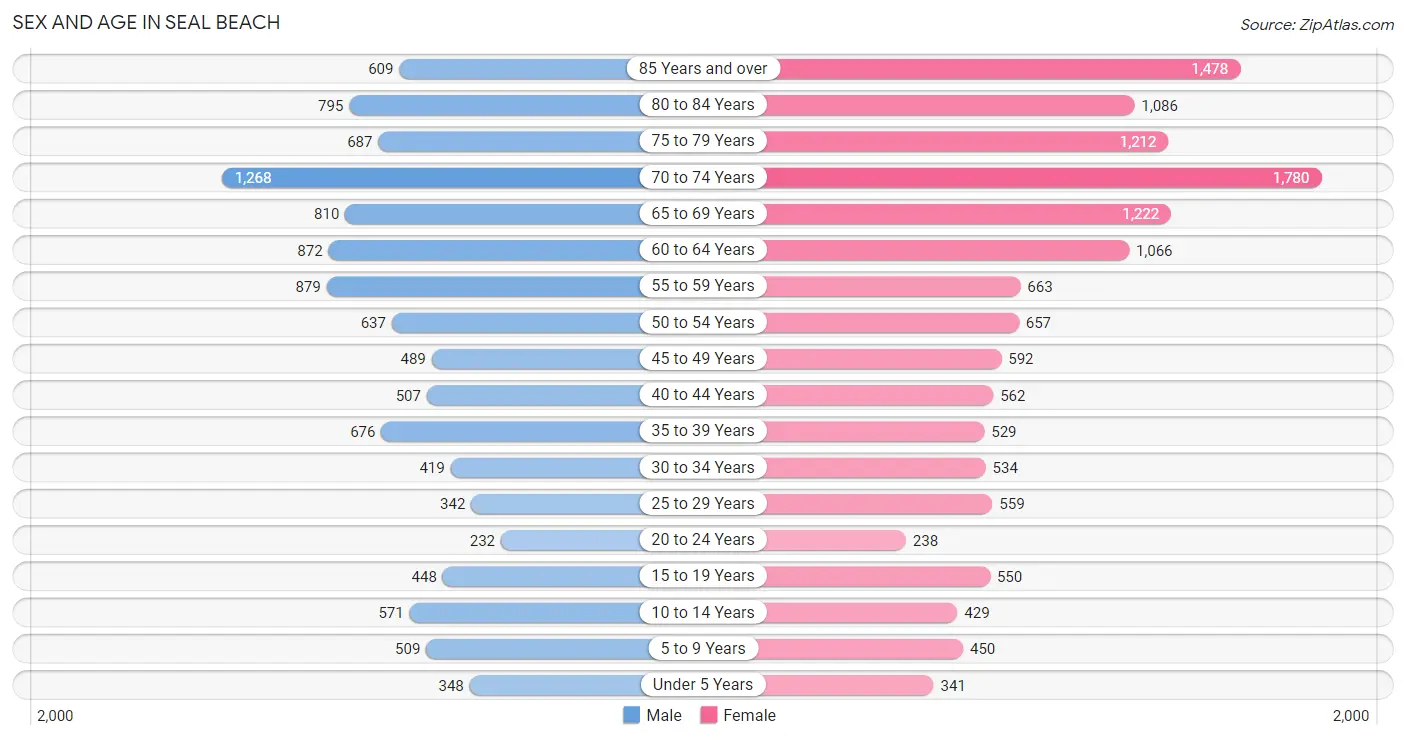
Sex and Age in Seal Beach
Sex and Age in Seal Beach
The most populous age groups in Seal Beach are 70 to 74 Years (1,268 | 11.4%) for men and 70 to 74 Years (1,780 | 12.8%) for women.
| Age Bracket | Male | Female |
| Under 5 Years | 348 (3.1%) | 341 (2.4%) |
| 5 to 9 Years | 509 (4.6%) | 450 (3.2%) |
| 10 to 14 Years | 571 (5.1%) | 429 (3.1%) |
| 15 to 19 Years | 448 (4.0%) | 550 (3.9%) |
| 20 to 24 Years | 232 (2.1%) | 238 (1.7%) |
| 25 to 29 Years | 342 (3.1%) | 559 (4.0%) |
| 30 to 34 Years | 419 (3.8%) | 534 (3.8%) |
| 35 to 39 Years | 676 (6.1%) | 529 (3.8%) |
| 40 to 44 Years | 507 (4.6%) | 562 (4.0%) |
| 45 to 49 Years | 489 (4.4%) | 592 (4.2%) |
| 50 to 54 Years | 637 (5.7%) | 657 (4.7%) |
| 55 to 59 Years | 879 (7.9%) | 663 (4.8%) |
| 60 to 64 Years | 872 (7.9%) | 1,066 (7.6%) |
| 65 to 69 Years | 810 (7.3%) | 1,222 (8.8%) |
| 70 to 74 Years | 1,268 (11.4%) | 1,780 (12.8%) |
| 75 to 79 Years | 687 (6.2%) | 1,212 (8.7%) |
| 80 to 84 Years | 795 (7.2%) | 1,086 (7.8%) |
| 85 Years and over | 609 (5.5%) | 1,478 (10.6%) |
| Total | 11,098 (100.0%) | 13,948 (100.0%) |
Families and Households in Seal Beach
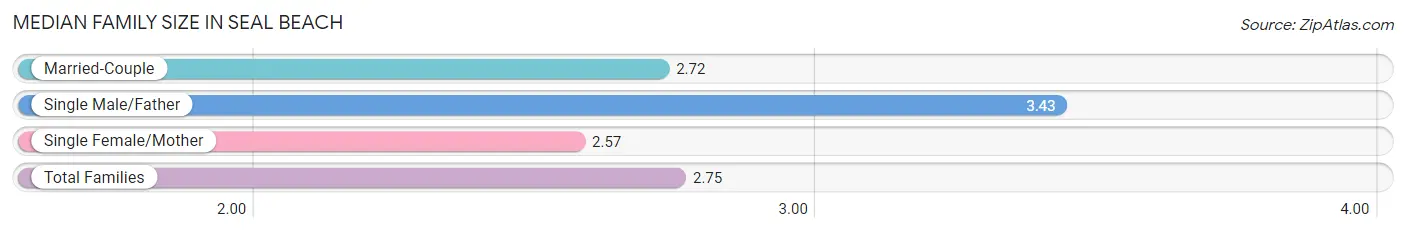
Median Family Size in Seal Beach
The median family size in Seal Beach is 2.75 persons per family, with single male/father families (386 | 6.3%) accounting for the largest median family size of 3.43 persons per family. On the other hand, single female/mother families (596 | 9.8%) represent the smallest median family size with 2.57 persons per family.
| Family Type | # Families | Family Size |
| Married-Couple | 5,104 (83.9%) | 2.72 |
| Single Male/Father | 386 (6.3%) | 3.43 |
| Single Female/Mother | 596 (9.8%) | 2.57 |
| Total Families | 6,086 (100.0%) | 2.75 |
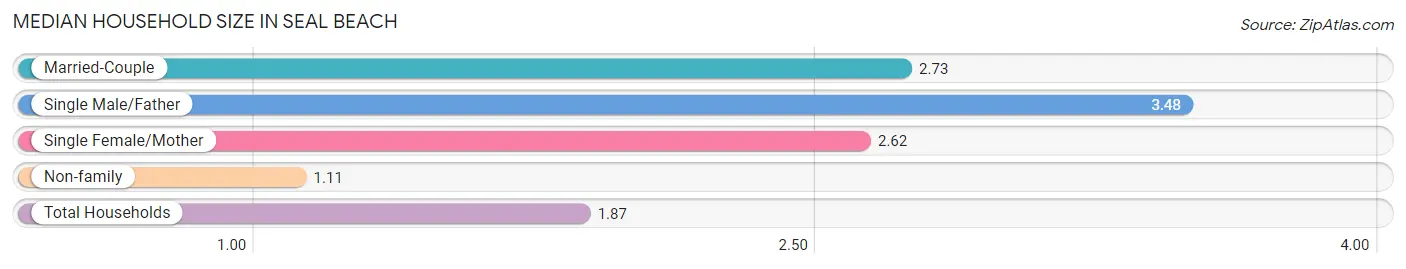
Median Household Size in Seal Beach
The median household size in Seal Beach is 1.87 persons per household, with single male/father households (386 | 2.9%) accounting for the largest median household size of 3.48 persons per household. non-family households (7,117 | 53.9%) represent the smallest median household size with 1.11 persons per household.
| Household Type | # Households | Household Size |
| Married-Couple | 5,104 (38.7%) | 2.73 |
| Single Male/Father | 386 (2.9%) | 3.48 |
| Single Female/Mother | 596 (4.5%) | 2.62 |
| Non-family | 7,117 (53.9%) | 1.11 |
| Total Households | 13,203 (100.0%) | 1.87 |
Household Size by Marriage Status in Seal Beach
Out of a total of 13,203 households in Seal Beach, 6,086 (46.1%) are family households, while 7,117 (53.9%) are nonfamily households. The most numerous type of family households are 2-person households, comprising 3,860, and the most common type of nonfamily households are 1-person households, comprising 6,481.
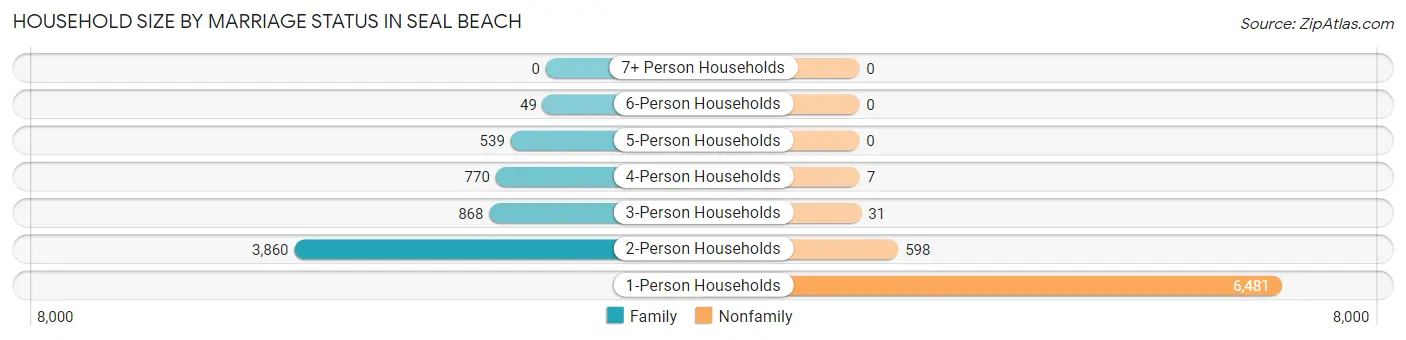
| Household Size | Family Households | Nonfamily Households |
| 1-Person Households | - | 6,481 (49.1%) |
| 2-Person Households | 3,860 (29.2%) | 598 (4.5%) |
| 3-Person Households | 868 (6.6%) | 31 (0.2%) |
| 4-Person Households | 770 (5.8%) | 7 (0.1%) |
| 5-Person Households | 539 (4.1%) | 0 (0.0%) |
| 6-Person Households | 49 (0.4%) | 0 (0.0%) |
| 7+ Person Households | 0 (0.0%) | 0 (0.0%) |
| Total | 6,086 (46.1%) | 7,117 (53.9%) |
Female Fertility in Seal Beach
Fertility by Age in Seal Beach
Average fertility rate in Seal Beach is 16.0 births per 1,000 women. Women in the age bracket of 35 to 50 years have the highest fertility rate with 32.0 births per 1,000 women. Women in the age bracket of 35 to 50 years acount for 100.0% of all women with births.
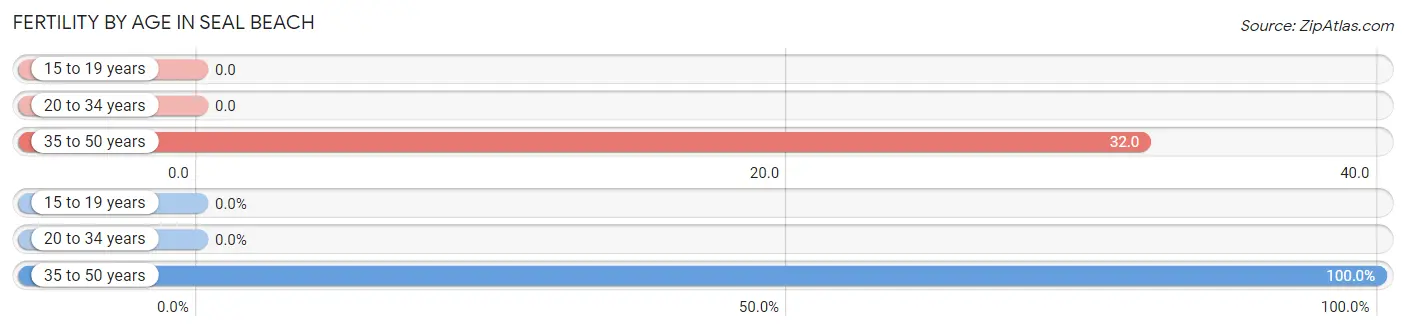
| Age Bracket | Women with Births | Births / 1,000 Women |
| 15 to 19 years | 0 (0.0%) | 0.0 |
| 20 to 34 years | 0 (0.0%) | 0.0 |
| 35 to 50 years | 57 (100.0%) | 32.0 |
| Total | 57 (100.0%) | 16.0 |
Fertility by Age by Marriage Status in Seal Beach
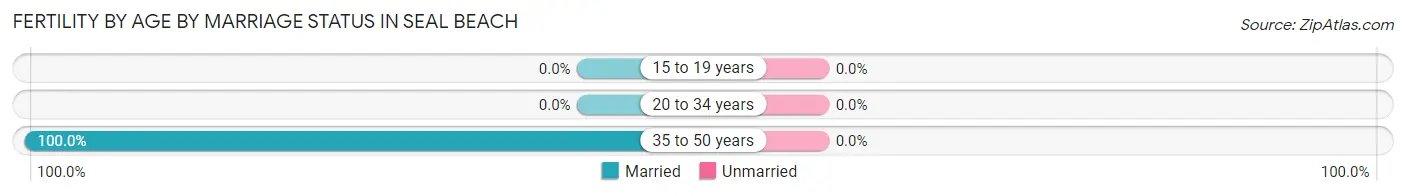
| Age Bracket | Married | Unmarried |
| 15 to 19 years | 0 (0.0%) | 0 (0.0%) |
| 20 to 34 years | 0 (0.0%) | 0 (0.0%) |
| 35 to 50 years | 57 (100.0%) | 0 (0.0%) |
| Total | 57 (100.0%) | 0 (0.0%) |
Fertility by Education in Seal Beach
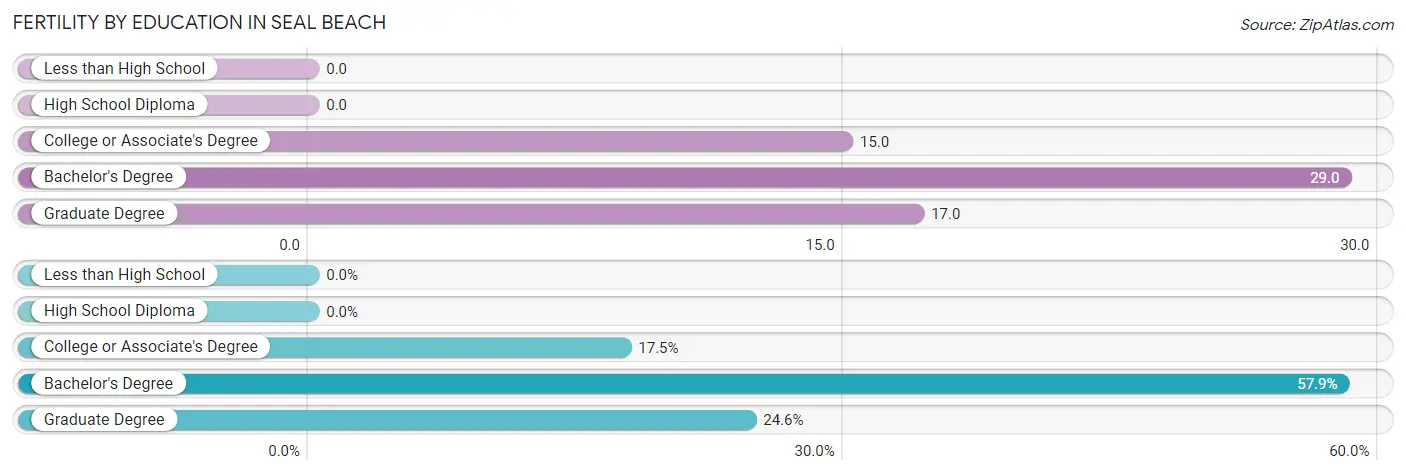
| Educational Attainment | Women with Births | Births / 1,000 Women |
| Less than High School | 0 (0.0%) | 0.0 |
| High School Diploma | 0 (0.0%) | 0.0 |
| College or Associate's Degree | 10 (17.5%) | 15.0 |
| Bachelor's Degree | 33 (57.9%) | 29.0 |
| Graduate Degree | 14 (24.6%) | 17.0 |
| Total | 57 (100.0%) | 16.0 |
Fertility by Education by Marriage Status in Seal Beach
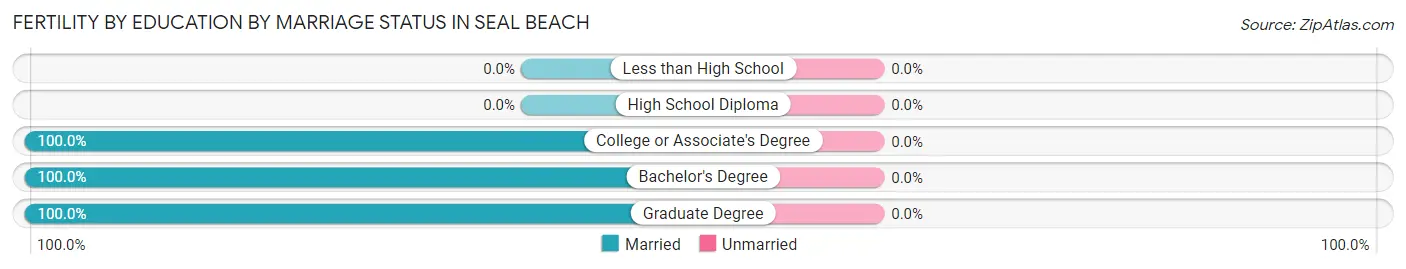
| Educational Attainment | Married | Unmarried |
| Less than High School | 0 (0.0%) | 0 (0.0%) |
| High School Diploma | 0 (0.0%) | 0 (0.0%) |
| College or Associate's Degree | 10 (100.0%) | 0 (0.0%) |
| Bachelor's Degree | 33 (100.0%) | 0 (0.0%) |
| Graduate Degree | 14 (100.0%) | 0 (0.0%) |
| Total | 57 (100.0%) | 0 (0.0%) |
Employment Characteristics in Seal Beach
Employment by Class of Employer in Seal Beach
Among the 9,026 employed individuals in Seal Beach, private company employees (5,136 | 56.9%), local government employees (1,162 | 12.9%), and not-for-profit organizations (866 | 9.6%) make up the most common classes of employment.
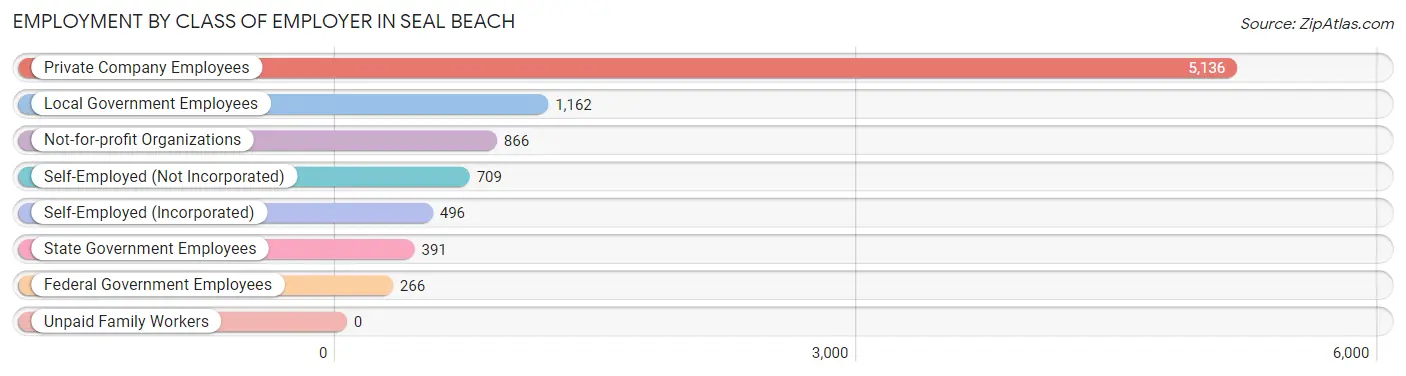
| Employer Class | # Employees | % Employees |
| Private Company Employees | 5,136 | 56.9% |
| Self-Employed (Incorporated) | 496 | 5.5% |
| Self-Employed (Not Incorporated) | 709 | 7.9% |
| Not-for-profit Organizations | 866 | 9.6% |
| Local Government Employees | 1,162 | 12.9% |
| State Government Employees | 391 | 4.3% |
| Federal Government Employees | 266 | 2.9% |
| Unpaid Family Workers | 0 | 0.0% |
| Total | 9,026 | 100.0% |
Employment Status by Age in Seal Beach
According to the labor force statistics for Seal Beach, out of the total population over 16 years of age (22,091), 43.6% or 9,632 individuals are in the labor force, with 4.2% or 405 of them unemployed. The age group with the highest labor force participation rate is 45 to 54 years, with 89.6% or 2,128 individuals in the labor force. Within the labor force, the 20 to 24 years age range has the highest percentage of unemployed individuals, with 13.7% or 42 of them being unemployed.
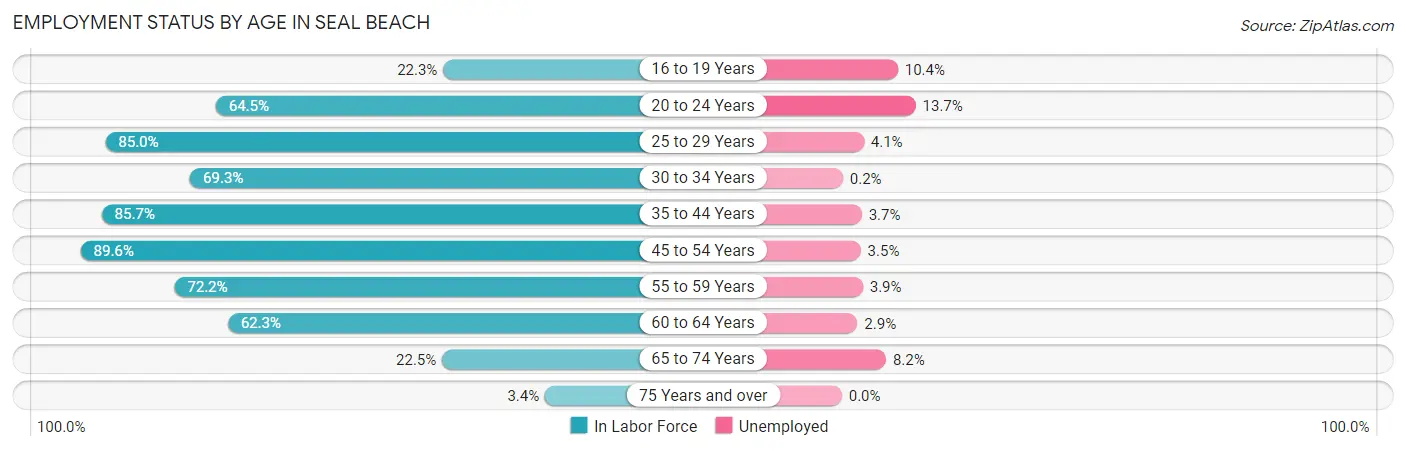
| Age Bracket | In Labor Force | Unemployed |
| 16 to 19 Years | 154 (22.3%) | 16 (10.4%) |
| 20 to 24 Years | 303 (64.5%) | 42 (13.7%) |
| 25 to 29 Years | 766 (85.0%) | 31 (4.1%) |
| 30 to 34 Years | 660 (69.3%) | 1 (0.2%) |
| 35 to 44 Years | 1,949 (85.7%) | 72 (3.7%) |
| 45 to 54 Years | 2,128 (89.6%) | 74 (3.5%) |
| 55 to 59 Years | 1,113 (72.2%) | 43 (3.9%) |
| 60 to 64 Years | 1,207 (62.3%) | 35 (2.9%) |
| 65 to 74 Years | 1,143 (22.5%) | 94 (8.2%) |
| 75 Years and over | 199 (3.4%) | 0 (0.0%) |
| Total | 9,632 (43.6%) | 405 (4.2%) |
Employment Status by Educational Attainment in Seal Beach
According to labor force statistics for Seal Beach, 78.4% of individuals (7,827) out of the total population between 25 and 64 years of age (9,983) are in the labor force, with 3.3% or 258 of them being unemployed. The group with the highest labor force participation rate are those with the educational attainment of bachelor's degree or higher, with 81.7% or 4,749 individuals in the labor force. Within the labor force, individuals with less than high school education have the highest percentage of unemployment, with 19.3% or 22 of them being unemployed.
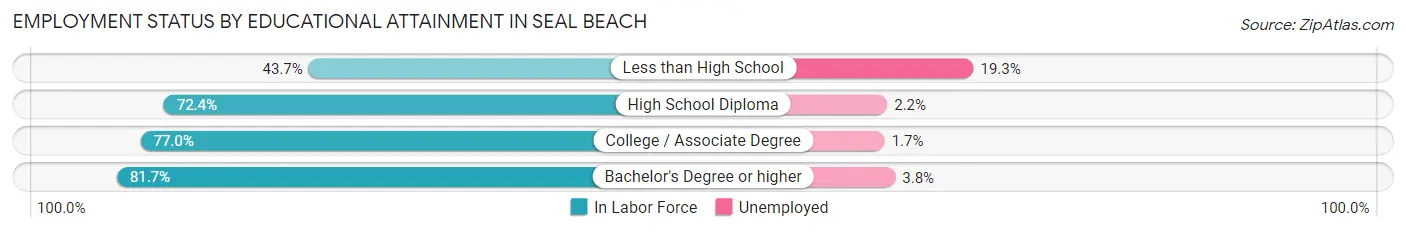
| Educational Attainment | In Labor Force | Unemployed |
| Less than High School | 114 (43.7%) | 50 (19.3%) |
| High School Diploma | 796 (72.4%) | 24 (2.2%) |
| College / Associate Degree | 2,164 (77.0%) | 48 (1.7%) |
| Bachelor's Degree or higher | 4,749 (81.7%) | 221 (3.8%) |
| Total | 7,827 (78.4%) | 329 (3.3%) |
Employment Occupations by Sex in Seal Beach
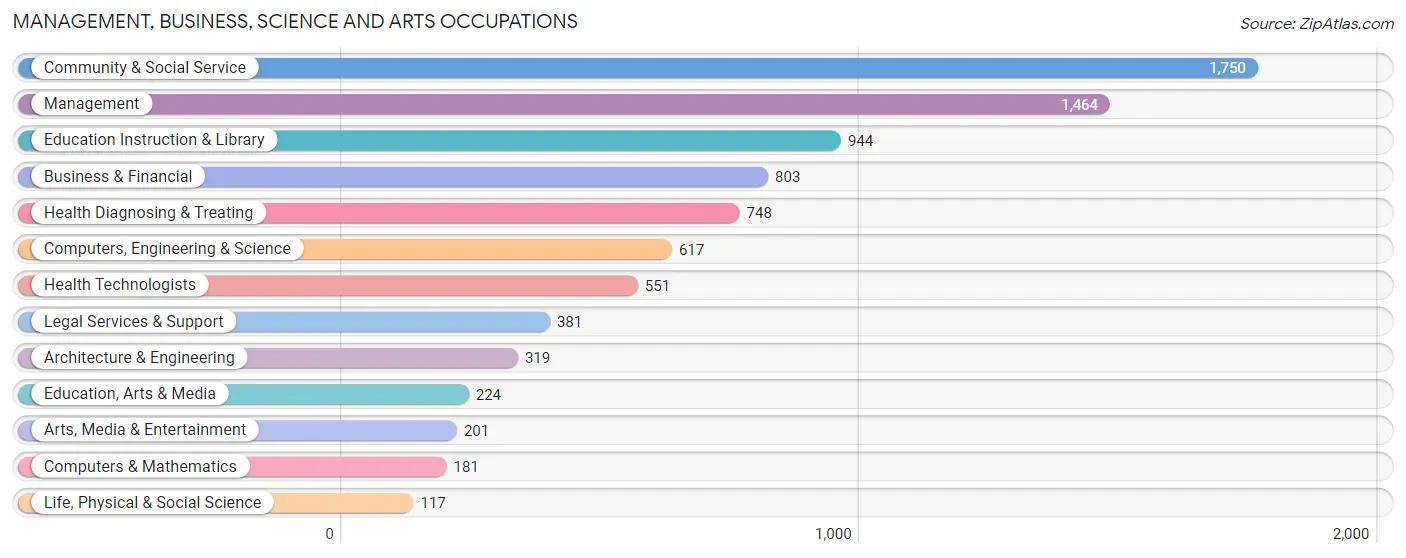
Management, Business, Science and Arts Occupations
The most common Management, Business, Science and Arts occupations in Seal Beach are Community & Social Service (1,750 | 19.3%), Management (1,464 | 16.2%), Education Instruction & Library (944 | 10.4%), Business & Financial (803 | 8.9%), and Health Diagnosing & Treating (748 | 8.3%).
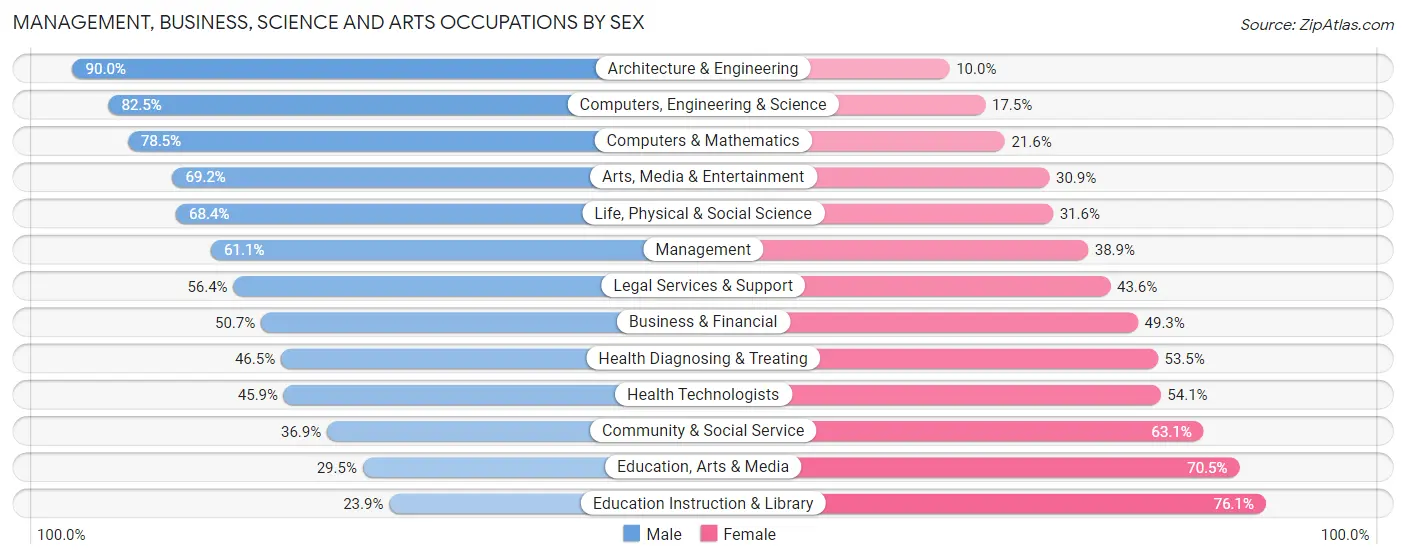
Management, Business, Science and Arts Occupations by Sex
Within the Management, Business, Science and Arts occupations in Seal Beach, the most male-oriented occupations are Architecture & Engineering (90.0%), Computers, Engineering & Science (82.5%), and Computers & Mathematics (78.4%), while the most female-oriented occupations are Education Instruction & Library (76.1%), Education, Arts & Media (70.5%), and Community & Social Service (63.1%).
| Occupation | Male | Female |
| Management | 894 (61.1%) | 570 (38.9%) |
| Business & Financial | 407 (50.7%) | 396 (49.3%) |
| Computers, Engineering & Science | 509 (82.5%) | 108 (17.5%) |
| Computers & Mathematics | 142 (78.4%) | 39 (21.5%) |
| Architecture & Engineering | 287 (90.0%) | 32 (10.0%) |
| Life, Physical & Social Science | 80 (68.4%) | 37 (31.6%) |
| Community & Social Service | 646 (36.9%) | 1,104 (63.1%) |
| Education, Arts & Media | 66 (29.5%) | 158 (70.5%) |
| Legal Services & Support | 215 (56.4%) | 166 (43.6%) |
| Education Instruction & Library | 226 (23.9%) | 718 (76.1%) |
| Arts, Media & Entertainment | 139 (69.2%) | 62 (30.8%) |
| Health Diagnosing & Treating | 348 (46.5%) | 400 (53.5%) |
| Health Technologists | 253 (45.9%) | 298 (54.1%) |
| Total (Category) | 2,804 (52.1%) | 2,578 (47.9%) |
| Total (Overall) | 4,730 (52.3%) | 4,318 (47.7%) |
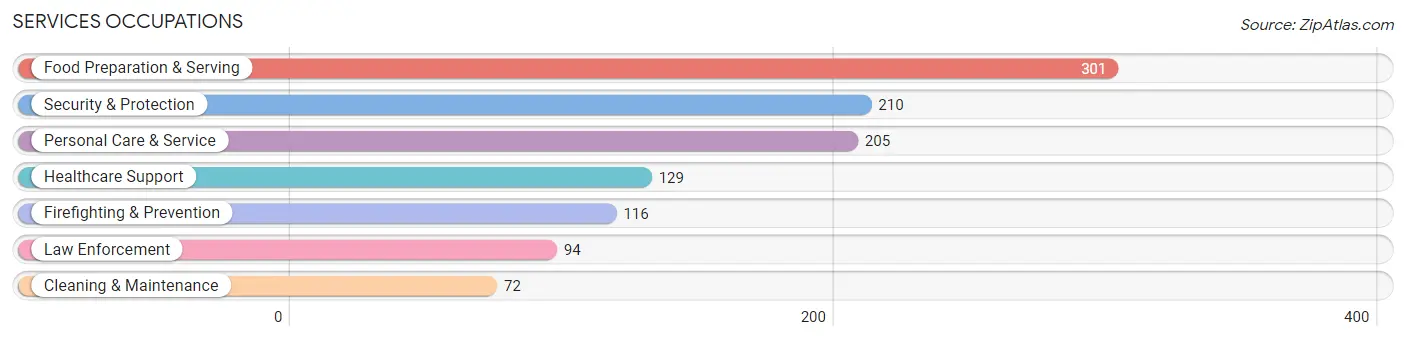
Services Occupations
The most common Services occupations in Seal Beach are Food Preparation & Serving (301 | 3.3%), Security & Protection (210 | 2.3%), Personal Care & Service (205 | 2.3%), Healthcare Support (129 | 1.4%), and Firefighting & Prevention (116 | 1.3%).
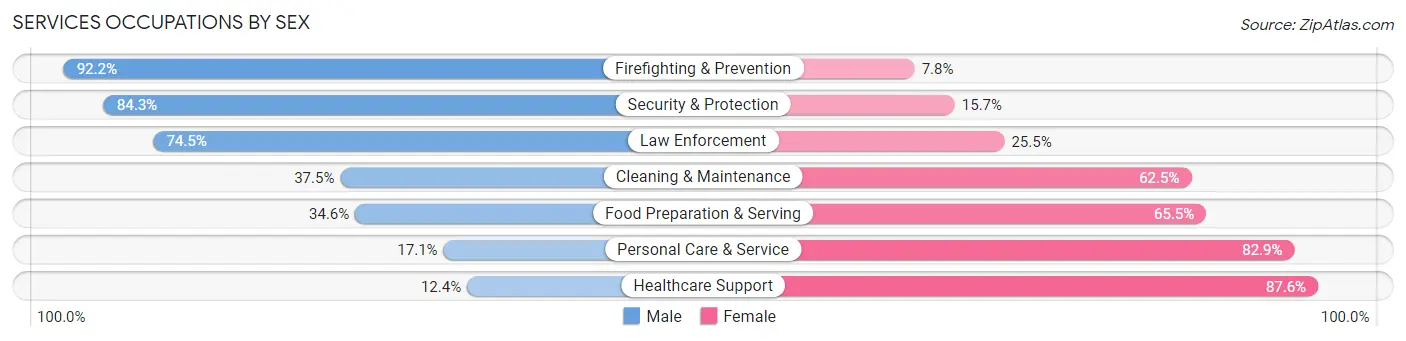
Services Occupations by Sex
Within the Services occupations in Seal Beach, the most male-oriented occupations are Firefighting & Prevention (92.2%), Security & Protection (84.3%), and Law Enforcement (74.5%), while the most female-oriented occupations are Healthcare Support (87.6%), Personal Care & Service (82.9%), and Food Preparation & Serving (65.4%).
| Occupation | Male | Female |
| Healthcare Support | 16 (12.4%) | 113 (87.6%) |
| Security & Protection | 177 (84.3%) | 33 (15.7%) |
| Firefighting & Prevention | 107 (92.2%) | 9 (7.8%) |
| Law Enforcement | 70 (74.5%) | 24 (25.5%) |
| Food Preparation & Serving | 104 (34.5%) | 197 (65.4%) |
| Cleaning & Maintenance | 27 (37.5%) | 45 (62.5%) |
| Personal Care & Service | 35 (17.1%) | 170 (82.9%) |
| Total (Category) | 359 (39.2%) | 558 (60.9%) |
| Total (Overall) | 4,730 (52.3%) | 4,318 (47.7%) |
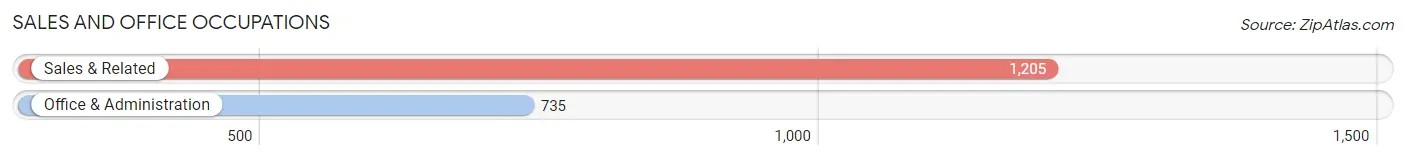
Sales and Office Occupations
The most common Sales and Office occupations in Seal Beach are Sales & Related (1,205 | 13.3%), and Office & Administration (735 | 8.1%).
Sales and Office Occupations by Sex
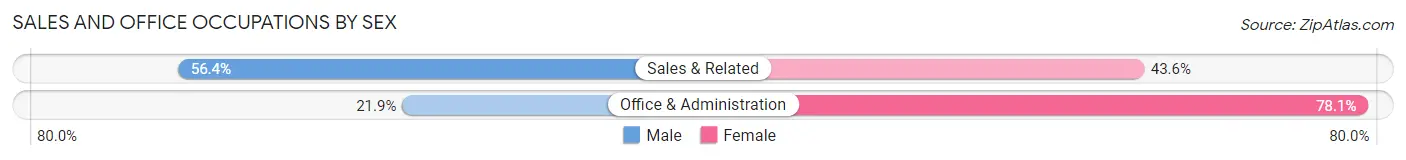
| Occupation | Male | Female |
| Sales & Related | 680 (56.4%) | 525 (43.6%) |
| Office & Administration | 161 (21.9%) | 574 (78.1%) |
| Total (Category) | 841 (43.3%) | 1,099 (56.7%) |
| Total (Overall) | 4,730 (52.3%) | 4,318 (47.7%) |
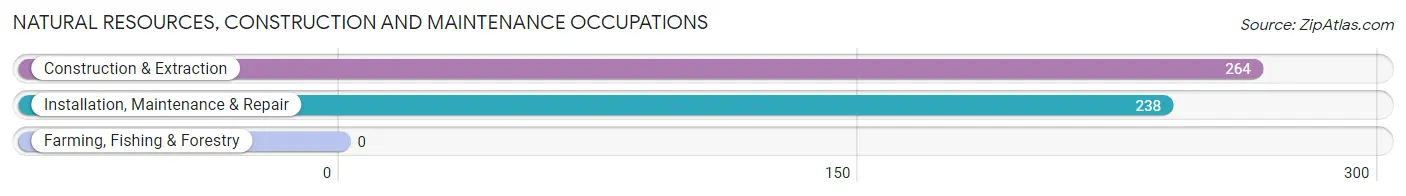
Natural Resources, Construction and Maintenance Occupations
The most common Natural Resources, Construction and Maintenance occupations in Seal Beach are Construction & Extraction (264 | 2.9%), and Installation, Maintenance & Repair (238 | 2.6%).
Natural Resources, Construction and Maintenance Occupations by Sex
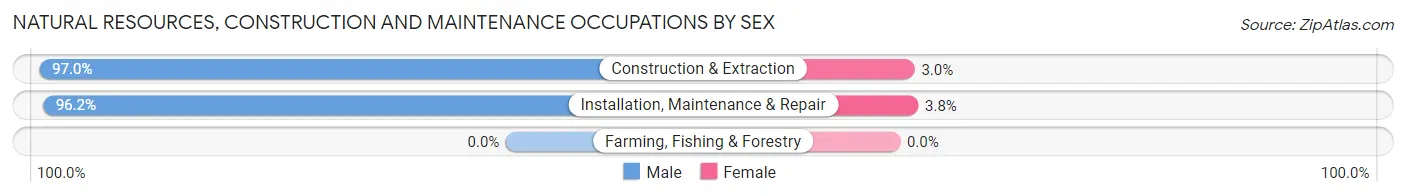
| Occupation | Male | Female |
| Farming, Fishing & Forestry | 0 (0.0%) | 0 (0.0%) |
| Construction & Extraction | 256 (97.0%) | 8 (3.0%) |
| Installation, Maintenance & Repair | 229 (96.2%) | 9 (3.8%) |
| Total (Category) | 485 (96.6%) | 17 (3.4%) |
| Total (Overall) | 4,730 (52.3%) | 4,318 (47.7%) |
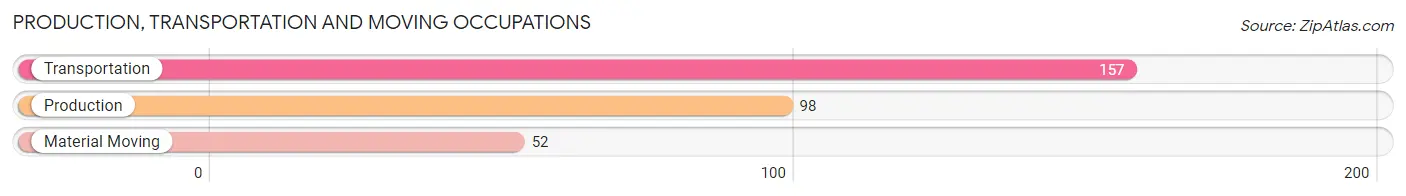
Production, Transportation and Moving Occupations
The most common Production, Transportation and Moving occupations in Seal Beach are Transportation (157 | 1.7%), Production (98 | 1.1%), and Material Moving (52 | 0.6%).
Production, Transportation and Moving Occupations by Sex
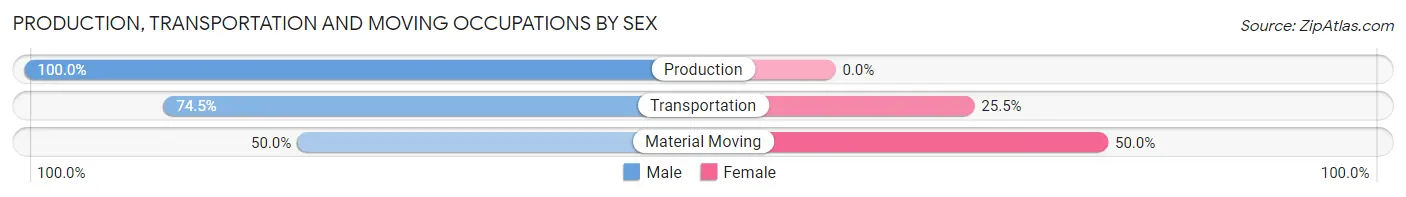
| Occupation | Male | Female |
| Production | 98 (100.0%) | 0 (0.0%) |
| Transportation | 117 (74.5%) | 40 (25.5%) |
| Material Moving | 26 (50.0%) | 26 (50.0%) |
| Total (Category) | 241 (78.5%) | 66 (21.5%) |
| Total (Overall) | 4,730 (52.3%) | 4,318 (47.7%) |
Employment Industries by Sex in Seal Beach
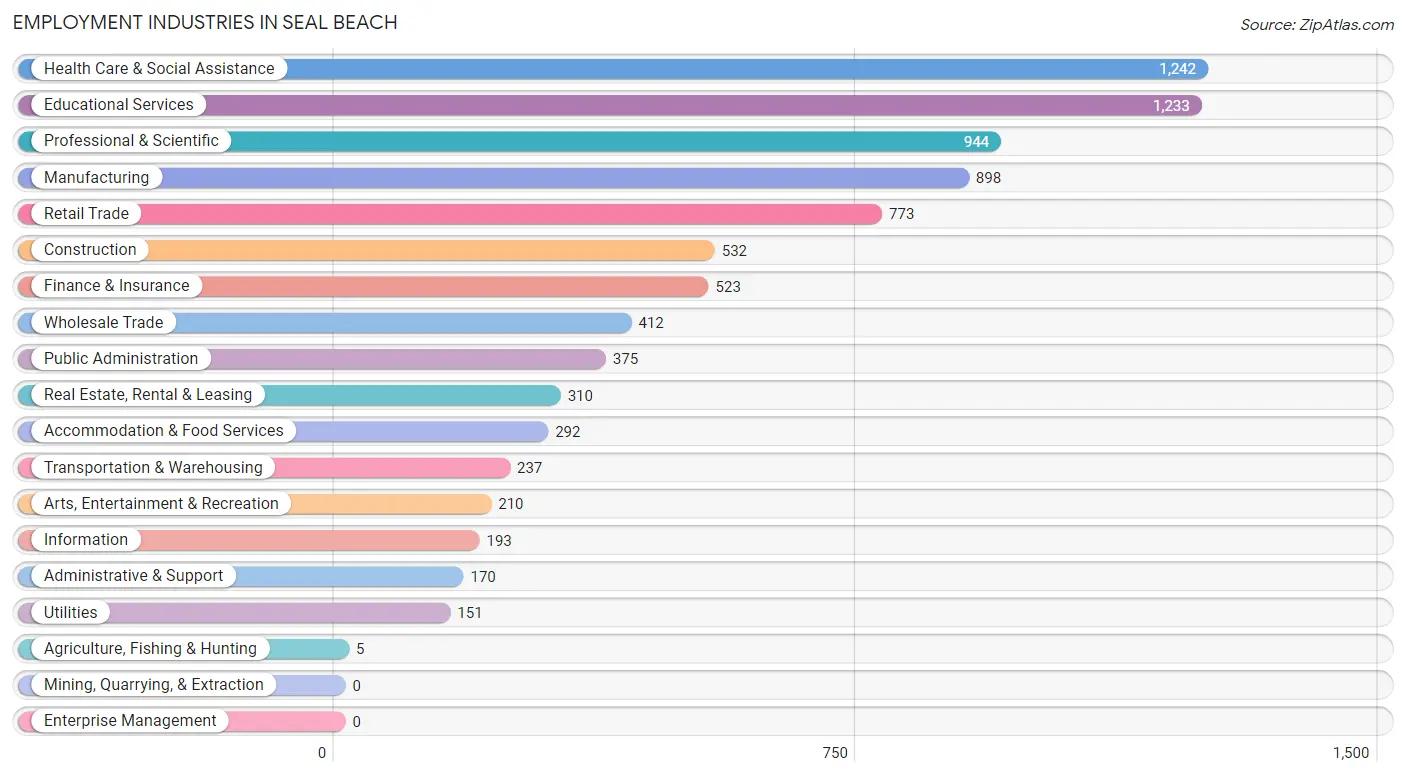
Employment Industries in Seal Beach
The major employment industries in Seal Beach include Health Care & Social Assistance (1,242 | 13.7%), Educational Services (1,233 | 13.6%), Professional & Scientific (944 | 10.4%), Manufacturing (898 | 9.9%), and Retail Trade (773 | 8.5%).
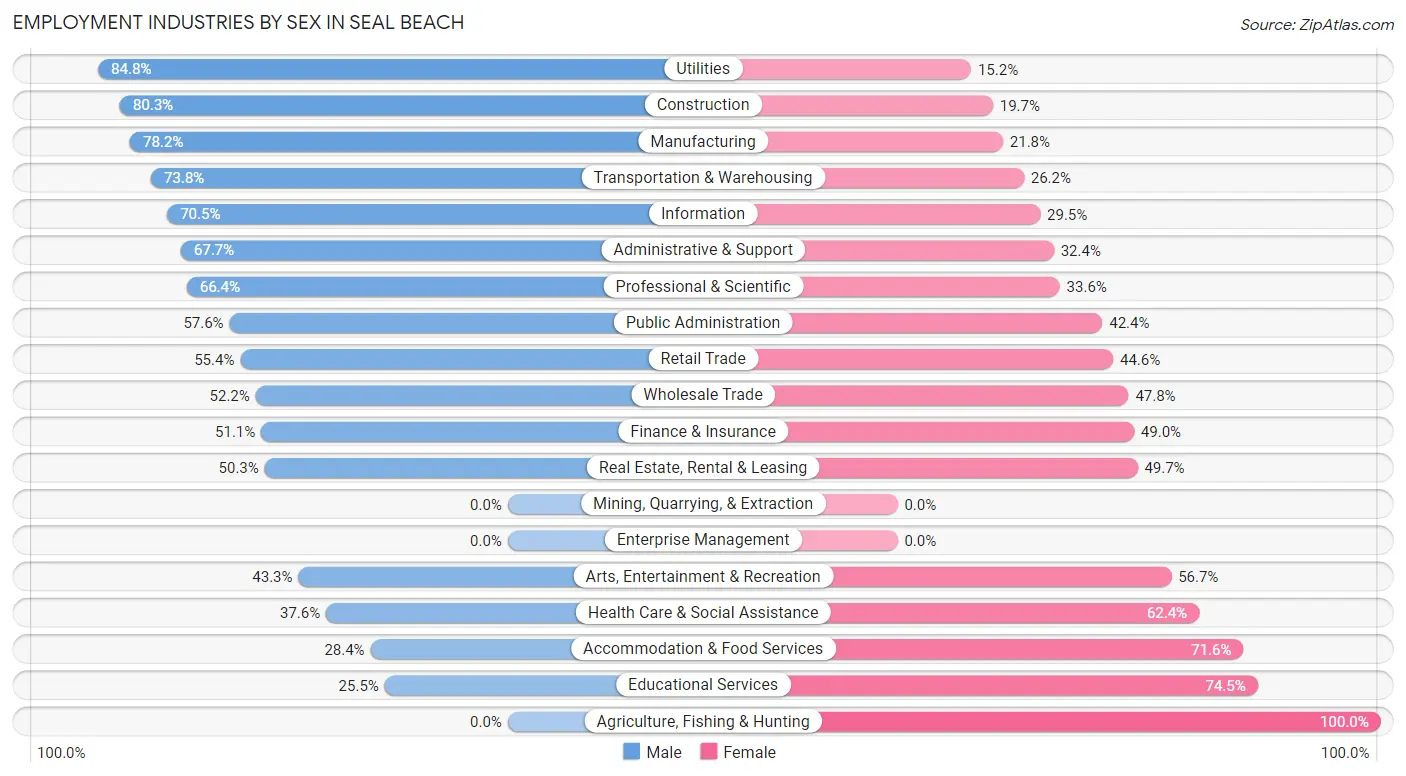
Employment Industries by Sex in Seal Beach
The Seal Beach industries that see more men than women are Utilities (84.8%), Construction (80.3%), and Manufacturing (78.2%), whereas the industries that tend to have a higher number of women are Agriculture, Fishing & Hunting (100.0%), Educational Services (74.5%), and Accommodation & Food Services (71.6%).
| Industry | Male | Female |
| Agriculture, Fishing & Hunting | 0 (0.0%) | 5 (100.0%) |
| Mining, Quarrying, & Extraction | 0 (0.0%) | 0 (0.0%) |
| Construction | 427 (80.3%) | 105 (19.7%) |
| Manufacturing | 702 (78.2%) | 196 (21.8%) |
| Wholesale Trade | 215 (52.2%) | 197 (47.8%) |
| Retail Trade | 428 (55.4%) | 345 (44.6%) |
| Transportation & Warehousing | 175 (73.8%) | 62 (26.2%) |
| Utilities | 128 (84.8%) | 23 (15.2%) |
| Information | 136 (70.5%) | 57 (29.5%) |
| Finance & Insurance | 267 (51.0%) | 256 (48.9%) |
| Real Estate, Rental & Leasing | 156 (50.3%) | 154 (49.7%) |
| Professional & Scientific | 627 (66.4%) | 317 (33.6%) |
| Enterprise Management | 0 (0.0%) | 0 (0.0%) |
| Administrative & Support | 115 (67.6%) | 55 (32.4%) |
| Educational Services | 314 (25.5%) | 919 (74.5%) |
| Health Care & Social Assistance | 467 (37.6%) | 775 (62.4%) |
| Arts, Entertainment & Recreation | 91 (43.3%) | 119 (56.7%) |
| Accommodation & Food Services | 83 (28.4%) | 209 (71.6%) |
| Public Administration | 216 (57.6%) | 159 (42.4%) |
| Total | 4,730 (52.3%) | 4,318 (47.7%) |
Education in Seal Beach
School Enrollment in Seal Beach
The most common levels of schooling among the 3,969 students in Seal Beach are high school (927 | 23.4%), middle school (856 | 21.6%), and elementary school (706 | 17.8%).
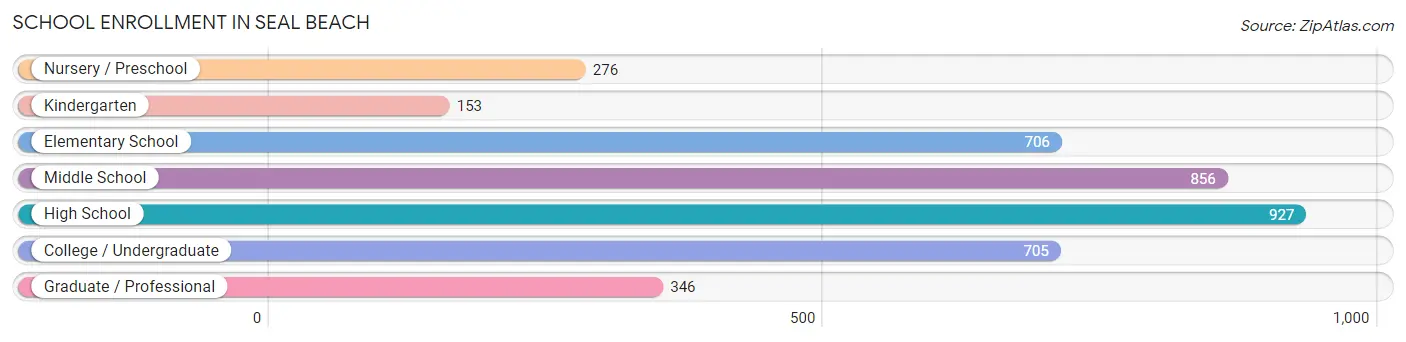
| School Level | # Students | % Students |
| Nursery / Preschool | 276 | 7.0% |
| Kindergarten | 153 | 3.8% |
| Elementary School | 706 | 17.8% |
| Middle School | 856 | 21.6% |
| High School | 927 | 23.4% |
| College / Undergraduate | 705 | 17.8% |
| Graduate / Professional | 346 | 8.7% |
| Total | 3,969 | 100.0% |
School Enrollment by Age by Funding Source in Seal Beach
Out of a total of 3,969 students who are enrolled in schools in Seal Beach, 639 (16.1%) attend a private institution, while the remaining 3,330 (83.9%) are enrolled in public schools. The age group of 3 to 4 year olds has the highest likelihood of being enrolled in private schools, with 106 (54.6% in the age bracket) enrolled. Conversely, the age group of 18 to 19 year olds has the lowest likelihood of being enrolled in a private school, with 270 (96.4% in the age bracket) attending a public institution.
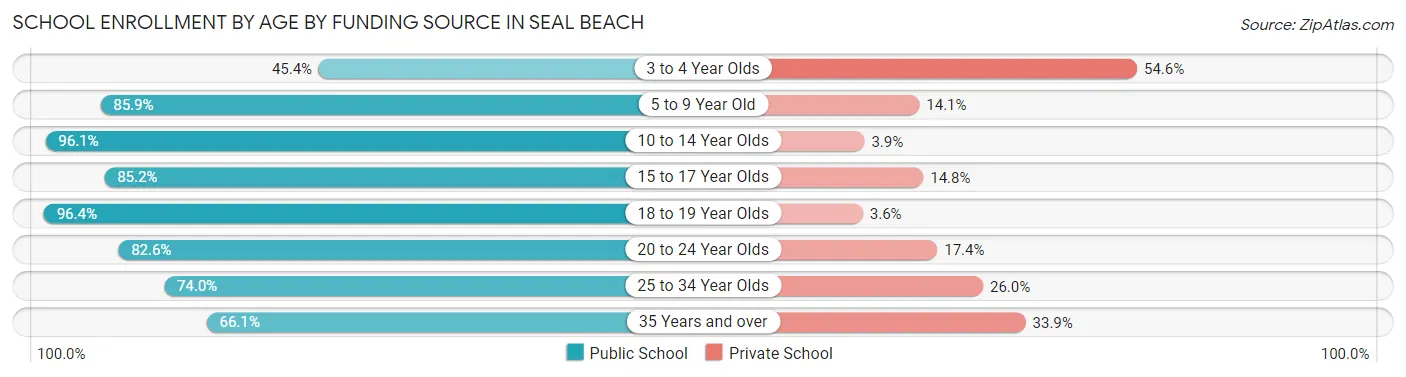
| Age Bracket | Public School | Private School |
| 3 to 4 Year Olds | 88 (45.4%) | 106 (54.6%) |
| 5 to 9 Year Old | 743 (85.9%) | 122 (14.1%) |
| 10 to 14 Year Olds | 945 (96.1%) | 38 (3.9%) |
| 15 to 17 Year Olds | 586 (85.2%) | 102 (14.8%) |
| 18 to 19 Year Olds | 270 (96.4%) | 10 (3.6%) |
| 20 to 24 Year Olds | 213 (82.6%) | 45 (17.4%) |
| 25 to 34 Year Olds | 211 (74.0%) | 74 (26.0%) |
| 35 Years and over | 275 (66.1%) | 141 (33.9%) |
| Total | 3,330 (83.9%) | 639 (16.1%) |
Educational Attainment by Field of Study in Seal Beach
Business (1,840 | 16.0%), education (1,319 | 11.5%), social sciences (1,085 | 9.4%), science & technology (1,042 | 9.1%), and engineering (1,018 | 8.9%) are the most common fields of study among 11,496 individuals in Seal Beach who have obtained a bachelor's degree or higher.
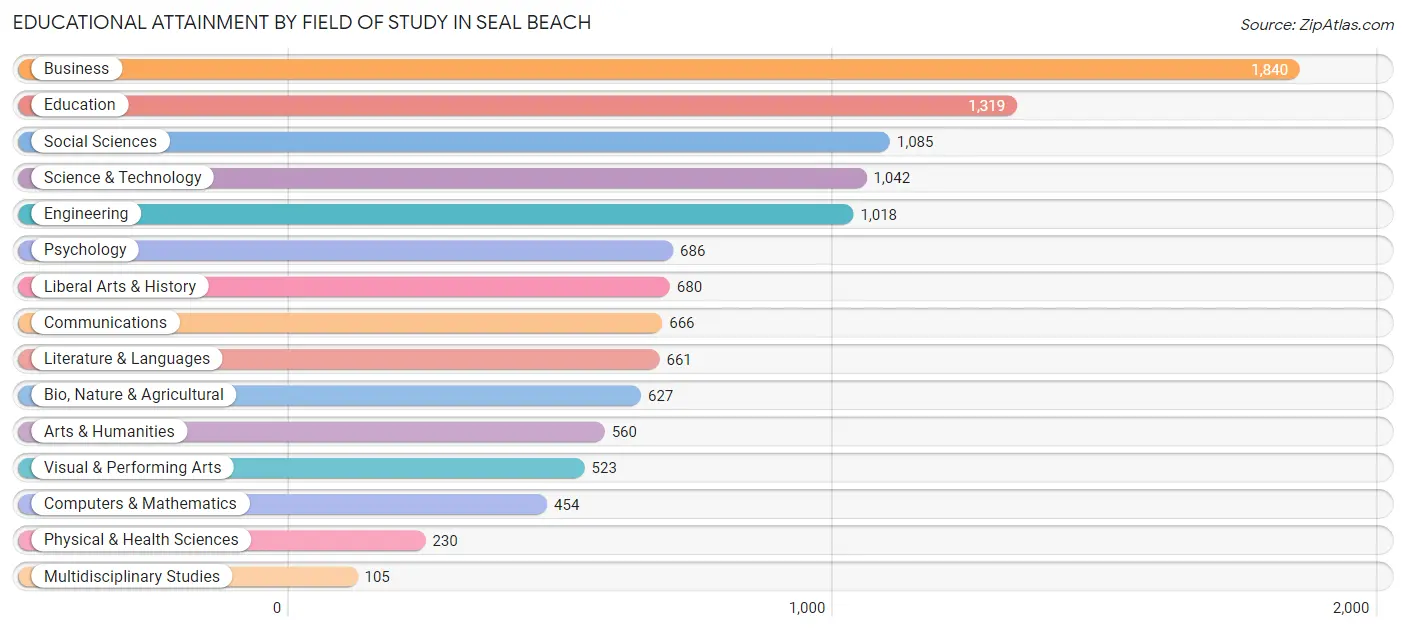
| Field of Study | # Graduates | % Graduates |
| Computers & Mathematics | 454 | 4.0% |
| Bio, Nature & Agricultural | 627 | 5.4% |
| Physical & Health Sciences | 230 | 2.0% |
| Psychology | 686 | 6.0% |
| Social Sciences | 1,085 | 9.4% |
| Engineering | 1,018 | 8.9% |
| Multidisciplinary Studies | 105 | 0.9% |
| Science & Technology | 1,042 | 9.1% |
| Business | 1,840 | 16.0% |
| Education | 1,319 | 11.5% |
| Literature & Languages | 661 | 5.8% |
| Liberal Arts & History | 680 | 5.9% |
| Visual & Performing Arts | 523 | 4.5% |
| Communications | 666 | 5.8% |
| Arts & Humanities | 560 | 4.9% |
| Total | 11,496 | 100.0% |
Transportation & Commute in Seal Beach
Vehicle Availability by Sex in Seal Beach
The most prevalent vehicle ownership categories in Seal Beach are males with 2 vehicles (2,199, accounting for 45.8%) and females with 2 vehicles (1,846, making up 52.4%).
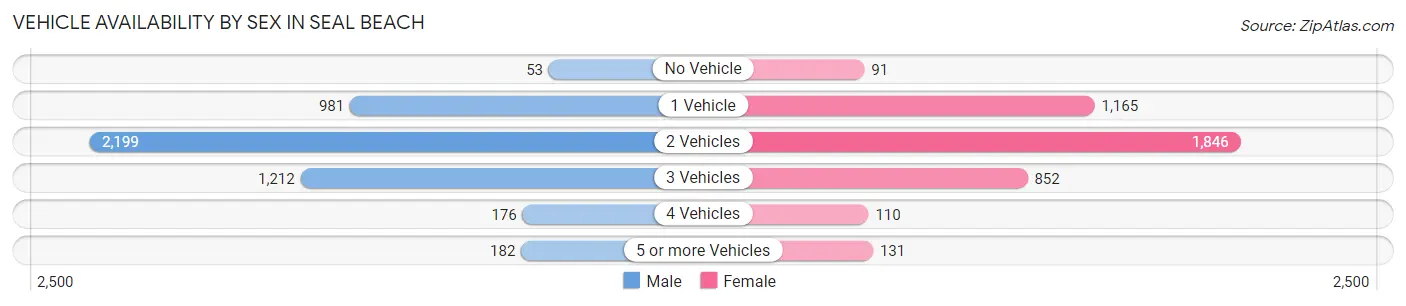
| Vehicles Available | Male | Female |
| No Vehicle | 53 (1.1%) | 91 (2.2%) |
| 1 Vehicle | 981 (20.4%) | 1,165 (27.8%) |
| 2 Vehicles | 2,199 (45.8%) | 1,846 (44.0%) |
| 3 Vehicles | 1,212 (25.2%) | 852 (20.3%) |
| 4 Vehicles | 176 (3.7%) | 110 (2.6%) |
| 5 or more Vehicles | 182 (3.8%) | 131 (3.1%) |
| Total | 4,803 (100.0%) | 4,195 (100.0%) |
Commute Time in Seal Beach
The most frequently occuring commute durations in Seal Beach are 30 to 34 minutes (1,211 commuters, 16.9%), 45 to 59 minutes (1,104 commuters, 15.4%), and 20 to 24 minutes (1,038 commuters, 14.5%).
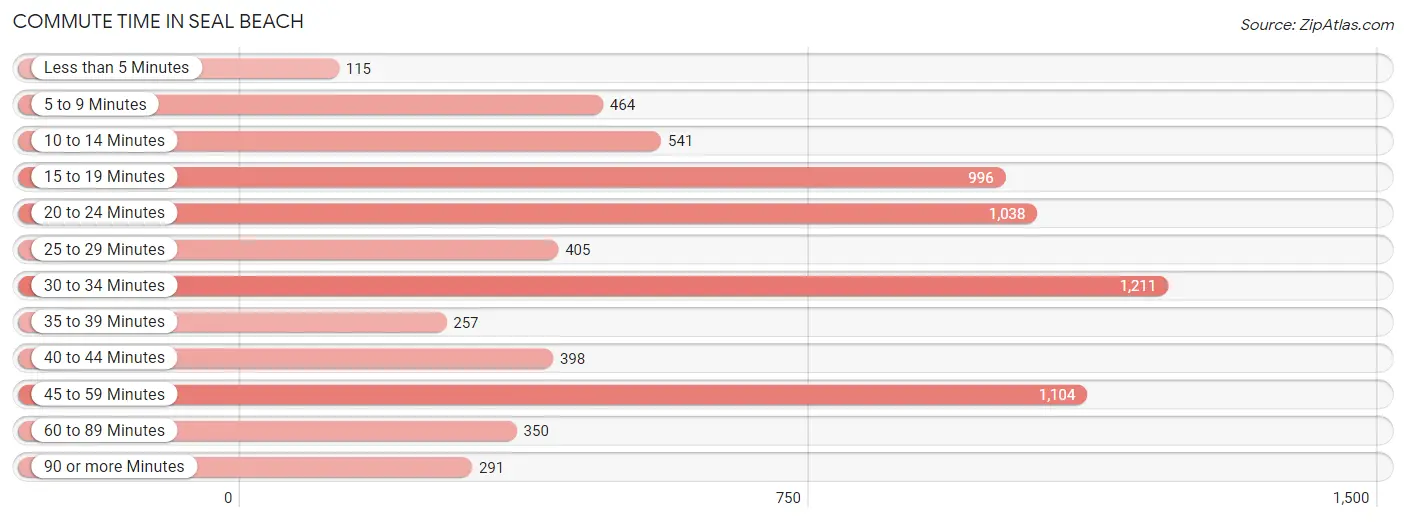
| Commute Time | # Commuters | % Commuters |
| Less than 5 Minutes | 115 | 1.6% |
| 5 to 9 Minutes | 464 | 6.5% |
| 10 to 14 Minutes | 541 | 7.5% |
| 15 to 19 Minutes | 996 | 13.9% |
| 20 to 24 Minutes | 1,038 | 14.5% |
| 25 to 29 Minutes | 405 | 5.7% |
| 30 to 34 Minutes | 1,211 | 16.9% |
| 35 to 39 Minutes | 257 | 3.6% |
| 40 to 44 Minutes | 398 | 5.6% |
| 45 to 59 Minutes | 1,104 | 15.4% |
| 60 to 89 Minutes | 350 | 4.9% |
| 90 or more Minutes | 291 | 4.1% |
Commute Time by Sex in Seal Beach
The most common commute times in Seal Beach are 30 to 34 minutes (698 commuters, 17.3%) for males and 20 to 24 minutes (520 commuters, 16.6%) for females.
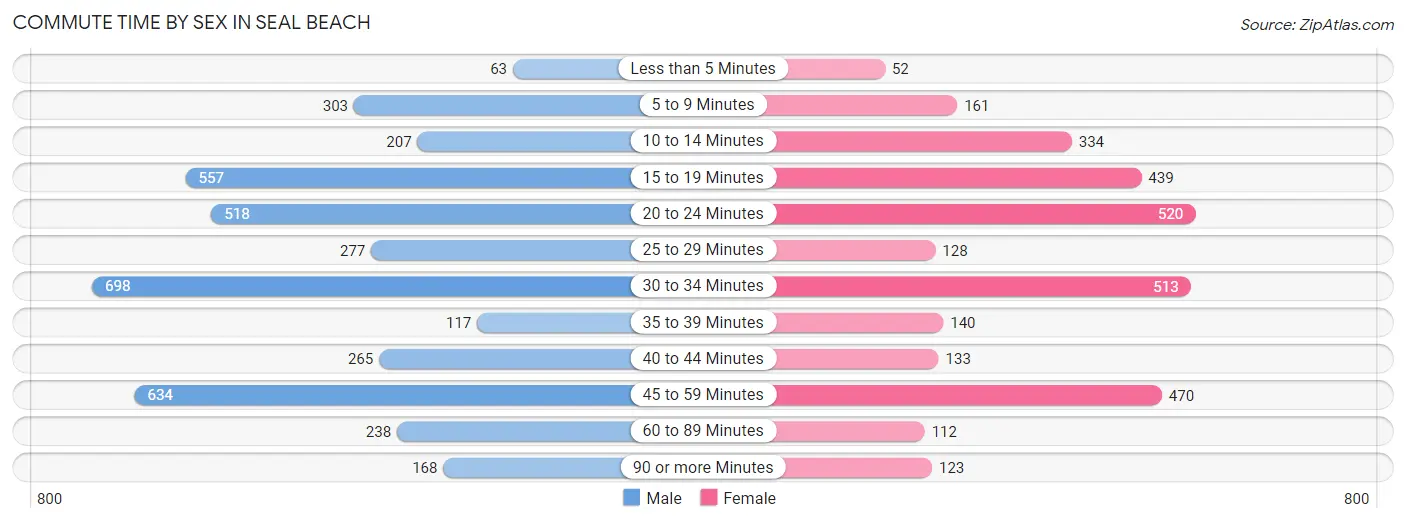
| Commute Time | Male | Female |
| Less than 5 Minutes | 63 (1.6%) | 52 (1.7%) |
| 5 to 9 Minutes | 303 (7.5%) | 161 (5.1%) |
| 10 to 14 Minutes | 207 (5.1%) | 334 (10.7%) |
| 15 to 19 Minutes | 557 (13.8%) | 439 (14.1%) |
| 20 to 24 Minutes | 518 (12.8%) | 520 (16.6%) |
| 25 to 29 Minutes | 277 (6.9%) | 128 (4.1%) |
| 30 to 34 Minutes | 698 (17.3%) | 513 (16.4%) |
| 35 to 39 Minutes | 117 (2.9%) | 140 (4.5%) |
| 40 to 44 Minutes | 265 (6.6%) | 133 (4.3%) |
| 45 to 59 Minutes | 634 (15.7%) | 470 (15.0%) |
| 60 to 89 Minutes | 238 (5.9%) | 112 (3.6%) |
| 90 or more Minutes | 168 (4.2%) | 123 (3.9%) |
Time of Departure to Work by Sex in Seal Beach
The most frequent times of departure to work in Seal Beach are 7:00 AM to 7:29 AM (584, 14.4%) for males and 7:00 AM to 7:29 AM (579, 18.5%) for females.
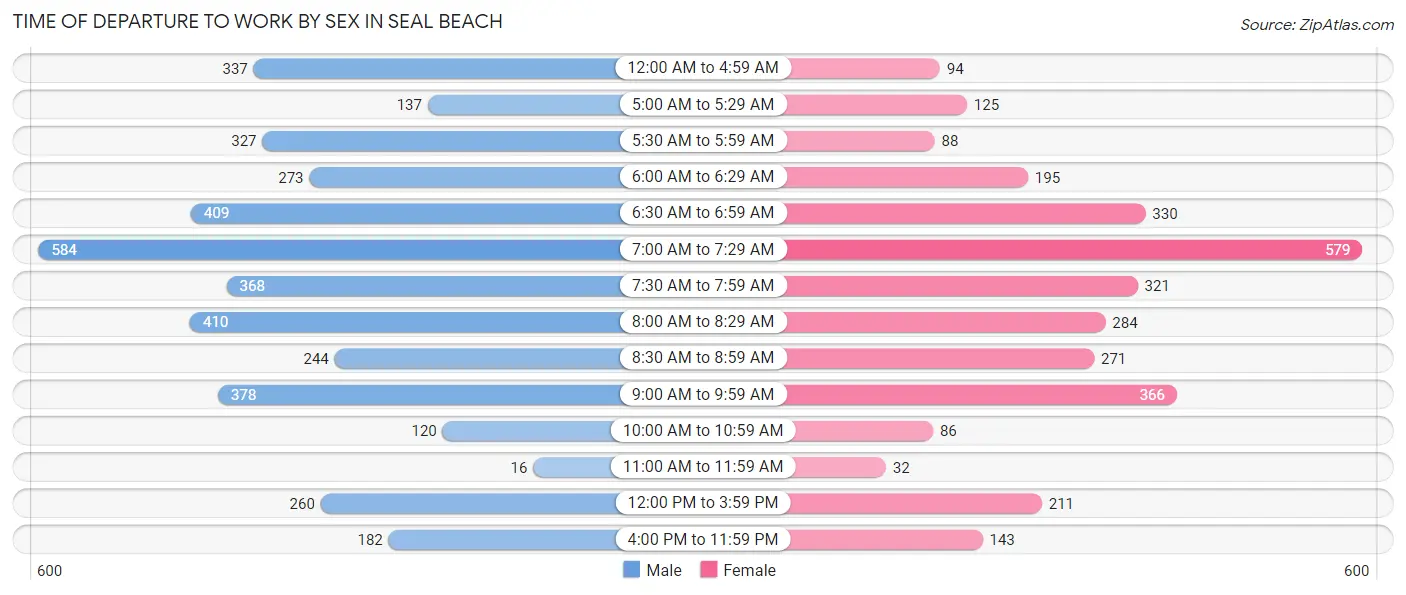
| Time of Departure | Male | Female |
| 12:00 AM to 4:59 AM | 337 (8.3%) | 94 (3.0%) |
| 5:00 AM to 5:29 AM | 137 (3.4%) | 125 (4.0%) |
| 5:30 AM to 5:59 AM | 327 (8.1%) | 88 (2.8%) |
| 6:00 AM to 6:29 AM | 273 (6.8%) | 195 (6.2%) |
| 6:30 AM to 6:59 AM | 409 (10.1%) | 330 (10.6%) |
| 7:00 AM to 7:29 AM | 584 (14.4%) | 579 (18.5%) |
| 7:30 AM to 7:59 AM | 368 (9.1%) | 321 (10.3%) |
| 8:00 AM to 8:29 AM | 410 (10.1%) | 284 (9.1%) |
| 8:30 AM to 8:59 AM | 244 (6.0%) | 271 (8.7%) |
| 9:00 AM to 9:59 AM | 378 (9.3%) | 366 (11.7%) |
| 10:00 AM to 10:59 AM | 120 (3.0%) | 86 (2.8%) |
| 11:00 AM to 11:59 AM | 16 (0.4%) | 32 (1.0%) |
| 12:00 PM to 3:59 PM | 260 (6.4%) | 211 (6.8%) |
| 4:00 PM to 11:59 PM | 182 (4.5%) | 143 (4.6%) |
| Total | 4,045 (100.0%) | 3,125 (100.0%) |
Housing Occupancy in Seal Beach
Occupancy by Ownership in Seal Beach
Of the total 13,203 dwellings in Seal Beach, owner-occupied units account for 10,056 (76.2%), while renter-occupied units make up 3,147 (23.8%).
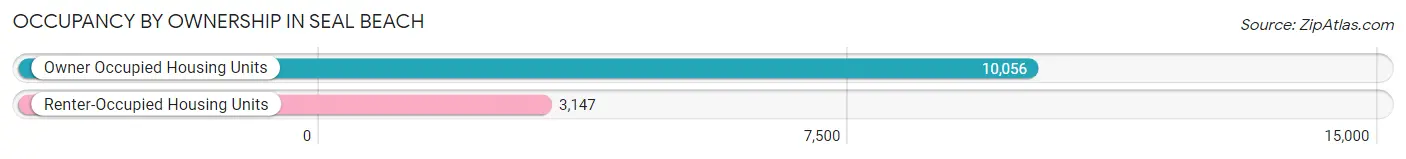
| Occupancy | # Housing Units | % Housing Units |
| Owner Occupied Housing Units | 10,056 | 76.2% |
| Renter-Occupied Housing Units | 3,147 | 23.8% |
| Total Occupied Housing Units | 13,203 | 100.0% |
Occupancy by Household Size in Seal Beach
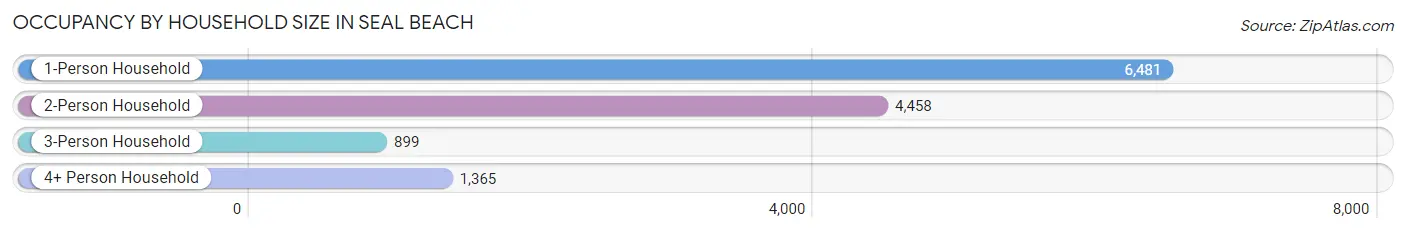
| Household Size | # Housing Units | % Housing Units |
| 1-Person Household | 6,481 | 49.1% |
| 2-Person Household | 4,458 | 33.8% |
| 3-Person Household | 899 | 6.8% |
| 4+ Person Household | 1,365 | 10.3% |
| Total Housing Units | 13,203 | 100.0% |
Occupancy by Ownership by Household Size in Seal Beach
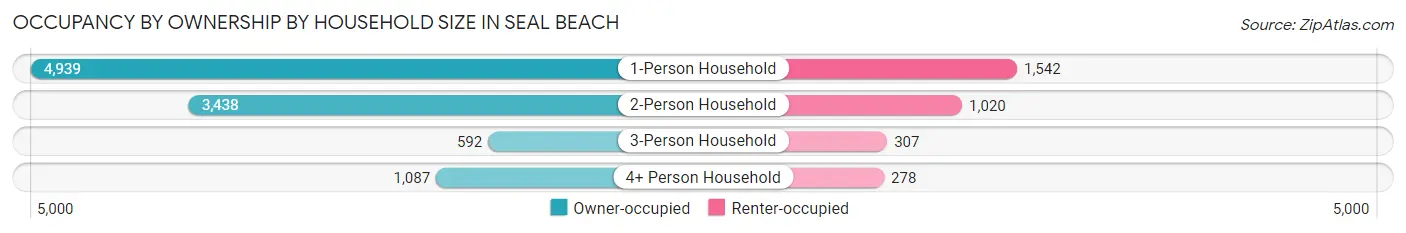
| Household Size | Owner-occupied | Renter-occupied |
| 1-Person Household | 4,939 (76.2%) | 1,542 (23.8%) |
| 2-Person Household | 3,438 (77.1%) | 1,020 (22.9%) |
| 3-Person Household | 592 (65.8%) | 307 (34.2%) |
| 4+ Person Household | 1,087 (79.6%) | 278 (20.4%) |
| Total Housing Units | 10,056 (76.2%) | 3,147 (23.8%) |
Occupancy by Educational Attainment in Seal Beach
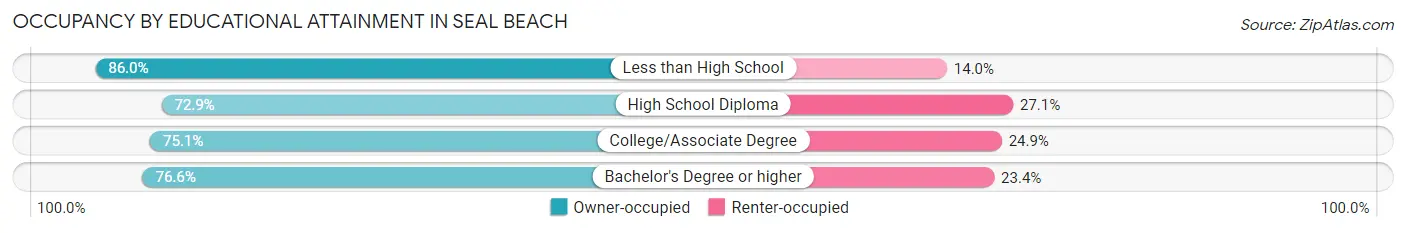
| Household Size | Owner-occupied | Renter-occupied |
| Less than High School | 558 (86.0%) | 91 (14.0%) |
| High School Diploma | 1,283 (72.9%) | 478 (27.1%) |
| College/Associate Degree | 2,698 (75.1%) | 894 (24.9%) |
| Bachelor's Degree or higher | 5,517 (76.6%) | 1,684 (23.4%) |
Occupancy by Age of Householder in Seal Beach
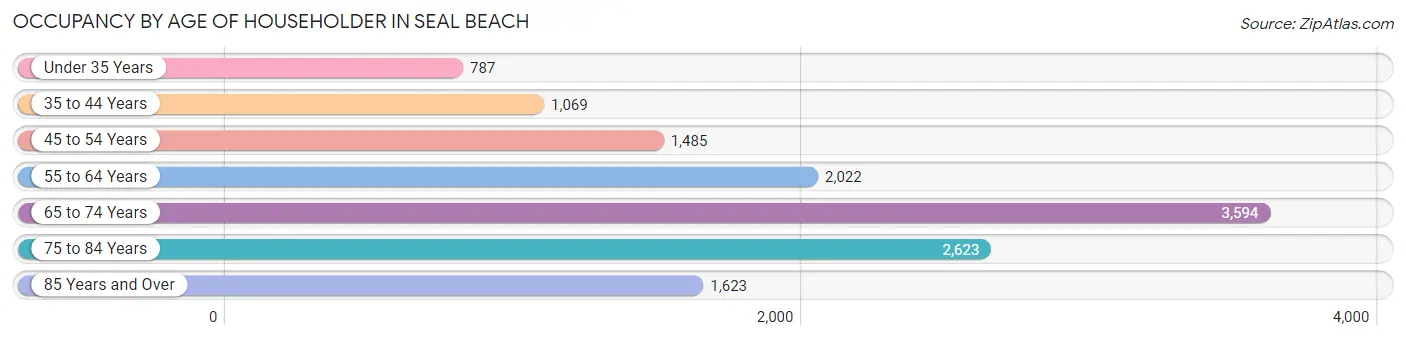
| Age Bracket | # Households | % Households |
| Under 35 Years | 787 | 6.0% |
| 35 to 44 Years | 1,069 | 8.1% |
| 45 to 54 Years | 1,485 | 11.3% |
| 55 to 64 Years | 2,022 | 15.3% |
| 65 to 74 Years | 3,594 | 27.2% |
| 75 to 84 Years | 2,623 | 19.9% |
| 85 Years and Over | 1,623 | 12.3% |
| Total | 13,203 | 100.0% |
Housing Finances in Seal Beach
Median Income by Occupancy in Seal Beach
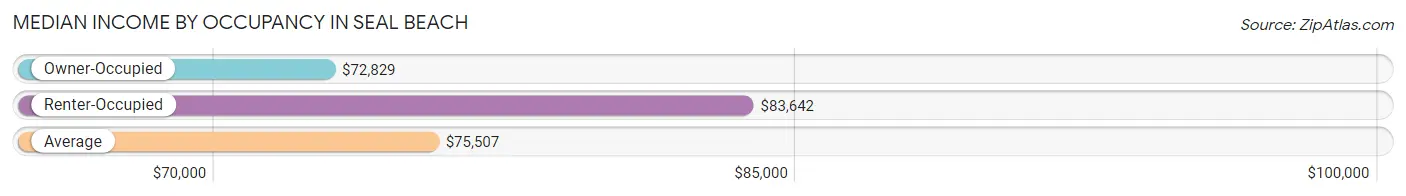
| Occupancy Type | # Households | Median Income |
| Owner-Occupied | 10,056 (76.2%) | $72,829 |
| Renter-Occupied | 3,147 (23.8%) | $83,642 |
| Average | 13,203 (100.0%) | $75,507 |
Occupancy by Householder Income Bracket in Seal Beach
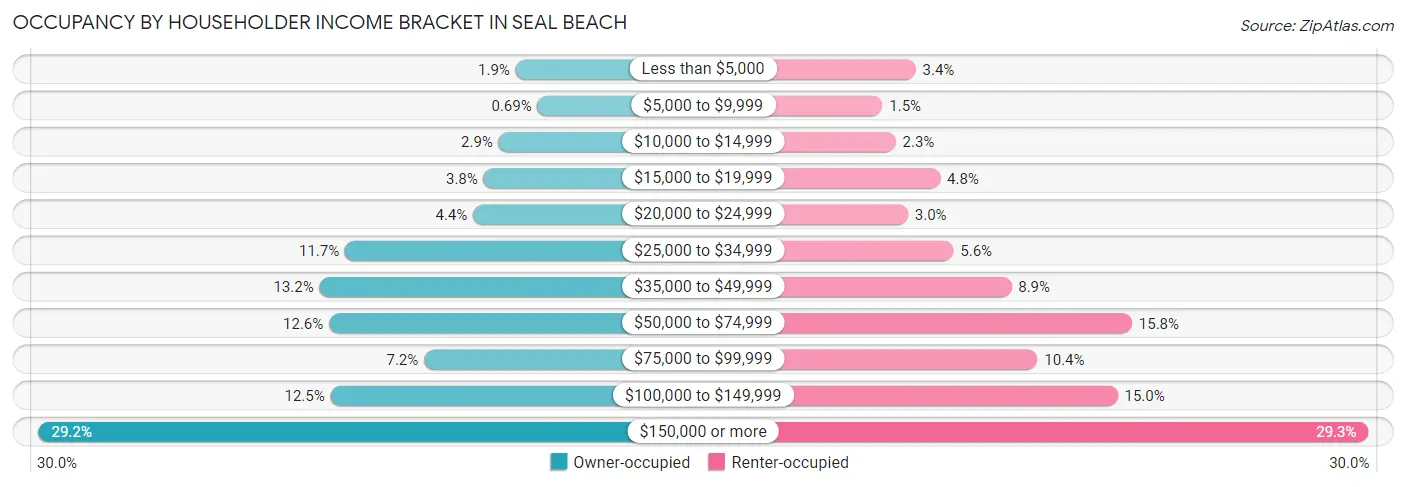
| Income Bracket | Owner-occupied | Renter-occupied |
| Less than $5,000 | 195 (1.9%) | 108 (3.4%) |
| $5,000 to $9,999 | 69 (0.7%) | 48 (1.5%) |
| $10,000 to $14,999 | 293 (2.9%) | 72 (2.3%) |
| $15,000 to $19,999 | 379 (3.8%) | 152 (4.8%) |
| $20,000 to $24,999 | 439 (4.4%) | 94 (3.0%) |
| $25,000 to $34,999 | 1,176 (11.7%) | 176 (5.6%) |
| $35,000 to $49,999 | 1,322 (13.2%) | 280 (8.9%) |
| $50,000 to $74,999 | 1,267 (12.6%) | 497 (15.8%) |
| $75,000 to $99,999 | 721 (7.2%) | 327 (10.4%) |
| $100,000 to $149,999 | 1,259 (12.5%) | 471 (15.0%) |
| $150,000 or more | 2,936 (29.2%) | 922 (29.3%) |
| Total | 10,056 (100.0%) | 3,147 (100.0%) |
Monthly Housing Cost Tiers in Seal Beach
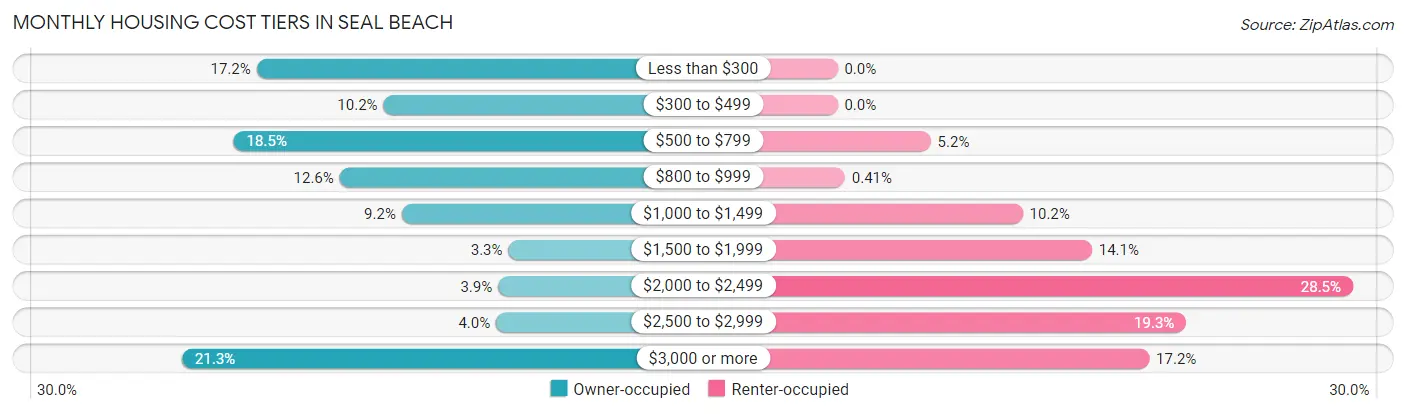
| Monthly Cost | Owner-occupied | Renter-occupied |
| Less than $300 | 1,729 (17.2%) | 0 (0.0%) |
| $300 to $499 | 1,024 (10.2%) | 0 (0.0%) |
| $500 to $799 | 1,856 (18.5%) | 162 (5.1%) |
| $800 to $999 | 1,267 (12.6%) | 13 (0.4%) |
| $1,000 to $1,499 | 922 (9.2%) | 322 (10.2%) |
| $1,500 to $1,999 | 330 (3.3%) | 442 (14.1%) |
| $2,000 to $2,499 | 387 (3.8%) | 896 (28.5%) |
| $2,500 to $2,999 | 398 (4.0%) | 606 (19.3%) |
| $3,000 or more | 2,143 (21.3%) | 542 (17.2%) |
| Total | 10,056 (100.0%) | 3,147 (100.0%) |
Physical Housing Characteristics in Seal Beach
Housing Structures in Seal Beach
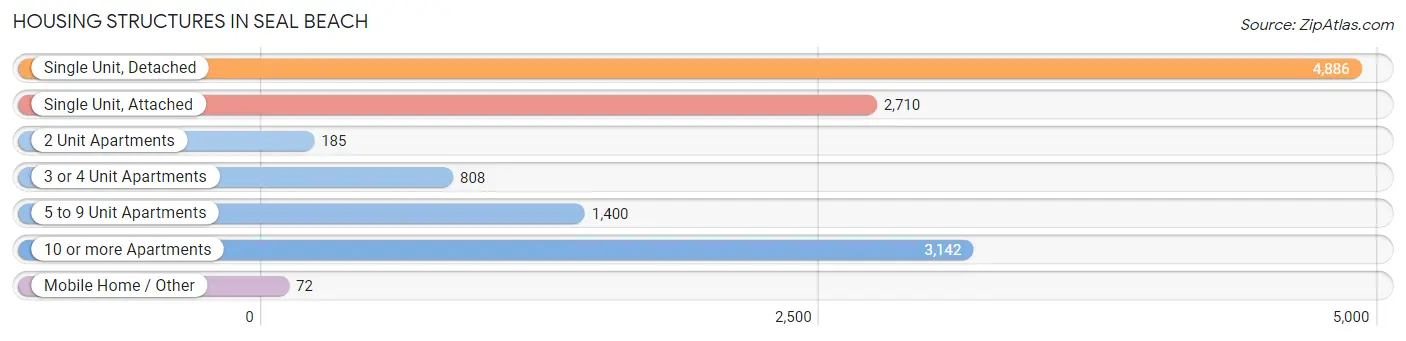
| Structure Type | # Housing Units | % Housing Units |
| Single Unit, Detached | 4,886 | 37.0% |
| Single Unit, Attached | 2,710 | 20.5% |
| 2 Unit Apartments | 185 | 1.4% |
| 3 or 4 Unit Apartments | 808 | 6.1% |
| 5 to 9 Unit Apartments | 1,400 | 10.6% |
| 10 or more Apartments | 3,142 | 23.8% |
| Mobile Home / Other | 72 | 0.5% |
| Total | 13,203 | 100.0% |
Housing Structures by Occupancy in Seal Beach
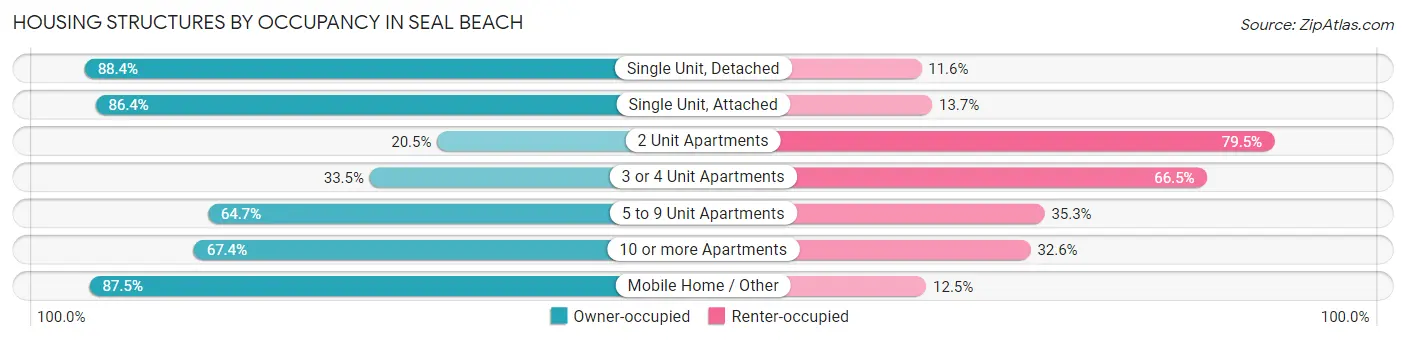
| Structure Type | Owner-occupied | Renter-occupied |
| Single Unit, Detached | 4,320 (88.4%) | 566 (11.6%) |
| Single Unit, Attached | 2,340 (86.4%) | 370 (13.7%) |
| 2 Unit Apartments | 38 (20.5%) | 147 (79.5%) |
| 3 or 4 Unit Apartments | 271 (33.5%) | 537 (66.5%) |
| 5 to 9 Unit Apartments | 906 (64.7%) | 494 (35.3%) |
| 10 or more Apartments | 2,118 (67.4%) | 1,024 (32.6%) |
| Mobile Home / Other | 63 (87.5%) | 9 (12.5%) |
| Total | 10,056 (76.2%) | 3,147 (23.8%) |
Housing Structures by Number of Rooms in Seal Beach
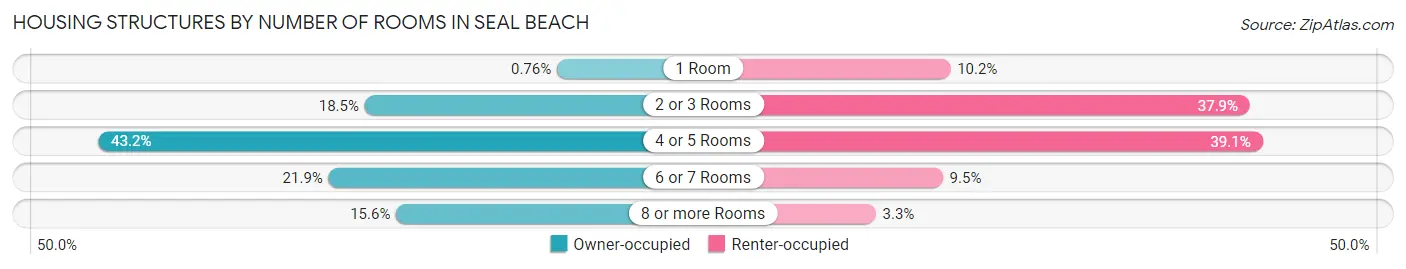
| Number of Rooms | Owner-occupied | Renter-occupied |
| 1 Room | 76 (0.8%) | 321 (10.2%) |
| 2 or 3 Rooms | 1,864 (18.5%) | 1,193 (37.9%) |
| 4 or 5 Rooms | 4,344 (43.2%) | 1,230 (39.1%) |
| 6 or 7 Rooms | 2,200 (21.9%) | 299 (9.5%) |
| 8 or more Rooms | 1,572 (15.6%) | 104 (3.3%) |
| Total | 10,056 (100.0%) | 3,147 (100.0%) |
Housing Structure by Heating Type in Seal Beach
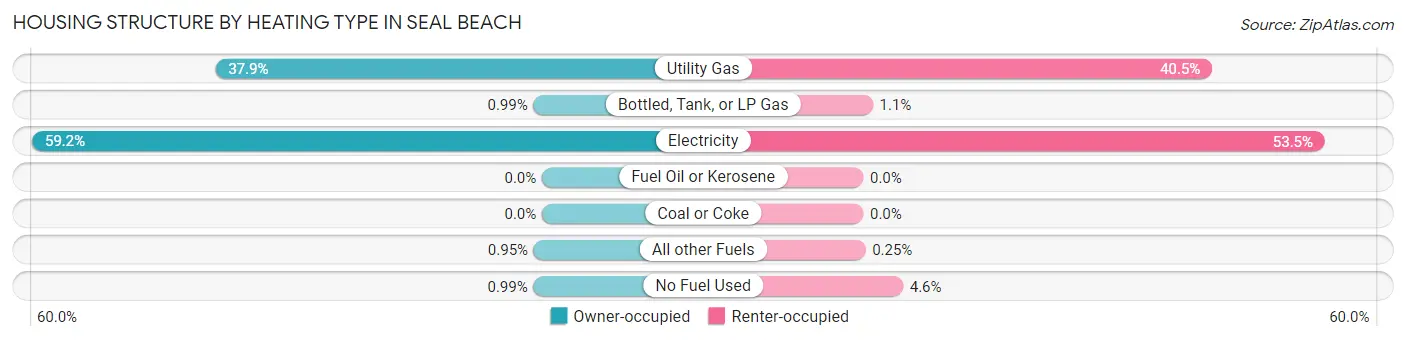
| Heating Type | Owner-occupied | Renter-occupied |
| Utility Gas | 3,811 (37.9%) | 1,274 (40.5%) |
| Bottled, Tank, or LP Gas | 100 (1.0%) | 35 (1.1%) |
| Electricity | 5,949 (59.2%) | 1,685 (53.5%) |
| Fuel Oil or Kerosene | 0 (0.0%) | 0 (0.0%) |
| Coal or Coke | 0 (0.0%) | 0 (0.0%) |
| All other Fuels | 96 (0.9%) | 8 (0.3%) |
| No Fuel Used | 100 (1.0%) | 145 (4.6%) |
| Total | 10,056 (100.0%) | 3,147 (100.0%) |
Household Vehicle Usage in Seal Beach
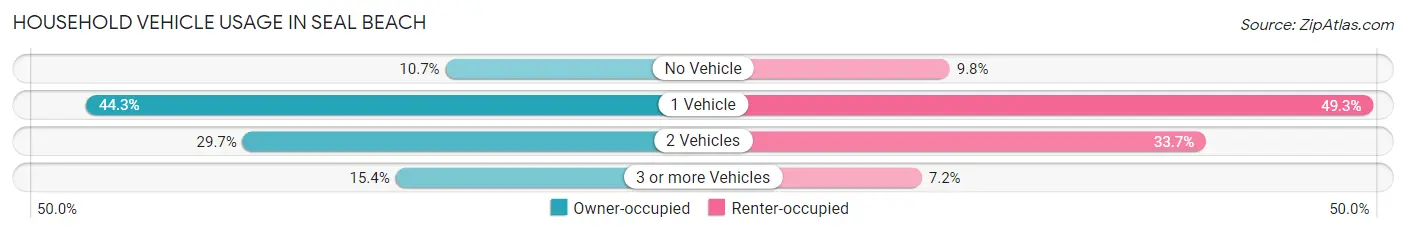
| Vehicles per Household | Owner-occupied | Renter-occupied |
| No Vehicle | 1,078 (10.7%) | 308 (9.8%) |
| 1 Vehicle | 4,450 (44.3%) | 1,552 (49.3%) |
| 2 Vehicles | 2,982 (29.6%) | 1,061 (33.7%) |
| 3 or more Vehicles | 1,546 (15.4%) | 226 (7.2%) |
| Total | 10,056 (100.0%) | 3,147 (100.0%) |
Real Estate & Mortgages in Seal Beach
Real Estate and Mortgage Overview in Seal Beach
| Characteristic | Without Mortgage | With Mortgage |
| Housing Units | 6,786 | 3,270 |
| Median Property Value | $350,200 | $1,169,900 |
| Median Household Income | $49,776 | $1,894 |
| Monthly Housing Costs | $621 | $2,135 |
| Real Estate Taxes | $2,121 | $66 |
Property Value by Mortgage Status in Seal Beach
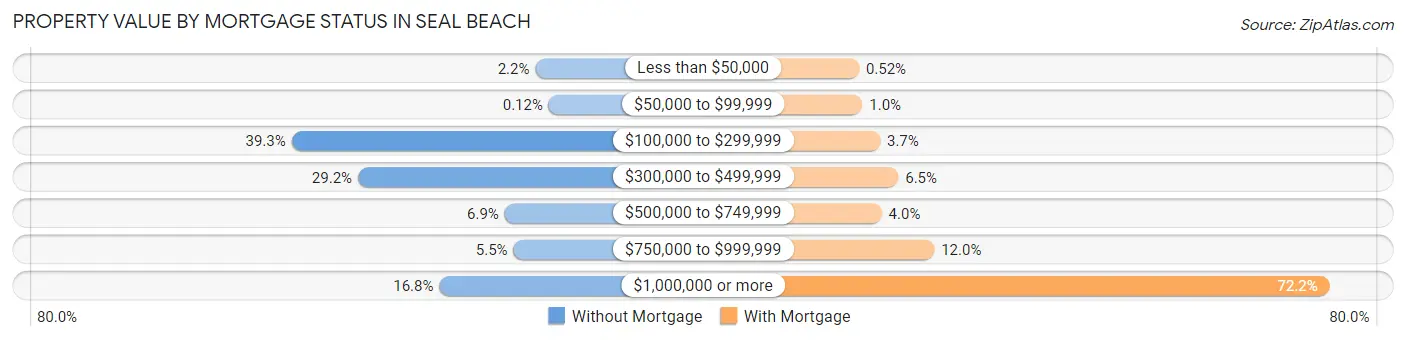
| Property Value | Without Mortgage | With Mortgage |
| Less than $50,000 | 148 (2.2%) | 17 (0.5%) |
| $50,000 to $99,999 | 8 (0.1%) | 34 (1.0%) |
| $100,000 to $299,999 | 2,668 (39.3%) | 122 (3.7%) |
| $300,000 to $499,999 | 1,982 (29.2%) | 213 (6.5%) |
| $500,000 to $749,999 | 465 (6.9%) | 130 (4.0%) |
| $750,000 to $999,999 | 374 (5.5%) | 392 (12.0%) |
| $1,000,000 or more | 1,141 (16.8%) | 2,362 (72.2%) |
| Total | 6,786 (100.0%) | 3,270 (100.0%) |
Household Income by Mortgage Status in Seal Beach
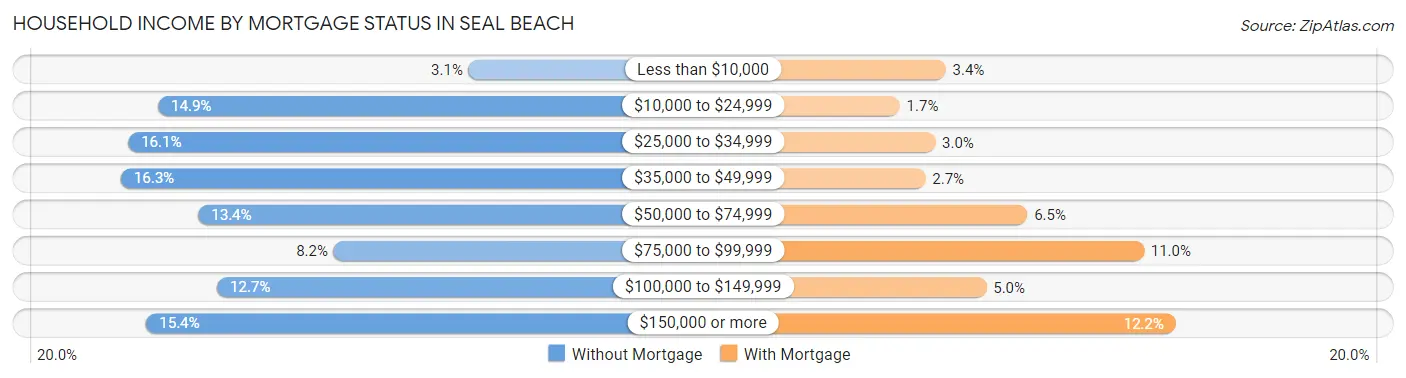
| Household Income | Without Mortgage | With Mortgage |
| Less than $10,000 | 209 (3.1%) | 112 (3.4%) |
| $10,000 to $24,999 | 1,012 (14.9%) | 55 (1.7%) |
| $25,000 to $34,999 | 1,089 (16.1%) | 99 (3.0%) |
| $35,000 to $49,999 | 1,108 (16.3%) | 87 (2.7%) |
| $50,000 to $74,999 | 908 (13.4%) | 214 (6.5%) |
| $75,000 to $99,999 | 558 (8.2%) | 359 (11.0%) |
| $100,000 to $149,999 | 860 (12.7%) | 163 (5.0%) |
| $150,000 or more | 1,042 (15.4%) | 399 (12.2%) |
| Total | 6,786 (100.0%) | 3,270 (100.0%) |
Property Value to Household Income Ratio in Seal Beach
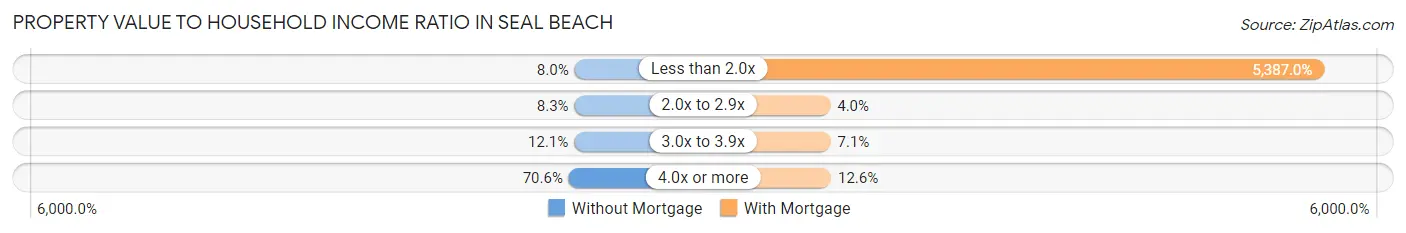
| Value-to-Income Ratio | Without Mortgage | With Mortgage |
| Less than 2.0x | 544 (8.0%) | 176,154 (5,387.0%) |
| 2.0x to 2.9x | 565 (8.3%) | 132 (4.0%) |
| 3.0x to 3.9x | 821 (12.1%) | 233 (7.1%) |
| 4.0x or more | 4,790 (70.6%) | 412 (12.6%) |
| Total | 6,786 (100.0%) | 3,270 (100.0%) |
Real Estate Taxes by Mortgage Status in Seal Beach
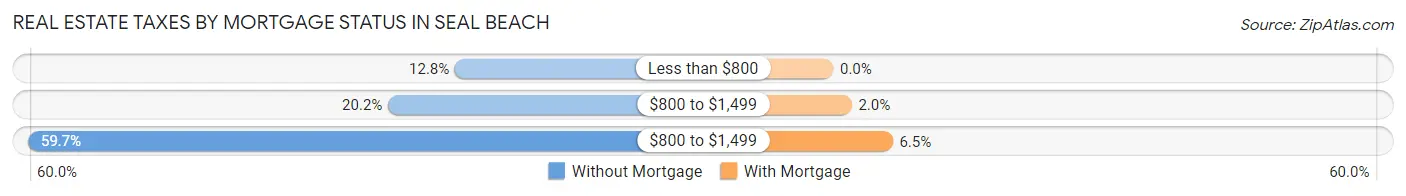
| Property Taxes | Without Mortgage | With Mortgage |
| Less than $800 | 870 (12.8%) | 0 (0.0%) |
| $800 to $1,499 | 1,368 (20.2%) | 66 (2.0%) |
| $800 to $1,499 | 4,048 (59.7%) | 213 (6.5%) |
| Total | 6,786 (100.0%) | 3,270 (100.0%) |
Health & Disability in Seal Beach
Health Insurance Coverage by Age in Seal Beach
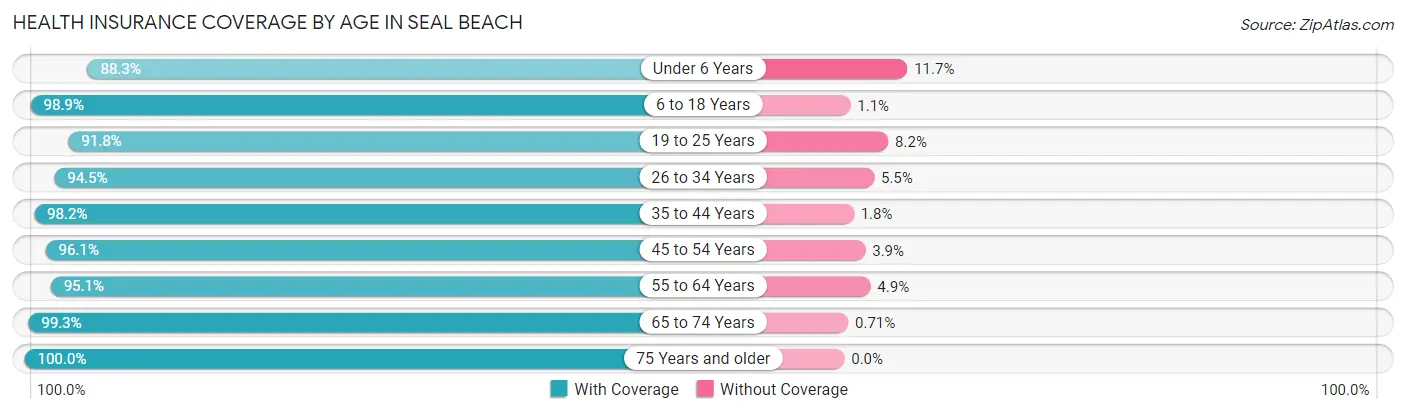
| Age Bracket | With Coverage | Without Coverage |
| Under 6 Years | 812 (88.3%) | 108 (11.7%) |
| 6 to 18 Years | 2,635 (98.9%) | 30 (1.1%) |
| 19 to 25 Years | 606 (91.8%) | 54 (8.2%) |
| 26 to 34 Years | 1,518 (94.5%) | 89 (5.5%) |
| 35 to 44 Years | 2,177 (98.2%) | 39 (1.8%) |
| 45 to 54 Years | 2,260 (96.1%) | 92 (3.9%) |
| 55 to 64 Years | 3,304 (95.1%) | 169 (4.9%) |
| 65 to 74 Years | 5,016 (99.3%) | 36 (0.7%) |
| 75 Years and older | 5,804 (100.0%) | 0 (0.0%) |
| Total | 24,132 (97.5%) | 617 (2.5%) |
Health Insurance Coverage by Citizenship Status in Seal Beach
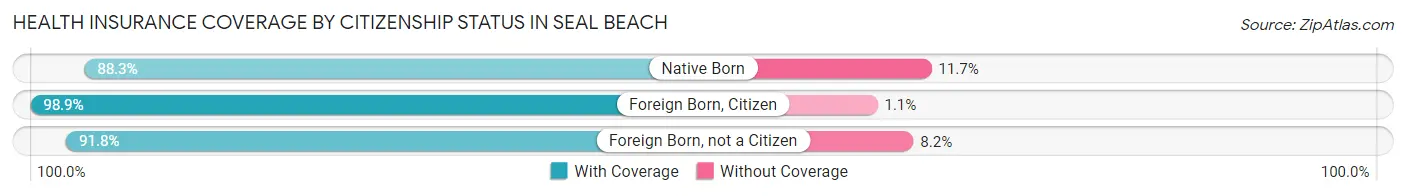
| Citizenship Status | With Coverage | Without Coverage |
| Native Born | 812 (88.3%) | 108 (11.7%) |
| Foreign Born, Citizen | 2,635 (98.9%) | 30 (1.1%) |
| Foreign Born, not a Citizen | 606 (91.8%) | 54 (8.2%) |
Health Insurance Coverage by Household Income in Seal Beach
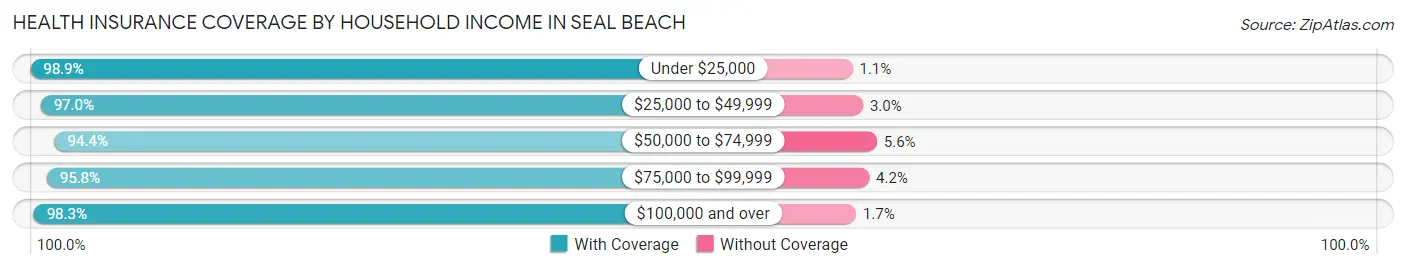
| Household Income | With Coverage | Without Coverage |
| Under $25,000 | 2,321 (98.9%) | 25 (1.1%) |
| $25,000 to $49,999 | 3,685 (97.0%) | 115 (3.0%) |
| $50,000 to $74,999 | 2,832 (94.4%) | 169 (5.6%) |
| $75,000 to $99,999 | 1,582 (95.8%) | 69 (4.2%) |
| $100,000 and over | 13,564 (98.3%) | 238 (1.7%) |
Public vs Private Health Insurance Coverage by Age in Seal Beach
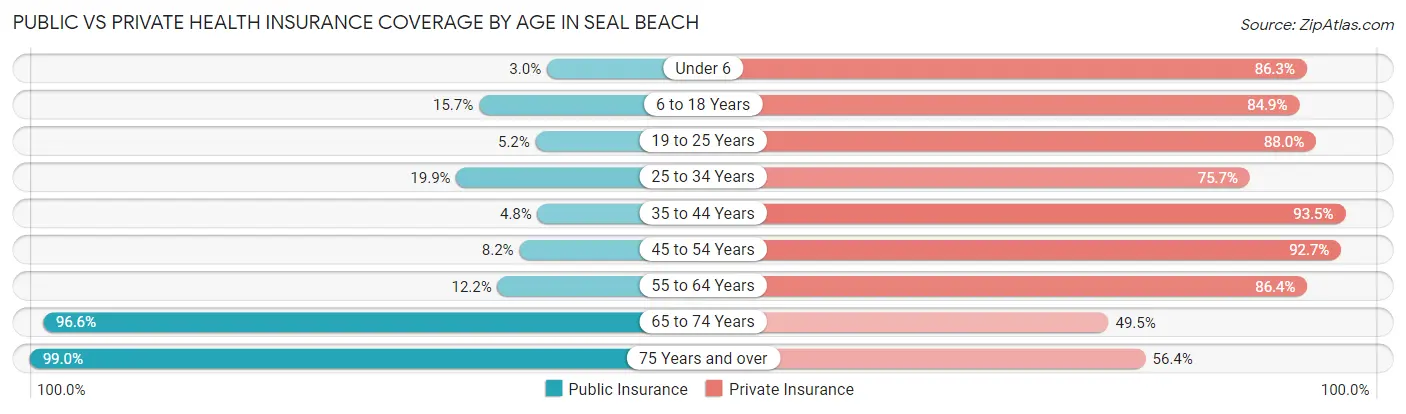
| Age Bracket | Public Insurance | Private Insurance |
| Under 6 | 28 (3.0%) | 794 (86.3%) |
| 6 to 18 Years | 417 (15.7%) | 2,263 (84.9%) |
| 19 to 25 Years | 34 (5.1%) | 581 (88.0%) |
| 25 to 34 Years | 319 (19.9%) | 1,217 (75.7%) |
| 35 to 44 Years | 106 (4.8%) | 2,071 (93.5%) |
| 45 to 54 Years | 192 (8.2%) | 2,180 (92.7%) |
| 55 to 64 Years | 424 (12.2%) | 3,001 (86.4%) |
| 65 to 74 Years | 4,880 (96.6%) | 2,501 (49.5%) |
| 75 Years and over | 5,748 (99.0%) | 3,273 (56.4%) |
| Total | 12,148 (49.1%) | 17,881 (72.3%) |
Disability Status by Sex by Age in Seal Beach
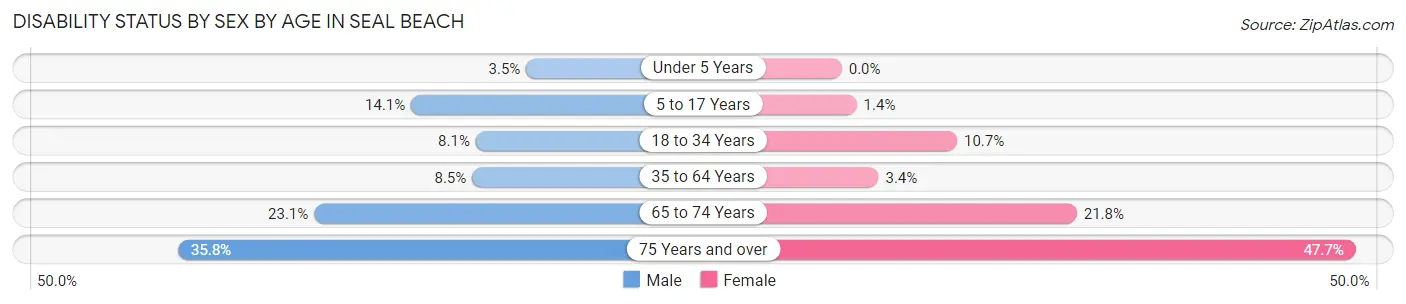
| Age Bracket | Male | Female |
| Under 5 Years | 12 (3.5%) | 0 (0.0%) |
| 5 to 17 Years | 190 (14.1%) | 18 (1.4%) |
| 18 to 34 Years | 86 (8.1%) | 156 (10.7%) |
| 35 to 64 Years | 338 (8.5%) | 138 (3.4%) |
| 65 to 74 Years | 476 (23.1%) | 653 (21.8%) |
| 75 Years and over | 735 (35.8%) | 1,788 (47.7%) |
Disability Class by Sex by Age in Seal Beach
Disability Class: Hearing Difficulty
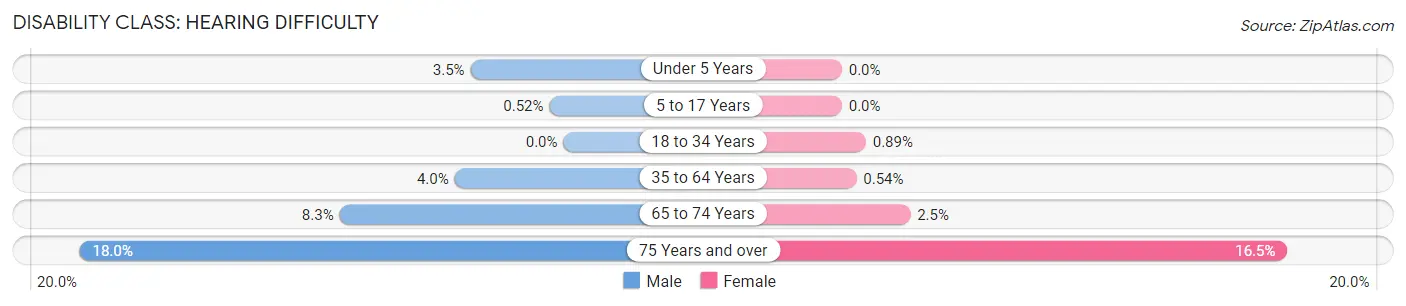
| Age Bracket | Male | Female |
| Under 5 Years | 12 (3.5%) | 0 (0.0%) |
| 5 to 17 Years | 7 (0.5%) | 0 (0.0%) |
| 18 to 34 Years | 0 (0.0%) | 13 (0.9%) |
| 35 to 64 Years | 161 (4.0%) | 22 (0.5%) |
| 65 to 74 Years | 171 (8.3%) | 76 (2.5%) |
| 75 Years and over | 369 (18.0%) | 620 (16.5%) |
Disability Class: Vision Difficulty
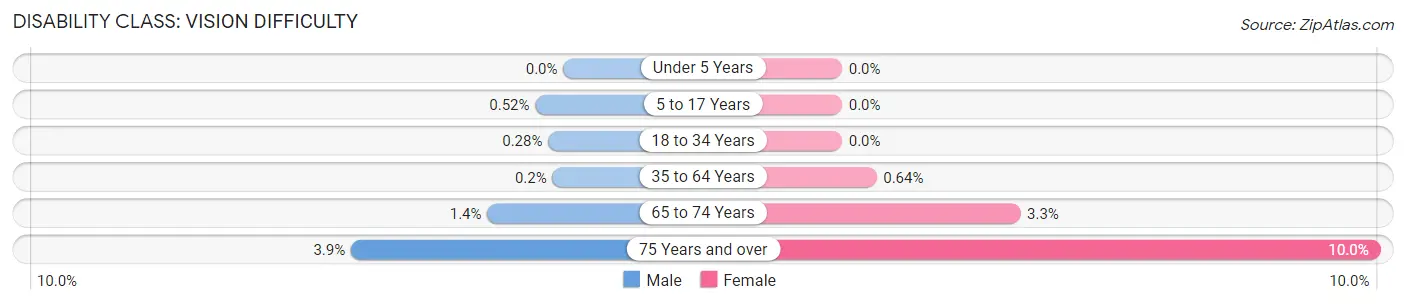
| Age Bracket | Male | Female |
| Under 5 Years | 0 (0.0%) | 0 (0.0%) |
| 5 to 17 Years | 7 (0.5%) | 0 (0.0%) |
| 18 to 34 Years | 3 (0.3%) | 0 (0.0%) |
| 35 to 64 Years | 8 (0.2%) | 26 (0.6%) |
| 65 to 74 Years | 29 (1.4%) | 99 (3.3%) |
| 75 Years and over | 81 (3.9%) | 375 (10.0%) |
Disability Class: Cognitive Difficulty
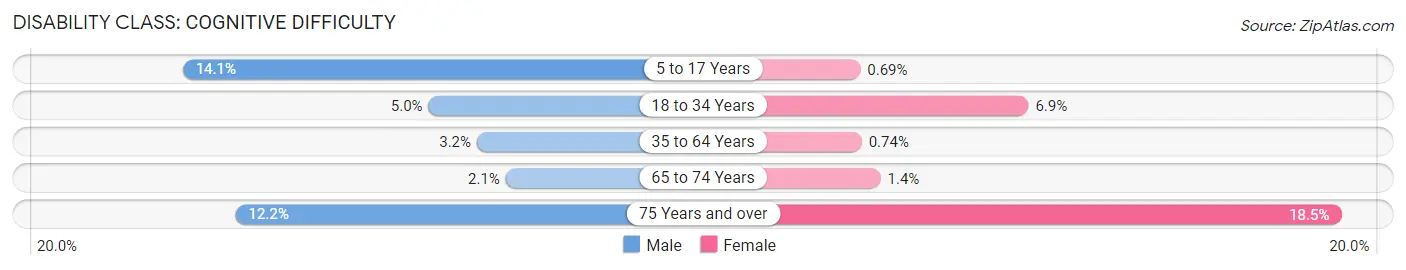
| Age Bracket | Male | Female |
| 5 to 17 Years | 190 (14.1%) | 9 (0.7%) |
| 18 to 34 Years | 53 (5.0%) | 101 (6.9%) |
| 35 to 64 Years | 128 (3.2%) | 30 (0.7%) |
| 65 to 74 Years | 44 (2.1%) | 43 (1.4%) |
| 75 Years and over | 250 (12.2%) | 695 (18.5%) |
Disability Class: Ambulatory Difficulty
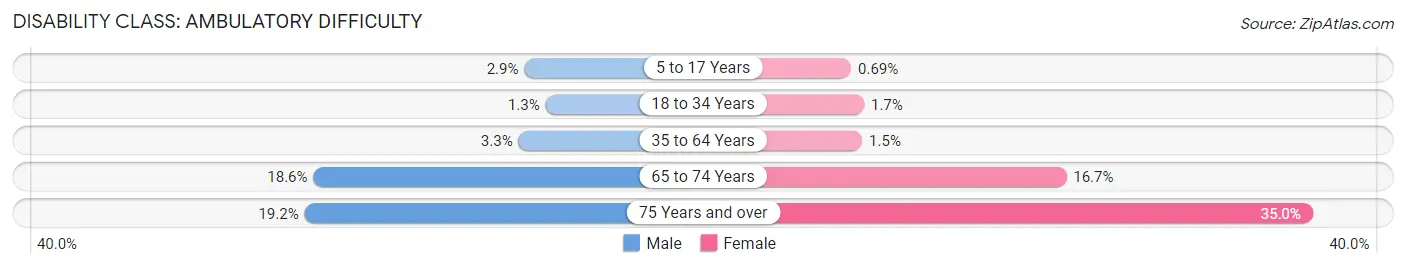
| Age Bracket | Male | Female |
| 5 to 17 Years | 39 (2.9%) | 9 (0.7%) |
| 18 to 34 Years | 14 (1.3%) | 24 (1.7%) |
| 35 to 64 Years | 133 (3.3%) | 61 (1.5%) |
| 65 to 74 Years | 382 (18.6%) | 499 (16.7%) |
| 75 Years and over | 395 (19.2%) | 1,311 (35.0%) |
Disability Class: Self-Care Difficulty
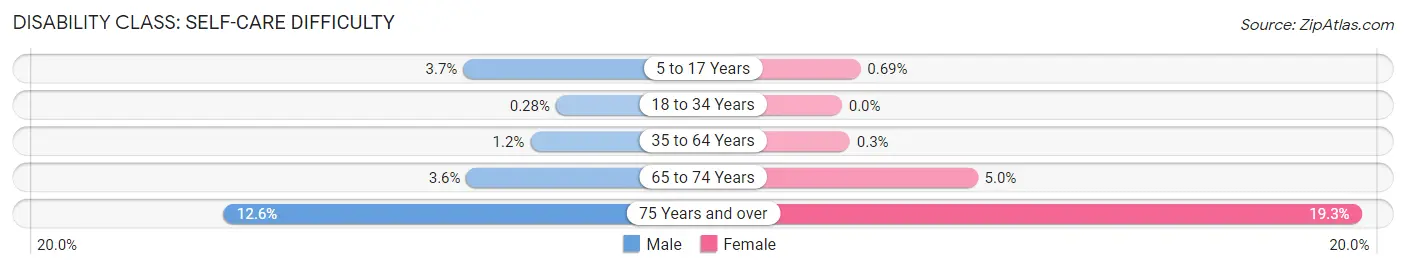
| Age Bracket | Male | Female |
| 5 to 17 Years | 50 (3.7%) | 9 (0.7%) |
| 18 to 34 Years | 3 (0.3%) | 0 (0.0%) |
| 35 to 64 Years | 49 (1.2%) | 12 (0.3%) |
| 65 to 74 Years | 74 (3.6%) | 151 (5.0%) |
| 75 Years and over | 259 (12.6%) | 723 (19.3%) |
Technology Access in Seal Beach
Computing Device Access in Seal Beach
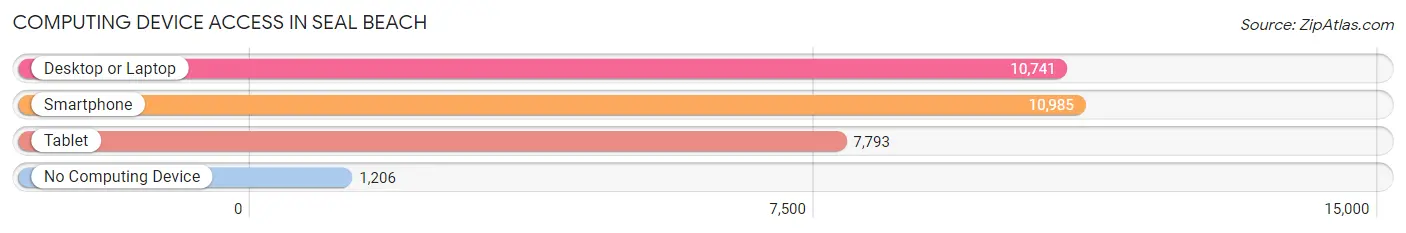
| Device Type | # Households | % Households |
| Desktop or Laptop | 10,741 | 81.4% |
| Smartphone | 10,985 | 83.2% |
| Tablet | 7,793 | 59.0% |
| No Computing Device | 1,206 | 9.1% |
| Total | 13,203 | 100.0% |
Internet Access in Seal Beach
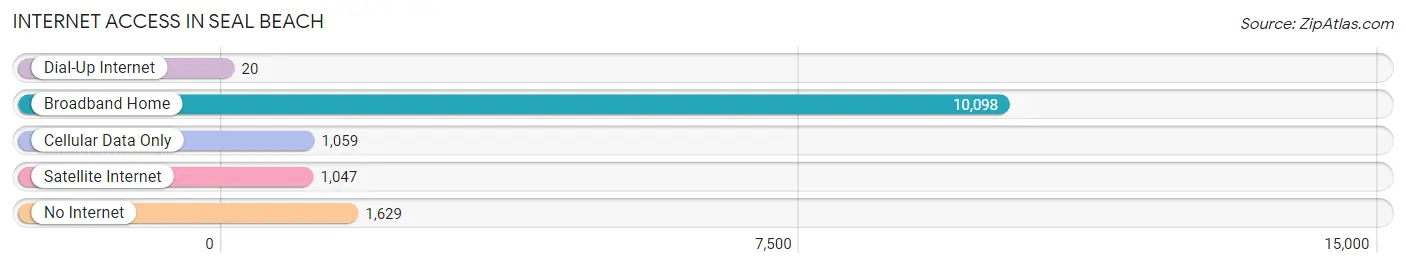
| Internet Type | # Households | % Households |
| Dial-Up Internet | 20 | 0.2% |
| Broadband Home | 10,098 | 76.5% |
| Cellular Data Only | 1,059 | 8.0% |
| Satellite Internet | 1,047 | 7.9% |
| No Internet | 1,629 | 12.3% |
| Total | 13,203 | 100.0% |
Seal Beach Summary
Seal Beach is a small city located in Orange County, California. It is situated on the Pacific Ocean, just south of Long Beach and north of Huntington Beach. The city has a population of 24,157 as of the 2010 census, making it the most populous city in Orange County.
History
Seal Beach was originally inhabited by the Tongva Native Americans, who called the area “Kizh” or “Kij”. The area was first explored by Spanish explorer Gaspar de Portola in 1769. The area was later settled by the Spanish in the late 1700s, and the town was officially founded in 1915. The town was named after the seals that were often seen on the beach.
Geography
Seal Beach is located in Orange County, California, on the Pacific Ocean. It is bordered by Long Beach to the north, Huntington Beach to the south, and Los Alamitos to the east. The city covers an area of 6.2 square miles, with a population density of 3,890 people per square mile.
The city is divided into two distinct areas: the beach area and the inland area. The beach area is located along the Pacific Ocean and is home to the Seal Beach Pier, which is the longest pier in California. The inland area is located further inland and is home to the majority of the city’s businesses and residential areas.
Economy
Seal Beach’s economy is largely based on tourism and retail. The city is home to several popular tourist attractions, including the Seal Beach Pier, the Seal Beach National Wildlife Refuge, and the Seal Beach Wildlife Sanctuary. The city also has a thriving retail sector, with several shopping centers and malls located in the city.
The city is also home to several major employers, including Boeing, Raytheon, and the Naval Weapons Station Seal Beach. The city also has a thriving small business sector, with many local businesses located in the city.
Demographics
As of the 2010 census, Seal Beach had a population of 24,157. The racial makeup of the city was 75.3% White, 8.2% Asian, 6.2% Hispanic or Latino, 5.2% African American, and 0.7% Native American. The median household income was $77,890, and the median family income was $90,945.
Seal Beach is a relatively affluent city, with a median home value of $717,000. The city is also home to a large number of retirees, with nearly 20% of the population over the age of 65.
Conclusion
Seal Beach is a small city located in Orange County, California. It is situated on the Pacific Ocean, just south of Long Beach and north of Huntington Beach. The city has a population of 24,157 as of the 2010 census, making it the most populous city in Orange County. Seal Beach’s economy is largely based on tourism and retail, and the city is home to several major employers, including Boeing, Raytheon, and the Naval Weapons Station Seal Beach. The city is also home to a large number of retirees, with nearly 20% of the population over the age of 65.
Common Questions
What is Per Capita Income in Seal Beach?
Per Capita income in Seal Beach is $65,859.
What is the Median Family Income in Seal Beach?
Median Family Income in Seal Beach is $142,717.
What is the Median Household income in Seal Beach?
Median Household Income in Seal Beach is $75,507.
What is Income or Wage Gap in Seal Beach?
Income or Wage Gap in Seal Beach is 50.2%.
Women in Seal Beach earn 49.8 cents for every dollar earned by a man.
What is Inequality or Gini Index in Seal Beach?
Inequality or Gini Index in Seal Beach is 0.51.
What is the Total Population of Seal Beach?
Total Population of Seal Beach is 25,046.
What is the Total Male Population of Seal Beach?
Total Male Population of Seal Beach is 11,098.
What is the Total Female Population of Seal Beach?
Total Female Population of Seal Beach is 13,948.
What is the Ratio of Males per 100 Females in Seal Beach?
There are 79.57 Males per 100 Females in Seal Beach.
What is the Ratio of Females per 100 Males in Seal Beach?
There are 125.68 Females per 100 Males in Seal Beach.
What is the Median Population Age in Seal Beach?
Median Population Age in Seal Beach is 60.8 Years.
What is the Average Family Size in Seal Beach
Average Family Size in Seal Beach is 2.8 People.
What is the Average Household Size in Seal Beach
Average Household Size in Seal Beach is 1.9 People.
How Large is the Labor Force in Seal Beach?
There are 9,632 People in the Labor Forcein in Seal Beach.
What is the Percentage of People in the Labor Force in Seal Beach?
43.6% of People are in the Labor Force in Seal Beach.
What is the Unemployment Rate in Seal Beach?
Unemployment Rate in Seal Beach is 4.2%.