Ephraim, UT Map & Demographics
Ephraim Map
Ephraim Overview
$22,526
PER CAPITA INCOME
$86,842
AVG FAMILY INCOME
$70,677
AVG HOUSEHOLD INCOME
49.4%
WAGE / INCOME GAP [ % ]
50.6¢/ $1
WAGE / INCOME GAP [ $ ]
$14,234
FAMILY INCOME DEFICIT
0.35
INEQUALITY / GINI INDEX
5,739
TOTAL POPULATION
2,743
MALE POPULATION
2,996
FEMALE POPULATION
91.56
MALES / 100 FEMALES
109.22
FEMALES / 100 MALES
21.8
MEDIAN AGE
3.6
AVG FAMILY SIZE
3.2
AVG HOUSEHOLD SIZE
2,996
LABOR FORCE [ PEOPLE ]
66.3%
PERCENT IN LABOR FORCE
8.4%
UNEMPLOYMENT RATE
Ephraim Zip Codes
Ephraim Area Codes
Income in Ephraim
Income Overview in Ephraim
Per Capita Income in Ephraim is $22,526, while median incomes of families and households are $86,842 and $70,677 respectively.
| Characteristic | Number | Measure |
| Per Capita Income | 5,739 | $22,526 |
| Median Family Income | 1,082 | $86,842 |
| Mean Family Income | 1,082 | $91,728 |
| Median Household Income | 1,681 | $70,677 |
| Mean Household Income | 1,681 | $75,669 |
| Income Deficit | 1,082 | $14,234 |
| Wage / Income Gap (%) | 5,739 | 49.35% |
| Wage / Income Gap ($) | 5,739 | 50.65¢ per $1 |
| Gini / Inequality Index | 5,739 | 0.35 |
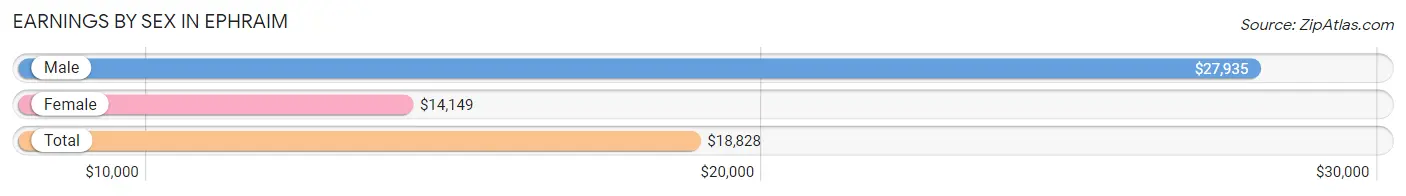
Earnings by Sex in Ephraim
Average Earnings in Ephraim are $18,828, $27,935 for men and $14,149 for women, a difference of 49.3%.
| Sex | Number | Average Earnings |
| Male | 1,788 (51.0%) | $27,935 |
| Female | 1,720 (49.0%) | $14,149 |
| Total | 3,508 (100.0%) | $18,828 |
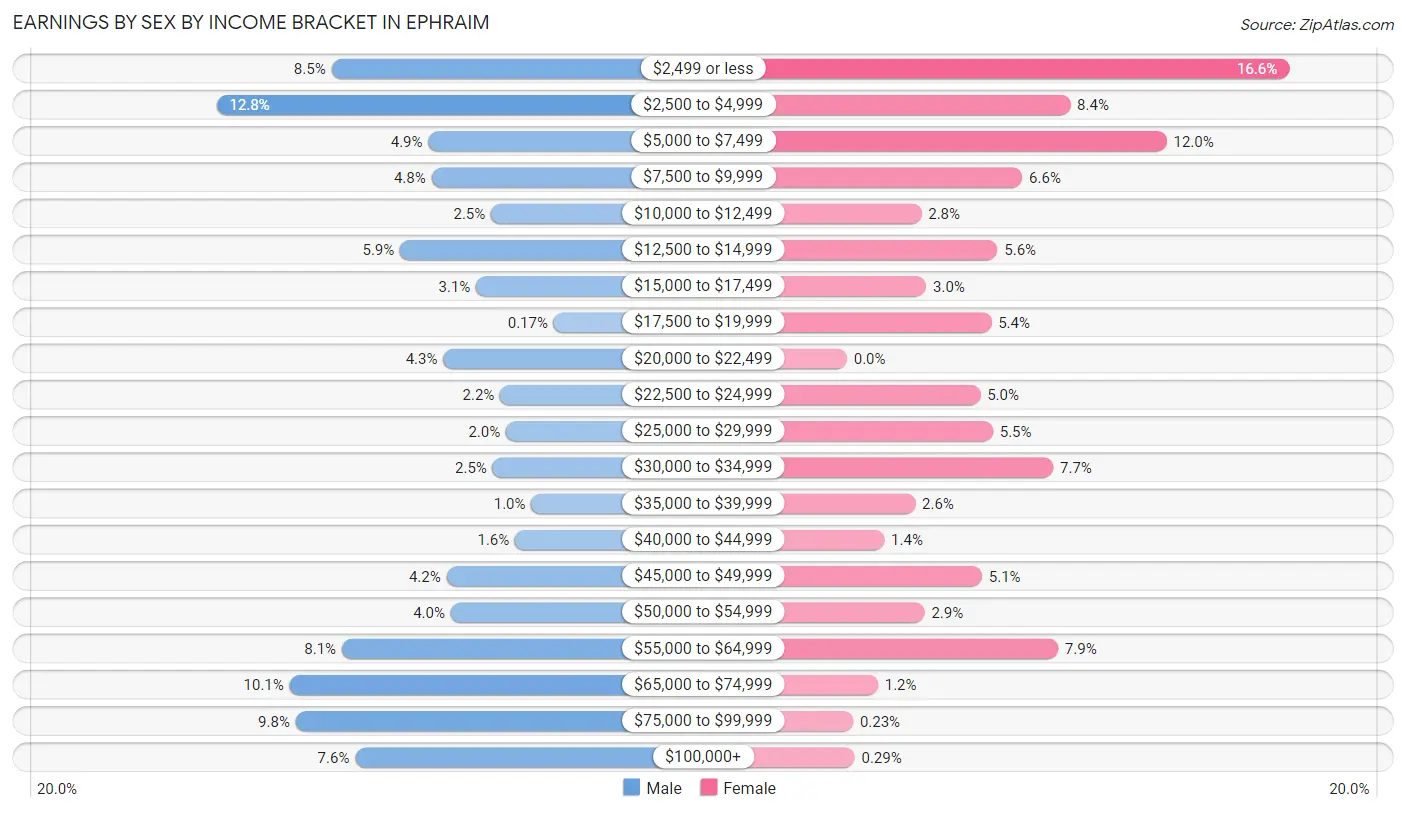
Earnings by Sex by Income Bracket in Ephraim
The most common earnings brackets in Ephraim are $2,500 to $4,999 for men (229 | 12.8%) and $2,499 or less for women (285 | 16.6%).
| Income | Male | Female |
| $2,499 or less | 152 (8.5%) | 285 (16.6%) |
| $2,500 to $4,999 | 229 (12.8%) | 144 (8.4%) |
| $5,000 to $7,499 | 87 (4.9%) | 206 (12.0%) |
| $7,500 to $9,999 | 85 (4.8%) | 113 (6.6%) |
| $10,000 to $12,499 | 45 (2.5%) | 48 (2.8%) |
| $12,500 to $14,999 | 106 (5.9%) | 97 (5.6%) |
| $15,000 to $17,499 | 55 (3.1%) | 51 (3.0%) |
| $17,500 to $19,999 | 3 (0.2%) | 93 (5.4%) |
| $20,000 to $22,499 | 77 (4.3%) | 0 (0.0%) |
| $22,500 to $24,999 | 39 (2.2%) | 86 (5.0%) |
| $25,000 to $29,999 | 35 (2.0%) | 94 (5.5%) |
| $30,000 to $34,999 | 44 (2.5%) | 133 (7.7%) |
| $35,000 to $39,999 | 18 (1.0%) | 44 (2.6%) |
| $40,000 to $44,999 | 29 (1.6%) | 24 (1.4%) |
| $45,000 to $49,999 | 75 (4.2%) | 87 (5.1%) |
| $50,000 to $54,999 | 72 (4.0%) | 50 (2.9%) |
| $55,000 to $64,999 | 145 (8.1%) | 136 (7.9%) |
| $65,000 to $74,999 | 180 (10.1%) | 20 (1.2%) |
| $75,000 to $99,999 | 176 (9.8%) | 4 (0.2%) |
| $100,000+ | 136 (7.6%) | 5 (0.3%) |
| Total | 1,788 (100.0%) | 1,720 (100.0%) |
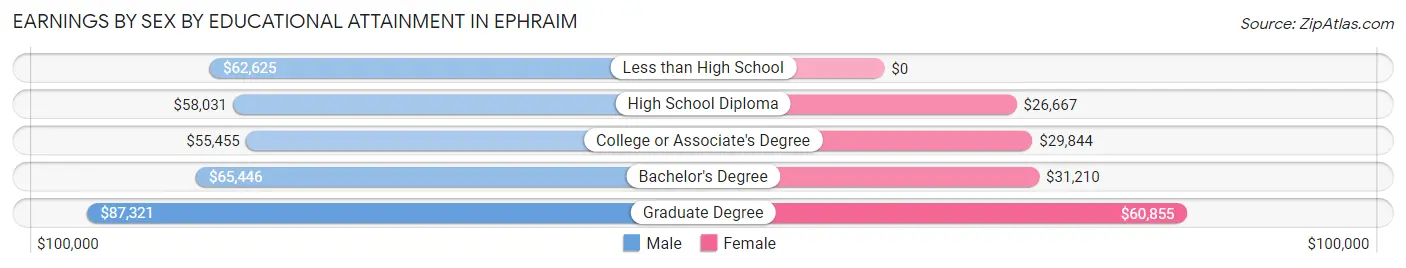
Earnings by Sex by Educational Attainment in Ephraim
Average earnings in Ephraim are $63,491 for men and $30,000 for women, a difference of 52.7%. Men with an educational attainment of graduate degree enjoy the highest average annual earnings of $87,321, while those with college or associate's degree education earn the least with $55,455. Women with an educational attainment of graduate degree earn the most with the average annual earnings of $60,855, while those with high school diploma education have the smallest earnings of $26,667.
| Educational Attainment | Male Income | Female Income |
| Less than High School | $62,625 | $0 |
| High School Diploma | $58,031 | $26,667 |
| College or Associate's Degree | $55,455 | $29,844 |
| Bachelor's Degree | $65,446 | $31,210 |
| Graduate Degree | $87,321 | $60,855 |
| Total | $63,491 | $30,000 |
Family Income in Ephraim
Family Income Brackets in Ephraim
According to the Ephraim family income data, there are 338 families falling into the $100,000 to $149,999 income range, which is the most common income bracket and makes up 31.2% of all families. Conversely, the less than $10,000 income bracket is the least frequent group with only 15 families (1.4%) belonging to this category.
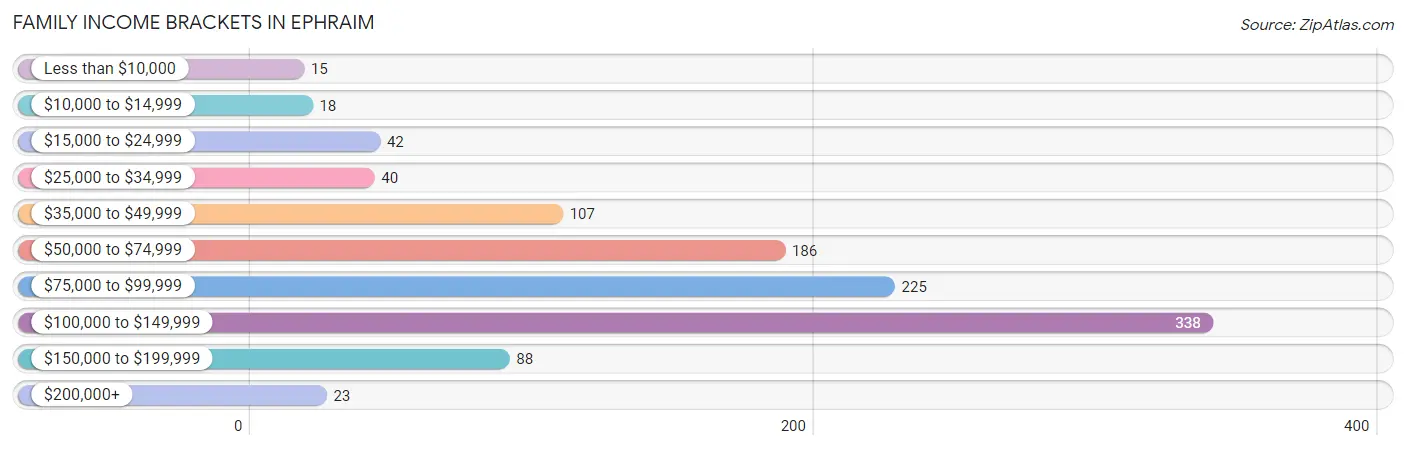
| Income Bracket | # Families | % Families |
| Less than $10,000 | 15 | 1.4% |
| $10,000 to $14,999 | 18 | 1.7% |
| $15,000 to $24,999 | 42 | 3.9% |
| $25,000 to $34,999 | 40 | 3.7% |
| $35,000 to $49,999 | 107 | 9.9% |
| $50,000 to $74,999 | 186 | 17.2% |
| $75,000 to $99,999 | 225 | 20.8% |
| $100,000 to $149,999 | 338 | 31.2% |
| $150,000 to $199,999 | 88 | 8.1% |
| $200,000+ | 23 | 2.1% |
Family Income by Famaliy Size in Ephraim
3-person families (178 | 16.5%) account for the highest median family income in Ephraim with $125,513 per family, while 2-person families (429 | 39.7%) have the highest median income of $43,542 per family member.
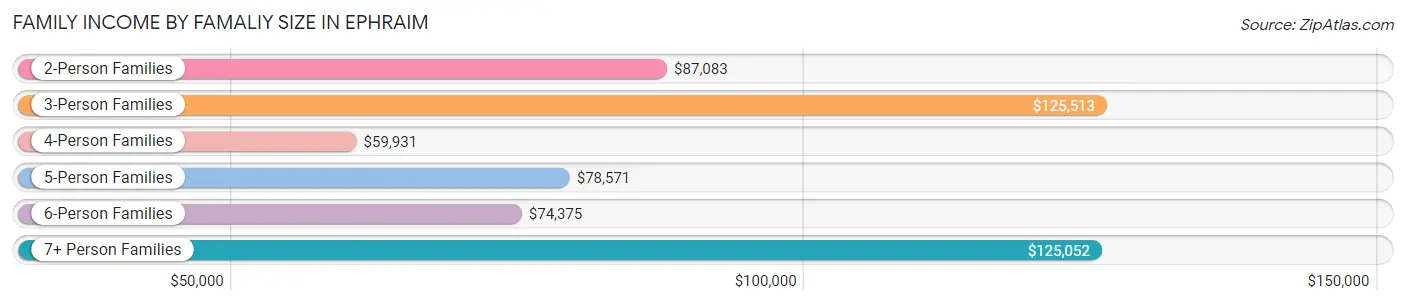
| Income Bracket | # Families | Median Income |
| 2-Person Families | 429 (39.7%) | $87,083 |
| 3-Person Families | 178 (16.5%) | $125,513 |
| 4-Person Families | 137 (12.7%) | $59,931 |
| 5-Person Families | 116 (10.7%) | $78,571 |
| 6-Person Families | 114 (10.5%) | $74,375 |
| 7+ Person Families | 108 (10.0%) | $125,052 |
| Total | 1,082 (100.0%) | $86,842 |
Family Income by Number of Earners in Ephraim
The median family income in Ephraim is $86,842, with families comprising 3+ earners (179) having the highest median family income of $120,089, while families with 1 earner (200) have the lowest median family income of $59,355, accounting for 16.5% and 18.5% of families, respectively.
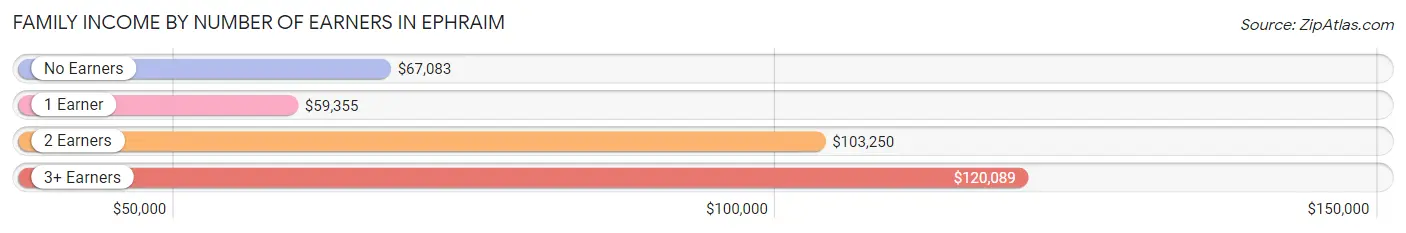
| Number of Earners | # Families | Median Income |
| No Earners | 109 (10.1%) | $67,083 |
| 1 Earner | 200 (18.5%) | $59,355 |
| 2 Earners | 594 (54.9%) | $103,250 |
| 3+ Earners | 179 (16.5%) | $120,089 |
| Total | 1,082 (100.0%) | $86,842 |
Household Income in Ephraim
Household Income Brackets in Ephraim
With 429 households falling in the category, the $100,000 to $149,999 income range is the most frequent in Ephraim, accounting for 25.5% of all households. In contrast, only 24 households (1.4%) fall into the $200,000+ income bracket, making it the least populous group.
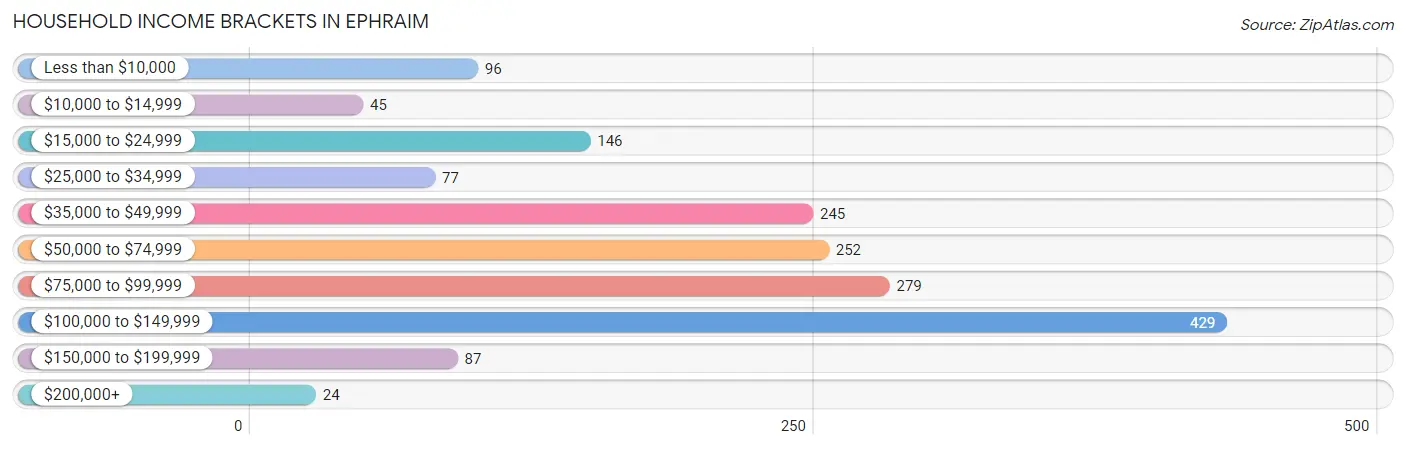
| Income Bracket | # Households | % Households |
| Less than $10,000 | 96 | 5.7% |
| $10,000 to $14,999 | 45 | 2.7% |
| $15,000 to $24,999 | 146 | 8.7% |
| $25,000 to $34,999 | 77 | 4.6% |
| $35,000 to $49,999 | 245 | 14.6% |
| $50,000 to $74,999 | 252 | 15.0% |
| $75,000 to $99,999 | 279 | 16.6% |
| $100,000 to $149,999 | 429 | 25.5% |
| $150,000 to $199,999 | 87 | 5.2% |
| $200,000+ | 24 | 1.4% |
Household Income by Householder Age in Ephraim
The median household income in Ephraim is $70,677, with the highest median household income of $104,904 found in the 45 to 64 years age bracket for the primary householder. A total of 381 households (22.7%) fall into this category. Meanwhile, the 15 to 24 years age bracket for the primary householder has the lowest median household income of $0, with 328 households (19.5%) in this group.
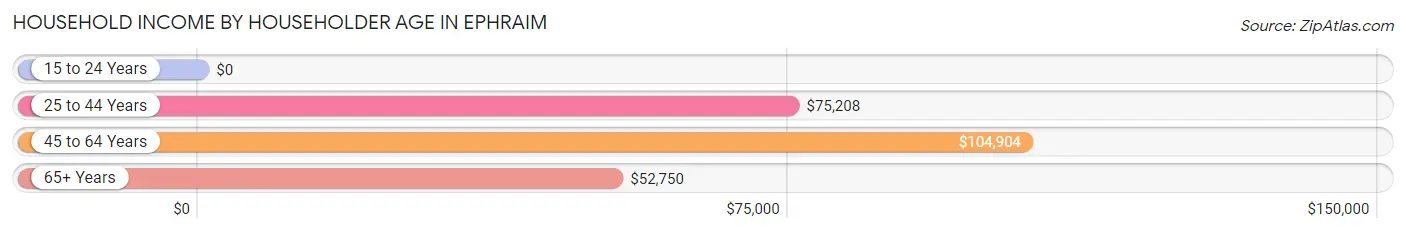
| Income Bracket | # Households | Median Income |
| 15 to 24 Years | 328 (19.5%) | $0 |
| 25 to 44 Years | 596 (35.5%) | $75,208 |
| 45 to 64 Years | 381 (22.7%) | $104,904 |
| 65+ Years | 376 (22.4%) | $52,750 |
| Total | 1,681 (100.0%) | $70,677 |
Poverty in Ephraim
Income Below Poverty by Sex and Age in Ephraim
With 14.5% poverty level for males and 19.6% for females among the residents of Ephraim, 18 to 24 year old males and 18 to 24 year old females are the most vulnerable to poverty, with 306 males (42.0%) and 431 females (50.9%) in their respective age groups living below the poverty level.
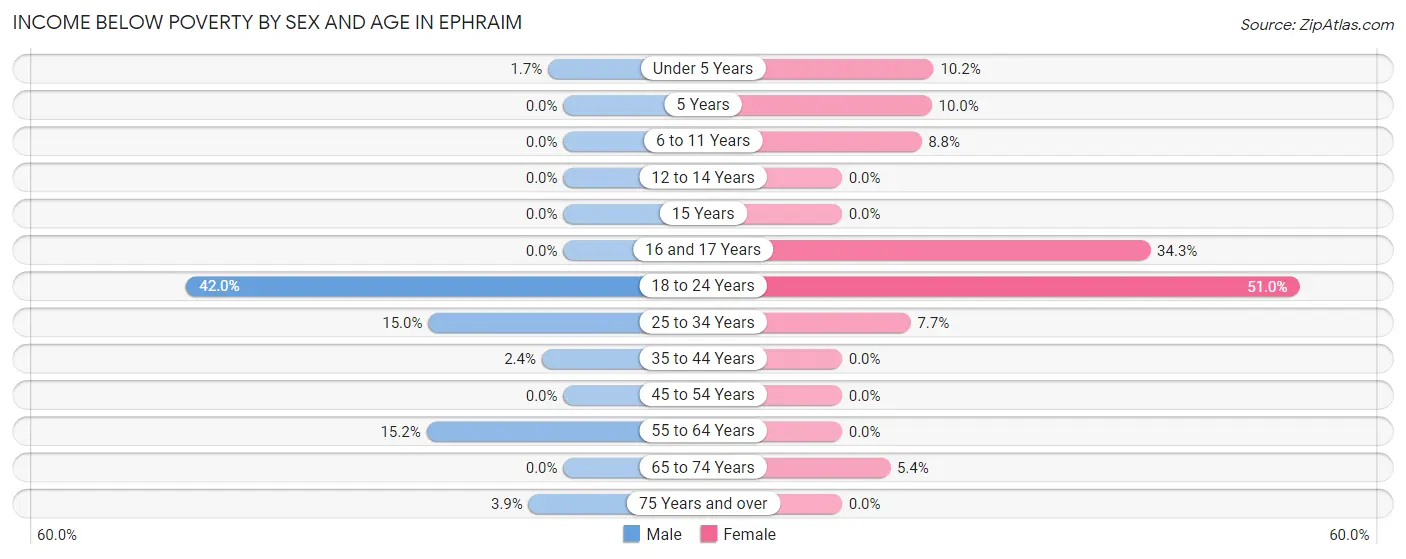
| Age Bracket | Male | Female |
| Under 5 Years | 4 (1.7%) | 24 (10.2%) |
| 5 Years | 0 (0.0%) | 4 (10.0%) |
| 6 to 11 Years | 0 (0.0%) | 16 (8.8%) |
| 12 to 14 Years | 0 (0.0%) | 0 (0.0%) |
| 15 Years | 0 (0.0%) | 0 (0.0%) |
| 16 and 17 Years | 0 (0.0%) | 34 (34.3%) |
| 18 to 24 Years | 306 (42.0%) | 431 (50.9%) |
| 25 to 34 Years | 40 (15.0%) | 25 (7.6%) |
| 35 to 44 Years | 5 (2.4%) | 0 (0.0%) |
| 45 to 54 Years | 0 (0.0%) | 0 (0.0%) |
| 55 to 64 Years | 16 (15.2%) | 0 (0.0%) |
| 65 to 74 Years | 0 (0.0%) | 8 (5.4%) |
| 75 Years and over | 4 (3.9%) | 0 (0.0%) |
| Total | 375 (14.5%) | 542 (19.6%) |
Income Above Poverty by Sex and Age in Ephraim
According to the poverty statistics in Ephraim, males aged 5 years and females aged 12 to 14 years are the age groups that are most secure financially, with 100.0% of males and 100.0% of females in these age groups living above the poverty line.
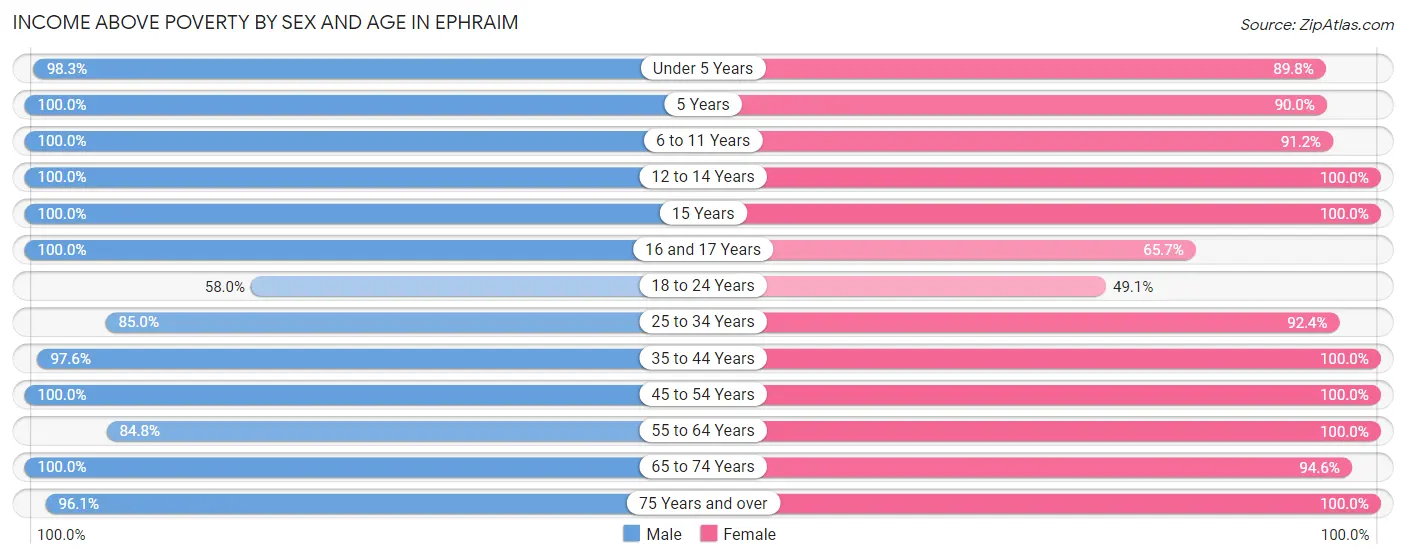
| Age Bracket | Male | Female |
| Under 5 Years | 231 (98.3%) | 211 (89.8%) |
| 5 Years | 51 (100.0%) | 36 (90.0%) |
| 6 to 11 Years | 191 (100.0%) | 165 (91.2%) |
| 12 to 14 Years | 117 (100.0%) | 108 (100.0%) |
| 15 Years | 36 (100.0%) | 19 (100.0%) |
| 16 and 17 Years | 133 (100.0%) | 65 (65.7%) |
| 18 to 24 Years | 423 (58.0%) | 415 (49.0%) |
| 25 to 34 Years | 226 (85.0%) | 302 (92.3%) |
| 35 to 44 Years | 203 (97.6%) | 284 (100.0%) |
| 45 to 54 Years | 246 (100.0%) | 187 (100.0%) |
| 55 to 64 Years | 89 (84.8%) | 141 (100.0%) |
| 65 to 74 Years | 171 (100.0%) | 141 (94.6%) |
| 75 Years and over | 99 (96.1%) | 145 (100.0%) |
| Total | 2,216 (85.5%) | 2,219 (80.4%) |
Income Below Poverty Among Married-Couple Families in Ephraim
The poverty statistics for married-couple families in Ephraim show that 4.1% or 38 of the total 917 families live below the poverty line. Families with 3 or 4 children have the highest poverty rate of 8.4%, comprising of 16 families. On the other hand, families with 1 or 2 children have the lowest poverty rate of 0.0%, which includes 0 families.
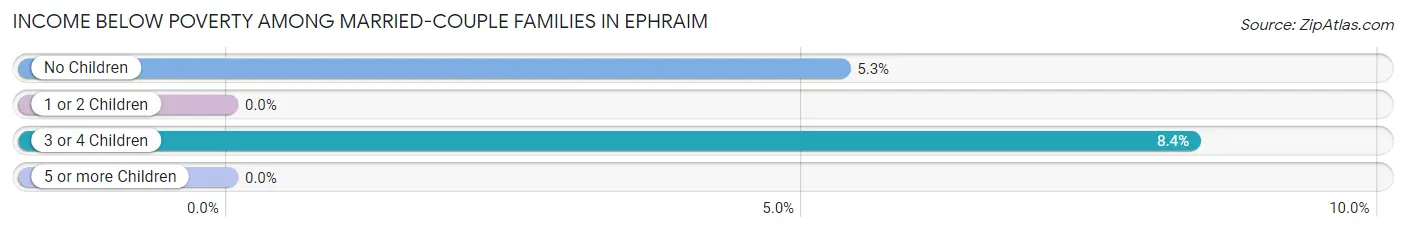
| Children | Above Poverty | Below Poverty |
| No Children | 391 (94.7%) | 22 (5.3%) |
| 1 or 2 Children | 226 (100.0%) | 0 (0.0%) |
| 3 or 4 Children | 175 (91.6%) | 16 (8.4%) |
| 5 or more Children | 87 (100.0%) | 0 (0.0%) |
| Total | 879 (95.9%) | 38 (4.1%) |
Income Below Poverty Among Single-Parent Households in Ephraim
| Children | Single Father | Single Mother |
| No Children | 0 (0.0%) | 0 (0.0%) |
| 1 or 2 Children | 0 (0.0%) | 0 (0.0%) |
| 3 or 4 Children | 0 (0.0%) | 0 (0.0%) |
| 5 or more Children | 0 (0.0%) | 0 (0.0%) |
| Total | 0 (0.0%) | 0 (0.0%) |
Income Below Poverty Among Married-Couple vs Single-Parent Households in Ephraim
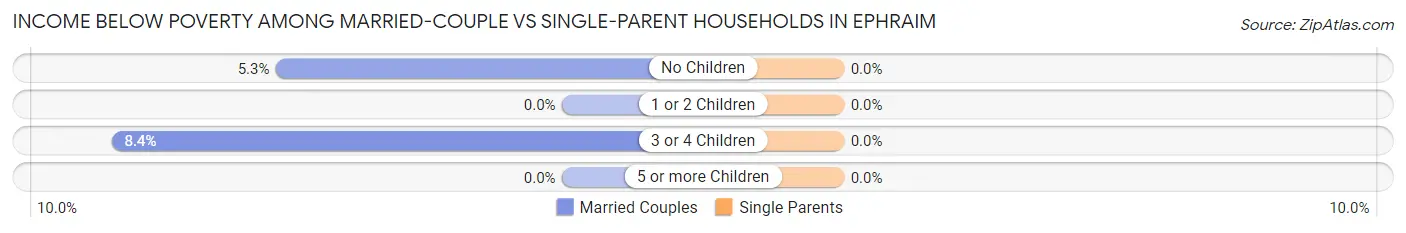
| Children | Married-Couple Families | Single-Parent Households |
| No Children | 22 (5.3%) | 0 (0.0%) |
| 1 or 2 Children | 0 (0.0%) | 0 (0.0%) |
| 3 or 4 Children | 16 (8.4%) | 0 (0.0%) |
| 5 or more Children | 0 (0.0%) | 0 (0.0%) |
| Total | 38 (4.1%) | 0 (0.0%) |
Race in Ephraim
The most populous races in Ephraim are White / Caucasian (5,260 | 91.6%), Hispanic or Latino (297 | 5.2%), and Some other Race (242 | 4.2%).
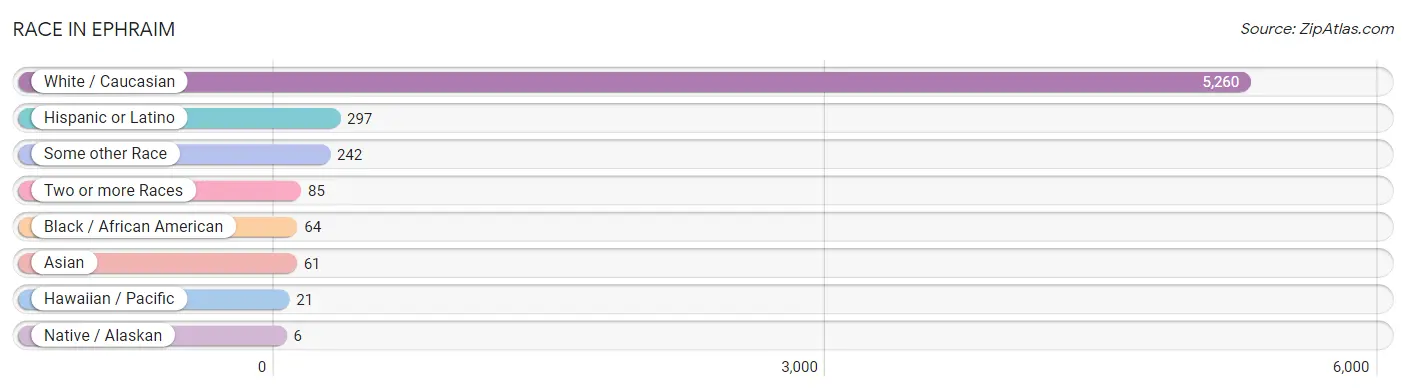
| Race | # Population | % Population |
| Asian | 61 | 1.1% |
| Black / African American | 64 | 1.1% |
| Hawaiian / Pacific | 21 | 0.4% |
| Hispanic or Latino | 297 | 5.2% |
| Native / Alaskan | 6 | 0.1% |
| White / Caucasian | 5,260 | 91.6% |
| Two or more Races | 85 | 1.5% |
| Some other Race | 242 | 4.2% |
| Total | 5,739 | 100.0% |
Ancestry in Ephraim
The most populous ancestries reported in Ephraim are English (1,733 | 30.2%), Scandinavian (419 | 7.3%), European (418 | 7.3%), Danish (404 | 7.0%), and Irish (316 | 5.5%), together accounting for 57.3% of all Ephraim residents.
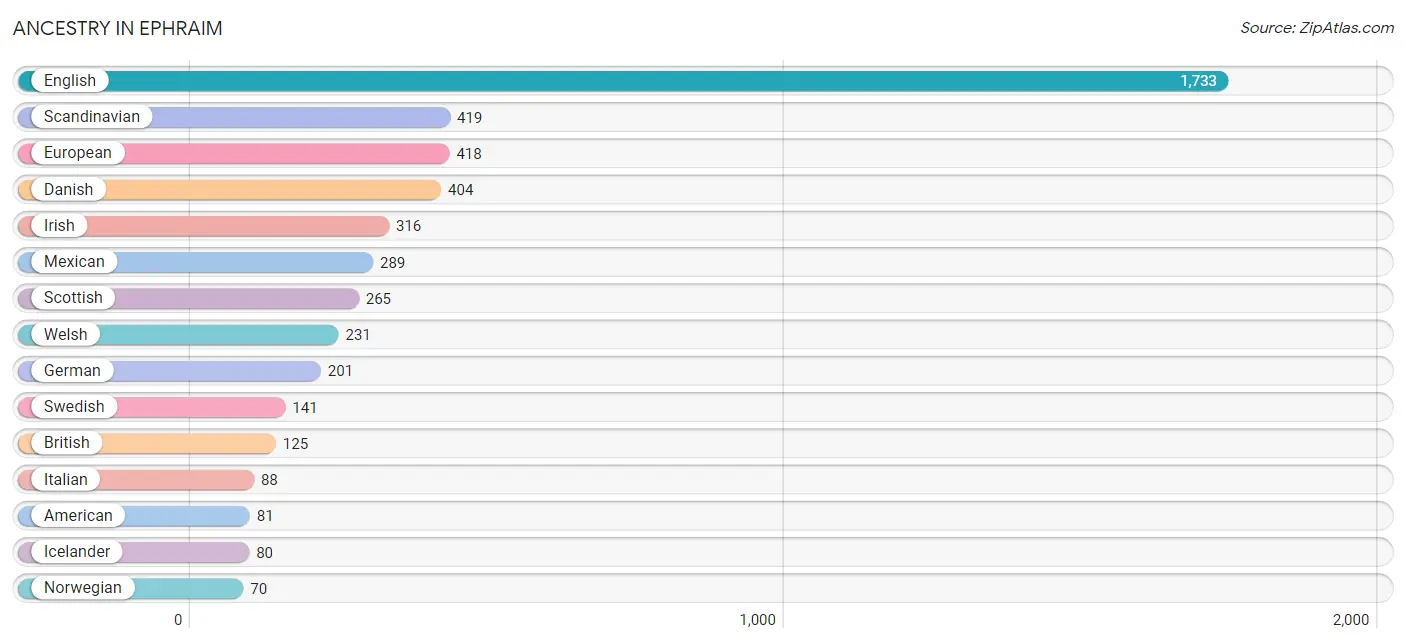
| Ancestry | # Population | % Population |
| African | 8 | 0.1% |
| American | 81 | 1.4% |
| Argentinean | 7 | 0.1% |
| Australian | 6 | 0.1% |
| Bhutanese | 31 | 0.5% |
| Brazilian | 15 | 0.3% |
| British | 125 | 2.2% |
| Burmese | 5 | 0.1% |
| Canadian | 61 | 1.1% |
| Chilean | 1 | 0.0% |
| Creek | 8 | 0.1% |
| Croatian | 36 | 0.6% |
| Danish | 404 | 7.0% |
| Dutch | 31 | 0.5% |
| English | 1,733 | 30.2% |
| European | 418 | 7.3% |
| French | 38 | 0.7% |
| French Canadian | 12 | 0.2% |
| German | 201 | 3.5% |
| Greek | 7 | 0.1% |
| Hungarian | 14 | 0.2% |
| Icelander | 80 | 1.4% |
| Irish | 316 | 5.5% |
| Italian | 88 | 1.5% |
| Korean | 20 | 0.4% |
| Malaysian | 27 | 0.5% |
| Mexican | 289 | 5.0% |
| Native Hawaiian | 15 | 0.3% |
| Norwegian | 70 | 1.2% |
| Polish | 6 | 0.1% |
| Portuguese | 2 | 0.0% |
| Russian | 31 | 0.5% |
| Samoan | 35 | 0.6% |
| Scandinavian | 419 | 7.3% |
| Scotch-Irish | 27 | 0.5% |
| Scottish | 265 | 4.6% |
| South American | 8 | 0.1% |
| Sri Lankan | 22 | 0.4% |
| Subsaharan African | 8 | 0.1% |
| Swedish | 141 | 2.5% |
| Swiss | 34 | 0.6% |
| Tongan | 2 | 0.0% |
| Ute | 3 | 0.1% |
| Welsh | 231 | 4.0% | View All 44 Rows |
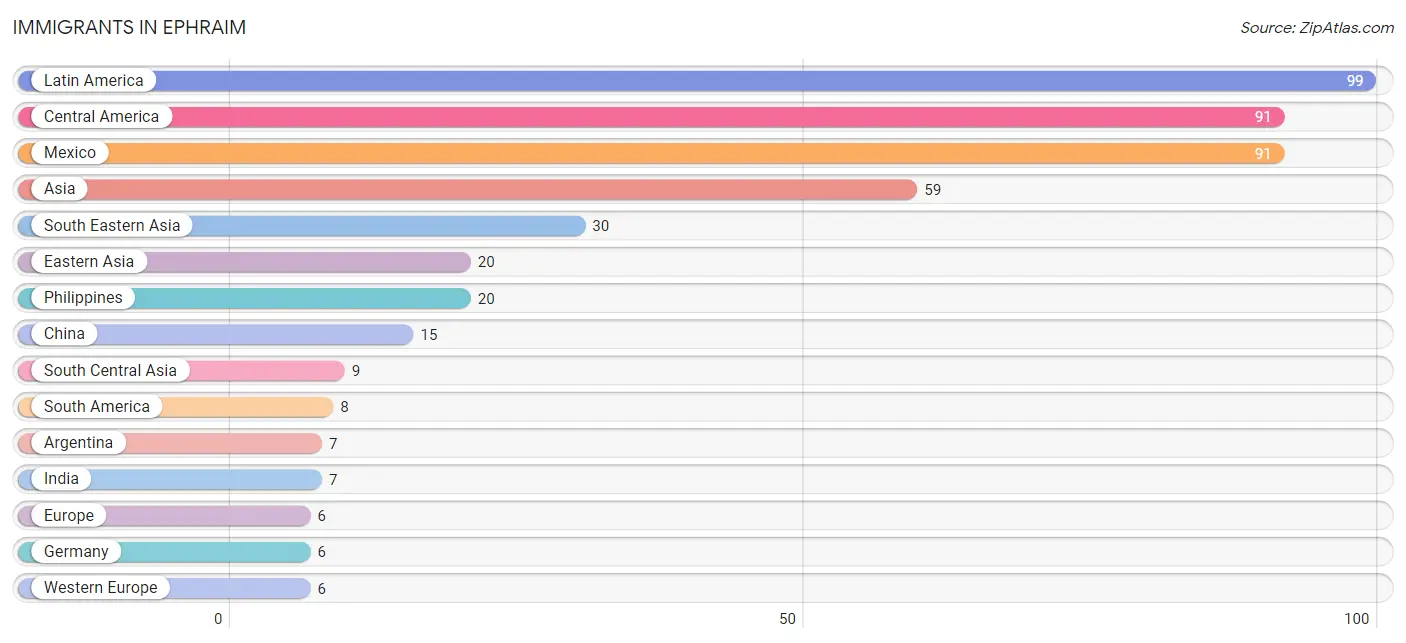
Immigrants in Ephraim
The most numerous immigrant groups reported in Ephraim came from Latin America (99 | 1.7%), Central America (91 | 1.6%), Mexico (91 | 1.6%), Asia (59 | 1.0%), and South Eastern Asia (30 | 0.5%), together accounting for 6.5% of all Ephraim residents.
| Immigration Origin | # Population | % Population |
| Argentina | 7 | 0.1% |
| Asia | 59 | 1.0% |
| Central America | 91 | 1.6% |
| Chile | 1 | 0.0% |
| China | 15 | 0.3% |
| Eastern Asia | 20 | 0.4% |
| Europe | 6 | 0.1% |
| Germany | 6 | 0.1% |
| India | 7 | 0.1% |
| Korea | 5 | 0.1% |
| Latin America | 99 | 1.7% |
| Mexico | 91 | 1.6% |
| Oceania | 4 | 0.1% |
| Philippines | 20 | 0.4% |
| South America | 8 | 0.1% |
| South Central Asia | 9 | 0.2% |
| South Eastern Asia | 30 | 0.5% |
| Sri Lanka | 2 | 0.0% |
| Thailand | 5 | 0.1% |
| Vietnam | 5 | 0.1% |
| Western Europe | 6 | 0.1% | View All 21 Rows |
Sex and Age in Ephraim
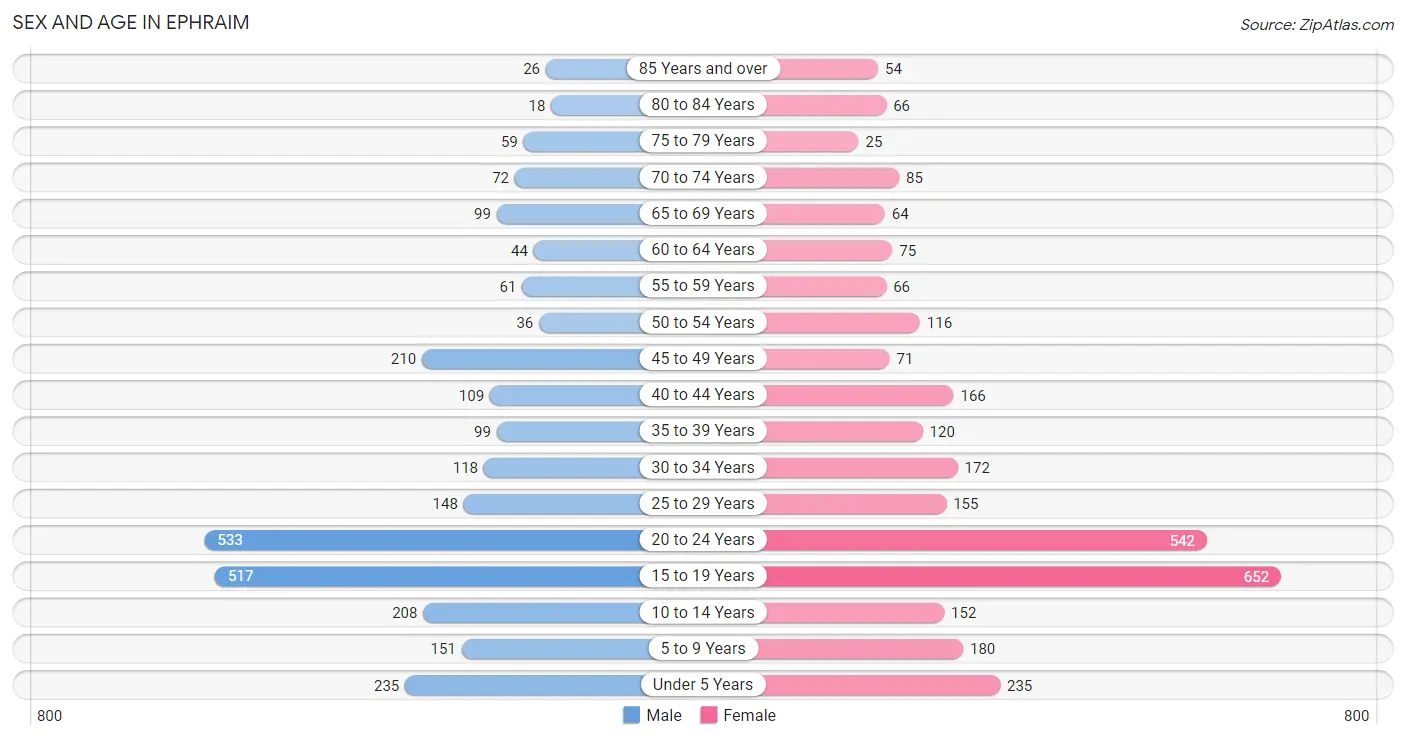
Sex and Age in Ephraim
The most populous age groups in Ephraim are 20 to 24 Years (533 | 19.4%) for men and 15 to 19 Years (652 | 21.8%) for women.
| Age Bracket | Male | Female |
| Under 5 Years | 235 (8.6%) | 235 (7.8%) |
| 5 to 9 Years | 151 (5.5%) | 180 (6.0%) |
| 10 to 14 Years | 208 (7.6%) | 152 (5.1%) |
| 15 to 19 Years | 517 (18.9%) | 652 (21.8%) |
| 20 to 24 Years | 533 (19.4%) | 542 (18.1%) |
| 25 to 29 Years | 148 (5.4%) | 155 (5.2%) |
| 30 to 34 Years | 118 (4.3%) | 172 (5.7%) |
| 35 to 39 Years | 99 (3.6%) | 120 (4.0%) |
| 40 to 44 Years | 109 (4.0%) | 166 (5.5%) |
| 45 to 49 Years | 210 (7.7%) | 71 (2.4%) |
| 50 to 54 Years | 36 (1.3%) | 116 (3.9%) |
| 55 to 59 Years | 61 (2.2%) | 66 (2.2%) |
| 60 to 64 Years | 44 (1.6%) | 75 (2.5%) |
| 65 to 69 Years | 99 (3.6%) | 64 (2.1%) |
| 70 to 74 Years | 72 (2.6%) | 85 (2.8%) |
| 75 to 79 Years | 59 (2.1%) | 25 (0.8%) |
| 80 to 84 Years | 18 (0.7%) | 66 (2.2%) |
| 85 Years and over | 26 (0.9%) | 54 (1.8%) |
| Total | 2,743 (100.0%) | 2,996 (100.0%) |
Families and Households in Ephraim
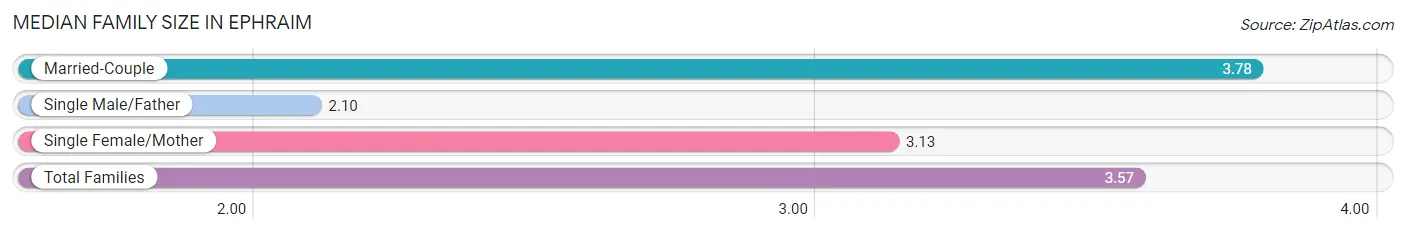
Median Family Size in Ephraim
The median family size in Ephraim is 3.57 persons per family, with married-couple families (917 | 84.8%) accounting for the largest median family size of 3.78 persons per family. On the other hand, single male/father families (118 | 10.9%) represent the smallest median family size with 2.10 persons per family.
| Family Type | # Families | Family Size |
| Married-Couple | 917 (84.8%) | 3.78 |
| Single Male/Father | 118 (10.9%) | 2.10 |
| Single Female/Mother | 47 (4.3%) | 3.13 |
| Total Families | 1,082 (100.0%) | 3.57 |
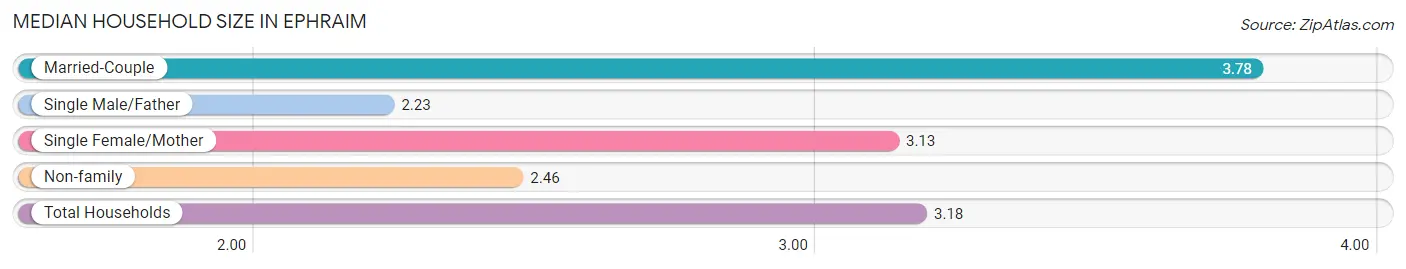
Median Household Size in Ephraim
The median household size in Ephraim is 3.18 persons per household, with married-couple households (917 | 54.5%) accounting for the largest median household size of 3.78 persons per household. single male/father households (118 | 7.0%) represent the smallest median household size with 2.23 persons per household.
| Household Type | # Households | Household Size |
| Married-Couple | 917 (54.5%) | 3.78 |
| Single Male/Father | 118 (7.0%) | 2.23 |
| Single Female/Mother | 47 (2.8%) | 3.13 |
| Non-family | 599 (35.6%) | 2.46 |
| Total Households | 1,681 (100.0%) | 3.18 |
Household Size by Marriage Status in Ephraim
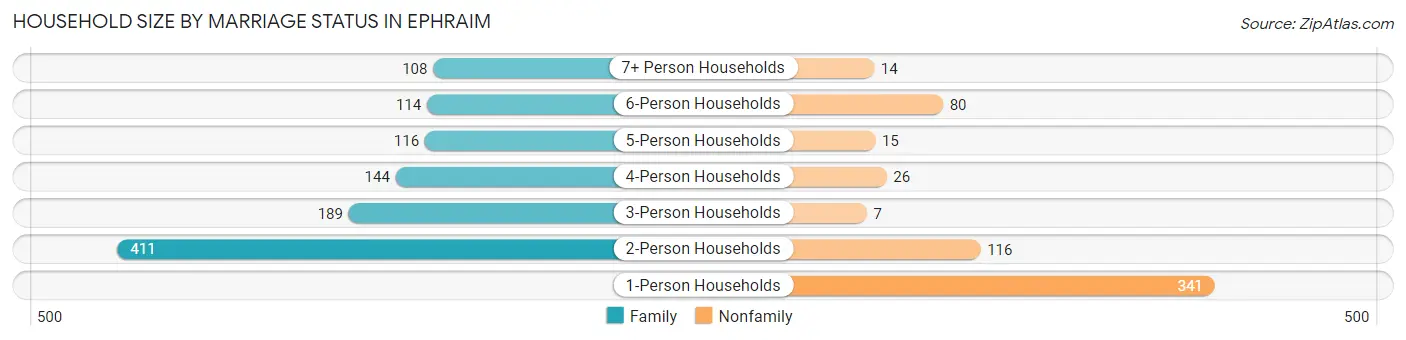
Out of a total of 1,681 households in Ephraim, 1,082 (64.4%) are family households, while 599 (35.6%) are nonfamily households. The most numerous type of family households are 2-person households, comprising 411, and the most common type of nonfamily households are 1-person households, comprising 341.
| Household Size | Family Households | Nonfamily Households |
| 1-Person Households | - | 341 (20.3%) |
| 2-Person Households | 411 (24.4%) | 116 (6.9%) |
| 3-Person Households | 189 (11.2%) | 7 (0.4%) |
| 4-Person Households | 144 (8.6%) | 26 (1.5%) |
| 5-Person Households | 116 (6.9%) | 15 (0.9%) |
| 6-Person Households | 114 (6.8%) | 80 (4.8%) |
| 7+ Person Households | 108 (6.4%) | 14 (0.8%) |
| Total | 1,082 (64.4%) | 599 (35.6%) |
Female Fertility in Ephraim
Fertility by Age in Ephraim
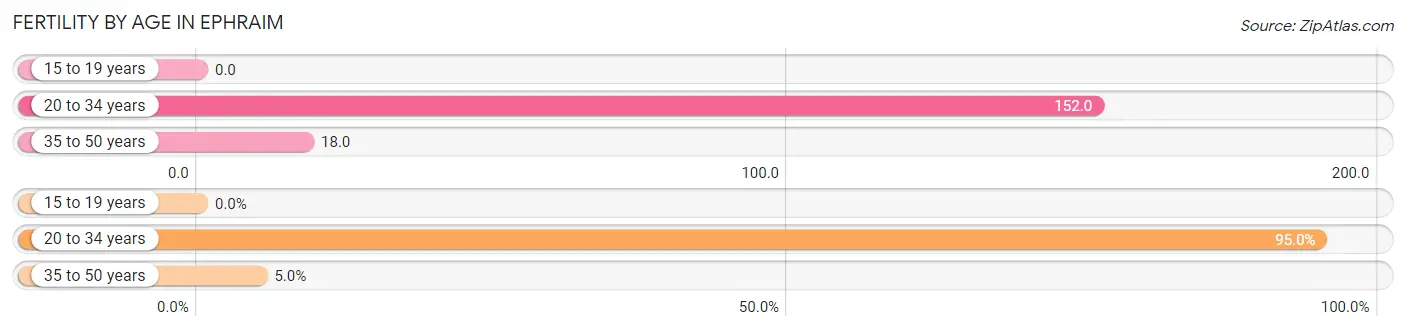
Average fertility rate in Ephraim is 73.0 births per 1,000 women. Women in the age bracket of 20 to 34 years have the highest fertility rate with 152.0 births per 1,000 women. Women in the age bracket of 20 to 34 years acount for 95.0% of all women with births.
| Age Bracket | Women with Births | Births / 1,000 Women |
| 15 to 19 years | 0 (0.0%) | 0.0 |
| 20 to 34 years | 132 (95.0%) | 152.0 |
| 35 to 50 years | 7 (5.0%) | 18.0 |
| Total | 139 (100.0%) | 73.0 |
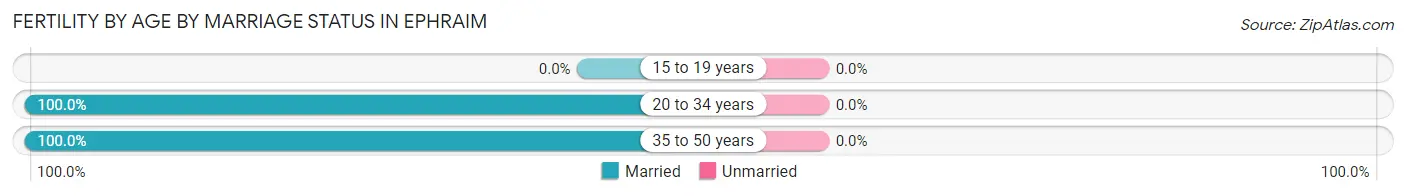
Fertility by Age by Marriage Status in Ephraim
| Age Bracket | Married | Unmarried |
| 15 to 19 years | 0 (0.0%) | 0 (0.0%) |
| 20 to 34 years | 132 (100.0%) | 0 (0.0%) |
| 35 to 50 years | 7 (100.0%) | 0 (0.0%) |
| Total | 139 (100.0%) | 0 (0.0%) |
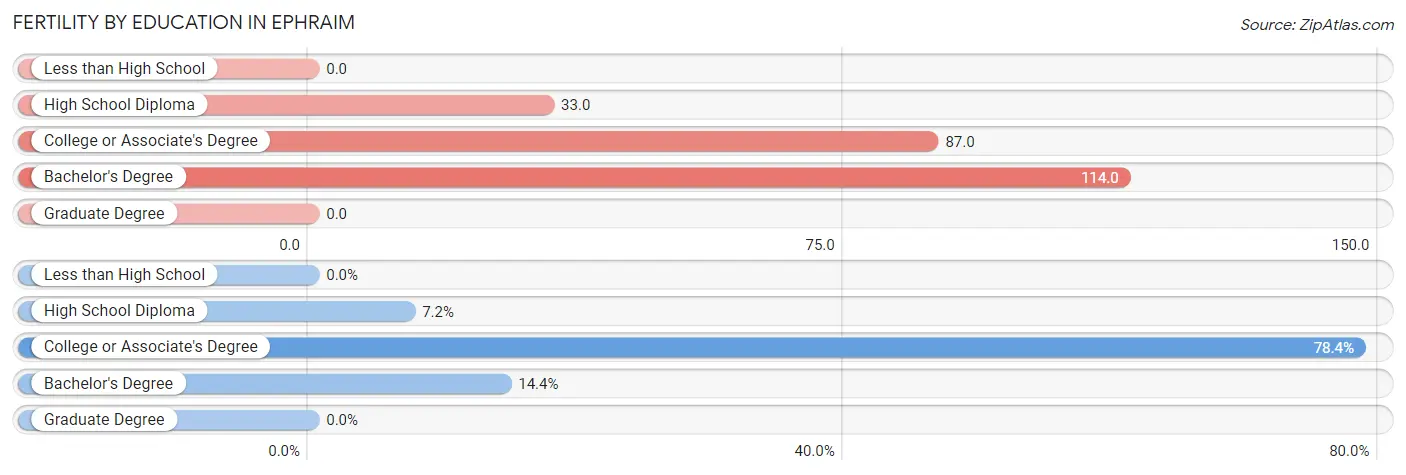
Fertility by Education in Ephraim
| Educational Attainment | Women with Births | Births / 1,000 Women |
| Less than High School | 0 (0.0%) | 0.0 |
| High School Diploma | 10 (7.2%) | 33.0 |
| College or Associate's Degree | 109 (78.4%) | 87.0 |
| Bachelor's Degree | 20 (14.4%) | 114.0 |
| Graduate Degree | 0 (0.0%) | 0.0 |
| Total | 139 (100.0%) | 73.0 |
Fertility by Education by Marriage Status in Ephraim
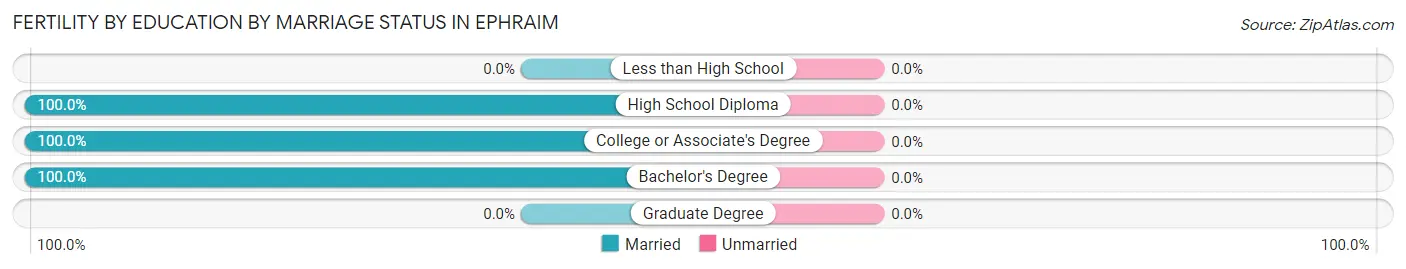
| Educational Attainment | Married | Unmarried |
| Less than High School | 0 (0.0%) | 0 (0.0%) |
| High School Diploma | 10 (100.0%) | 0 (0.0%) |
| College or Associate's Degree | 109 (100.0%) | 0 (0.0%) |
| Bachelor's Degree | 20 (100.0%) | 0 (0.0%) |
| Graduate Degree | 0 (0.0%) | 0 (0.0%) |
| Total | 139 (100.0%) | 0 (0.0%) |
Employment Characteristics in Ephraim
Employment by Class of Employer in Ephraim
Among the 2,714 employed individuals in Ephraim, private company employees (1,638 | 60.4%), state government employees (537 | 19.8%), and local government employees (194 | 7.1%) make up the most common classes of employment.
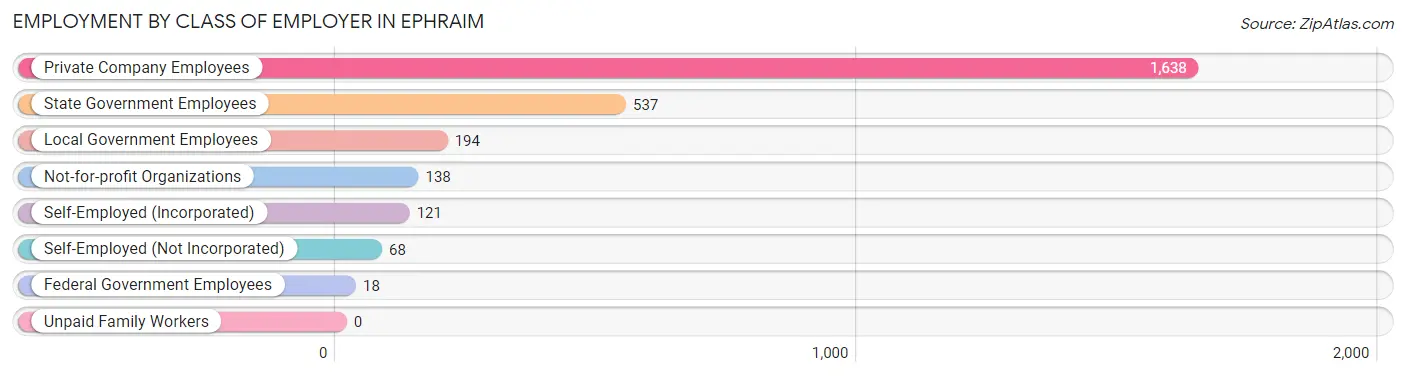
| Employer Class | # Employees | % Employees |
| Private Company Employees | 1,638 | 60.4% |
| Self-Employed (Incorporated) | 121 | 4.5% |
| Self-Employed (Not Incorporated) | 68 | 2.5% |
| Not-for-profit Organizations | 138 | 5.1% |
| Local Government Employees | 194 | 7.1% |
| State Government Employees | 537 | 19.8% |
| Federal Government Employees | 18 | 0.7% |
| Unpaid Family Workers | 0 | 0.0% |
| Total | 2,714 | 100.0% |
Employment Status by Age in Ephraim
According to the labor force statistics for Ephraim, out of the total population over 16 years of age (4,519), 66.3% or 2,996 individuals are in the labor force, with 8.4% or 252 of them unemployed. The age group with the highest labor force participation rate is 35 to 44 years, with 91.5% or 452 individuals in the labor force. Within the labor force, the 16 to 19 years age range has the highest percentage of unemployed individuals, with 17.4% or 97 of them being unemployed.
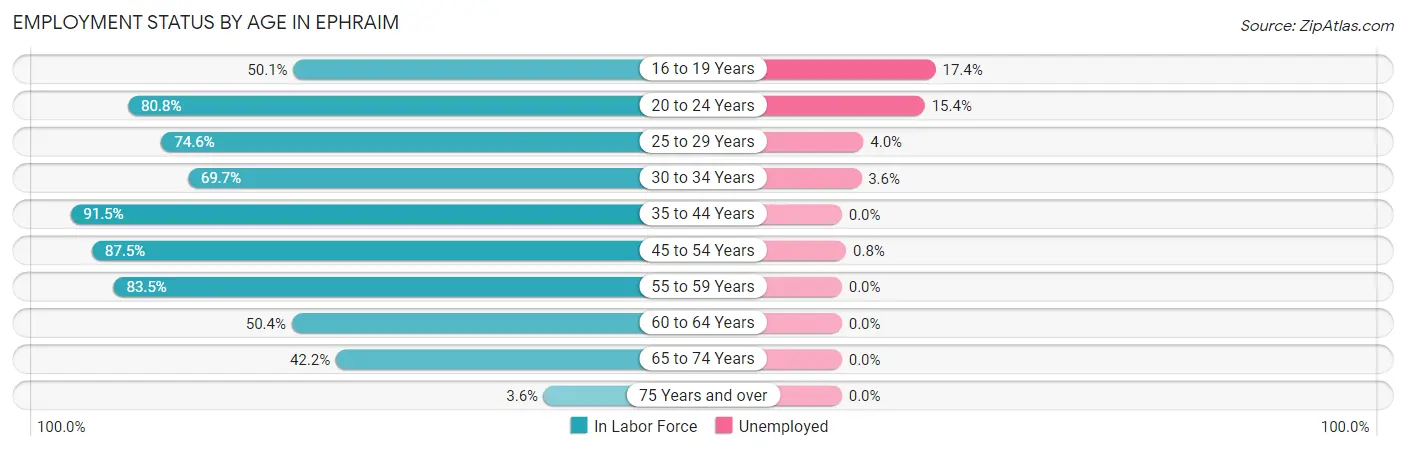
| Age Bracket | In Labor Force | Unemployed |
| 16 to 19 Years | 556 (50.1%) | 97 (17.4%) |
| 20 to 24 Years | 869 (80.8%) | 134 (15.4%) |
| 25 to 29 Years | 226 (74.6%) | 9 (4.0%) |
| 30 to 34 Years | 202 (69.7%) | 7 (3.6%) |
| 35 to 44 Years | 452 (91.5%) | 0 (0.0%) |
| 45 to 54 Years | 379 (87.5%) | 3 (0.8%) |
| 55 to 59 Years | 106 (83.5%) | 0 (0.0%) |
| 60 to 64 Years | 60 (50.4%) | 0 (0.0%) |
| 65 to 74 Years | 135 (42.2%) | 0 (0.0%) |
| 75 Years and over | 9 (3.6%) | 0 (0.0%) |
| Total | 2,996 (66.3%) | 252 (8.4%) |
Employment Status by Educational Attainment in Ephraim
According to labor force statistics for Ephraim, 80.7% of individuals (1,425) out of the total population between 25 and 64 years of age (1,766) are in the labor force, with 1.3% or 19 of them being unemployed. The group with the highest labor force participation rate are those with the educational attainment of bachelor's degree or higher, with 92.9% or 578 individuals in the labor force. Within the labor force, individuals with less than high school education have the highest percentage of unemployment, with 5.3% or 5 of them being unemployed.
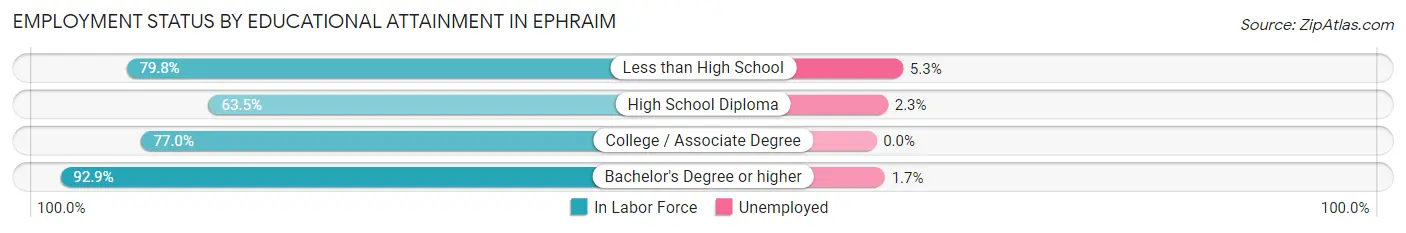
| Educational Attainment | In Labor Force | Unemployed |
| Less than High School | 95 (79.8%) | 6 (5.3%) |
| High School Diploma | 176 (63.5%) | 6 (2.3%) |
| College / Associate Degree | 576 (77.0%) | 0 (0.0%) |
| Bachelor's Degree or higher | 578 (92.9%) | 11 (1.7%) |
| Total | 1,425 (80.7%) | 23 (1.3%) |
Employment Occupations by Sex in Ephraim
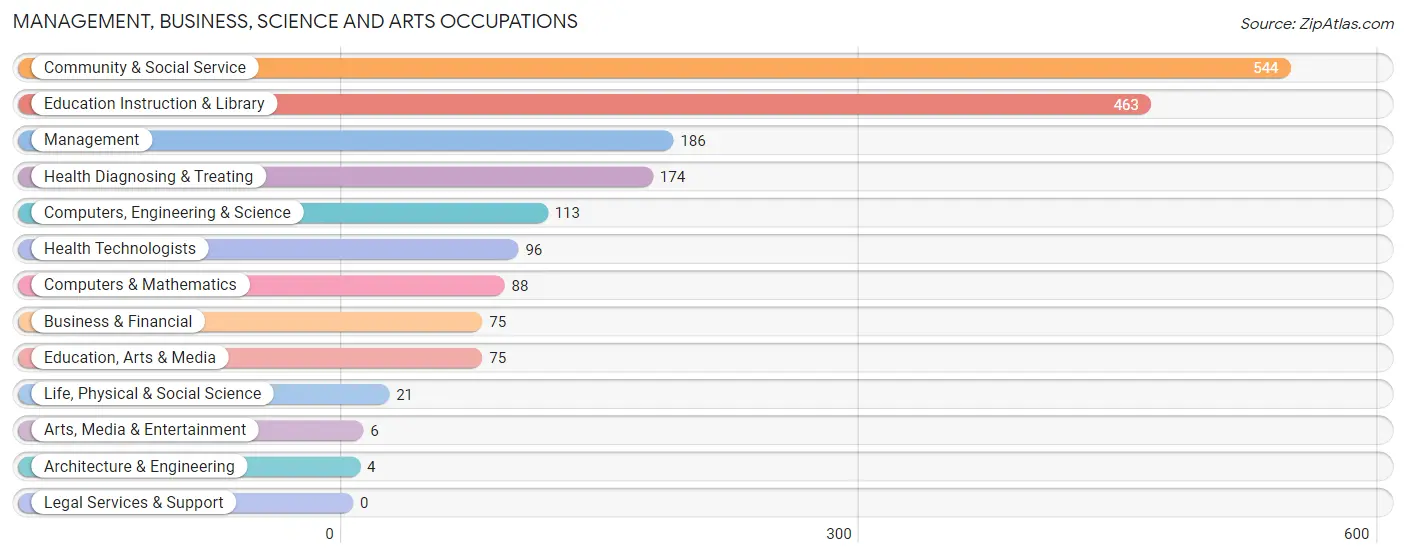
Management, Business, Science and Arts Occupations
The most common Management, Business, Science and Arts occupations in Ephraim are Community & Social Service (544 | 19.9%), Education Instruction & Library (463 | 17.0%), Management (186 | 6.8%), Health Diagnosing & Treating (174 | 6.4%), and Computers, Engineering & Science (113 | 4.1%).
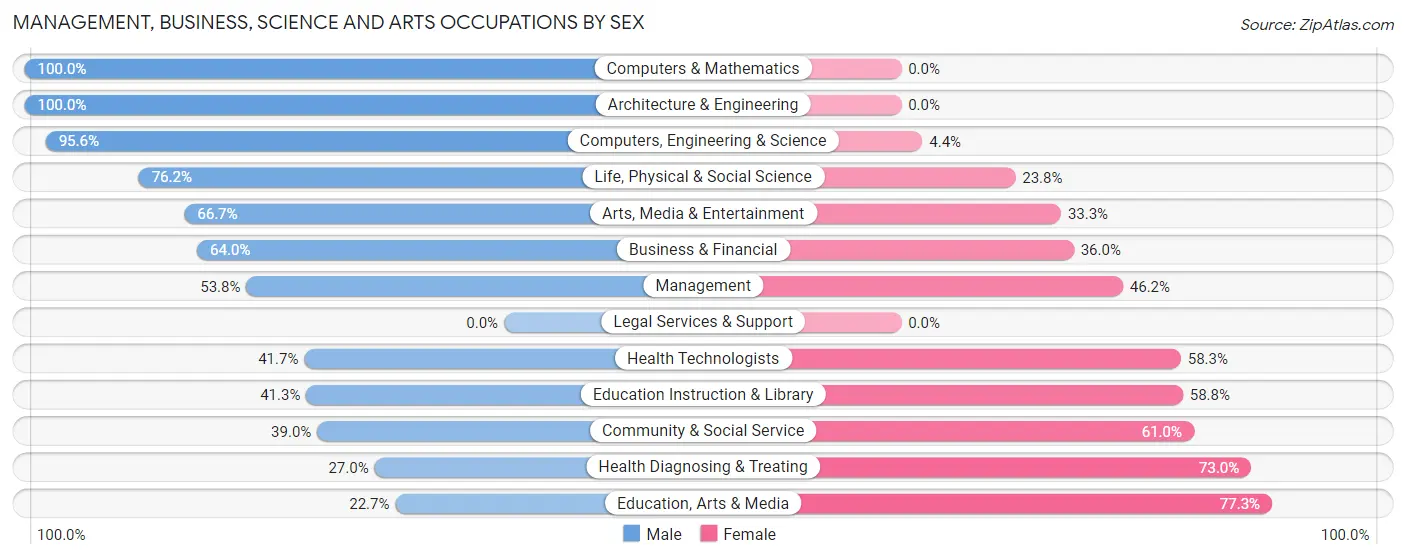
Management, Business, Science and Arts Occupations by Sex
Within the Management, Business, Science and Arts occupations in Ephraim, the most male-oriented occupations are Computers & Mathematics (100.0%), Architecture & Engineering (100.0%), and Computers, Engineering & Science (95.6%), while the most female-oriented occupations are Education, Arts & Media (77.3%), Health Diagnosing & Treating (73.0%), and Community & Social Service (61.0%).
| Occupation | Male | Female |
| Management | 100 (53.8%) | 86 (46.2%) |
| Business & Financial | 48 (64.0%) | 27 (36.0%) |
| Computers, Engineering & Science | 108 (95.6%) | 5 (4.4%) |
| Computers & Mathematics | 88 (100.0%) | 0 (0.0%) |
| Architecture & Engineering | 4 (100.0%) | 0 (0.0%) |
| Life, Physical & Social Science | 16 (76.2%) | 5 (23.8%) |
| Community & Social Service | 212 (39.0%) | 332 (61.0%) |
| Education, Arts & Media | 17 (22.7%) | 58 (77.3%) |
| Legal Services & Support | 0 (0.0%) | 0 (0.0%) |
| Education Instruction & Library | 191 (41.2%) | 272 (58.8%) |
| Arts, Media & Entertainment | 4 (66.7%) | 2 (33.3%) |
| Health Diagnosing & Treating | 47 (27.0%) | 127 (73.0%) |
| Health Technologists | 40 (41.7%) | 56 (58.3%) |
| Total (Category) | 515 (47.2%) | 577 (52.8%) |
| Total (Overall) | 1,323 (48.4%) | 1,409 (51.6%) |
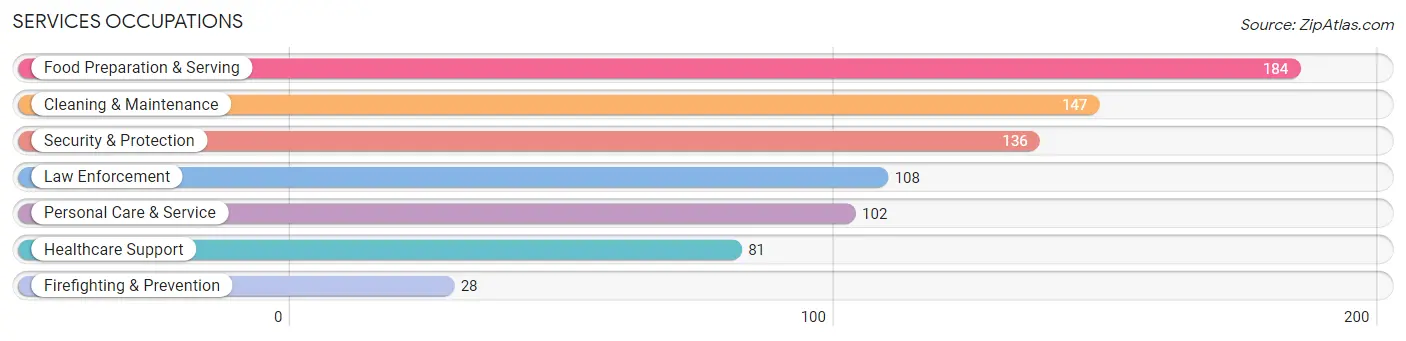
Services Occupations
The most common Services occupations in Ephraim are Food Preparation & Serving (184 | 6.7%), Cleaning & Maintenance (147 | 5.4%), Security & Protection (136 | 5.0%), Law Enforcement (108 | 4.0%), and Personal Care & Service (102 | 3.7%).
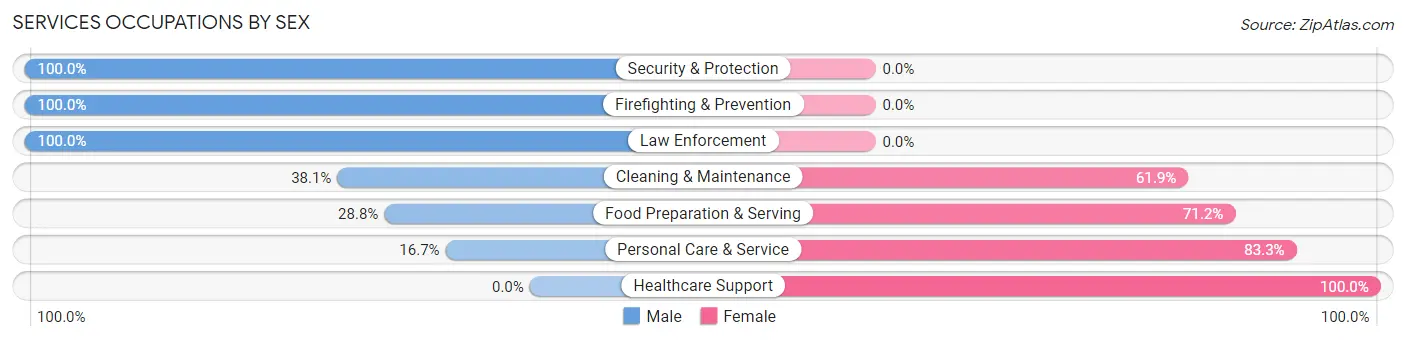
Services Occupations by Sex
Within the Services occupations in Ephraim, the most male-oriented occupations are Security & Protection (100.0%), Firefighting & Prevention (100.0%), and Law Enforcement (100.0%), while the most female-oriented occupations are Healthcare Support (100.0%), Personal Care & Service (83.3%), and Food Preparation & Serving (71.2%).
| Occupation | Male | Female |
| Healthcare Support | 0 (0.0%) | 81 (100.0%) |
| Security & Protection | 136 (100.0%) | 0 (0.0%) |
| Firefighting & Prevention | 28 (100.0%) | 0 (0.0%) |
| Law Enforcement | 108 (100.0%) | 0 (0.0%) |
| Food Preparation & Serving | 53 (28.8%) | 131 (71.2%) |
| Cleaning & Maintenance | 56 (38.1%) | 91 (61.9%) |
| Personal Care & Service | 17 (16.7%) | 85 (83.3%) |
| Total (Category) | 262 (40.3%) | 388 (59.7%) |
| Total (Overall) | 1,323 (48.4%) | 1,409 (51.6%) |
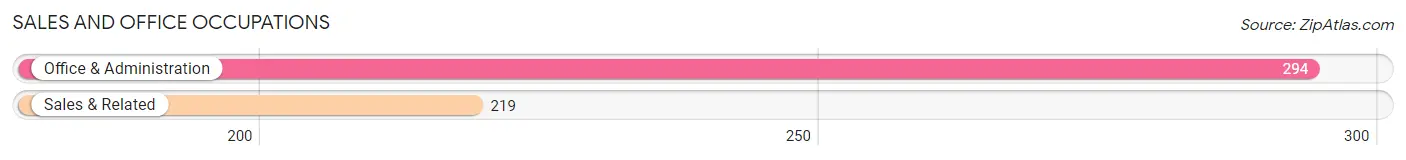
Sales and Office Occupations
The most common Sales and Office occupations in Ephraim are Office & Administration (294 | 10.8%), and Sales & Related (219 | 8.0%).
Sales and Office Occupations by Sex
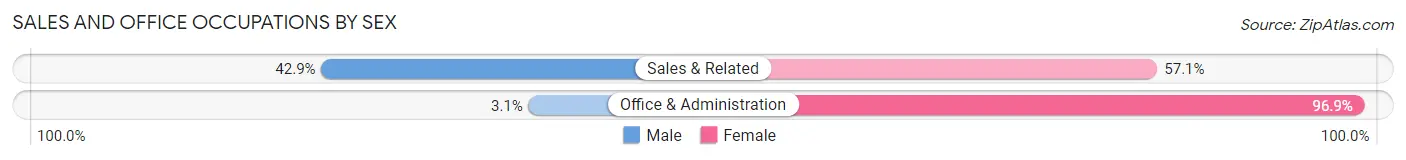
| Occupation | Male | Female |
| Sales & Related | 94 (42.9%) | 125 (57.1%) |
| Office & Administration | 9 (3.1%) | 285 (96.9%) |
| Total (Category) | 103 (20.1%) | 410 (79.9%) |
| Total (Overall) | 1,323 (48.4%) | 1,409 (51.6%) |
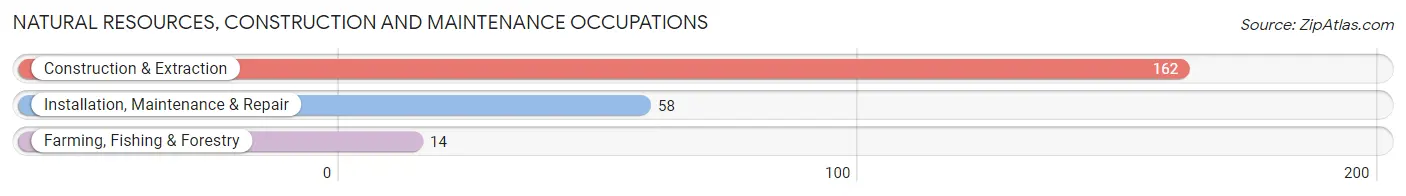
Natural Resources, Construction and Maintenance Occupations
The most common Natural Resources, Construction and Maintenance occupations in Ephraim are Construction & Extraction (162 | 5.9%), Installation, Maintenance & Repair (58 | 2.1%), and Farming, Fishing & Forestry (14 | 0.5%).
Natural Resources, Construction and Maintenance Occupations by Sex
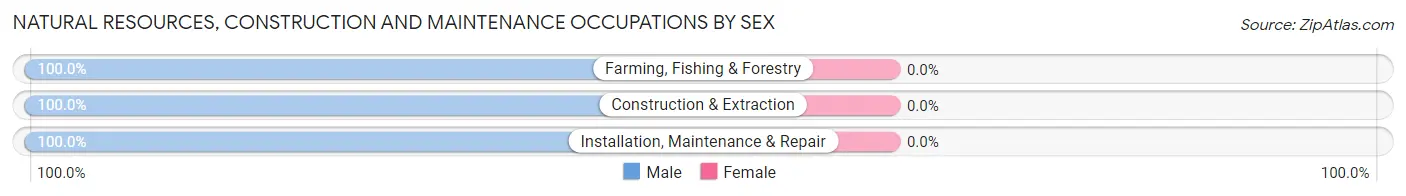
| Occupation | Male | Female |
| Farming, Fishing & Forestry | 14 (100.0%) | 0 (0.0%) |
| Construction & Extraction | 162 (100.0%) | 0 (0.0%) |
| Installation, Maintenance & Repair | 58 (100.0%) | 0 (0.0%) |
| Total (Category) | 234 (100.0%) | 0 (0.0%) |
| Total (Overall) | 1,323 (48.4%) | 1,409 (51.6%) |
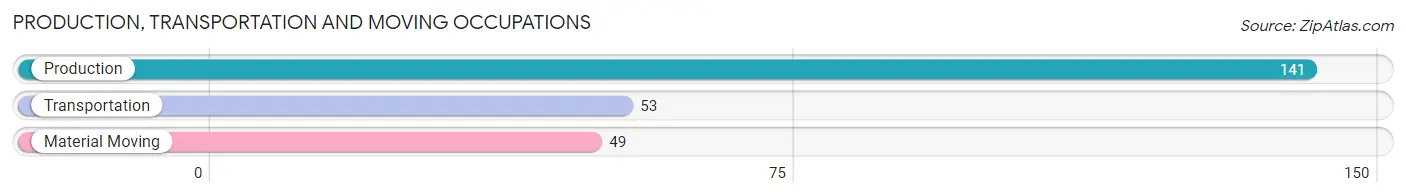
Production, Transportation and Moving Occupations
The most common Production, Transportation and Moving occupations in Ephraim are Production (141 | 5.2%), Transportation (53 | 1.9%), and Material Moving (49 | 1.8%).
Production, Transportation and Moving Occupations by Sex
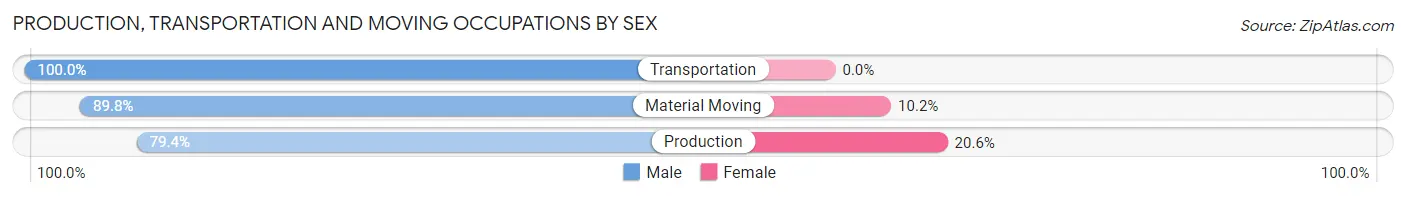
| Occupation | Male | Female |
| Production | 112 (79.4%) | 29 (20.6%) |
| Transportation | 53 (100.0%) | 0 (0.0%) |
| Material Moving | 44 (89.8%) | 5 (10.2%) |
| Total (Category) | 209 (86.0%) | 34 (14.0%) |
| Total (Overall) | 1,323 (48.4%) | 1,409 (51.6%) |
Employment Industries by Sex in Ephraim
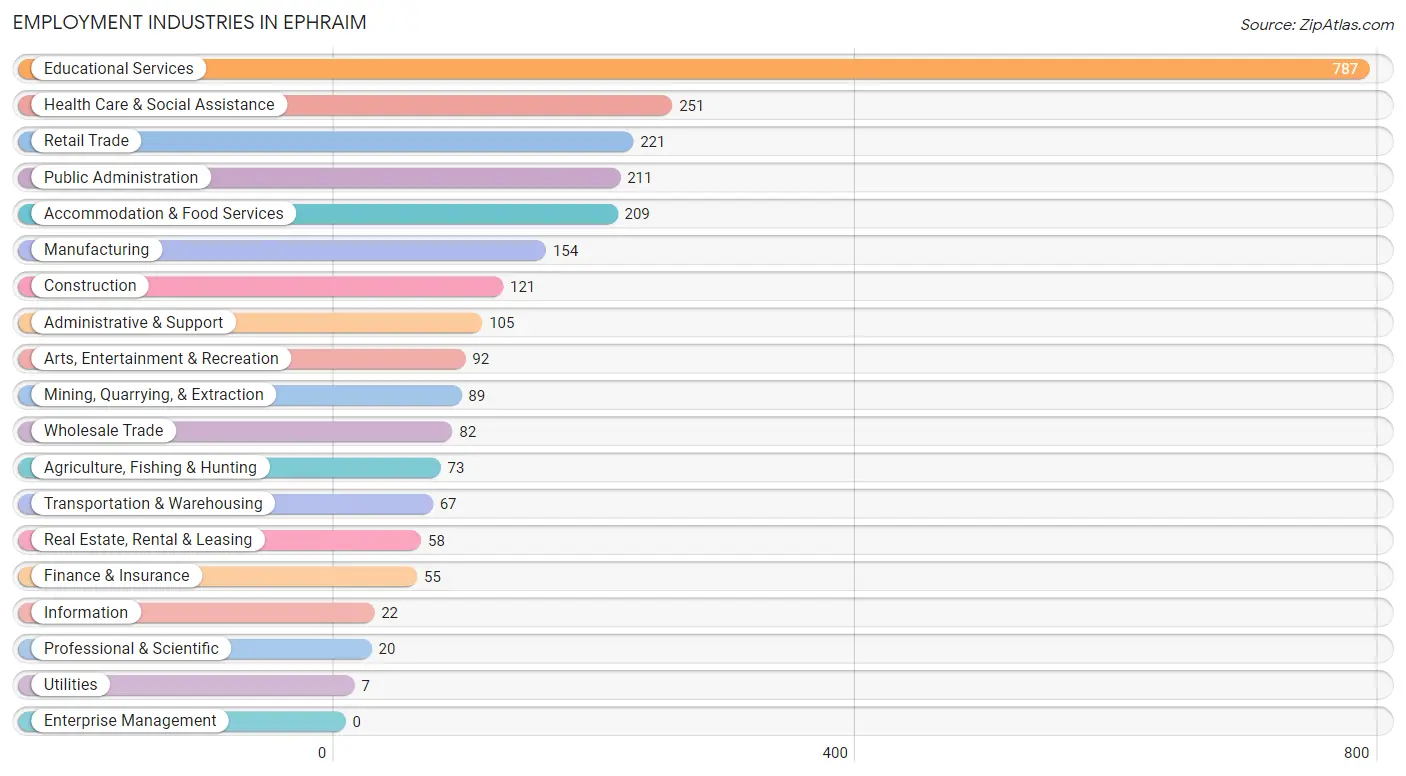
Employment Industries in Ephraim
The major employment industries in Ephraim include Educational Services (787 | 28.8%), Health Care & Social Assistance (251 | 9.2%), Retail Trade (221 | 8.1%), Public Administration (211 | 7.7%), and Accommodation & Food Services (209 | 7.6%).
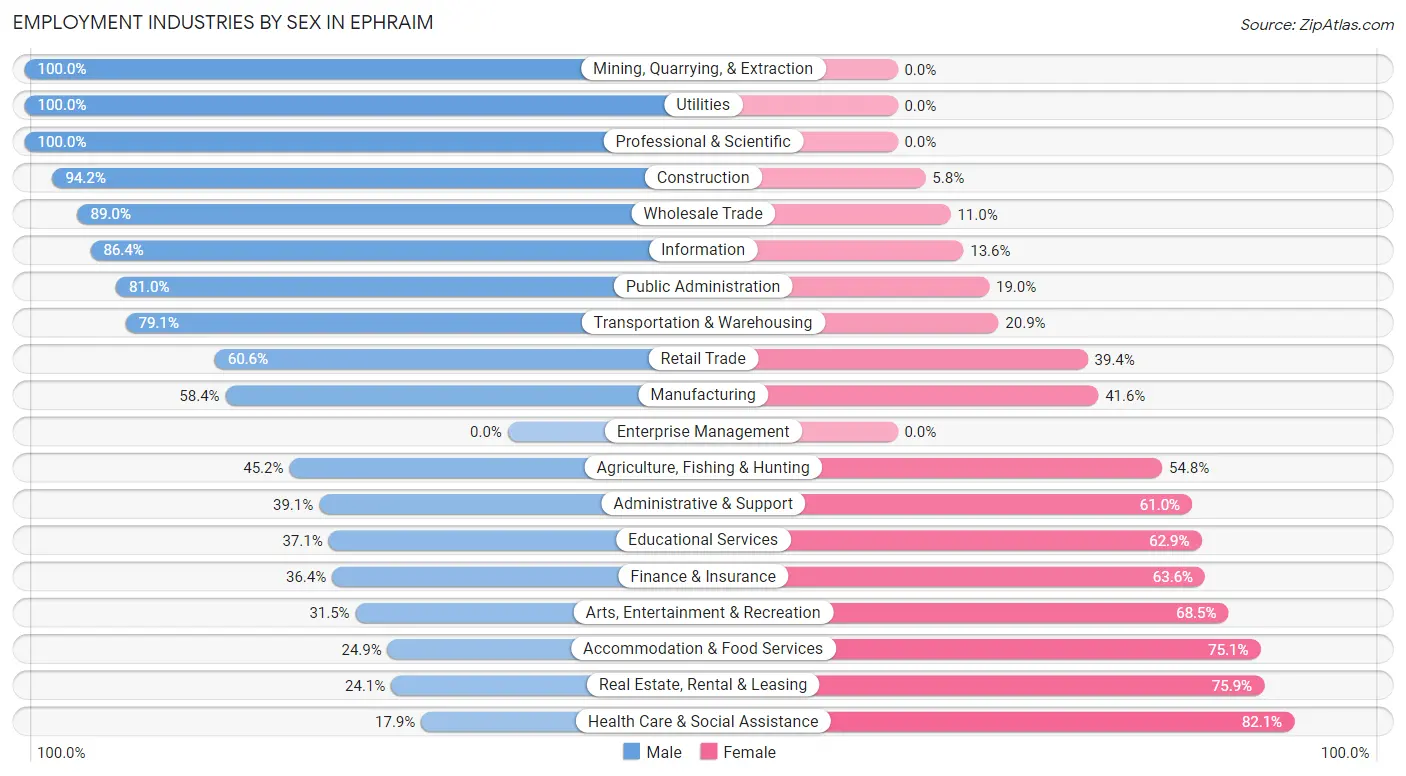
Employment Industries by Sex in Ephraim
The Ephraim industries that see more men than women are Mining, Quarrying, & Extraction (100.0%), Utilities (100.0%), and Professional & Scientific (100.0%), whereas the industries that tend to have a higher number of women are Health Care & Social Assistance (82.1%), Real Estate, Rental & Leasing (75.9%), and Accommodation & Food Services (75.1%).
| Industry | Male | Female |
| Agriculture, Fishing & Hunting | 33 (45.2%) | 40 (54.8%) |
| Mining, Quarrying, & Extraction | 89 (100.0%) | 0 (0.0%) |
| Construction | 114 (94.2%) | 7 (5.8%) |
| Manufacturing | 90 (58.4%) | 64 (41.6%) |
| Wholesale Trade | 73 (89.0%) | 9 (11.0%) |
| Retail Trade | 134 (60.6%) | 87 (39.4%) |
| Transportation & Warehousing | 53 (79.1%) | 14 (20.9%) |
| Utilities | 7 (100.0%) | 0 (0.0%) |
| Information | 19 (86.4%) | 3 (13.6%) |
| Finance & Insurance | 20 (36.4%) | 35 (63.6%) |
| Real Estate, Rental & Leasing | 14 (24.1%) | 44 (75.9%) |
| Professional & Scientific | 20 (100.0%) | 0 (0.0%) |
| Enterprise Management | 0 (0.0%) | 0 (0.0%) |
| Administrative & Support | 41 (39.1%) | 64 (61.0%) |
| Educational Services | 292 (37.1%) | 495 (62.9%) |
| Health Care & Social Assistance | 45 (17.9%) | 206 (82.1%) |
| Arts, Entertainment & Recreation | 29 (31.5%) | 63 (68.5%) |
| Accommodation & Food Services | 52 (24.9%) | 157 (75.1%) |
| Public Administration | 171 (81.0%) | 40 (19.0%) |
| Total | 1,323 (48.4%) | 1,409 (51.6%) |
Education in Ephraim
School Enrollment in Ephraim
The most common levels of schooling among the 2,767 students in Ephraim are college / undergraduate (1,718 | 62.1%), high school (342 | 12.4%), and middle school (256 | 9.2%).
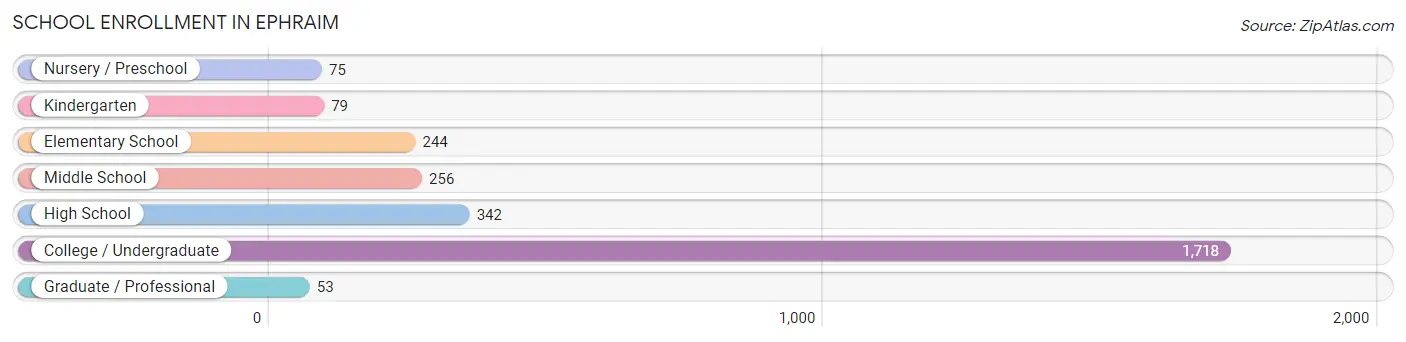
| School Level | # Students | % Students |
| Nursery / Preschool | 75 | 2.7% |
| Kindergarten | 79 | 2.9% |
| Elementary School | 244 | 8.8% |
| Middle School | 256 | 9.2% |
| High School | 342 | 12.4% |
| College / Undergraduate | 1,718 | 62.1% |
| Graduate / Professional | 53 | 1.9% |
| Total | 2,767 | 100.0% |
School Enrollment by Age by Funding Source in Ephraim
Out of a total of 2,767 students who are enrolled in schools in Ephraim, 255 (9.2%) attend a private institution, while the remaining 2,512 (90.8%) are enrolled in public schools. The age group of 25 to 34 year olds has the highest likelihood of being enrolled in private schools, with 37 (37.0% in the age bracket) enrolled. Conversely, the age group of 35 years and over has the lowest likelihood of being enrolled in a private school, with 102 (100.0% in the age bracket) attending a public institution.
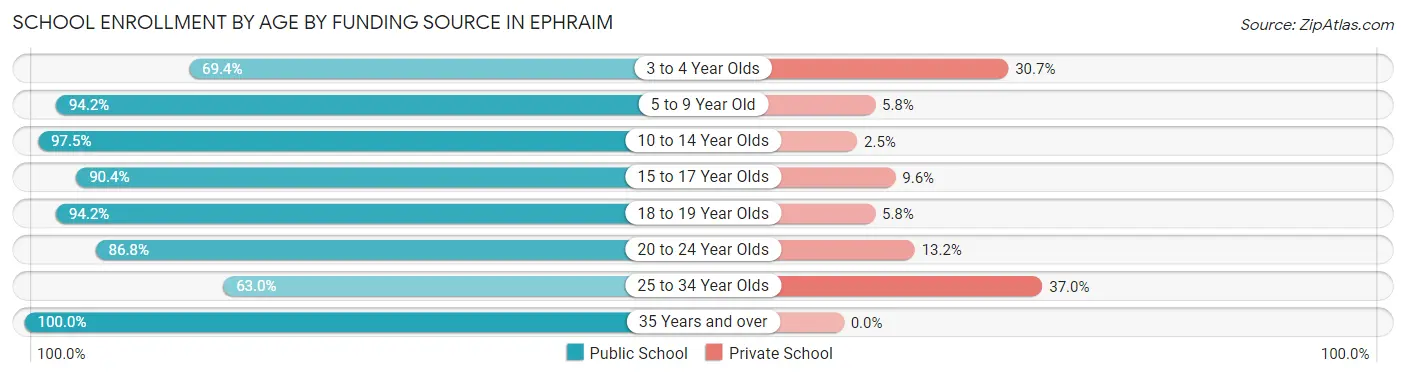
| Age Bracket | Public School | Private School |
| 3 to 4 Year Olds | 43 (69.4%) | 19 (30.6%) |
| 5 to 9 Year Old | 290 (94.2%) | 18 (5.8%) |
| 10 to 14 Year Olds | 351 (97.5%) | 9 (2.5%) |
| 15 to 17 Year Olds | 282 (90.4%) | 30 (9.6%) |
| 18 to 19 Year Olds | 758 (94.2%) | 47 (5.8%) |
| 20 to 24 Year Olds | 623 (86.8%) | 95 (13.2%) |
| 25 to 34 Year Olds | 63 (63.0%) | 37 (37.0%) |
| 35 Years and over | 102 (100.0%) | 0 (0.0%) |
| Total | 2,512 (90.8%) | 255 (9.2%) |
Educational Attainment by Field of Study in Ephraim
Education (214 | 22.5%), business (149 | 15.7%), arts & humanities (146 | 15.3%), science & technology (98 | 10.3%), and bio, nature & agricultural (59 | 6.2%) are the most common fields of study among 951 individuals in Ephraim who have obtained a bachelor's degree or higher.
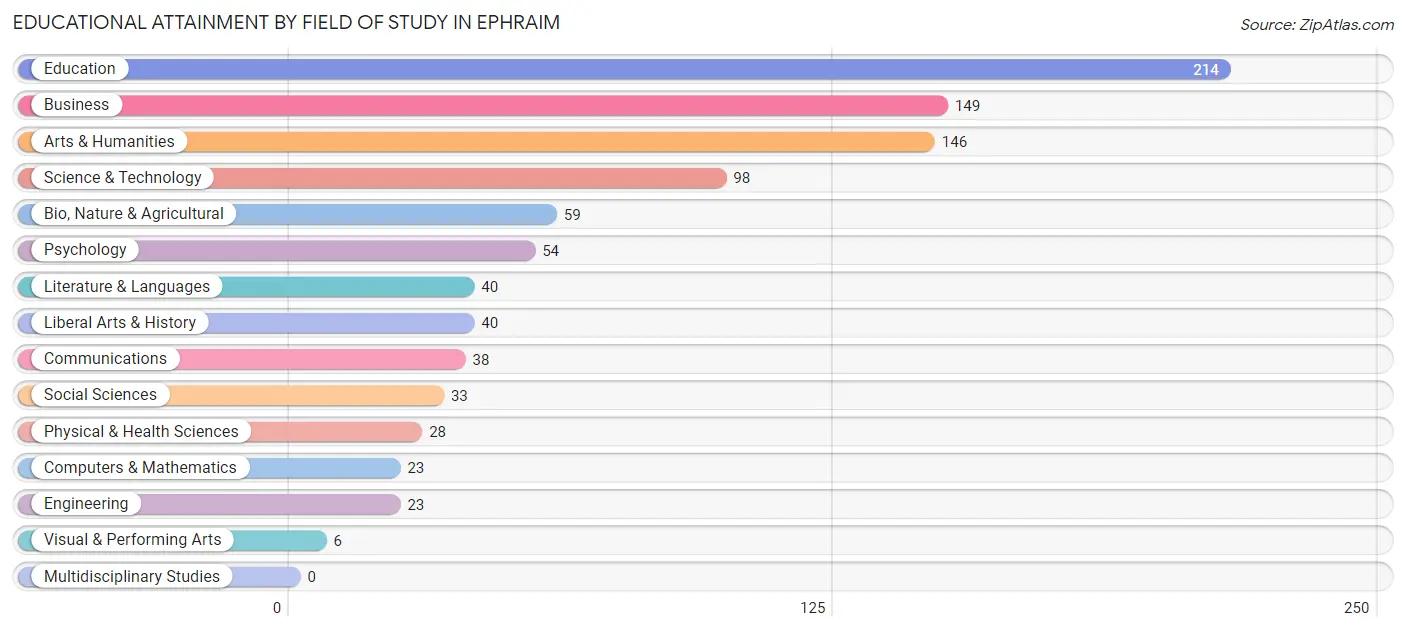
| Field of Study | # Graduates | % Graduates |
| Computers & Mathematics | 23 | 2.4% |
| Bio, Nature & Agricultural | 59 | 6.2% |
| Physical & Health Sciences | 28 | 2.9% |
| Psychology | 54 | 5.7% |
| Social Sciences | 33 | 3.5% |
| Engineering | 23 | 2.4% |
| Multidisciplinary Studies | 0 | 0.0% |
| Science & Technology | 98 | 10.3% |
| Business | 149 | 15.7% |
| Education | 214 | 22.5% |
| Literature & Languages | 40 | 4.2% |
| Liberal Arts & History | 40 | 4.2% |
| Visual & Performing Arts | 6 | 0.6% |
| Communications | 38 | 4.0% |
| Arts & Humanities | 146 | 15.3% |
| Total | 951 | 100.0% |
Transportation & Commute in Ephraim
Vehicle Availability by Sex in Ephraim
The most prevalent vehicle ownership categories in Ephraim are males with 2 vehicles (544, accounting for 43.9%) and females with 2 vehicles (476, making up 42.1%).
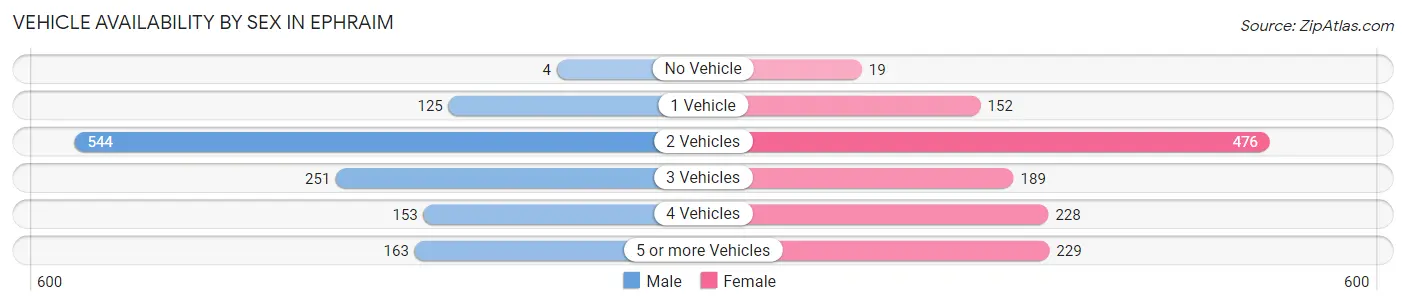
| Vehicles Available | Male | Female |
| No Vehicle | 4 (0.3%) | 19 (1.5%) |
| 1 Vehicle | 125 (10.1%) | 152 (11.8%) |
| 2 Vehicles | 544 (43.9%) | 476 (36.8%) |
| 3 Vehicles | 251 (20.2%) | 189 (14.6%) |
| 4 Vehicles | 153 (12.3%) | 228 (17.6%) |
| 5 or more Vehicles | 163 (13.2%) | 229 (17.7%) |
| Total | 1,240 (100.0%) | 1,293 (100.0%) |
Commute Time in Ephraim
The most frequently occuring commute durations in Ephraim are less than 5 minutes (740 commuters, 29.1%), 5 to 9 minutes (716 commuters, 28.2%), and 10 to 14 minutes (282 commuters, 11.1%).
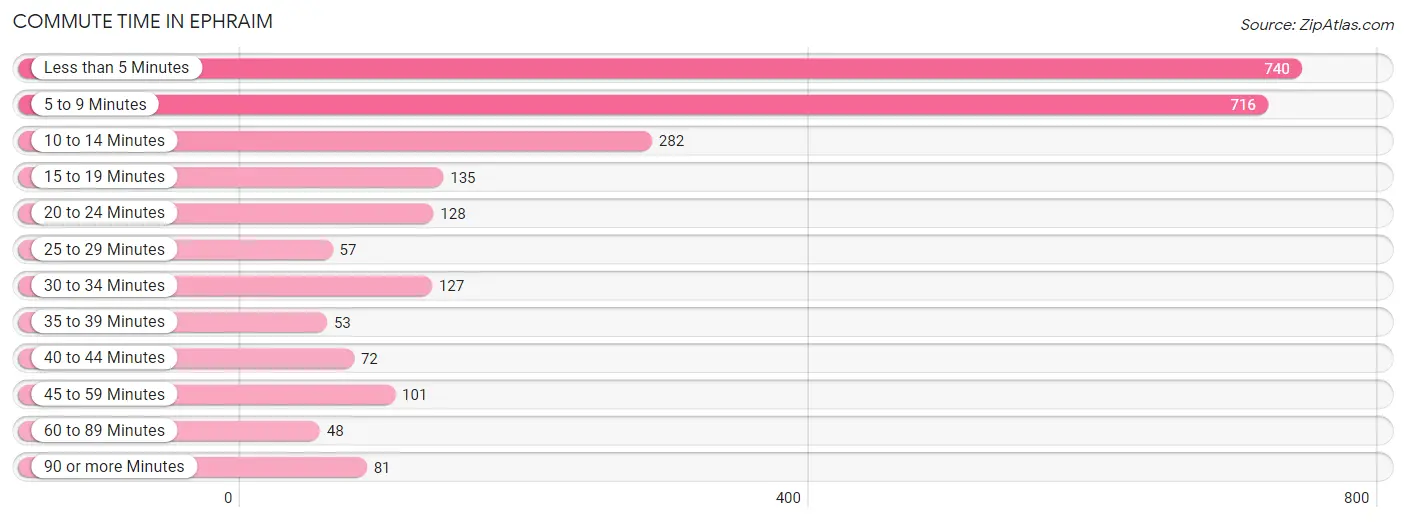
| Commute Time | # Commuters | % Commuters |
| Less than 5 Minutes | 740 | 29.1% |
| 5 to 9 Minutes | 716 | 28.2% |
| 10 to 14 Minutes | 282 | 11.1% |
| 15 to 19 Minutes | 135 | 5.3% |
| 20 to 24 Minutes | 128 | 5.0% |
| 25 to 29 Minutes | 57 | 2.2% |
| 30 to 34 Minutes | 127 | 5.0% |
| 35 to 39 Minutes | 53 | 2.1% |
| 40 to 44 Minutes | 72 | 2.8% |
| 45 to 59 Minutes | 101 | 4.0% |
| 60 to 89 Minutes | 48 | 1.9% |
| 90 or more Minutes | 81 | 3.2% |
Commute Time by Sex in Ephraim
The most common commute times in Ephraim are less than 5 minutes (409 commuters, 32.8%) for males and 5 to 9 minutes (490 commuters, 37.9%) for females.
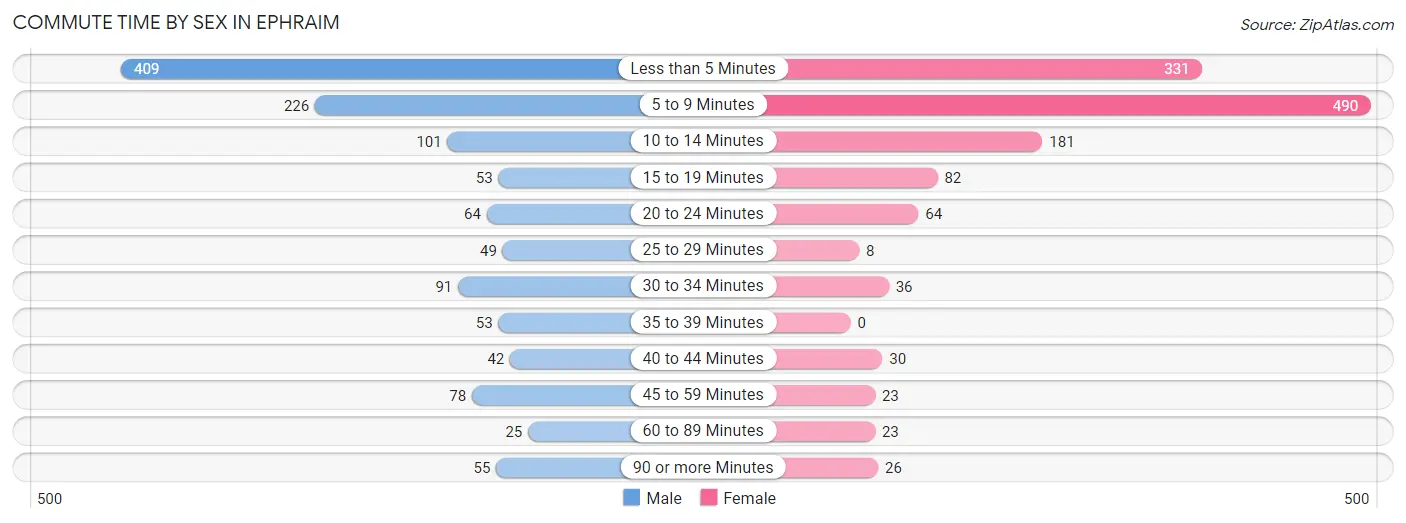
| Commute Time | Male | Female |
| Less than 5 Minutes | 409 (32.8%) | 331 (25.6%) |
| 5 to 9 Minutes | 226 (18.1%) | 490 (37.9%) |
| 10 to 14 Minutes | 101 (8.1%) | 181 (14.0%) |
| 15 to 19 Minutes | 53 (4.3%) | 82 (6.3%) |
| 20 to 24 Minutes | 64 (5.1%) | 64 (5.0%) |
| 25 to 29 Minutes | 49 (3.9%) | 8 (0.6%) |
| 30 to 34 Minutes | 91 (7.3%) | 36 (2.8%) |
| 35 to 39 Minutes | 53 (4.3%) | 0 (0.0%) |
| 40 to 44 Minutes | 42 (3.4%) | 30 (2.3%) |
| 45 to 59 Minutes | 78 (6.3%) | 23 (1.8%) |
| 60 to 89 Minutes | 25 (2.0%) | 23 (1.8%) |
| 90 or more Minutes | 55 (4.4%) | 26 (2.0%) |
Time of Departure to Work by Sex in Ephraim
The most frequent times of departure to work in Ephraim are 7:30 AM to 7:59 AM (200, 16.1%) for males and 7:30 AM to 7:59 AM (260, 20.1%) for females.
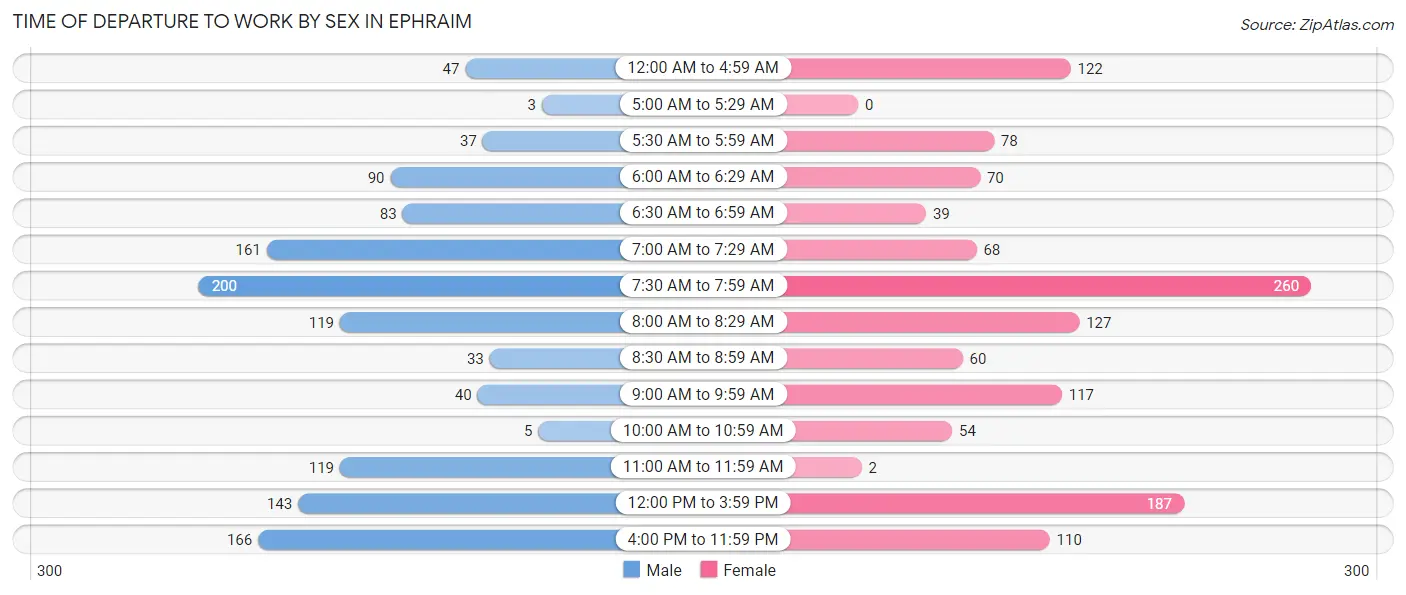
| Time of Departure | Male | Female |
| 12:00 AM to 4:59 AM | 47 (3.8%) | 122 (9.4%) |
| 5:00 AM to 5:29 AM | 3 (0.2%) | 0 (0.0%) |
| 5:30 AM to 5:59 AM | 37 (3.0%) | 78 (6.0%) |
| 6:00 AM to 6:29 AM | 90 (7.2%) | 70 (5.4%) |
| 6:30 AM to 6:59 AM | 83 (6.7%) | 39 (3.0%) |
| 7:00 AM to 7:29 AM | 161 (12.9%) | 68 (5.3%) |
| 7:30 AM to 7:59 AM | 200 (16.1%) | 260 (20.1%) |
| 8:00 AM to 8:29 AM | 119 (9.6%) | 127 (9.8%) |
| 8:30 AM to 8:59 AM | 33 (2.6%) | 60 (4.6%) |
| 9:00 AM to 9:59 AM | 40 (3.2%) | 117 (9.0%) |
| 10:00 AM to 10:59 AM | 5 (0.4%) | 54 (4.2%) |
| 11:00 AM to 11:59 AM | 119 (9.6%) | 2 (0.2%) |
| 12:00 PM to 3:59 PM | 143 (11.5%) | 187 (14.4%) |
| 4:00 PM to 11:59 PM | 166 (13.3%) | 110 (8.5%) |
| Total | 1,246 (100.0%) | 1,294 (100.0%) |
Housing Occupancy in Ephraim
Occupancy by Ownership in Ephraim
Of the total 1,681 dwellings in Ephraim, owner-occupied units account for 932 (55.4%), while renter-occupied units make up 749 (44.6%).
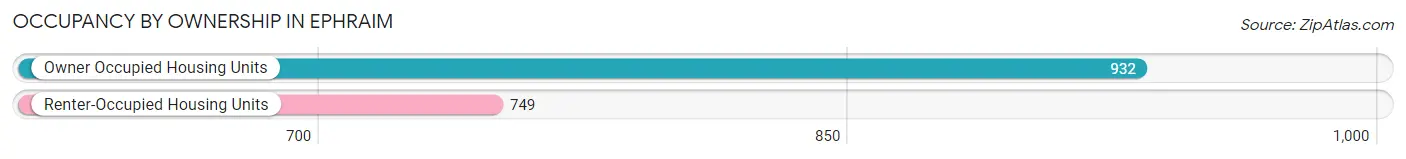
| Occupancy | # Housing Units | % Housing Units |
| Owner Occupied Housing Units | 932 | 55.4% |
| Renter-Occupied Housing Units | 749 | 44.6% |
| Total Occupied Housing Units | 1,681 | 100.0% |
Occupancy by Household Size in Ephraim
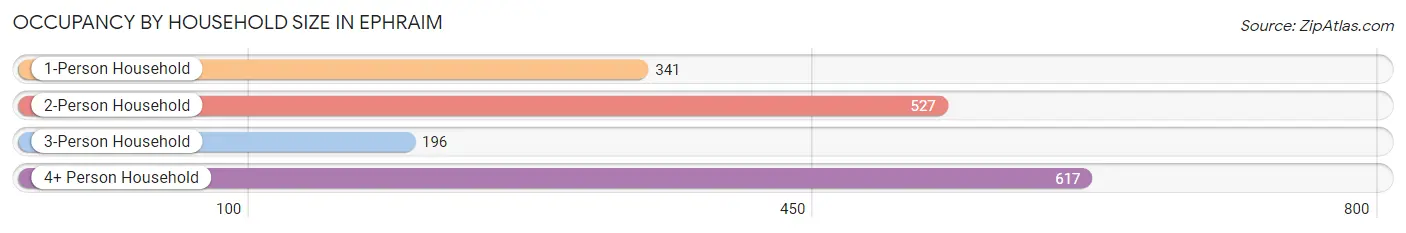
| Household Size | # Housing Units | % Housing Units |
| 1-Person Household | 341 | 20.3% |
| 2-Person Household | 527 | 31.4% |
| 3-Person Household | 196 | 11.7% |
| 4+ Person Household | 617 | 36.7% |
| Total Housing Units | 1,681 | 100.0% |
Occupancy by Ownership by Household Size in Ephraim
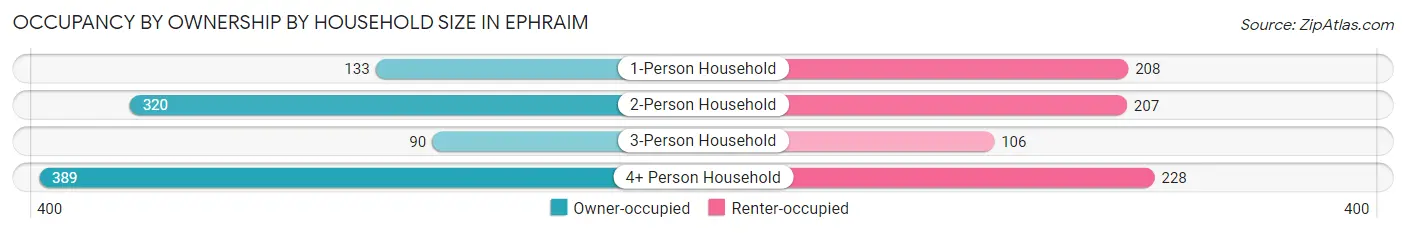
| Household Size | Owner-occupied | Renter-occupied |
| 1-Person Household | 133 (39.0%) | 208 (61.0%) |
| 2-Person Household | 320 (60.7%) | 207 (39.3%) |
| 3-Person Household | 90 (45.9%) | 106 (54.1%) |
| 4+ Person Household | 389 (63.0%) | 228 (36.9%) |
| Total Housing Units | 932 (55.4%) | 749 (44.6%) |
Occupancy by Educational Attainment in Ephraim
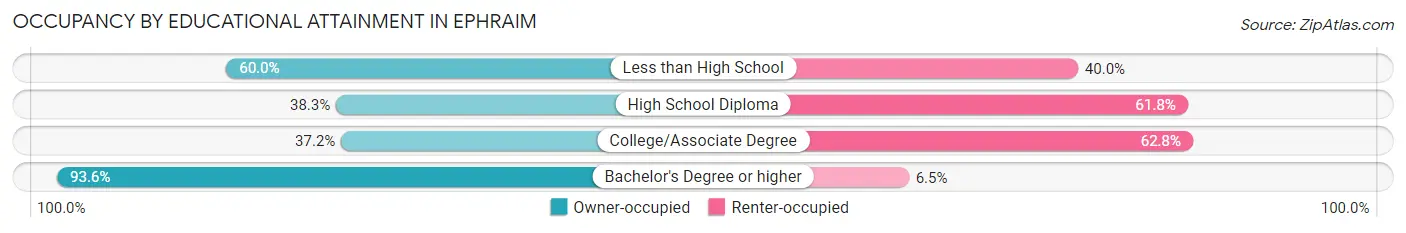
| Household Size | Owner-occupied | Renter-occupied |
| Less than High School | 39 (60.0%) | 26 (40.0%) |
| High School Diploma | 109 (38.3%) | 176 (61.8%) |
| College/Associate Degree | 305 (37.2%) | 514 (62.8%) |
| Bachelor's Degree or higher | 479 (93.5%) | 33 (6.5%) |
Occupancy by Age of Householder in Ephraim
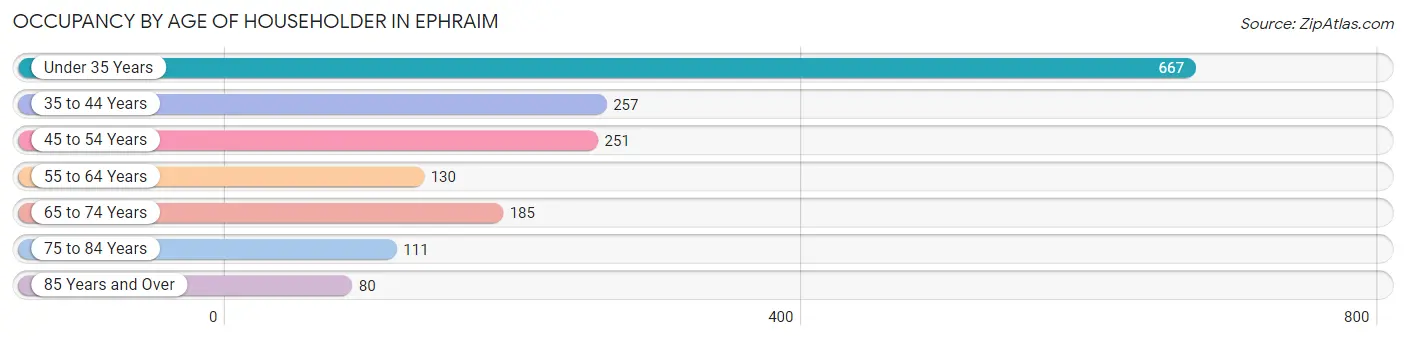
| Age Bracket | # Households | % Households |
| Under 35 Years | 667 | 39.7% |
| 35 to 44 Years | 257 | 15.3% |
| 45 to 54 Years | 251 | 14.9% |
| 55 to 64 Years | 130 | 7.7% |
| 65 to 74 Years | 185 | 11.0% |
| 75 to 84 Years | 111 | 6.6% |
| 85 Years and Over | 80 | 4.8% |
| Total | 1,681 | 100.0% |
Housing Finances in Ephraim
Median Income by Occupancy in Ephraim
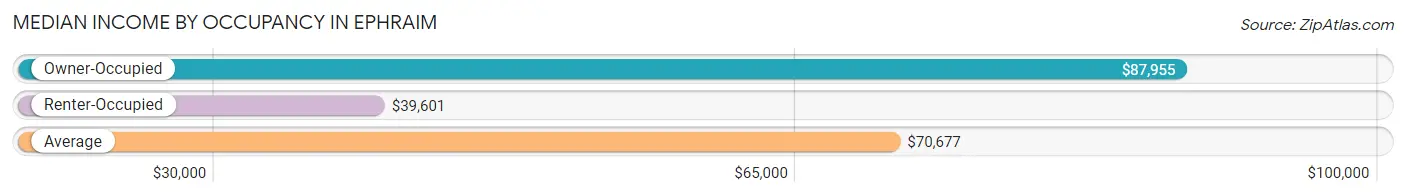
| Occupancy Type | # Households | Median Income |
| Owner-Occupied | 932 (55.4%) | $87,955 |
| Renter-Occupied | 749 (44.6%) | $39,601 |
| Average | 1,681 (100.0%) | $70,677 |
Occupancy by Householder Income Bracket in Ephraim
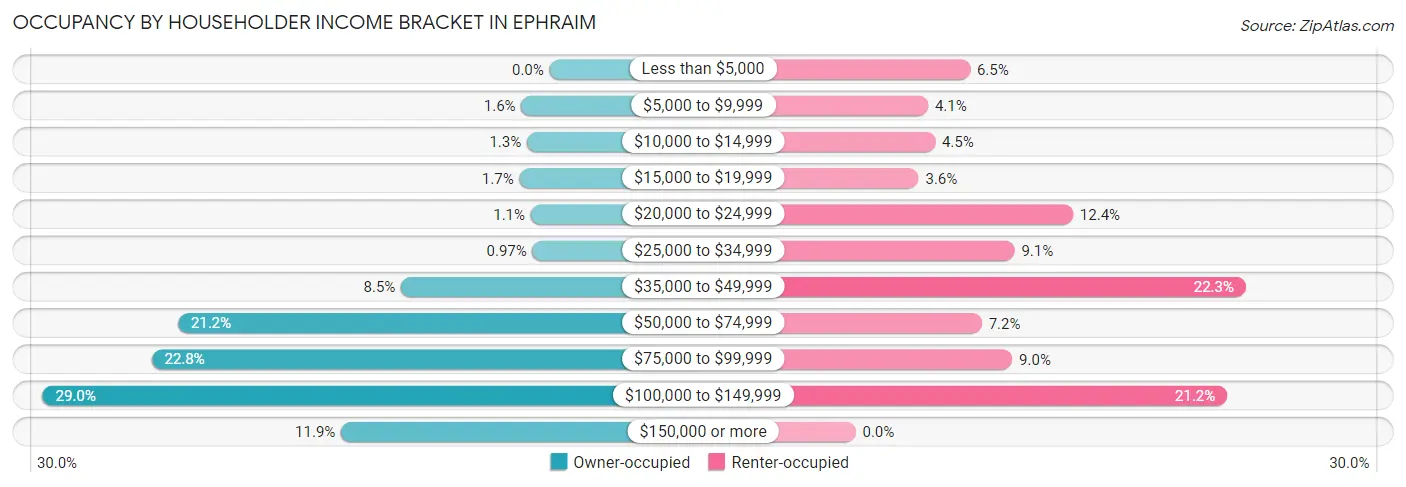
| Income Bracket | Owner-occupied | Renter-occupied |
| Less than $5,000 | 0 (0.0%) | 49 (6.5%) |
| $5,000 to $9,999 | 15 (1.6%) | 31 (4.1%) |
| $10,000 to $14,999 | 12 (1.3%) | 34 (4.5%) |
| $15,000 to $19,999 | 16 (1.7%) | 27 (3.6%) |
| $20,000 to $24,999 | 10 (1.1%) | 93 (12.4%) |
| $25,000 to $34,999 | 9 (1.0%) | 68 (9.1%) |
| $35,000 to $49,999 | 79 (8.5%) | 167 (22.3%) |
| $50,000 to $74,999 | 198 (21.2%) | 54 (7.2%) |
| $75,000 to $99,999 | 212 (22.8%) | 67 (8.9%) |
| $100,000 to $149,999 | 270 (29.0%) | 159 (21.2%) |
| $150,000 or more | 111 (11.9%) | 0 (0.0%) |
| Total | 932 (100.0%) | 749 (100.0%) |
Monthly Housing Cost Tiers in Ephraim
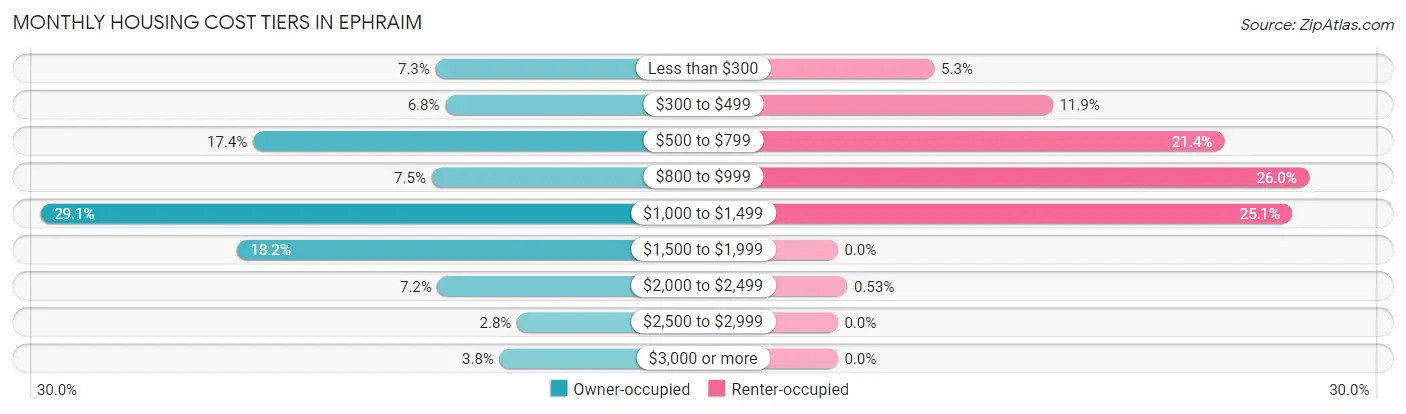
| Monthly Cost | Owner-occupied | Renter-occupied |
| Less than $300 | 68 (7.3%) | 40 (5.3%) |
| $300 to $499 | 63 (6.8%) | 89 (11.9%) |
| $500 to $799 | 162 (17.4%) | 160 (21.4%) |
| $800 to $999 | 70 (7.5%) | 195 (26.0%) |
| $1,000 to $1,499 | 271 (29.1%) | 188 (25.1%) |
| $1,500 to $1,999 | 170 (18.2%) | 0 (0.0%) |
| $2,000 to $2,499 | 67 (7.2%) | 4 (0.5%) |
| $2,500 to $2,999 | 26 (2.8%) | 0 (0.0%) |
| $3,000 or more | 35 (3.8%) | 0 (0.0%) |
| Total | 932 (100.0%) | 749 (100.0%) |
Physical Housing Characteristics in Ephraim
Housing Structures in Ephraim
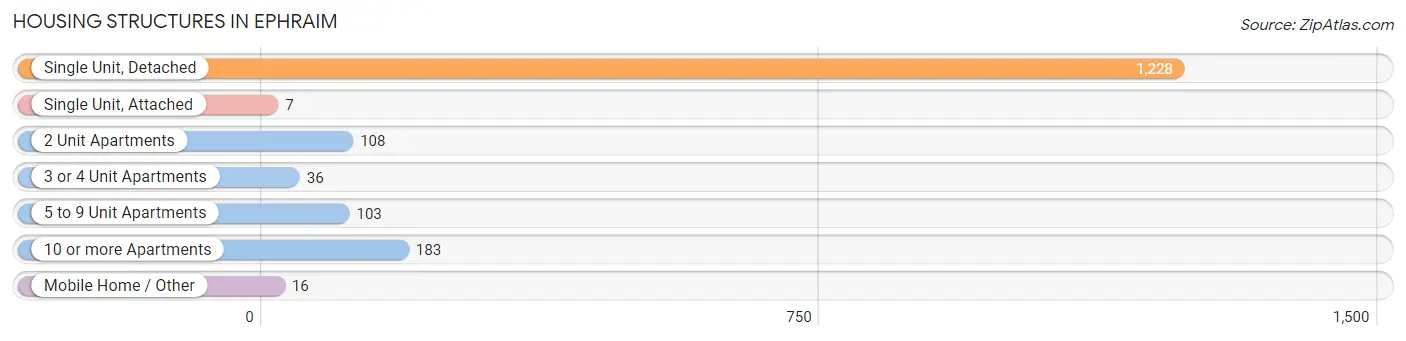
| Structure Type | # Housing Units | % Housing Units |
| Single Unit, Detached | 1,228 | 73.1% |
| Single Unit, Attached | 7 | 0.4% |
| 2 Unit Apartments | 108 | 6.4% |
| 3 or 4 Unit Apartments | 36 | 2.1% |
| 5 to 9 Unit Apartments | 103 | 6.1% |
| 10 or more Apartments | 183 | 10.9% |
| Mobile Home / Other | 16 | 0.9% |
| Total | 1,681 | 100.0% |
Housing Structures by Occupancy in Ephraim
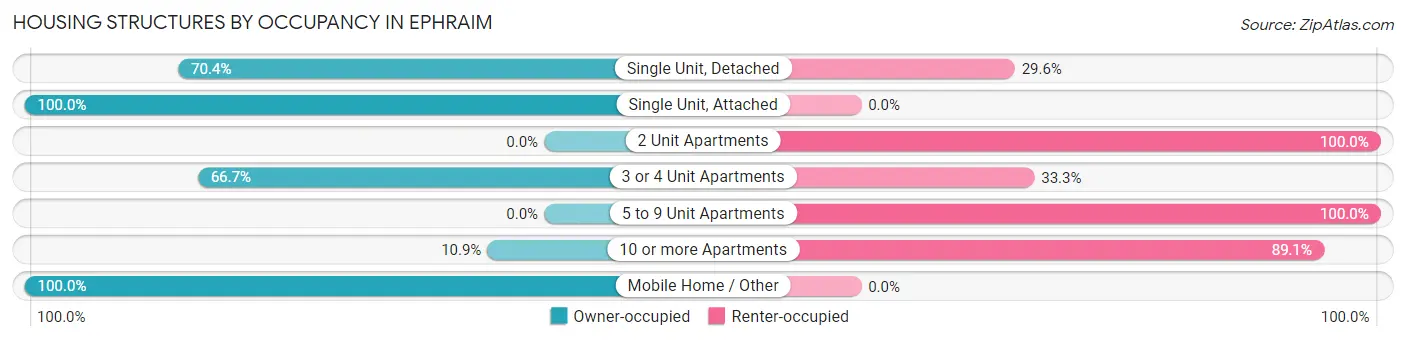
| Structure Type | Owner-occupied | Renter-occupied |
| Single Unit, Detached | 865 (70.4%) | 363 (29.6%) |
| Single Unit, Attached | 7 (100.0%) | 0 (0.0%) |
| 2 Unit Apartments | 0 (0.0%) | 108 (100.0%) |
| 3 or 4 Unit Apartments | 24 (66.7%) | 12 (33.3%) |
| 5 to 9 Unit Apartments | 0 (0.0%) | 103 (100.0%) |
| 10 or more Apartments | 20 (10.9%) | 163 (89.1%) |
| Mobile Home / Other | 16 (100.0%) | 0 (0.0%) |
| Total | 932 (55.4%) | 749 (44.6%) |
Housing Structures by Number of Rooms in Ephraim
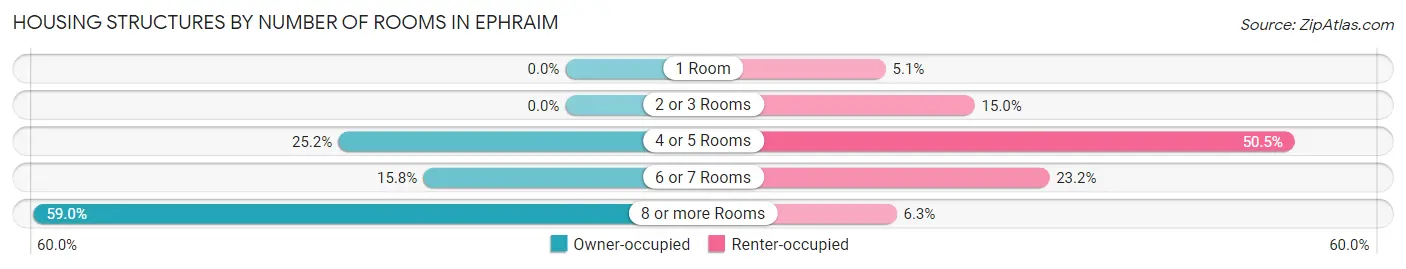
| Number of Rooms | Owner-occupied | Renter-occupied |
| 1 Room | 0 (0.0%) | 38 (5.1%) |
| 2 or 3 Rooms | 0 (0.0%) | 112 (14.9%) |
| 4 or 5 Rooms | 235 (25.2%) | 378 (50.5%) |
| 6 or 7 Rooms | 147 (15.8%) | 174 (23.2%) |
| 8 or more Rooms | 550 (59.0%) | 47 (6.3%) |
| Total | 932 (100.0%) | 749 (100.0%) |
Housing Structure by Heating Type in Ephraim
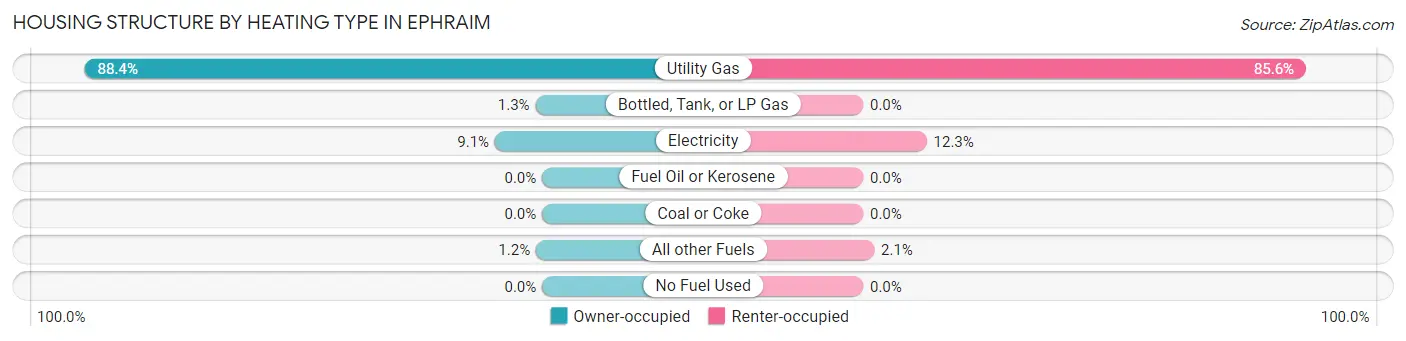
| Heating Type | Owner-occupied | Renter-occupied |
| Utility Gas | 824 (88.4%) | 641 (85.6%) |
| Bottled, Tank, or LP Gas | 12 (1.3%) | 0 (0.0%) |
| Electricity | 85 (9.1%) | 92 (12.3%) |
| Fuel Oil or Kerosene | 0 (0.0%) | 0 (0.0%) |
| Coal or Coke | 0 (0.0%) | 0 (0.0%) |
| All other Fuels | 11 (1.2%) | 16 (2.1%) |
| No Fuel Used | 0 (0.0%) | 0 (0.0%) |
| Total | 932 (100.0%) | 749 (100.0%) |
Household Vehicle Usage in Ephraim
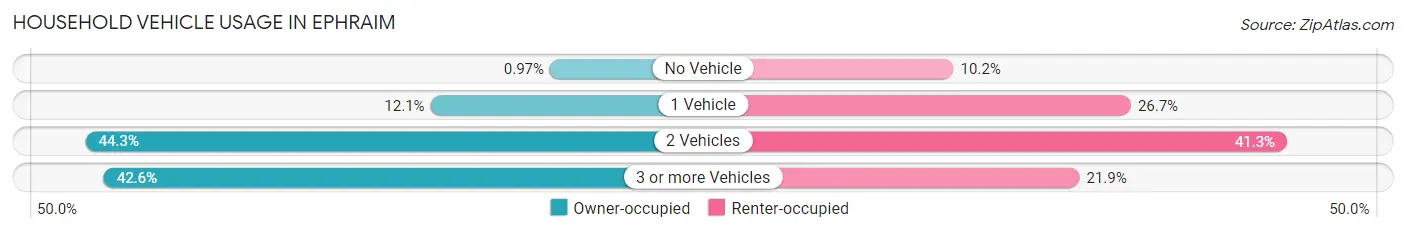
| Vehicles per Household | Owner-occupied | Renter-occupied |
| No Vehicle | 9 (1.0%) | 76 (10.2%) |
| 1 Vehicle | 113 (12.1%) | 200 (26.7%) |
| 2 Vehicles | 413 (44.3%) | 309 (41.3%) |
| 3 or more Vehicles | 397 (42.6%) | 164 (21.9%) |
| Total | 932 (100.0%) | 749 (100.0%) |
Real Estate & Mortgages in Ephraim
Real Estate and Mortgage Overview in Ephraim
| Characteristic | Without Mortgage | With Mortgage |
| Housing Units | 305 | 627 |
| Median Property Value | $331,300 | $344,700 |
| Median Household Income | $67,734 | $81 |
| Monthly Housing Costs | $549 | $18 |
| Real Estate Taxes | $2,093 | $10 |
Property Value by Mortgage Status in Ephraim
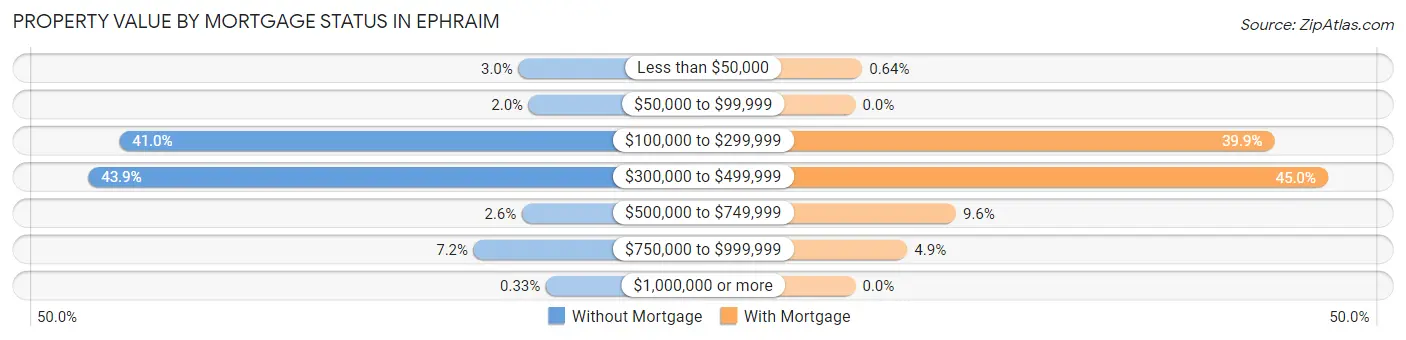
| Property Value | Without Mortgage | With Mortgage |
| Less than $50,000 | 9 (2.9%) | 4 (0.6%) |
| $50,000 to $99,999 | 6 (2.0%) | 0 (0.0%) |
| $100,000 to $299,999 | 125 (41.0%) | 250 (39.9%) |
| $300,000 to $499,999 | 134 (43.9%) | 282 (45.0%) |
| $500,000 to $749,999 | 8 (2.6%) | 60 (9.6%) |
| $750,000 to $999,999 | 22 (7.2%) | 31 (4.9%) |
| $1,000,000 or more | 1 (0.3%) | 0 (0.0%) |
| Total | 305 (100.0%) | 627 (100.0%) |
Household Income by Mortgage Status in Ephraim
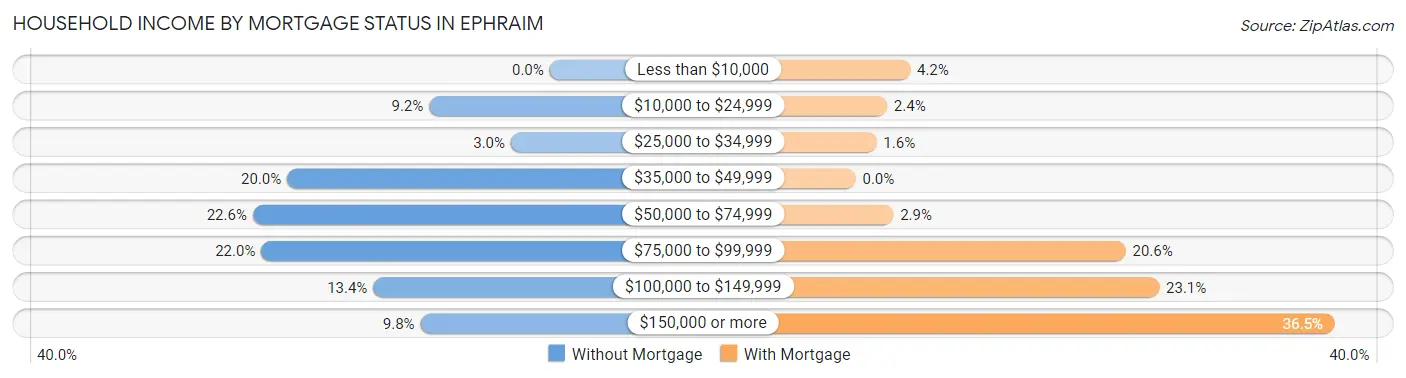
| Household Income | Without Mortgage | With Mortgage |
| Less than $10,000 | 0 (0.0%) | 26 (4.2%) |
| $10,000 to $24,999 | 28 (9.2%) | 15 (2.4%) |
| $25,000 to $34,999 | 9 (2.9%) | 10 (1.6%) |
| $35,000 to $49,999 | 61 (20.0%) | 0 (0.0%) |
| $50,000 to $74,999 | 69 (22.6%) | 18 (2.9%) |
| $75,000 to $99,999 | 67 (22.0%) | 129 (20.6%) |
| $100,000 to $149,999 | 41 (13.4%) | 145 (23.1%) |
| $150,000 or more | 30 (9.8%) | 229 (36.5%) |
| Total | 305 (100.0%) | 627 (100.0%) |
Property Value to Household Income Ratio in Ephraim
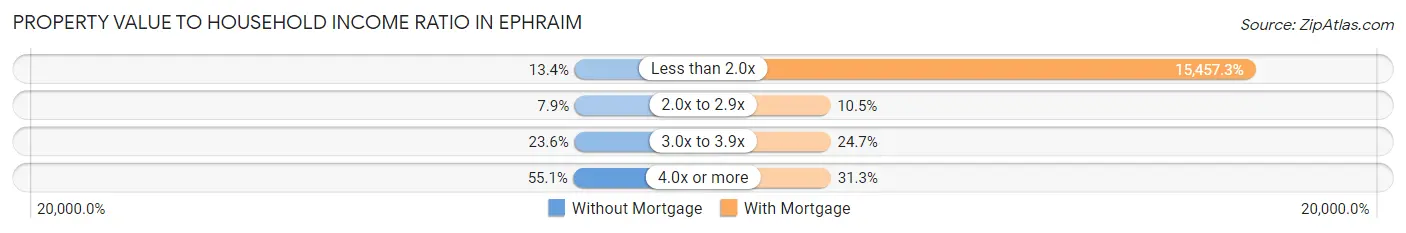
| Value-to-Income Ratio | Without Mortgage | With Mortgage |
| Less than 2.0x | 41 (13.4%) | 96,917 (15,457.3%) |
| 2.0x to 2.9x | 24 (7.9%) | 66 (10.5%) |
| 3.0x to 3.9x | 72 (23.6%) | 155 (24.7%) |
| 4.0x or more | 168 (55.1%) | 196 (31.3%) |
| Total | 305 (100.0%) | 627 (100.0%) |
Real Estate Taxes by Mortgage Status in Ephraim
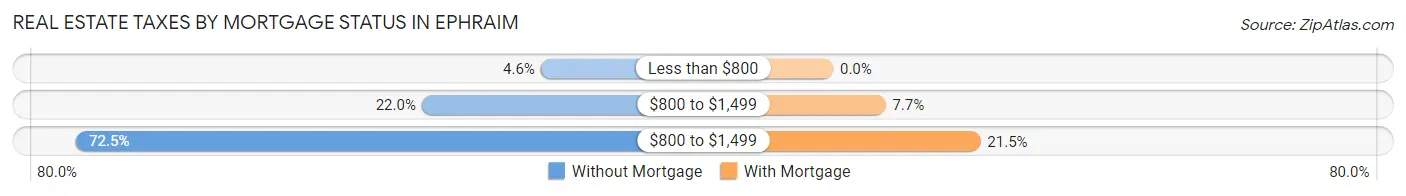
| Property Taxes | Without Mortgage | With Mortgage |
| Less than $800 | 14 (4.6%) | 0 (0.0%) |
| $800 to $1,499 | 67 (22.0%) | 48 (7.7%) |
| $800 to $1,499 | 221 (72.5%) | 135 (21.5%) |
| Total | 305 (100.0%) | 627 (100.0%) |
Health & Disability in Ephraim
Health Insurance Coverage by Age in Ephraim
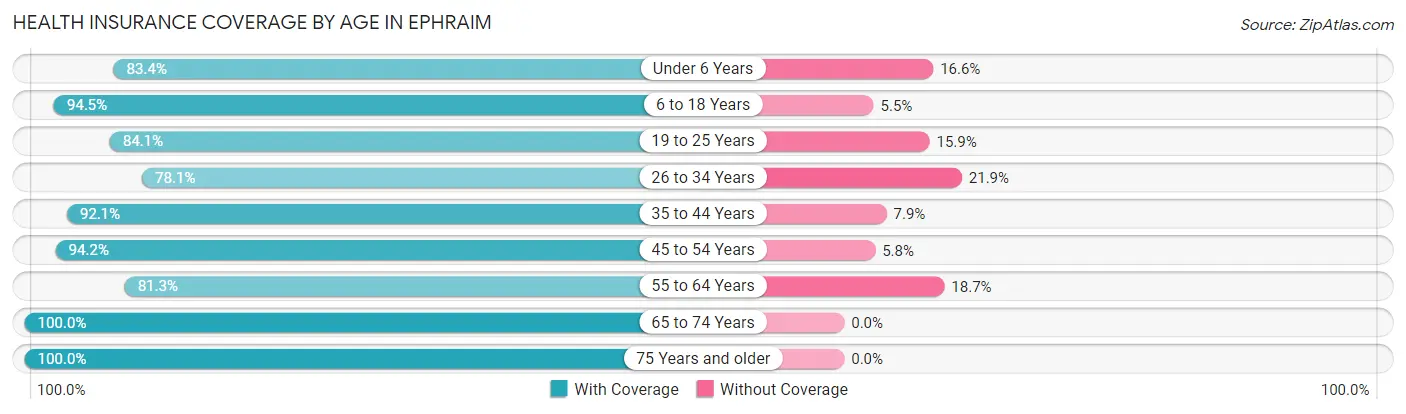
| Age Bracket | With Coverage | Without Coverage |
| Under 6 Years | 468 (83.4%) | 93 (16.6%) |
| 6 to 18 Years | 1,247 (94.5%) | 72 (5.5%) |
| 19 to 25 Years | 1,306 (84.1%) | 247 (15.9%) |
| 26 to 34 Years | 424 (78.1%) | 119 (21.9%) |
| 35 to 44 Years | 455 (92.1%) | 39 (7.9%) |
| 45 to 54 Years | 408 (94.2%) | 25 (5.8%) |
| 55 to 64 Years | 196 (81.3%) | 45 (18.7%) |
| 65 to 74 Years | 320 (100.0%) | 0 (0.0%) |
| 75 Years and older | 248 (100.0%) | 0 (0.0%) |
| Total | 5,072 (88.8%) | 640 (11.2%) |
Health Insurance Coverage by Citizenship Status in Ephraim
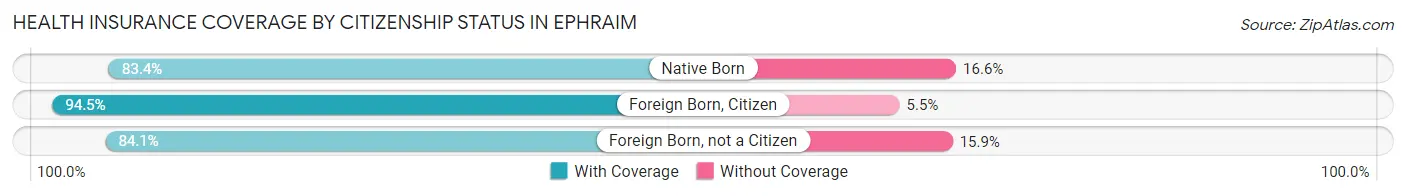
| Citizenship Status | With Coverage | Without Coverage |
| Native Born | 468 (83.4%) | 93 (16.6%) |
| Foreign Born, Citizen | 1,247 (94.5%) | 72 (5.5%) |
| Foreign Born, not a Citizen | 1,306 (84.1%) | 247 (15.9%) |
Health Insurance Coverage by Household Income in Ephraim
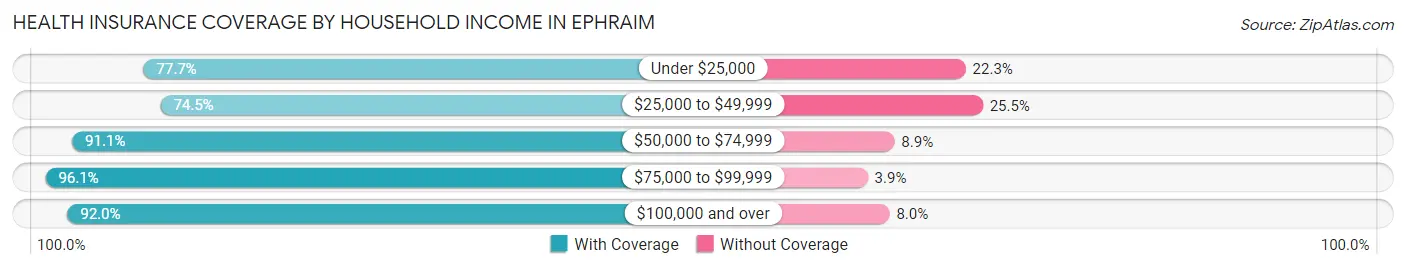
| Household Income | With Coverage | Without Coverage |
| Under $25,000 | 499 (77.7%) | 143 (22.3%) |
| $25,000 to $49,999 | 644 (74.5%) | 220 (25.5%) |
| $50,000 to $74,999 | 745 (91.1%) | 73 (8.9%) |
| $75,000 to $99,999 | 1,156 (96.1%) | 47 (3.9%) |
| $100,000 and over | 1,668 (92.0%) | 145 (8.0%) |
Public vs Private Health Insurance Coverage by Age in Ephraim
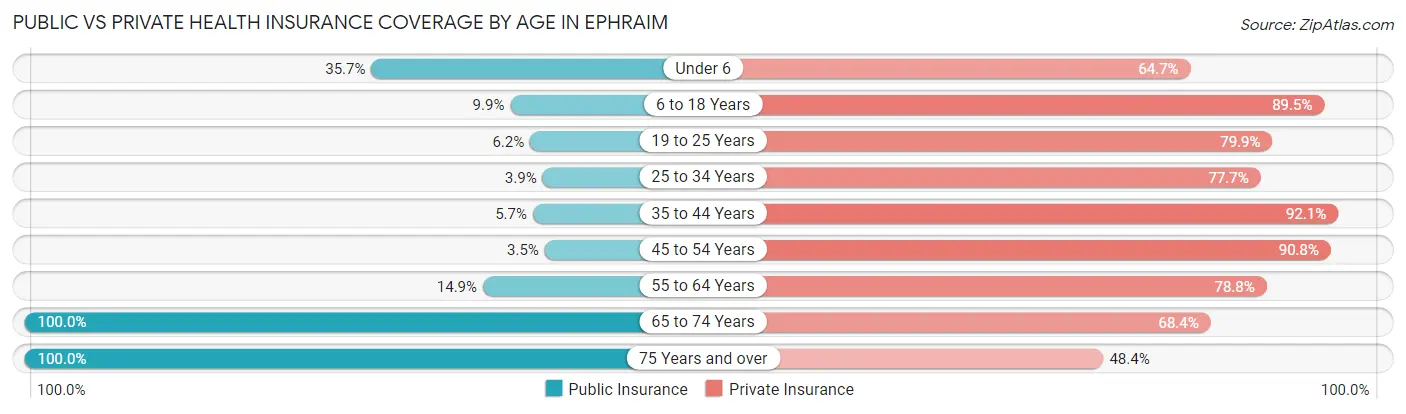
| Age Bracket | Public Insurance | Private Insurance |
| Under 6 | 200 (35.6%) | 363 (64.7%) |
| 6 to 18 Years | 130 (9.9%) | 1,181 (89.5%) |
| 19 to 25 Years | 96 (6.2%) | 1,241 (79.9%) |
| 25 to 34 Years | 21 (3.9%) | 422 (77.7%) |
| 35 to 44 Years | 28 (5.7%) | 455 (92.1%) |
| 45 to 54 Years | 15 (3.5%) | 393 (90.8%) |
| 55 to 64 Years | 36 (14.9%) | 190 (78.8%) |
| 65 to 74 Years | 320 (100.0%) | 219 (68.4%) |
| 75 Years and over | 248 (100.0%) | 120 (48.4%) |
| Total | 1,094 (19.2%) | 4,584 (80.2%) |
Disability Status by Sex by Age in Ephraim

| Age Bracket | Male | Female |
| Under 5 Years | 0 (0.0%) | 0 (0.0%) |
| 5 to 17 Years | 11 (2.0%) | 13 (2.9%) |
| 18 to 34 Years | 43 (3.8%) | 104 (7.5%) |
| 35 to 64 Years | 37 (6.7%) | 63 (10.3%) |
| 65 to 74 Years | 55 (32.2%) | 32 (21.5%) |
| 75 Years and over | 75 (72.8%) | 135 (93.1%) |
Disability Class by Sex by Age in Ephraim
Disability Class: Hearing Difficulty
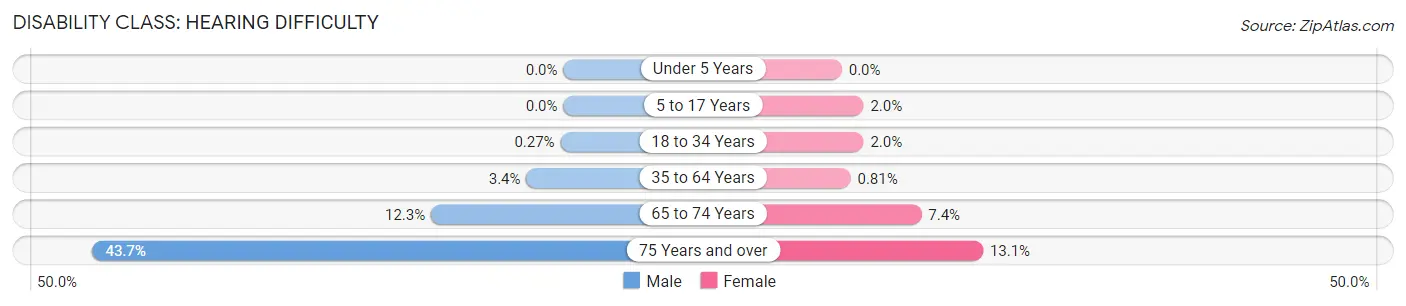
| Age Bracket | Male | Female |
| Under 5 Years | 0 (0.0%) | 0 (0.0%) |
| 5 to 17 Years | 0 (0.0%) | 9 (2.0%) |
| 18 to 34 Years | 3 (0.3%) | 28 (2.0%) |
| 35 to 64 Years | 19 (3.4%) | 5 (0.8%) |
| 65 to 74 Years | 21 (12.3%) | 11 (7.4%) |
| 75 Years and over | 45 (43.7%) | 19 (13.1%) |
Disability Class: Vision Difficulty
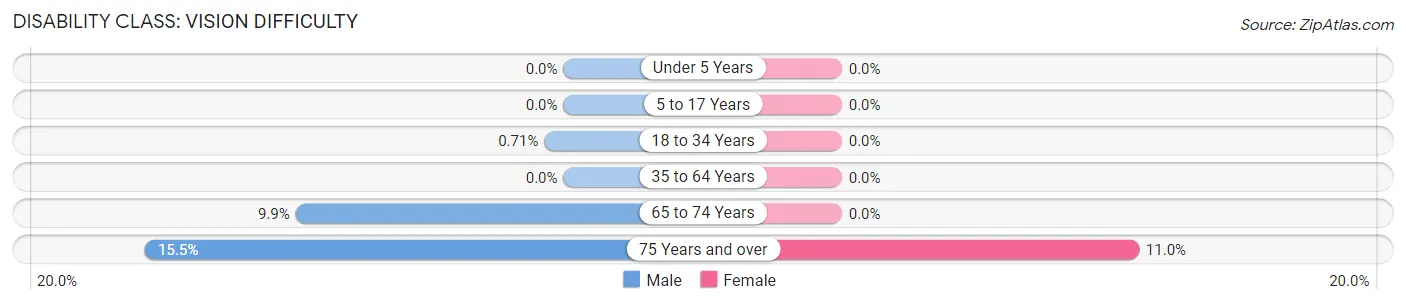
| Age Bracket | Male | Female |
| Under 5 Years | 0 (0.0%) | 0 (0.0%) |
| 5 to 17 Years | 0 (0.0%) | 0 (0.0%) |
| 18 to 34 Years | 8 (0.7%) | 0 (0.0%) |
| 35 to 64 Years | 0 (0.0%) | 0 (0.0%) |
| 65 to 74 Years | 17 (9.9%) | 0 (0.0%) |
| 75 Years and over | 16 (15.5%) | 16 (11.0%) |
Disability Class: Cognitive Difficulty
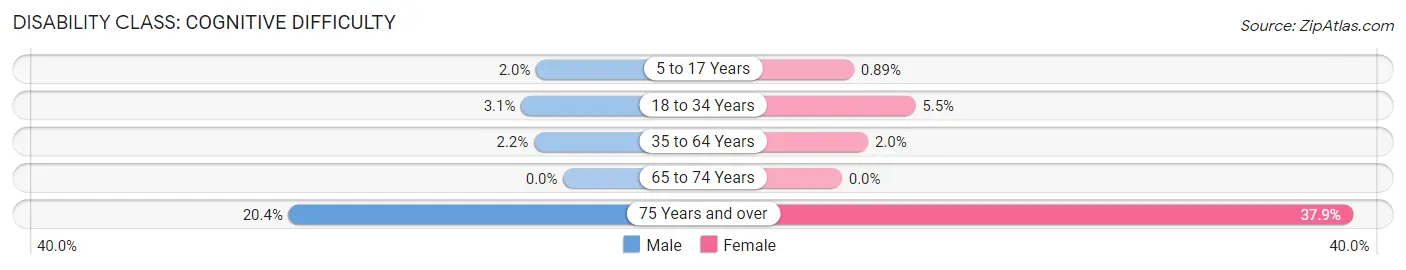
| Age Bracket | Male | Female |
| 5 to 17 Years | 11 (2.0%) | 4 (0.9%) |
| 18 to 34 Years | 35 (3.1%) | 76 (5.5%) |
| 35 to 64 Years | 12 (2.2%) | 12 (1.9%) |
| 65 to 74 Years | 0 (0.0%) | 0 (0.0%) |
| 75 Years and over | 21 (20.4%) | 55 (37.9%) |
Disability Class: Ambulatory Difficulty
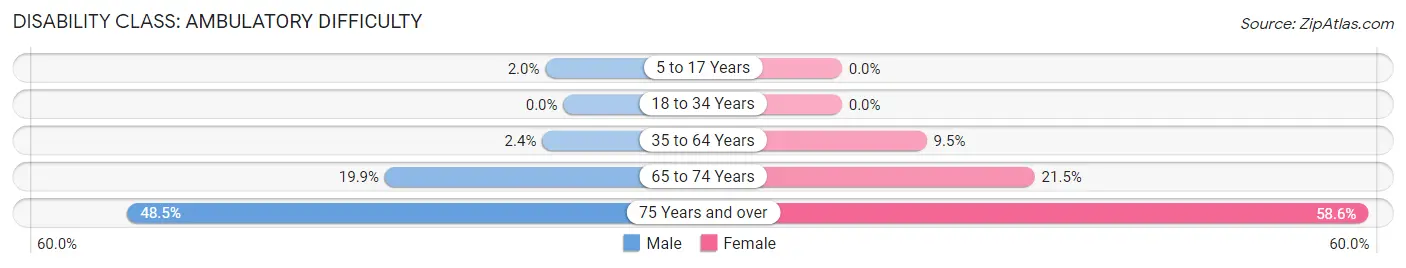
| Age Bracket | Male | Female |
| 5 to 17 Years | 11 (2.0%) | 0 (0.0%) |
| 18 to 34 Years | 0 (0.0%) | 0 (0.0%) |
| 35 to 64 Years | 13 (2.4%) | 58 (9.5%) |
| 65 to 74 Years | 34 (19.9%) | 32 (21.5%) |
| 75 Years and over | 50 (48.5%) | 85 (58.6%) |
Disability Class: Self-Care Difficulty

| Age Bracket | Male | Female |
| 5 to 17 Years | 0 (0.0%) | 0 (0.0%) |
| 18 to 34 Years | 0 (0.0%) | 0 (0.0%) |
| 35 to 64 Years | 13 (2.4%) | 0 (0.0%) |
| 65 to 74 Years | 17 (9.9%) | 0 (0.0%) |
| 75 Years and over | 24 (23.3%) | 18 (12.4%) |
Technology Access in Ephraim
Computing Device Access in Ephraim
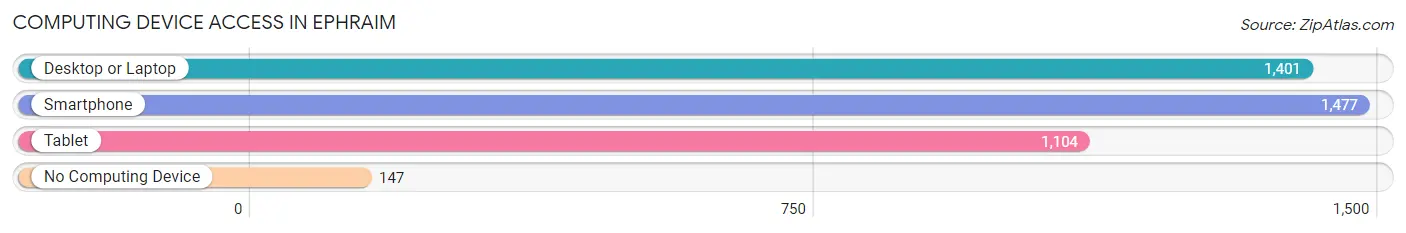
| Device Type | # Households | % Households |
| Desktop or Laptop | 1,401 | 83.3% |
| Smartphone | 1,477 | 87.9% |
| Tablet | 1,104 | 65.7% |
| No Computing Device | 147 | 8.7% |
| Total | 1,681 | 100.0% |
Internet Access in Ephraim
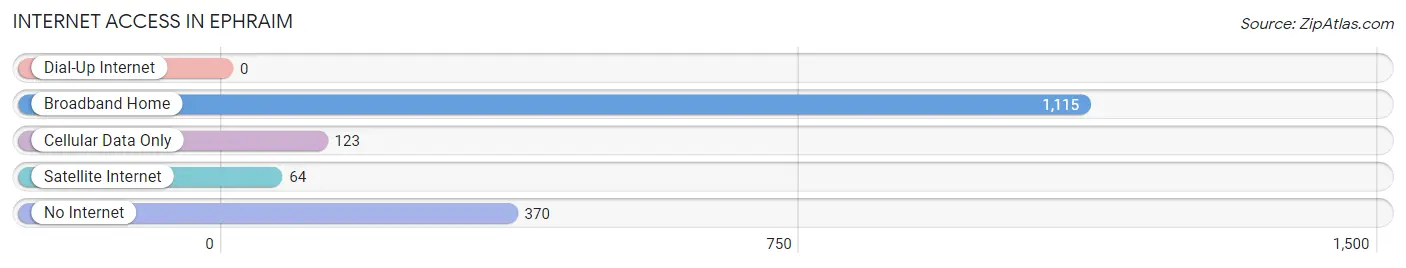
| Internet Type | # Households | % Households |
| Dial-Up Internet | 0 | 0.0% |
| Broadband Home | 1,115 | 66.3% |
| Cellular Data Only | 123 | 7.3% |
| Satellite Internet | 64 | 3.8% |
| No Internet | 370 | 22.0% |
| Total | 1,681 | 100.0% |
Ephraim Summary
Ephraim is a city located in Sanpete County, Utah, United States. It is the county seat of Sanpete County and is located in the heart of the Sanpete Valley. The city is named after Ephraim, a son of Joseph in the Bible. As of the 2010 census, the population of Ephraim was 6,135.
Geography
Ephraim is located at 39°22'25" North, 111°37'17" West (39.373611, -111.621389). It is situated in the Sanpete Valley, at an elevation of 5,400 feet (1,646 m). The city is located in the center of Sanpete County, approximately 50 miles (80 km) south of Salt Lake City and 30 miles (48 km) north of Manti.
The city is surrounded by mountains on all sides, including the Wasatch Range to the east, the San Pitch Mountains to the south, and the Manti-La Sal National Forest to the west. The city is located in a semi-arid climate, with hot summers and cold winters.
History
Ephraim was founded in 1854 by a group of Mormon settlers led by Charles C. Rich. The settlers were sent by Brigham Young to establish a settlement in the Sanpete Valley. The settlers named the city after Ephraim, a son of Joseph in the Bible.
The city quickly grew and became an important center for the region. In 1877, the Sanpete Stake Academy was established in Ephraim, which later became Snow College. The college is now one of the largest community colleges in the state.
In the early 20th century, Ephraim was an important center for the region's agricultural industry. The city was also home to several large businesses, including a flour mill, a creamery, and a cannery.
Economy
Today, Ephraim is a small city with a diversified economy. The city is home to several small businesses, including a grocery store, a hardware store, and a variety of restaurants. The city is also home to Snow College, which is the largest employer in the city.
The city is also home to several manufacturing companies, including a furniture manufacturer, a plastics manufacturer, and a metal fabrication company. The city is also home to several agricultural businesses, including a dairy, a feed mill, and a seed company.
Demographics
As of the 2010 census, the population of Ephraim was 6,135. The racial makeup of the city was 94.3% White, 0.3% African American, 0.3% Native American, 0.7% Asian, 0.1% Pacific Islander, 2.2% from other races, and 2.3% from two or more races. Hispanic or Latino of any race were 4.7% of the population.
The median income for a household in the city was $41,944, and the median income for a family was $50,944. The per capita income for the city was $17,944. About 8.3% of families and 11.2% of the population were below the poverty line, including 14.2% of those under age 18 and 6.2% of those age 65 or over.
Ephraim is a small city with a rich history and a diverse economy. The city is home to several small businesses, manufacturing companies, and agricultural businesses. The city is also home to Snow College, which is the largest employer in the city. The population of the city is diverse, with a mix of races and ethnicities.
Common Questions
What is Per Capita Income in Ephraim?
Per Capita income in Ephraim is $22,526.
What is the Median Family Income in Ephraim?
Median Family Income in Ephraim is $86,842.
What is the Median Household income in Ephraim?
Median Household Income in Ephraim is $70,677.
What is Income or Wage Gap in Ephraim?
Income or Wage Gap in Ephraim is 49.4%.
Women in Ephraim earn 50.6 cents for every dollar earned by a man.
What is Family Income Deficit in Ephraim?
Family Income Deficit in Ephraim is $14,234.
Families that are below poverty line in Ephraim earn $14,234 less on average than the poverty threshold level.
What is Inequality or Gini Index in Ephraim?
Inequality or Gini Index in Ephraim is 0.35.
What is the Total Population of Ephraim?
Total Population of Ephraim is 5,739.
What is the Total Male Population of Ephraim?
Total Male Population of Ephraim is 2,743.
What is the Total Female Population of Ephraim?
Total Female Population of Ephraim is 2,996.
What is the Ratio of Males per 100 Females in Ephraim?
There are 91.56 Males per 100 Females in Ephraim.
What is the Ratio of Females per 100 Males in Ephraim?
There are 109.22 Females per 100 Males in Ephraim.
What is the Median Population Age in Ephraim?
Median Population Age in Ephraim is 21.8 Years.
What is the Average Family Size in Ephraim
Average Family Size in Ephraim is 3.6 People.
What is the Average Household Size in Ephraim
Average Household Size in Ephraim is 3.2 People.
How Large is the Labor Force in Ephraim?
There are 2,996 People in the Labor Forcein in Ephraim.
What is the Percentage of People in the Labor Force in Ephraim?
66.3% of People are in the Labor Force in Ephraim.
What is the Unemployment Rate in Ephraim?
Unemployment Rate in Ephraim is 8.4%.