Commack, NY Map & Demographics
Commack Map
Commack Overview
$67,118
PER CAPITA INCOME
$183,458
AVG FAMILY INCOME
$168,804
AVG HOUSEHOLD INCOME
38.8%
WAGE / INCOME GAP [ % ]
61.2¢/ $1
WAGE / INCOME GAP [ $ ]
0.40
INEQUALITY / GINI INDEX
35,770
TOTAL POPULATION
17,907
MALE POPULATION
17,863
FEMALE POPULATION
100.25
MALES / 100 FEMALES
99.75
FEMALES / 100 MALES
44.2
MEDIAN AGE
3.4
AVG FAMILY SIZE
3.1
AVG HOUSEHOLD SIZE
19,553
LABOR FORCE [ PEOPLE ]
67.0%
PERCENT IN LABOR FORCE
3.8%
UNEMPLOYMENT RATE
Commack Zip Codes
Commack Area Codes
Income in Commack
Income Overview in Commack
Per Capita Income in Commack is $67,118, while median incomes of families and households are $183,458 and $168,804 respectively.
| Characteristic | Number | Measure |
| Per Capita Income | 35,770 | $67,118 |
| Median Family Income | 9,631 | $183,458 |
| Mean Family Income | 9,631 | $222,775 |
| Median Household Income | 11,430 | $168,804 |
| Mean Household Income | 11,430 | $204,032 |
| Income Deficit | 9,631 | $0 |
| Wage / Income Gap (%) | 35,770 | 38.83% |
| Wage / Income Gap ($) | 35,770 | 61.17¢ per $1 |
| Gini / Inequality Index | 35,770 | 0.40 |
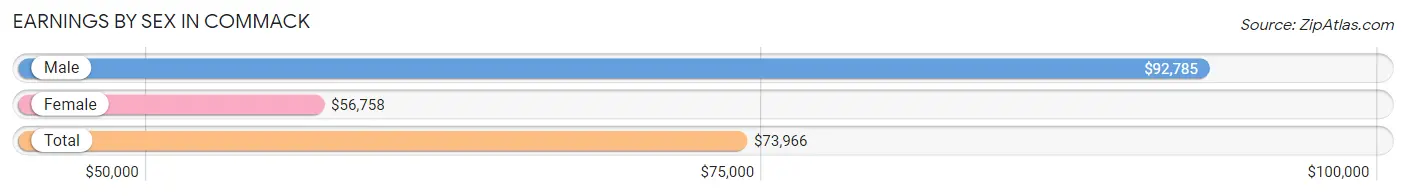
Earnings by Sex in Commack
Average Earnings in Commack are $73,966, $92,785 for men and $56,758 for women, a difference of 38.8%.
| Sex | Number | Average Earnings |
| Male | 10,536 (52.3%) | $92,785 |
| Female | 9,607 (47.7%) | $56,758 |
| Total | 20,143 (100.0%) | $73,966 |
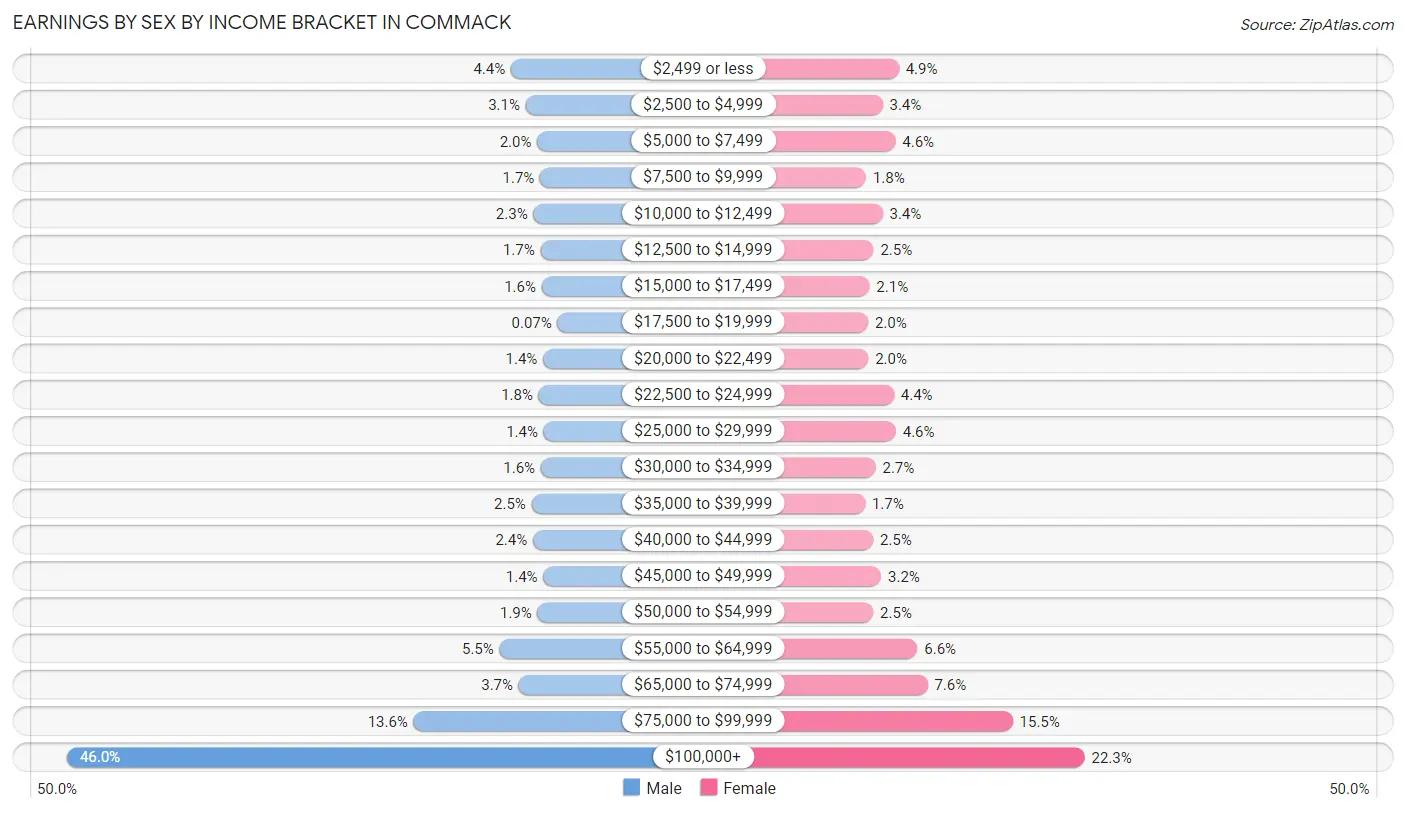
Earnings by Sex by Income Bracket in Commack
The most common earnings brackets in Commack are $100,000+ for men (4,850 | 46.0%) and $100,000+ for women (2,139 | 22.3%).
| Income | Male | Female |
| $2,499 or less | 467 (4.4%) | 467 (4.9%) |
| $2,500 to $4,999 | 321 (3.0%) | 322 (3.4%) |
| $5,000 to $7,499 | 208 (2.0%) | 437 (4.5%) |
| $7,500 to $9,999 | 179 (1.7%) | 173 (1.8%) |
| $10,000 to $12,499 | 246 (2.3%) | 322 (3.4%) |
| $12,500 to $14,999 | 176 (1.7%) | 240 (2.5%) |
| $15,000 to $17,499 | 163 (1.5%) | 204 (2.1%) |
| $17,500 to $19,999 | 7 (0.1%) | 190 (2.0%) |
| $20,000 to $22,499 | 150 (1.4%) | 193 (2.0%) |
| $22,500 to $24,999 | 193 (1.8%) | 424 (4.4%) |
| $25,000 to $29,999 | 143 (1.4%) | 441 (4.6%) |
| $30,000 to $34,999 | 172 (1.6%) | 258 (2.7%) |
| $35,000 to $39,999 | 263 (2.5%) | 163 (1.7%) |
| $40,000 to $44,999 | 250 (2.4%) | 236 (2.5%) |
| $45,000 to $49,999 | 147 (1.4%) | 308 (3.2%) |
| $50,000 to $54,999 | 204 (1.9%) | 237 (2.5%) |
| $55,000 to $64,999 | 579 (5.5%) | 635 (6.6%) |
| $65,000 to $74,999 | 390 (3.7%) | 726 (7.6%) |
| $75,000 to $99,999 | 1,428 (13.6%) | 1,492 (15.5%) |
| $100,000+ | 4,850 (46.0%) | 2,139 (22.3%) |
| Total | 10,536 (100.0%) | 9,607 (100.0%) |
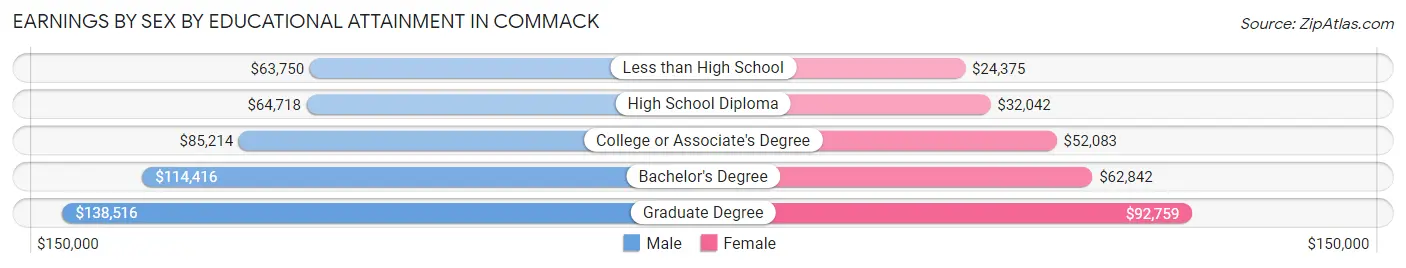
Earnings by Sex by Educational Attainment in Commack
Average earnings in Commack are $107,339 for men and $67,905 for women, a difference of 36.7%. Men with an educational attainment of graduate degree enjoy the highest average annual earnings of $138,516, while those with less than high school education earn the least with $63,750. Women with an educational attainment of graduate degree earn the most with the average annual earnings of $92,759, while those with less than high school education have the smallest earnings of $24,375.
| Educational Attainment | Male Income | Female Income |
| Less than High School | $63,750 | $24,375 |
| High School Diploma | $64,718 | $32,042 |
| College or Associate's Degree | $85,214 | $52,083 |
| Bachelor's Degree | $114,416 | $62,842 |
| Graduate Degree | $138,516 | $92,759 |
| Total | $107,339 | $67,905 |
Family Income in Commack
Family Income Brackets in Commack
According to the Commack family income data, there are 4,238 families falling into the $200,000+ income range, which is the most common income bracket and makes up 44.0% of all families. Conversely, the less than $10,000 income bracket is the least frequent group with only 19 families (0.2%) belonging to this category.
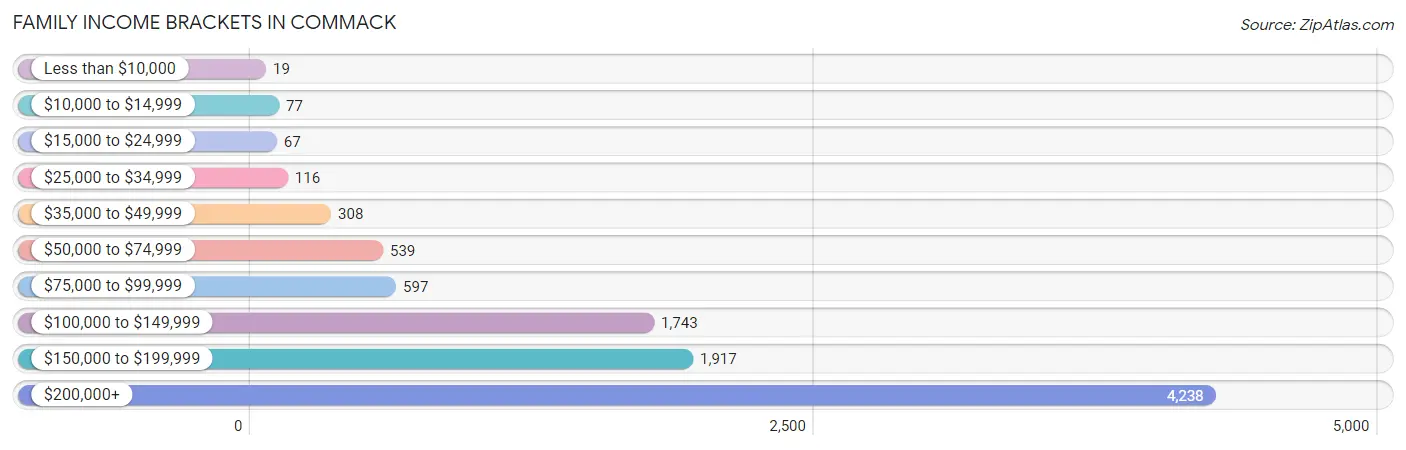
| Income Bracket | # Families | % Families |
| Less than $10,000 | 19 | 0.2% |
| $10,000 to $14,999 | 77 | 0.8% |
| $15,000 to $24,999 | 67 | 0.7% |
| $25,000 to $34,999 | 116 | 1.2% |
| $35,000 to $49,999 | 308 | 3.2% |
| $50,000 to $74,999 | 539 | 5.6% |
| $75,000 to $99,999 | 597 | 6.2% |
| $100,000 to $149,999 | 1,743 | 18.1% |
| $150,000 to $199,999 | 1,917 | 19.9% |
| $200,000+ | 4,238 | 44.0% |
Family Income by Famaliy Size in Commack
7+ person families (38 | 0.4%) account for the highest median family income in Commack with $250,001 per family, while 2-person families (3,711 | 38.5%) have the highest median income of $74,839 per family member.
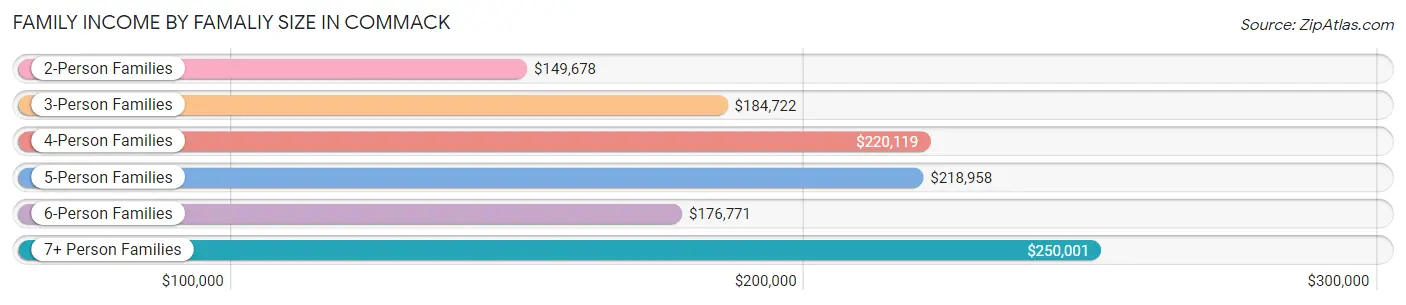
| Income Bracket | # Families | Median Income |
| 2-Person Families | 3,711 (38.5%) | $149,678 |
| 3-Person Families | 2,154 (22.4%) | $184,722 |
| 4-Person Families | 2,492 (25.9%) | $220,119 |
| 5-Person Families | 961 (10.0%) | $218,958 |
| 6-Person Families | 275 (2.9%) | $176,771 |
| 7+ Person Families | 38 (0.4%) | $250,001 |
| Total | 9,631 (100.0%) | $183,458 |
Family Income by Number of Earners in Commack
The median family income in Commack is $183,458, with families comprising 3+ earners (1,899) having the highest median family income of $229,125, while families with no earners (975) have the lowest median family income of $88,477, accounting for 19.7% and 10.1% of families, respectively.
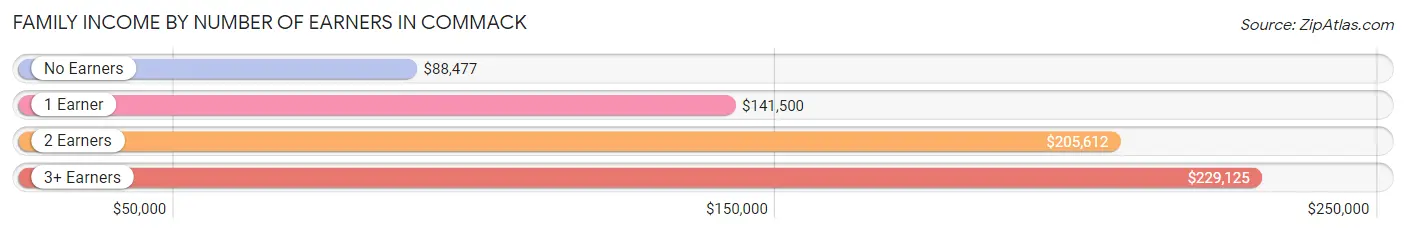
| Number of Earners | # Families | Median Income |
| No Earners | 975 (10.1%) | $88,477 |
| 1 Earner | 2,232 (23.2%) | $141,500 |
| 2 Earners | 4,525 (47.0%) | $205,612 |
| 3+ Earners | 1,899 (19.7%) | $229,125 |
| Total | 9,631 (100.0%) | $183,458 |
Household Income in Commack
Household Income Brackets in Commack
With 4,492 households falling in the category, the $200,000+ income range is the most frequent in Commack, accounting for 39.3% of all households. In contrast, only 103 households (0.9%) fall into the $10,000 to $14,999 income bracket, making it the least populous group.
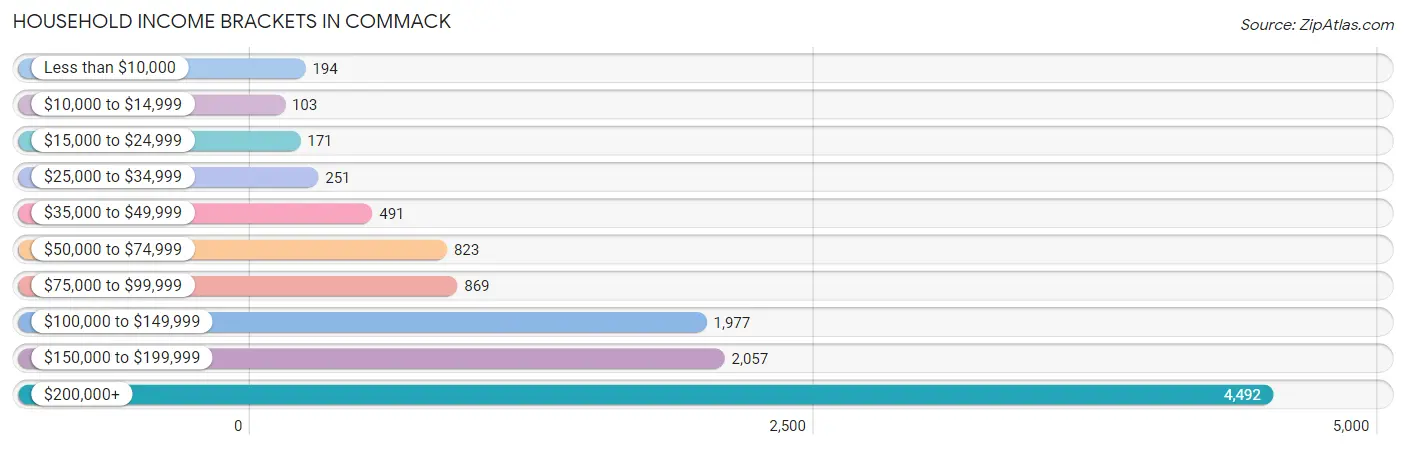
| Income Bracket | # Households | % Households |
| Less than $10,000 | 194 | 1.7% |
| $10,000 to $14,999 | 103 | 0.9% |
| $15,000 to $24,999 | 171 | 1.5% |
| $25,000 to $34,999 | 251 | 2.2% |
| $35,000 to $49,999 | 491 | 4.3% |
| $50,000 to $74,999 | 823 | 7.2% |
| $75,000 to $99,999 | 869 | 7.6% |
| $100,000 to $149,999 | 1,977 | 17.3% |
| $150,000 to $199,999 | 2,057 | 18.0% |
| $200,000+ | 4,492 | 39.3% |
Household Income by Householder Age in Commack
The median household income in Commack is $168,804, with the highest median household income of $197,529 found in the 25 to 44 years age bracket for the primary householder. A total of 2,275 households (19.9%) fall into this category. Meanwhile, the 15 to 24 years age bracket for the primary householder has the lowest median household income of $0, with 32 households (0.3%) in this group.
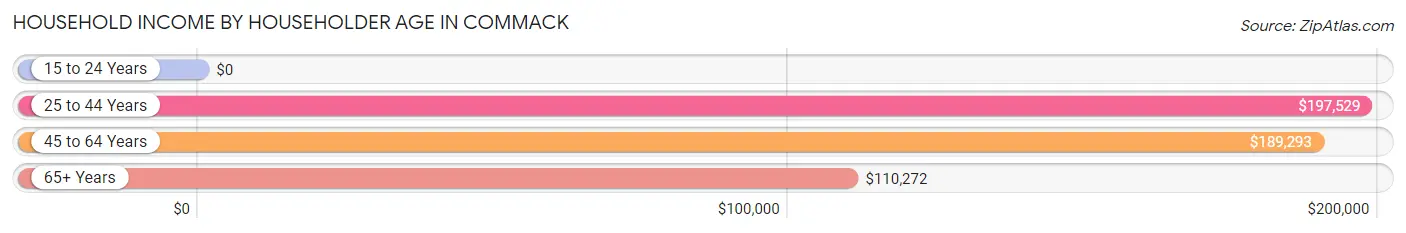
| Income Bracket | # Households | Median Income |
| 15 to 24 Years | 32 (0.3%) | $0 |
| 25 to 44 Years | 2,275 (19.9%) | $197,529 |
| 45 to 64 Years | 5,740 (50.2%) | $189,293 |
| 65+ Years | 3,383 (29.6%) | $110,272 |
| Total | 11,430 (100.0%) | $168,804 |
Poverty in Commack
Income Below Poverty by Sex and Age in Commack
With 1.8% poverty level for males and 2.7% for females among the residents of Commack, 15 year old males and 16 and 17 year old females are the most vulnerable to poverty, with 20 males (7.2%) and 36 females (5.7%) in their respective age groups living below the poverty level.
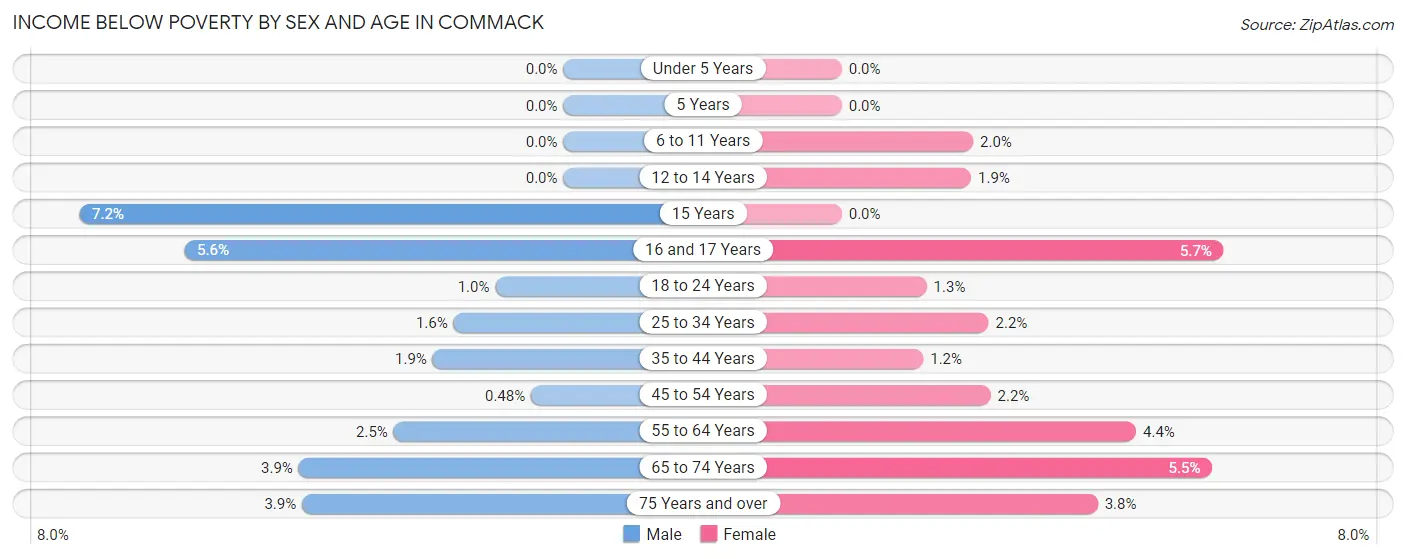
| Age Bracket | Male | Female |
| Under 5 Years | 0 (0.0%) | 0 (0.0%) |
| 5 Years | 0 (0.0%) | 0 (0.0%) |
| 6 to 11 Years | 0 (0.0%) | 18 (1.9%) |
| 12 to 14 Years | 0 (0.0%) | 14 (1.9%) |
| 15 Years | 20 (7.2%) | 0 (0.0%) |
| 16 and 17 Years | 32 (5.6%) | 36 (5.7%) |
| 18 to 24 Years | 19 (1.0%) | 17 (1.3%) |
| 25 to 34 Years | 31 (1.6%) | 42 (2.2%) |
| 35 to 44 Years | 31 (1.9%) | 22 (1.2%) |
| 45 to 54 Years | 14 (0.5%) | 64 (2.2%) |
| 55 to 64 Years | 72 (2.5%) | 116 (4.4%) |
| 65 to 74 Years | 60 (3.9%) | 86 (5.5%) |
| 75 Years and over | 45 (3.9%) | 62 (3.8%) |
| Total | 324 (1.8%) | 477 (2.7%) |
Income Above Poverty by Sex and Age in Commack
According to the poverty statistics in Commack, males aged under 5 years and females aged under 5 years are the age groups that are most secure financially, with 100.0% of males and 100.0% of females in these age groups living above the poverty line.
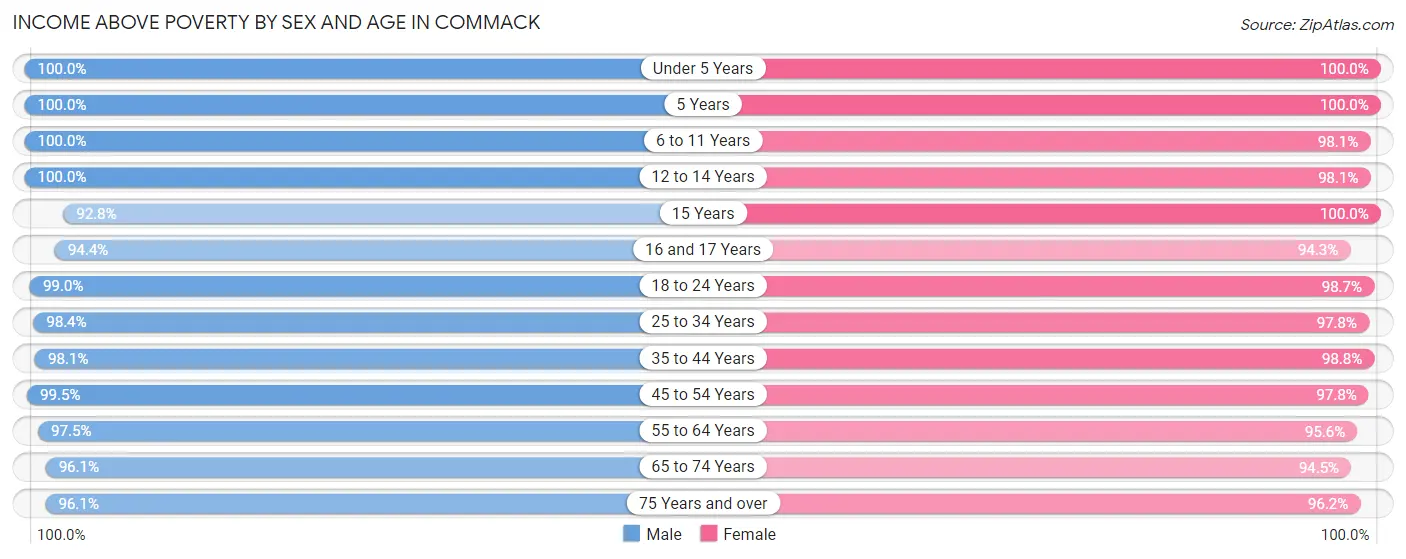
| Age Bracket | Male | Female |
| Under 5 Years | 784 (100.0%) | 940 (100.0%) |
| 5 Years | 136 (100.0%) | 106 (100.0%) |
| 6 to 11 Years | 1,278 (100.0%) | 907 (98.1%) |
| 12 to 14 Years | 910 (100.0%) | 714 (98.1%) |
| 15 Years | 258 (92.8%) | 290 (100.0%) |
| 16 and 17 Years | 536 (94.4%) | 599 (94.3%) |
| 18 to 24 Years | 1,855 (99.0%) | 1,333 (98.7%) |
| 25 to 34 Years | 1,874 (98.4%) | 1,885 (97.8%) |
| 35 to 44 Years | 1,567 (98.1%) | 1,801 (98.8%) |
| 45 to 54 Years | 2,888 (99.5%) | 2,827 (97.8%) |
| 55 to 64 Years | 2,787 (97.5%) | 2,540 (95.6%) |
| 65 to 74 Years | 1,467 (96.1%) | 1,477 (94.5%) |
| 75 Years and over | 1,114 (96.1%) | 1,571 (96.2%) |
| Total | 17,454 (98.2%) | 16,990 (97.3%) |
Income Below Poverty Among Married-Couple Families in Commack
The poverty statistics for married-couple families in Commack show that 1.1% or 88 of the total 8,359 families live below the poverty line. Families with no children have the highest poverty rate of 1.7%, comprising of 82 families. On the other hand, families with 3 or 4 children have the lowest poverty rate of 0.0%, which includes 0 families.
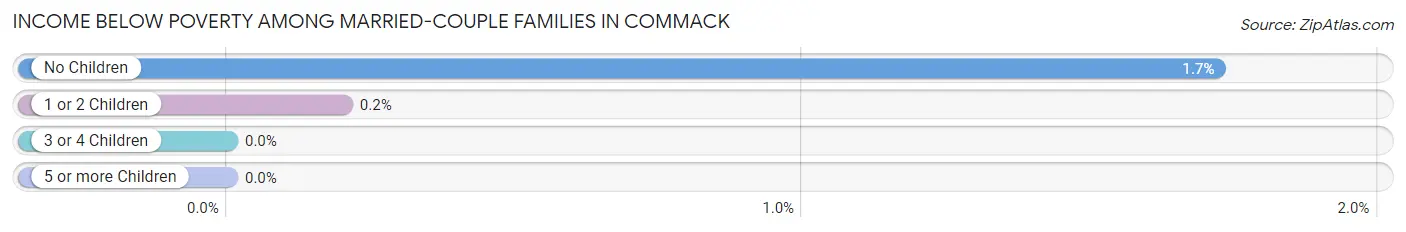
| Children | Above Poverty | Below Poverty |
| No Children | 4,699 (98.3%) | 82 (1.7%) |
| 1 or 2 Children | 2,998 (99.8%) | 6 (0.2%) |
| 3 or 4 Children | 574 (100.0%) | 0 (0.0%) |
| 5 or more Children | 0 (0.0%) | 0 (0.0%) |
| Total | 8,271 (99.0%) | 88 (1.1%) |
Income Below Poverty Among Single-Parent Households in Commack
According to the poverty data in Commack, 1.5% or 7 single-father households and 5.4% or 43 single-mother households are living below the poverty line. Among single-father households, those with no children have the highest poverty rate, with 7 households (1.8%) experiencing poverty. Likewise, among single-mother households, those with 1 or 2 children have the highest poverty rate, with 21 households (7.7%) falling below the poverty line.
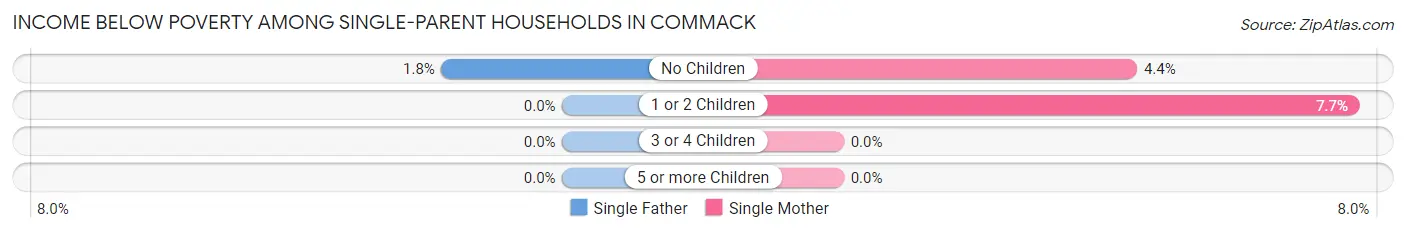
| Children | Single Father | Single Mother |
| No Children | 7 (1.8%) | 22 (4.4%) |
| 1 or 2 Children | 0 (0.0%) | 21 (7.7%) |
| 3 or 4 Children | 0 (0.0%) | 0 (0.0%) |
| 5 or more Children | 0 (0.0%) | 0 (0.0%) |
| Total | 7 (1.5%) | 43 (5.4%) |
Income Below Poverty Among Married-Couple vs Single-Parent Households in Commack
The poverty data for Commack shows that 88 of the married-couple family households (1.1%) and 50 of the single-parent households (3.9%) are living below the poverty level. Within the married-couple family households, those with no children have the highest poverty rate, with 82 households (1.7%) falling below the poverty line. Among the single-parent households, those with 1 or 2 children have the highest poverty rate, with 21 household (5.8%) living below poverty.
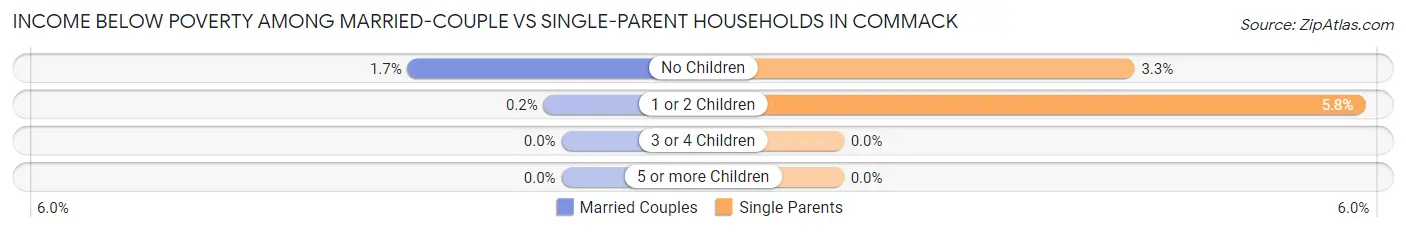
| Children | Married-Couple Families | Single-Parent Households |
| No Children | 82 (1.7%) | 29 (3.3%) |
| 1 or 2 Children | 6 (0.2%) | 21 (5.8%) |
| 3 or 4 Children | 0 (0.0%) | 0 (0.0%) |
| 5 or more Children | 0 (0.0%) | 0 (0.0%) |
| Total | 88 (1.1%) | 50 (3.9%) |
Race in Commack
The most populous races in Commack are White / Caucasian (31,337 | 87.6%), Hispanic or Latino (3,060 | 8.6%), and Asian (1,915 | 5.3%).
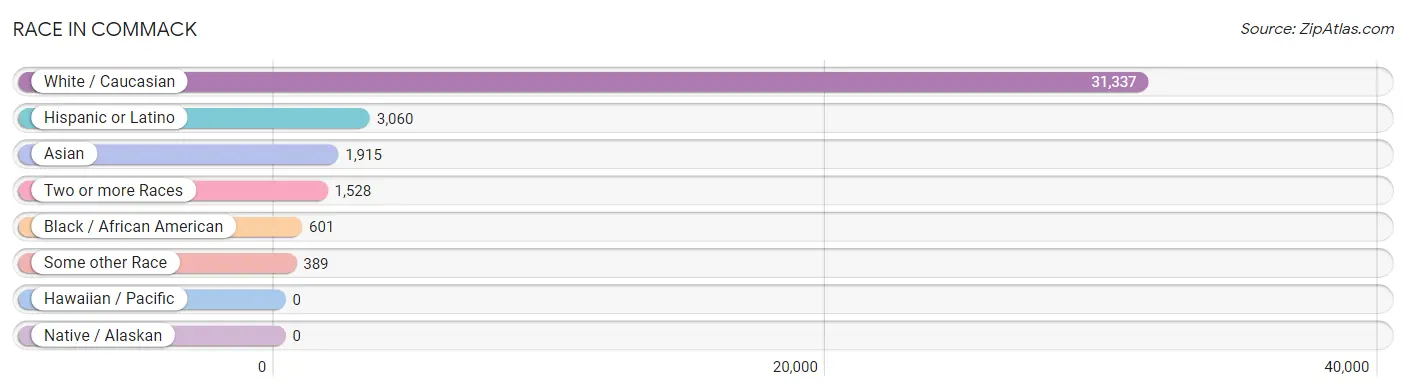
| Race | # Population | % Population |
| Asian | 1,915 | 5.3% |
| Black / African American | 601 | 1.7% |
| Hawaiian / Pacific | 0 | 0.0% |
| Hispanic or Latino | 3,060 | 8.6% |
| Native / Alaskan | 0 | 0.0% |
| White / Caucasian | 31,337 | 87.6% |
| Two or more Races | 1,528 | 4.3% |
| Some other Race | 389 | 1.1% |
| Total | 35,770 | 100.0% |
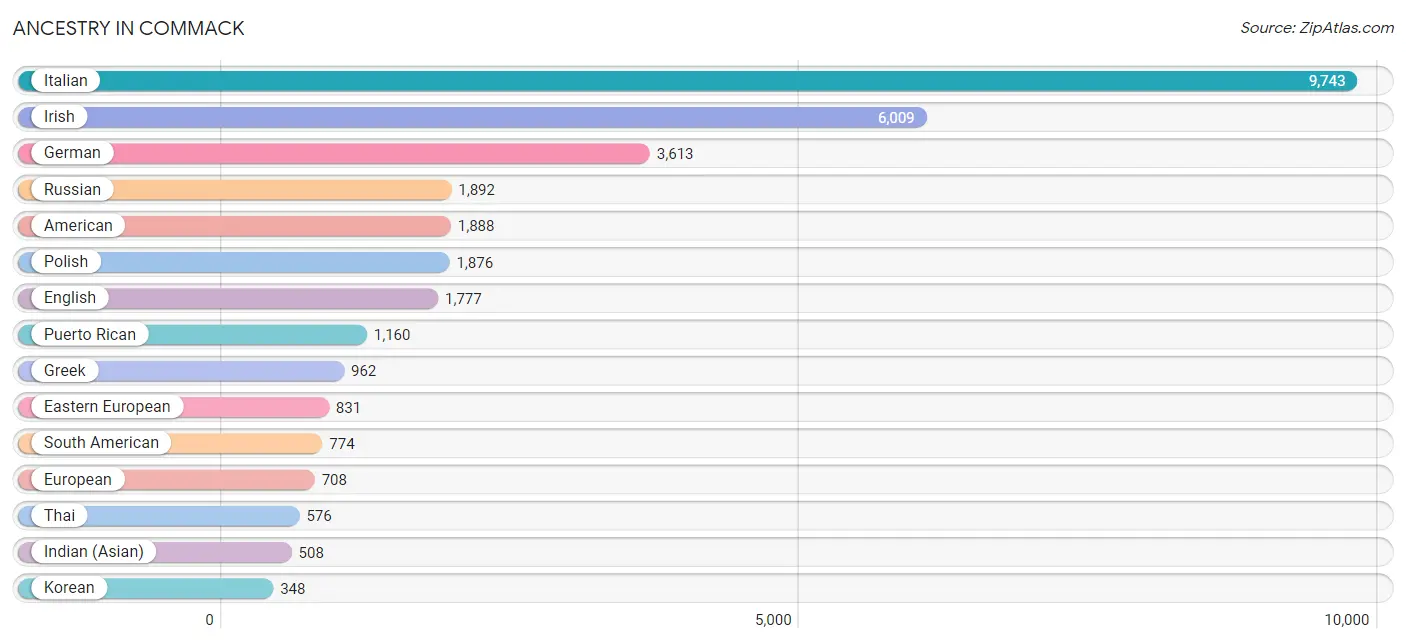
Ancestry in Commack
The most populous ancestries reported in Commack are Italian (9,743 | 27.2%), Irish (6,009 | 16.8%), German (3,613 | 10.1%), Russian (1,892 | 5.3%), and American (1,888 | 5.3%), together accounting for 64.7% of all Commack residents.
| Ancestry | # Population | % Population |
| American | 1,888 | 5.3% |
| Arab | 207 | 0.6% |
| Argentinean | 133 | 0.4% |
| Armenian | 137 | 0.4% |
| Australian | 34 | 0.1% |
| Austrian | 325 | 0.9% |
| Belgian | 29 | 0.1% |
| Belizean | 48 | 0.1% |
| Bhutanese | 17 | 0.1% |
| Brazilian | 73 | 0.2% |
| British | 75 | 0.2% |
| Burmese | 231 | 0.6% |
| Canadian | 34 | 0.1% |
| Central American | 217 | 0.6% |
| Chilean | 173 | 0.5% |
| Colombian | 251 | 0.7% |
| Costa Rican | 49 | 0.1% |
| Croatian | 284 | 0.8% |
| Cuban | 113 | 0.3% |
| Czech | 37 | 0.1% |
| Czechoslovakian | 43 | 0.1% |
| Danish | 199 | 0.6% |
| Dominican | 127 | 0.4% |
| Dutch | 156 | 0.4% |
| Eastern European | 831 | 2.3% |
| Ecuadorian | 88 | 0.3% |
| Egyptian | 93 | 0.3% |
| English | 1,777 | 5.0% |
| European | 708 | 2.0% |
| Filipino | 6 | 0.0% |
| French | 199 | 0.6% |
| French Canadian | 88 | 0.3% |
| German | 3,613 | 10.1% |
| Greek | 962 | 2.7% |
| Guatemalan | 77 | 0.2% |
| Guyanese | 9 | 0.0% |
| Haitian | 36 | 0.1% |
| Hungarian | 258 | 0.7% |
| Icelander | 10 | 0.0% |
| Indian (Asian) | 508 | 1.4% |
| Iranian | 7 | 0.0% |
| Irish | 6,009 | 16.8% |
| Israeli | 48 | 0.1% |
| Italian | 9,743 | 27.2% |
| Jamaican | 65 | 0.2% |
| Korean | 348 | 1.0% |
| Latvian | 60 | 0.2% |
| Lebanese | 47 | 0.1% |
| Lithuanian | 170 | 0.5% |
| Malaysian | 18 | 0.1% |
| Maltese | 51 | 0.1% |
| Mexican | 187 | 0.5% |
| Nigerian | 13 | 0.0% |
| Northern European | 10 | 0.0% |
| Norwegian | 321 | 0.9% |
| Pakistani | 18 | 0.1% |
| Panamanian | 59 | 0.2% |
| Peruvian | 58 | 0.2% |
| Polish | 1,876 | 5.2% |
| Portuguese | 171 | 0.5% |
| Puerto Rican | 1,160 | 3.2% |
| Romanian | 203 | 0.6% |
| Russian | 1,892 | 5.3% |
| Salvadoran | 32 | 0.1% |
| Scotch-Irish | 9 | 0.0% |
| Scottish | 145 | 0.4% |
| Serbian | 22 | 0.1% |
| Slavic | 15 | 0.0% |
| Slovene | 12 | 0.0% |
| South American | 774 | 2.2% |
| South American Indian | 54 | 0.2% |
| Spaniard | 235 | 0.7% |
| Spanish | 119 | 0.3% |
| Sri Lankan | 90 | 0.3% |
| Subsaharan African | 35 | 0.1% |
| Swedish | 153 | 0.4% |
| Swiss | 157 | 0.4% |
| Syrian | 13 | 0.0% |
| Thai | 576 | 1.6% |
| Trinidadian and Tobagonian | 12 | 0.0% |
| Turkish | 74 | 0.2% |
| Ukrainian | 186 | 0.5% |
| Uruguayan | 12 | 0.0% |
| Venezuelan | 59 | 0.2% |
| Vietnamese | 178 | 0.5% |
| Welsh | 37 | 0.1% |
| Yugoslavian | 31 | 0.1% | View All 87 Rows |
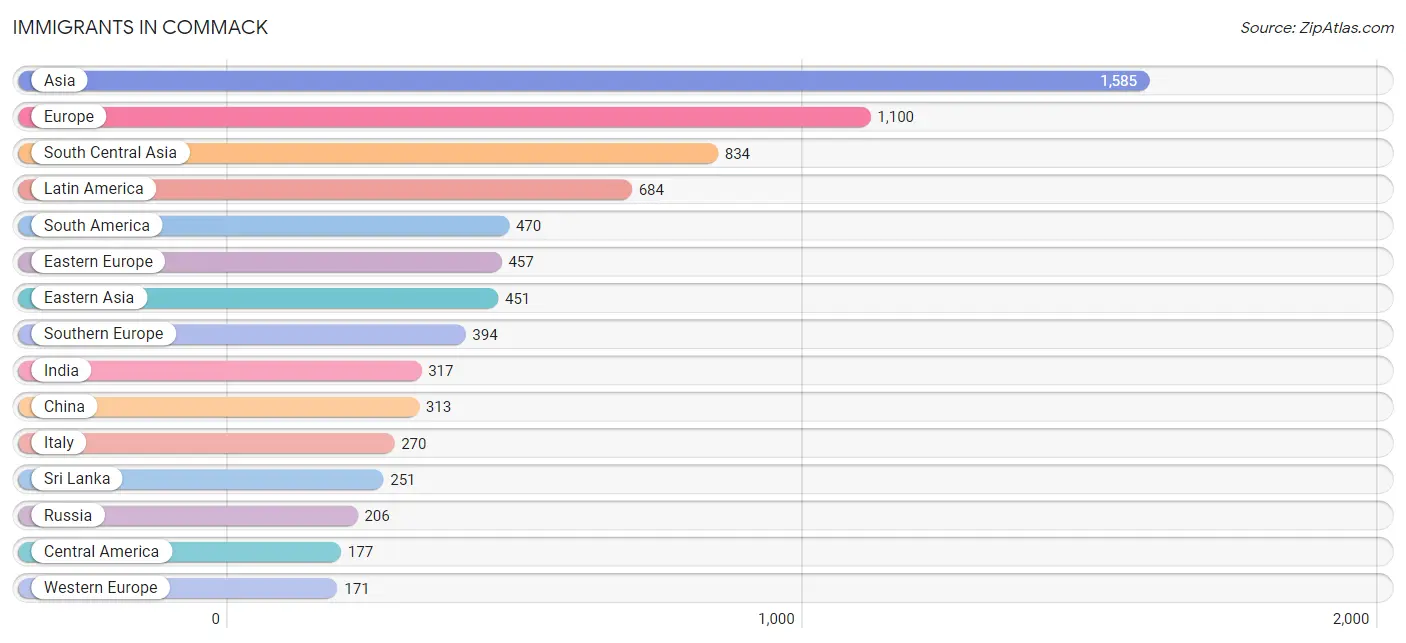
Immigrants in Commack
The most numerous immigrant groups reported in Commack came from Asia (1,585 | 4.4%), Europe (1,100 | 3.1%), South Central Asia (834 | 2.3%), Latin America (684 | 1.9%), and South America (470 | 1.3%), together accounting for 13.1% of all Commack residents.
| Immigration Origin | # Population | % Population |
| Africa | 167 | 0.5% |
| Argentina | 133 | 0.4% |
| Asia | 1,585 | 4.4% |
| Australia | 13 | 0.0% |
| Austria | 11 | 0.0% |
| Bangladesh | 154 | 0.4% |
| Belgium | 13 | 0.0% |
| Belize | 11 | 0.0% |
| Bosnia and Herzegovina | 12 | 0.0% |
| Brazil | 14 | 0.0% |
| Canada | 37 | 0.1% |
| Caribbean | 37 | 0.1% |
| Central America | 177 | 0.5% |
| Chile | 41 | 0.1% |
| China | 313 | 0.9% |
| Colombia | 109 | 0.3% |
| Congo | 10 | 0.0% |
| Croatia | 21 | 0.1% |
| Dominican Republic | 9 | 0.0% |
| Eastern Asia | 451 | 1.3% |
| Eastern Europe | 457 | 1.3% |
| Ecuador | 28 | 0.1% |
| Egypt | 106 | 0.3% |
| El Salvador | 32 | 0.1% |
| England | 38 | 0.1% |
| Europe | 1,100 | 3.1% |
| Germany | 53 | 0.2% |
| Greece | 65 | 0.2% |
| Guatemala | 65 | 0.2% |
| Guyana | 80 | 0.2% |
| Haiti | 18 | 0.1% |
| Hong Kong | 11 | 0.0% |
| India | 317 | 0.9% |
| Indonesia | 24 | 0.1% |
| Iran | 7 | 0.0% |
| Ireland | 40 | 0.1% |
| Israel | 22 | 0.1% |
| Italy | 270 | 0.7% |
| Jamaica | 10 | 0.0% |
| Kazakhstan | 19 | 0.1% |
| Korea | 138 | 0.4% |
| Latin America | 684 | 1.9% |
| Lebanon | 44 | 0.1% |
| Malaysia | 5 | 0.0% |
| Mexico | 69 | 0.2% |
| Middle Africa | 10 | 0.0% |
| Moldova | 9 | 0.0% |
| Nigeria | 14 | 0.0% |
| Northern Africa | 143 | 0.4% |
| Northern Europe | 78 | 0.2% |
| Oceania | 13 | 0.0% |
| Pakistan | 71 | 0.2% |
| Peru | 10 | 0.0% |
| Philippines | 78 | 0.2% |
| Poland | 101 | 0.3% |
| Portugal | 31 | 0.1% |
| Romania | 10 | 0.0% |
| Russia | 206 | 0.6% |
| Serbia | 11 | 0.0% |
| South America | 470 | 1.3% |
| South Central Asia | 834 | 2.3% |
| South Eastern Asia | 149 | 0.4% |
| Southern Europe | 394 | 1.1% |
| Spain | 28 | 0.1% |
| Sri Lanka | 251 | 0.7% |
| Sudan | 37 | 0.1% |
| Switzerland | 94 | 0.3% |
| Taiwan | 69 | 0.2% |
| Turkey | 85 | 0.2% |
| Ukraine | 62 | 0.2% |
| Uruguay | 22 | 0.1% |
| Uzbekistan | 15 | 0.0% |
| Venezuela | 33 | 0.1% |
| Vietnam | 42 | 0.1% |
| Western Africa | 14 | 0.0% |
| Western Asia | 151 | 0.4% |
| Western Europe | 171 | 0.5% | View All 77 Rows |
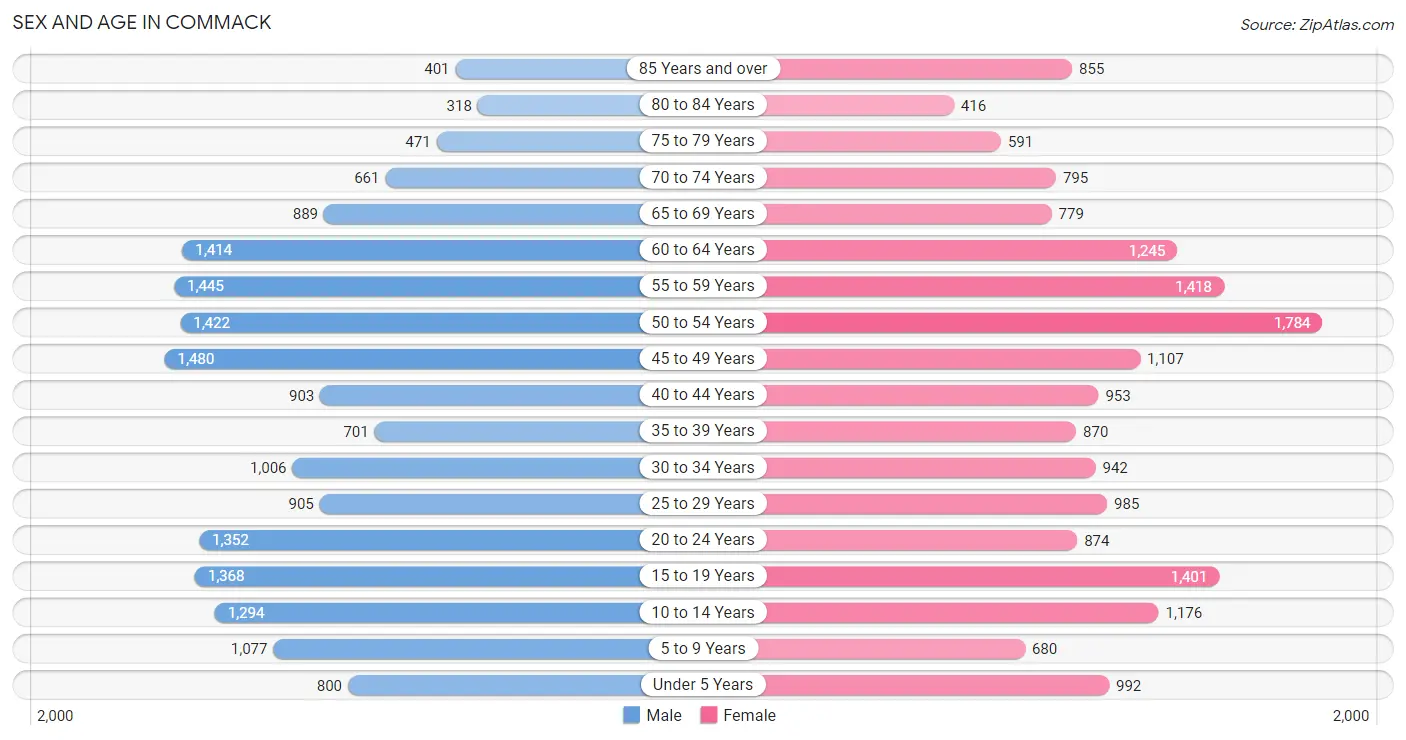
Sex and Age in Commack
Sex and Age in Commack
The most populous age groups in Commack are 45 to 49 Years (1,480 | 8.3%) for men and 50 to 54 Years (1,784 | 10.0%) for women.
| Age Bracket | Male | Female |
| Under 5 Years | 800 (4.5%) | 992 (5.6%) |
| 5 to 9 Years | 1,077 (6.0%) | 680 (3.8%) |
| 10 to 14 Years | 1,294 (7.2%) | 1,176 (6.6%) |
| 15 to 19 Years | 1,368 (7.6%) | 1,401 (7.8%) |
| 20 to 24 Years | 1,352 (7.5%) | 874 (4.9%) |
| 25 to 29 Years | 905 (5.1%) | 985 (5.5%) |
| 30 to 34 Years | 1,006 (5.6%) | 942 (5.3%) |
| 35 to 39 Years | 701 (3.9%) | 870 (4.9%) |
| 40 to 44 Years | 903 (5.0%) | 953 (5.3%) |
| 45 to 49 Years | 1,480 (8.3%) | 1,107 (6.2%) |
| 50 to 54 Years | 1,422 (7.9%) | 1,784 (10.0%) |
| 55 to 59 Years | 1,445 (8.1%) | 1,418 (7.9%) |
| 60 to 64 Years | 1,414 (7.9%) | 1,245 (7.0%) |
| 65 to 69 Years | 889 (5.0%) | 779 (4.4%) |
| 70 to 74 Years | 661 (3.7%) | 795 (4.4%) |
| 75 to 79 Years | 471 (2.6%) | 591 (3.3%) |
| 80 to 84 Years | 318 (1.8%) | 416 (2.3%) |
| 85 Years and over | 401 (2.2%) | 855 (4.8%) |
| Total | 17,907 (100.0%) | 17,863 (100.0%) |
Families and Households in Commack
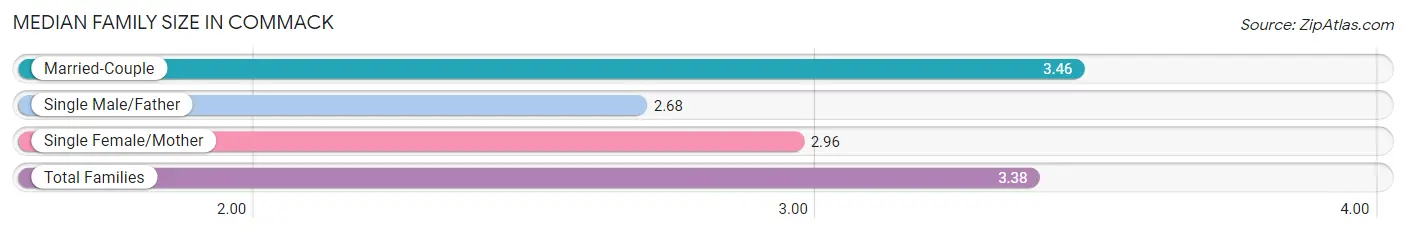
Median Family Size in Commack
The median family size in Commack is 3.38 persons per family, with married-couple families (8,359 | 86.8%) accounting for the largest median family size of 3.46 persons per family. On the other hand, single male/father families (476 | 4.9%) represent the smallest median family size with 2.68 persons per family.
| Family Type | # Families | Family Size |
| Married-Couple | 8,359 (86.8%) | 3.46 |
| Single Male/Father | 476 (4.9%) | 2.68 |
| Single Female/Mother | 796 (8.3%) | 2.96 |
| Total Families | 9,631 (100.0%) | 3.38 |
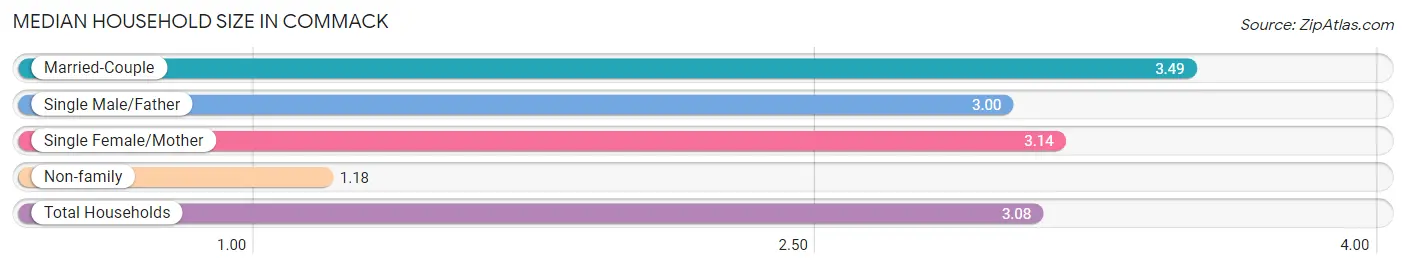
Median Household Size in Commack
The median household size in Commack is 3.08 persons per household, with married-couple households (8,359 | 73.1%) accounting for the largest median household size of 3.49 persons per household. non-family households (1,799 | 15.7%) represent the smallest median household size with 1.18 persons per household.
| Household Type | # Households | Household Size |
| Married-Couple | 8,359 (73.1%) | 3.49 |
| Single Male/Father | 476 (4.2%) | 3.00 |
| Single Female/Mother | 796 (7.0%) | 3.14 |
| Non-family | 1,799 (15.7%) | 1.18 |
| Total Households | 11,430 (100.0%) | 3.08 |
Household Size by Marriage Status in Commack
Out of a total of 11,430 households in Commack, 9,631 (84.3%) are family households, while 1,799 (15.7%) are nonfamily households. The most numerous type of family households are 2-person households, comprising 3,574, and the most common type of nonfamily households are 1-person households, comprising 1,539.
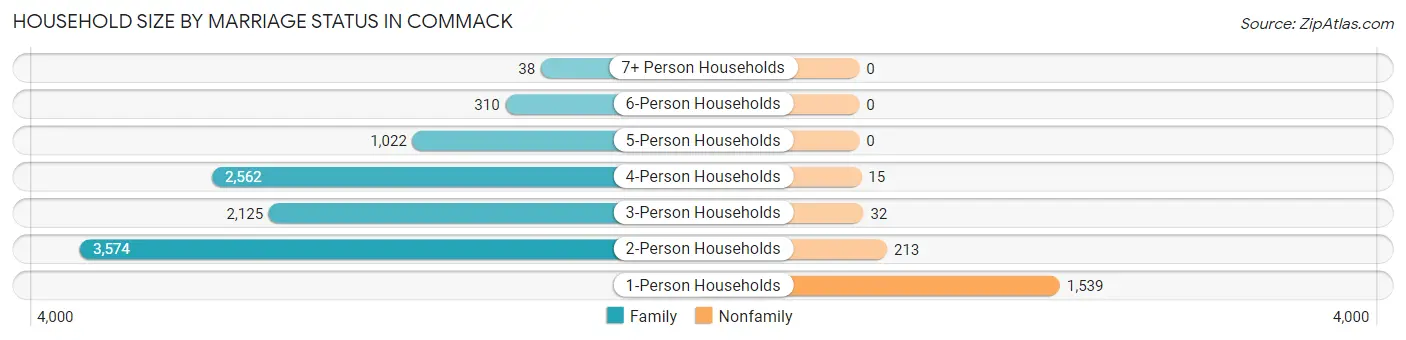
| Household Size | Family Households | Nonfamily Households |
| 1-Person Households | - | 1,539 (13.5%) |
| 2-Person Households | 3,574 (31.3%) | 213 (1.9%) |
| 3-Person Households | 2,125 (18.6%) | 32 (0.3%) |
| 4-Person Households | 2,562 (22.4%) | 15 (0.1%) |
| 5-Person Households | 1,022 (8.9%) | 0 (0.0%) |
| 6-Person Households | 310 (2.7%) | 0 (0.0%) |
| 7+ Person Households | 38 (0.3%) | 0 (0.0%) |
| Total | 9,631 (84.3%) | 1,799 (15.7%) |
Female Fertility in Commack
Fertility by Age in Commack
Average fertility rate in Commack is 56.0 births per 1,000 women. Women in the age bracket of 20 to 34 years have the highest fertility rate with 81.0 births per 1,000 women. Women in the age bracket of 20 to 34 years acount for 52.8% of all women with births.
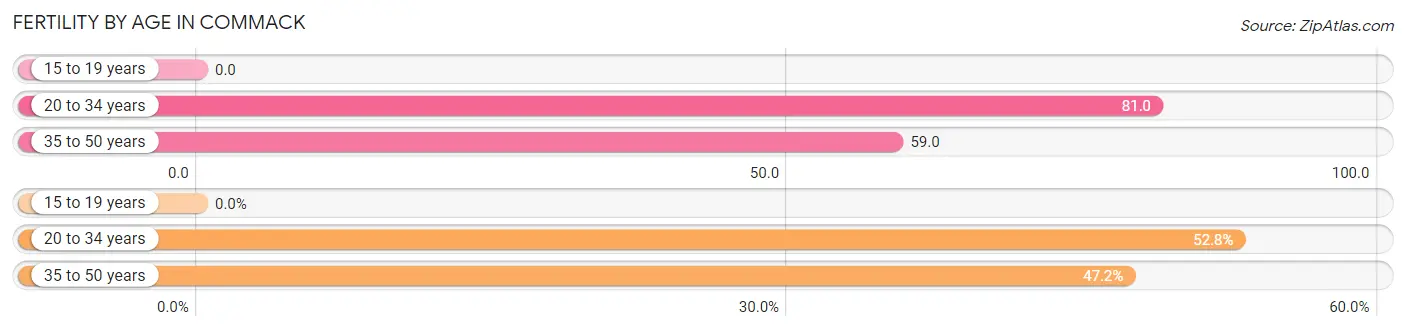
| Age Bracket | Women with Births | Births / 1,000 Women |
| 15 to 19 years | 0 (0.0%) | 0.0 |
| 20 to 34 years | 226 (52.8%) | 81.0 |
| 35 to 50 years | 202 (47.2%) | 59.0 |
| Total | 428 (100.0%) | 56.0 |
Fertility by Age by Marriage Status in Commack
92.3% of women with births (428) in Commack are married. The highest percentage of unmarried women with births falls into 35 to 50 years age bracket with 16.3% of them unmarried at the time of birth, while the lowest percentage of unmarried women with births belong to 20 to 34 years age bracket with 0.0% of them unmarried.
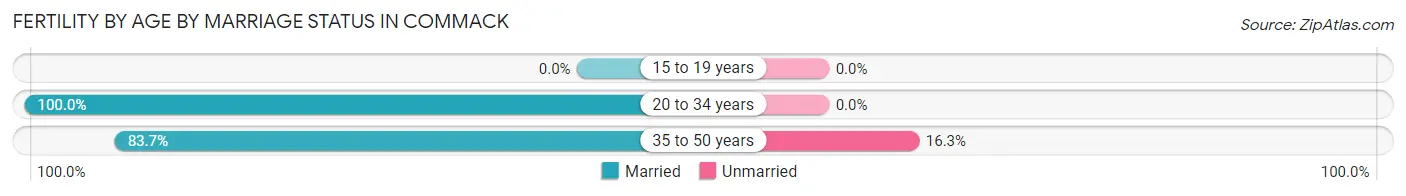
| Age Bracket | Married | Unmarried |
| 15 to 19 years | 0 (0.0%) | 0 (0.0%) |
| 20 to 34 years | 226 (100.0%) | 0 (0.0%) |
| 35 to 50 years | 169 (83.7%) | 33 (16.3%) |
| Total | 395 (92.3%) | 33 (7.7%) |
Fertility by Education in Commack
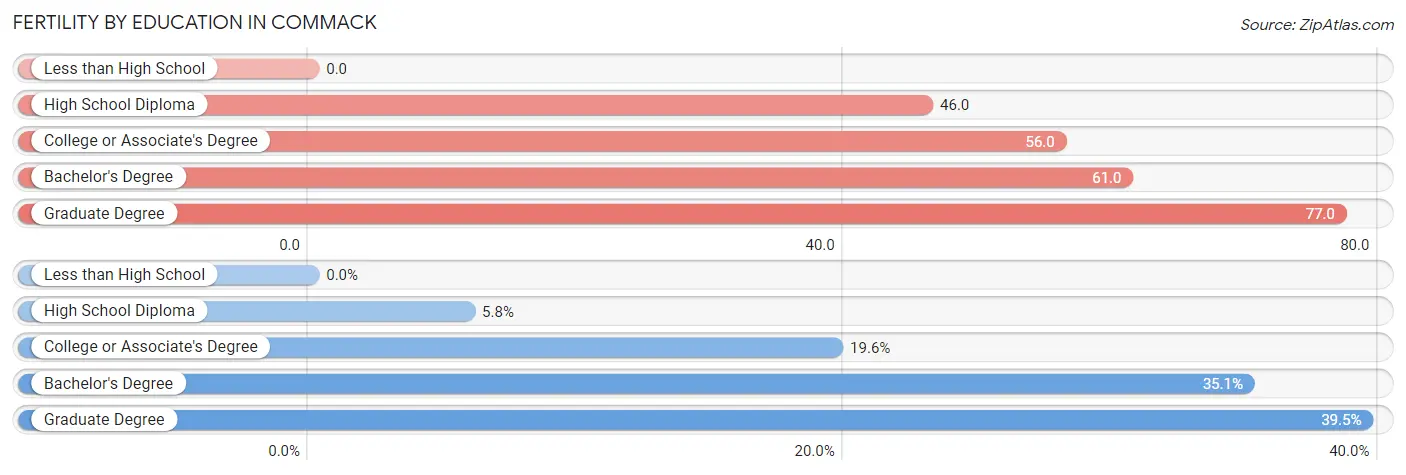
| Educational Attainment | Women with Births | Births / 1,000 Women |
| Less than High School | 0 (0.0%) | 0.0 |
| High School Diploma | 25 (5.8%) | 46.0 |
| College or Associate's Degree | 84 (19.6%) | 56.0 |
| Bachelor's Degree | 150 (35.0%) | 61.0 |
| Graduate Degree | 169 (39.5%) | 77.0 |
| Total | 428 (100.0%) | 56.0 |
Fertility by Education by Marriage Status in Commack
7.7% of women with births in Commack are unmarried. Women with the educational attainment of high school diploma are most likely to be married with 100.0% of them married at childbirth, while women with the educational attainment of college or associate's degree are least likely to be married with 39.3% of them unmarried at childbirth.
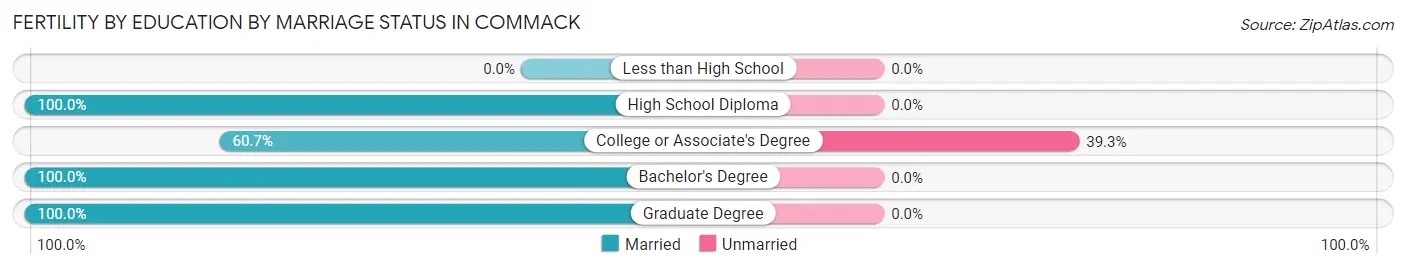
| Educational Attainment | Married | Unmarried |
| Less than High School | 0 (0.0%) | 0 (0.0%) |
| High School Diploma | 25 (100.0%) | 0 (0.0%) |
| College or Associate's Degree | 51 (60.7%) | 33 (39.3%) |
| Bachelor's Degree | 150 (100.0%) | 0 (0.0%) |
| Graduate Degree | 169 (100.0%) | 0 (0.0%) |
| Total | 395 (92.3%) | 33 (7.7%) |
Employment Characteristics in Commack
Employment by Class of Employer in Commack
Among the 18,365 employed individuals in Commack, private company employees (11,551 | 62.9%), local government employees (2,353 | 12.8%), and not-for-profit organizations (1,575 | 8.6%) make up the most common classes of employment.
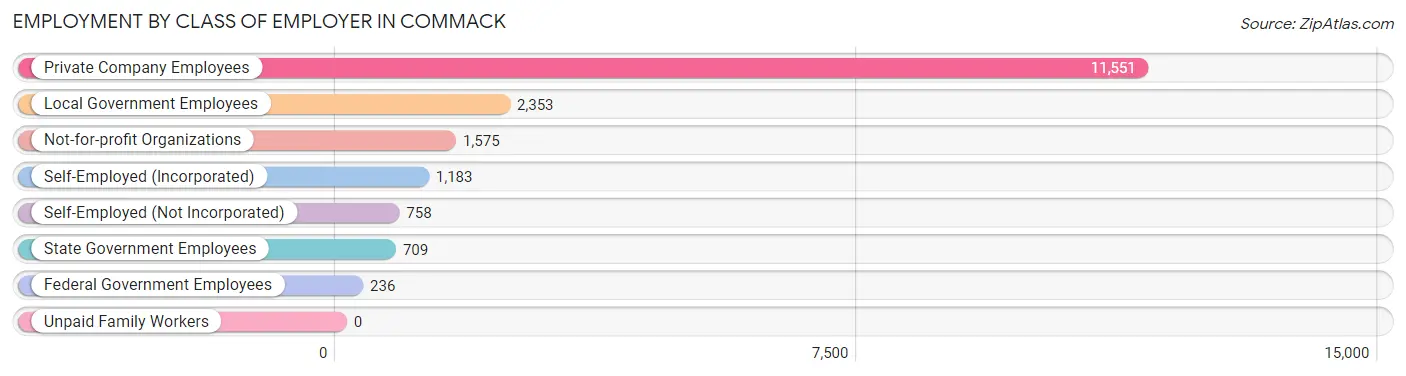
| Employer Class | # Employees | % Employees |
| Private Company Employees | 11,551 | 62.9% |
| Self-Employed (Incorporated) | 1,183 | 6.4% |
| Self-Employed (Not Incorporated) | 758 | 4.1% |
| Not-for-profit Organizations | 1,575 | 8.6% |
| Local Government Employees | 2,353 | 12.8% |
| State Government Employees | 709 | 3.9% |
| Federal Government Employees | 236 | 1.3% |
| Unpaid Family Workers | 0 | 0.0% |
| Total | 18,365 | 100.0% |
Employment Status by Age in Commack
According to the labor force statistics for Commack, out of the total population over 16 years of age (29,183), 67.0% or 19,553 individuals are in the labor force, with 3.8% or 743 of them unemployed. The age group with the highest labor force participation rate is 25 to 29 years, with 92.0% or 1,739 individuals in the labor force. Within the labor force, the 16 to 19 years age range has the highest percentage of unemployed individuals, with 14.0% or 97 of them being unemployed.
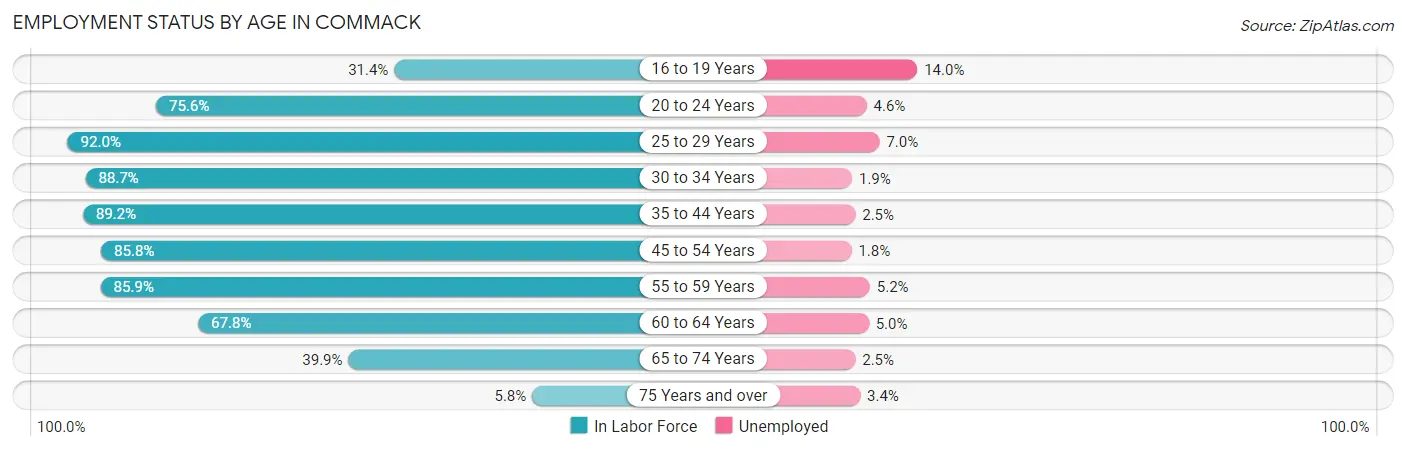
| Age Bracket | In Labor Force | Unemployed |
| 16 to 19 Years | 691 (31.4%) | 97 (14.0%) |
| 20 to 24 Years | 1,683 (75.6%) | 77 (4.6%) |
| 25 to 29 Years | 1,739 (92.0%) | 122 (7.0%) |
| 30 to 34 Years | 1,728 (88.7%) | 33 (1.9%) |
| 35 to 44 Years | 3,057 (89.2%) | 76 (2.5%) |
| 45 to 54 Years | 4,970 (85.8%) | 89 (1.8%) |
| 55 to 59 Years | 2,459 (85.9%) | 128 (5.2%) |
| 60 to 64 Years | 1,803 (67.8%) | 90 (5.0%) |
| 65 to 74 Years | 1,246 (39.9%) | 31 (2.5%) |
| 75 Years and over | 177 (5.8%) | 6 (3.4%) |
| Total | 19,553 (67.0%) | 743 (3.8%) |
Employment Status by Educational Attainment in Commack
According to labor force statistics for Commack, 84.8% of individuals (15,756) out of the total population between 25 and 64 years of age (18,580) are in the labor force, with 3.4% or 536 of them being unemployed. The group with the highest labor force participation rate are those with the educational attainment of bachelor's degree or higher, with 89.9% or 10,696 individuals in the labor force. Within the labor force, individuals with high school diploma education have the highest percentage of unemployment, with 6.7% or 97 of them being unemployed.
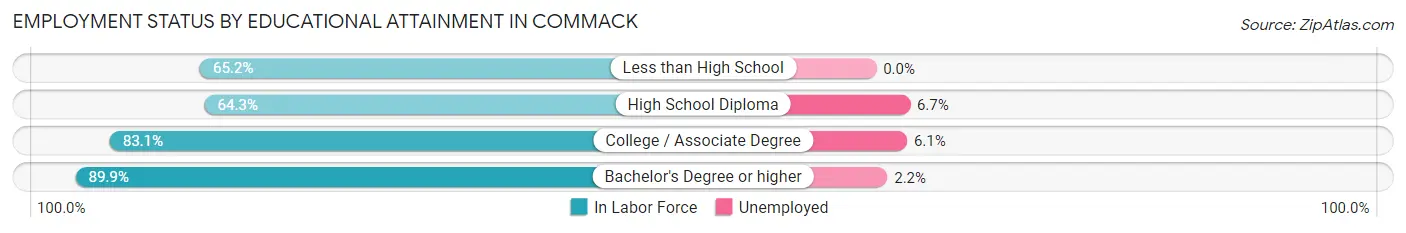
| Educational Attainment | In Labor Force | Unemployed |
| Less than High School | 276 (65.2%) | 0 (0.0%) |
| High School Diploma | 1,441 (64.3%) | 150 (6.7%) |
| College / Associate Degree | 3,339 (83.1%) | 245 (6.1%) |
| Bachelor's Degree or higher | 10,696 (89.9%) | 262 (2.2%) |
| Total | 15,756 (84.8%) | 632 (3.4%) |
Employment Occupations by Sex in Commack
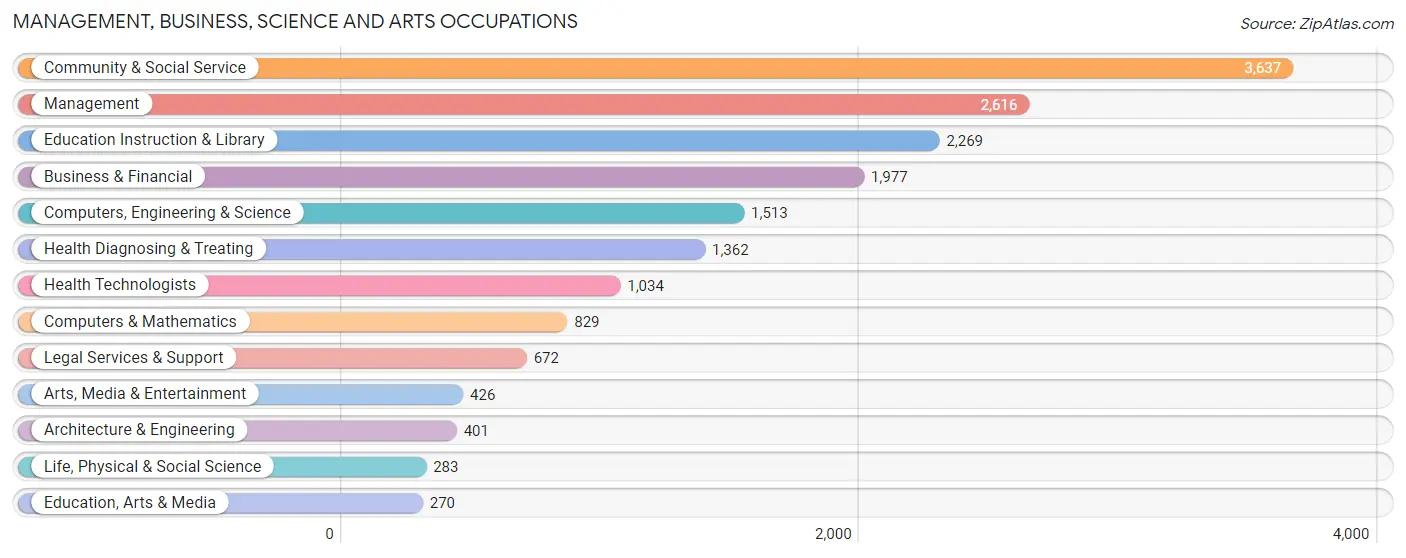
Management, Business, Science and Arts Occupations
The most common Management, Business, Science and Arts occupations in Commack are Community & Social Service (3,637 | 19.3%), Management (2,616 | 13.9%), Education Instruction & Library (2,269 | 12.1%), Business & Financial (1,977 | 10.5%), and Computers, Engineering & Science (1,513 | 8.1%).
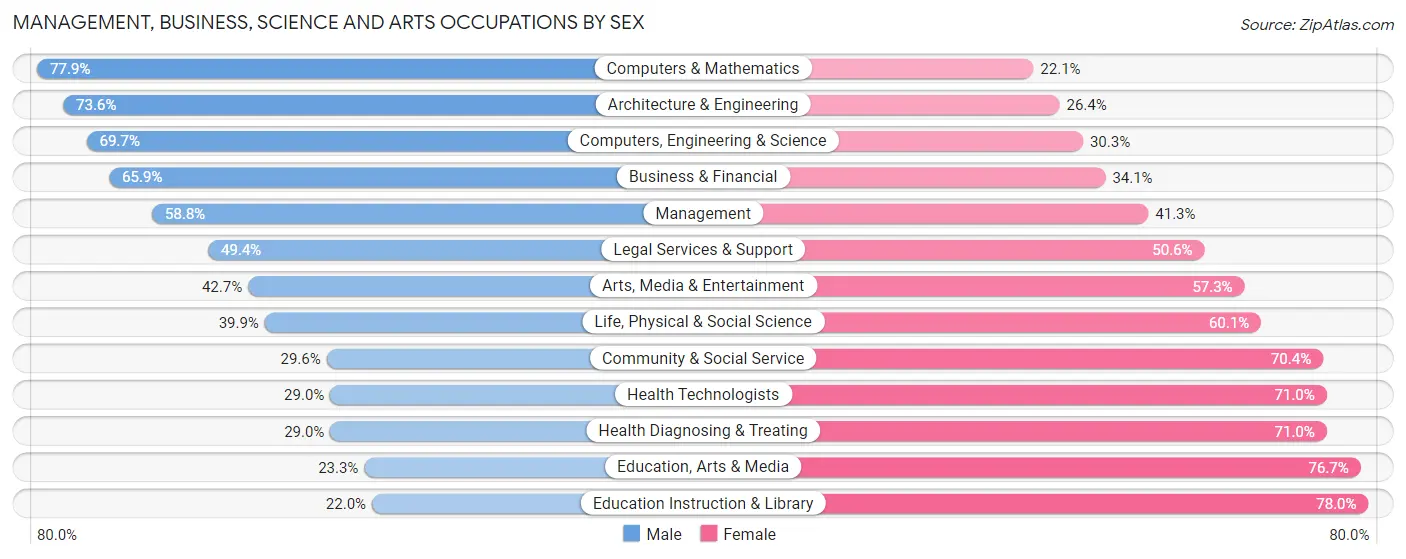
Management, Business, Science and Arts Occupations by Sex
Within the Management, Business, Science and Arts occupations in Commack, the most male-oriented occupations are Computers & Mathematics (77.9%), Architecture & Engineering (73.6%), and Computers, Engineering & Science (69.7%), while the most female-oriented occupations are Education Instruction & Library (78.0%), Education, Arts & Media (76.7%), and Health Diagnosing & Treating (71.0%).
| Occupation | Male | Female |
| Management | 1,537 (58.8%) | 1,079 (41.2%) |
| Business & Financial | 1,303 (65.9%) | 674 (34.1%) |
| Computers, Engineering & Science | 1,054 (69.7%) | 459 (30.3%) |
| Computers & Mathematics | 646 (77.9%) | 183 (22.1%) |
| Architecture & Engineering | 295 (73.6%) | 106 (26.4%) |
| Life, Physical & Social Science | 113 (39.9%) | 170 (60.1%) |
| Community & Social Service | 1,077 (29.6%) | 2,560 (70.4%) |
| Education, Arts & Media | 63 (23.3%) | 207 (76.7%) |
| Legal Services & Support | 332 (49.4%) | 340 (50.6%) |
| Education Instruction & Library | 500 (22.0%) | 1,769 (78.0%) |
| Arts, Media & Entertainment | 182 (42.7%) | 244 (57.3%) |
| Health Diagnosing & Treating | 395 (29.0%) | 967 (71.0%) |
| Health Technologists | 300 (29.0%) | 734 (71.0%) |
| Total (Category) | 5,366 (48.3%) | 5,739 (51.7%) |
| Total (Overall) | 9,777 (52.0%) | 9,026 (48.0%) |
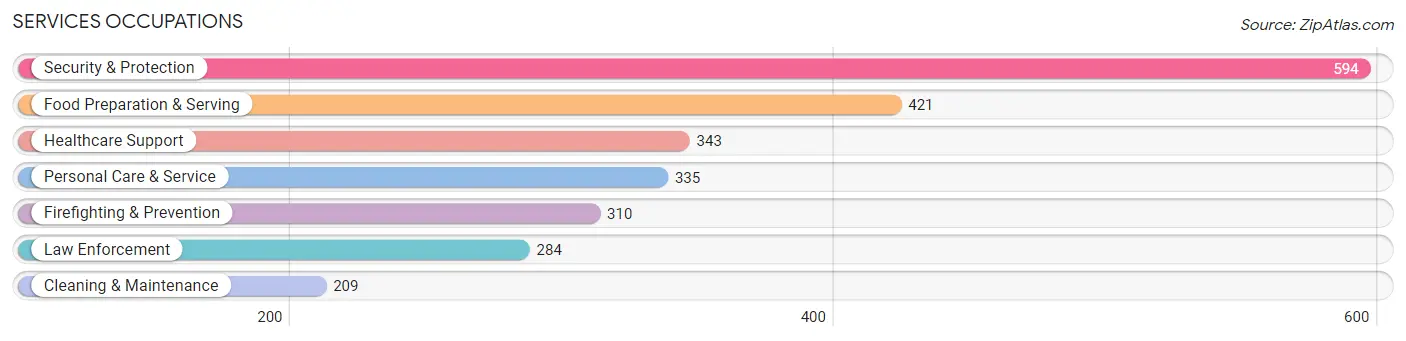
Services Occupations
The most common Services occupations in Commack are Security & Protection (594 | 3.2%), Food Preparation & Serving (421 | 2.2%), Healthcare Support (343 | 1.8%), Personal Care & Service (335 | 1.8%), and Firefighting & Prevention (310 | 1.7%).
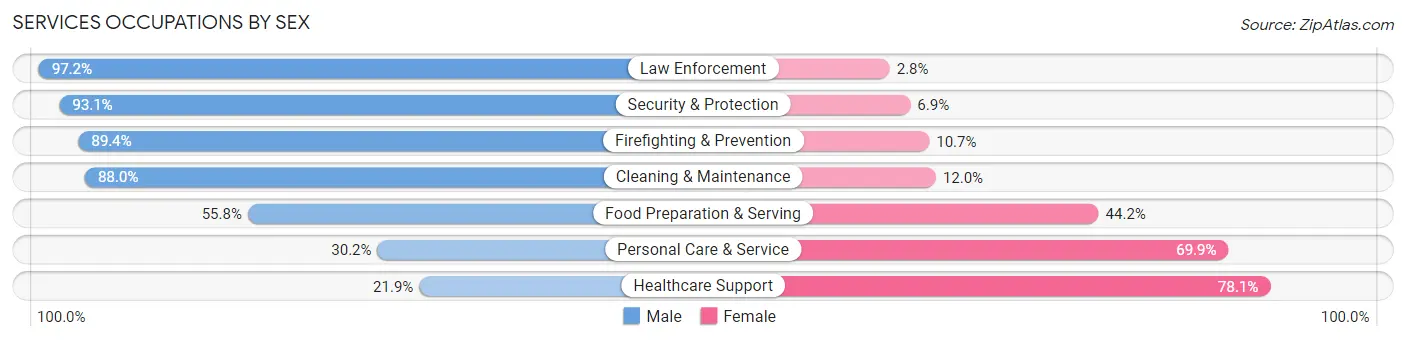
Services Occupations by Sex
Within the Services occupations in Commack, the most male-oriented occupations are Law Enforcement (97.2%), Security & Protection (93.1%), and Firefighting & Prevention (89.3%), while the most female-oriented occupations are Healthcare Support (78.1%), Personal Care & Service (69.9%), and Food Preparation & Serving (44.2%).
| Occupation | Male | Female |
| Healthcare Support | 75 (21.9%) | 268 (78.1%) |
| Security & Protection | 553 (93.1%) | 41 (6.9%) |
| Firefighting & Prevention | 277 (89.3%) | 33 (10.6%) |
| Law Enforcement | 276 (97.2%) | 8 (2.8%) |
| Food Preparation & Serving | 235 (55.8%) | 186 (44.2%) |
| Cleaning & Maintenance | 184 (88.0%) | 25 (12.0%) |
| Personal Care & Service | 101 (30.1%) | 234 (69.9%) |
| Total (Category) | 1,148 (60.4%) | 754 (39.6%) |
| Total (Overall) | 9,777 (52.0%) | 9,026 (48.0%) |
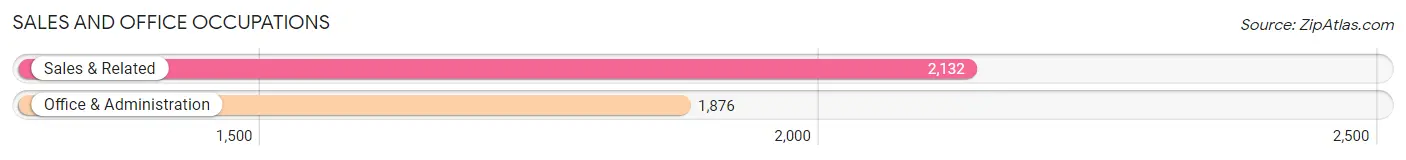
Sales and Office Occupations
The most common Sales and Office occupations in Commack are Sales & Related (2,132 | 11.3%), and Office & Administration (1,876 | 10.0%).
Sales and Office Occupations by Sex
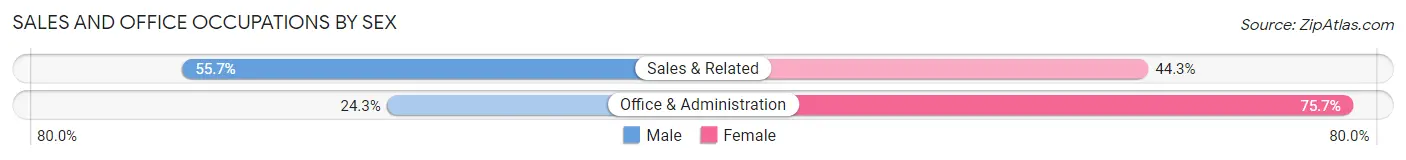
| Occupation | Male | Female |
| Sales & Related | 1,188 (55.7%) | 944 (44.3%) |
| Office & Administration | 456 (24.3%) | 1,420 (75.7%) |
| Total (Category) | 1,644 (41.0%) | 2,364 (59.0%) |
| Total (Overall) | 9,777 (52.0%) | 9,026 (48.0%) |
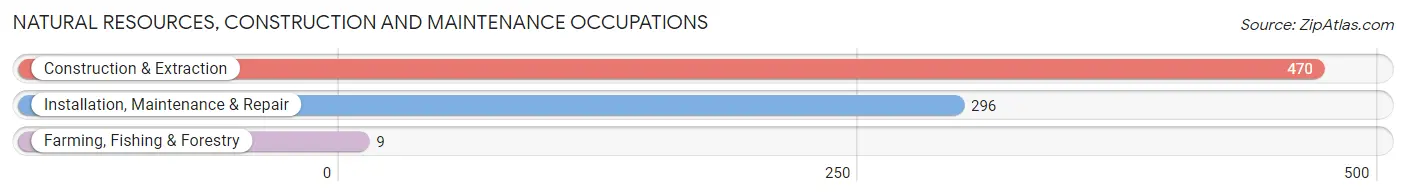
Natural Resources, Construction and Maintenance Occupations
The most common Natural Resources, Construction and Maintenance occupations in Commack are Construction & Extraction (470 | 2.5%), Installation, Maintenance & Repair (296 | 1.6%), and Farming, Fishing & Forestry (9 | 0.1%).
Natural Resources, Construction and Maintenance Occupations by Sex
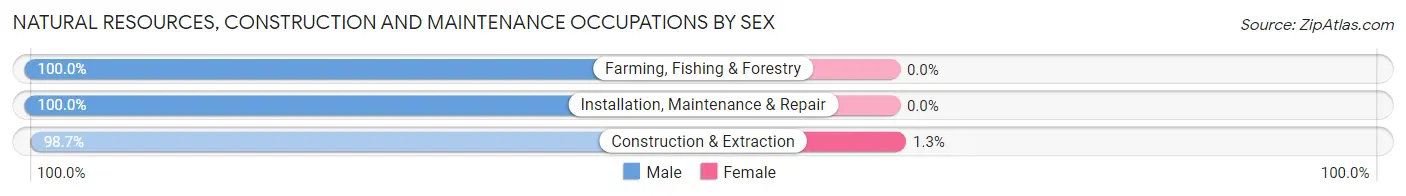
| Occupation | Male | Female |
| Farming, Fishing & Forestry | 9 (100.0%) | 0 (0.0%) |
| Construction & Extraction | 464 (98.7%) | 6 (1.3%) |
| Installation, Maintenance & Repair | 296 (100.0%) | 0 (0.0%) |
| Total (Category) | 769 (99.2%) | 6 (0.8%) |
| Total (Overall) | 9,777 (52.0%) | 9,026 (48.0%) |
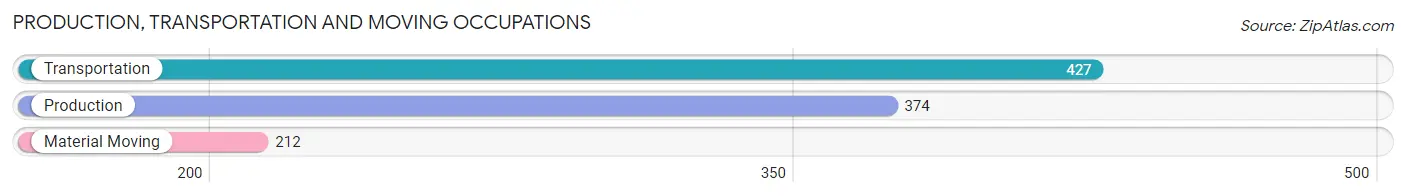
Production, Transportation and Moving Occupations
The most common Production, Transportation and Moving occupations in Commack are Transportation (427 | 2.3%), Production (374 | 2.0%), and Material Moving (212 | 1.1%).
Production, Transportation and Moving Occupations by Sex
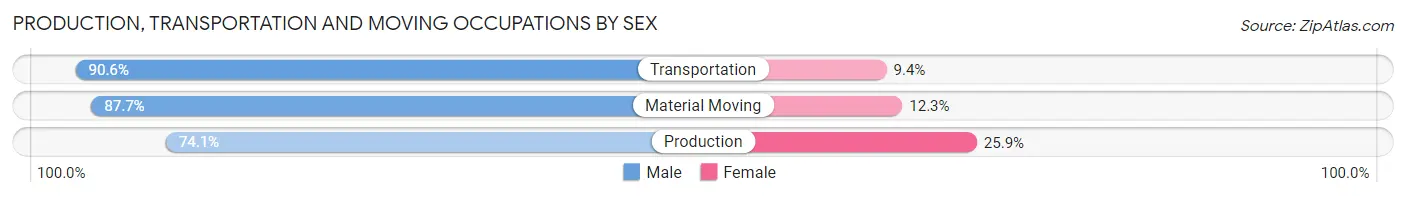
| Occupation | Male | Female |
| Production | 277 (74.1%) | 97 (25.9%) |
| Transportation | 387 (90.6%) | 40 (9.4%) |
| Material Moving | 186 (87.7%) | 26 (12.3%) |
| Total (Category) | 850 (83.9%) | 163 (16.1%) |
| Total (Overall) | 9,777 (52.0%) | 9,026 (48.0%) |
Employment Industries by Sex in Commack
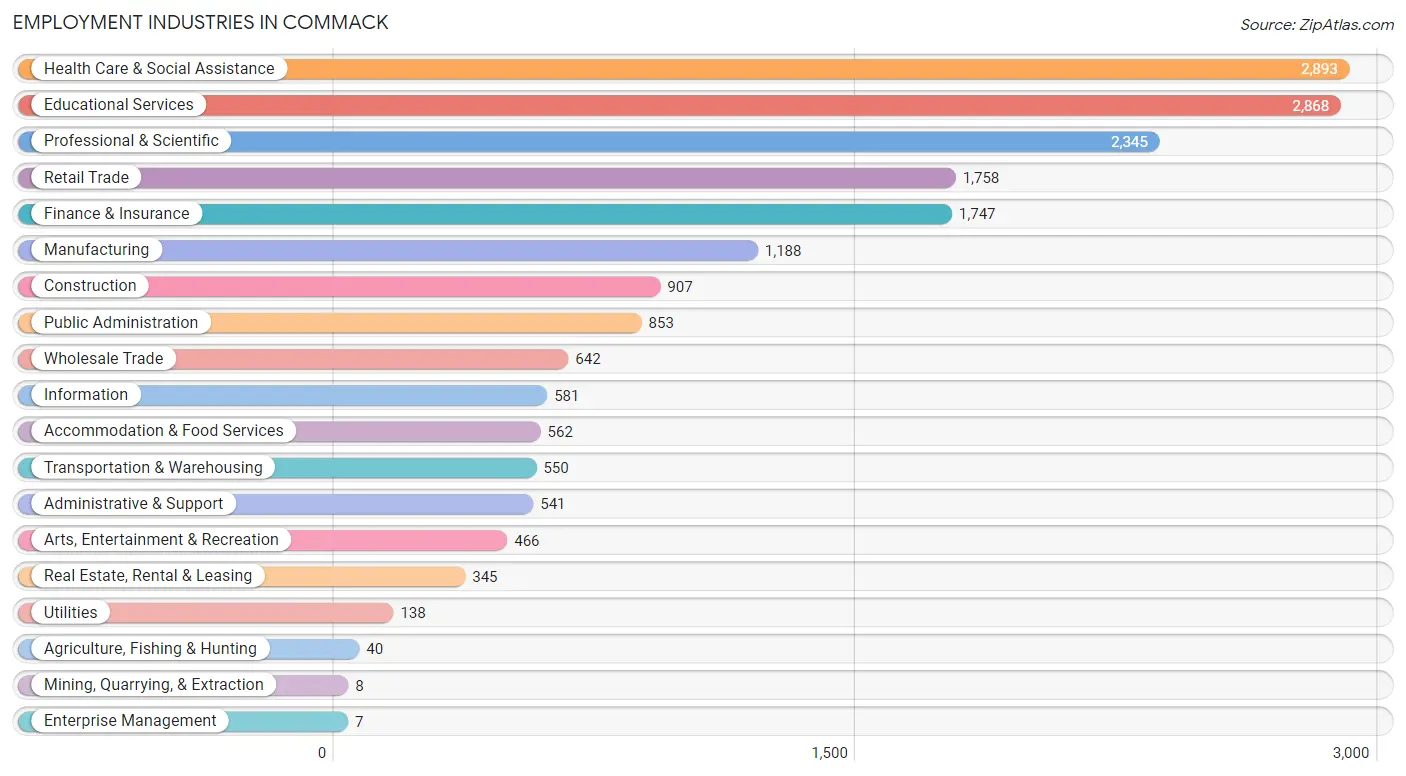
Employment Industries in Commack
The major employment industries in Commack include Health Care & Social Assistance (2,893 | 15.4%), Educational Services (2,868 | 15.2%), Professional & Scientific (2,345 | 12.5%), Retail Trade (1,758 | 9.3%), and Finance & Insurance (1,747 | 9.3%).
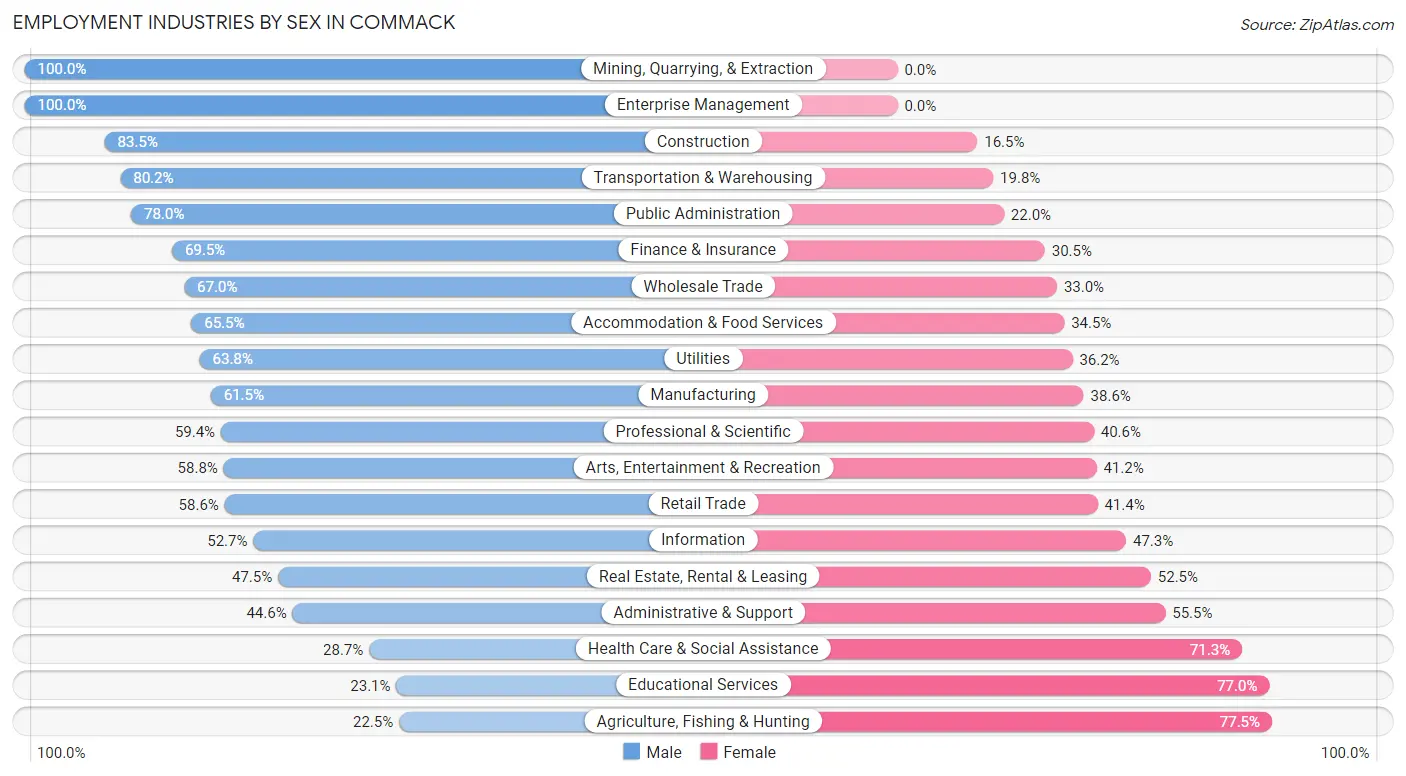
Employment Industries by Sex in Commack
The Commack industries that see more men than women are Mining, Quarrying, & Extraction (100.0%), Enterprise Management (100.0%), and Construction (83.5%), whereas the industries that tend to have a higher number of women are Agriculture, Fishing & Hunting (77.5%), Educational Services (76.9%), and Health Care & Social Assistance (71.3%).
| Industry | Male | Female |
| Agriculture, Fishing & Hunting | 9 (22.5%) | 31 (77.5%) |
| Mining, Quarrying, & Extraction | 8 (100.0%) | 0 (0.0%) |
| Construction | 757 (83.5%) | 150 (16.5%) |
| Manufacturing | 730 (61.5%) | 458 (38.6%) |
| Wholesale Trade | 430 (67.0%) | 212 (33.0%) |
| Retail Trade | 1,030 (58.6%) | 728 (41.4%) |
| Transportation & Warehousing | 441 (80.2%) | 109 (19.8%) |
| Utilities | 88 (63.8%) | 50 (36.2%) |
| Information | 306 (52.7%) | 275 (47.3%) |
| Finance & Insurance | 1,214 (69.5%) | 533 (30.5%) |
| Real Estate, Rental & Leasing | 164 (47.5%) | 181 (52.5%) |
| Professional & Scientific | 1,392 (59.4%) | 953 (40.6%) |
| Enterprise Management | 7 (100.0%) | 0 (0.0%) |
| Administrative & Support | 241 (44.6%) | 300 (55.4%) |
| Educational Services | 661 (23.1%) | 2,207 (76.9%) |
| Health Care & Social Assistance | 830 (28.7%) | 2,063 (71.3%) |
| Arts, Entertainment & Recreation | 274 (58.8%) | 192 (41.2%) |
| Accommodation & Food Services | 368 (65.5%) | 194 (34.5%) |
| Public Administration | 665 (78.0%) | 188 (22.0%) |
| Total | 9,777 (52.0%) | 9,026 (48.0%) |
Education in Commack
School Enrollment in Commack
The most common levels of schooling among the 9,398 students in Commack are high school (2,433 | 25.9%), college / undergraduate (1,926 | 20.5%), and middle school (1,764 | 18.8%).
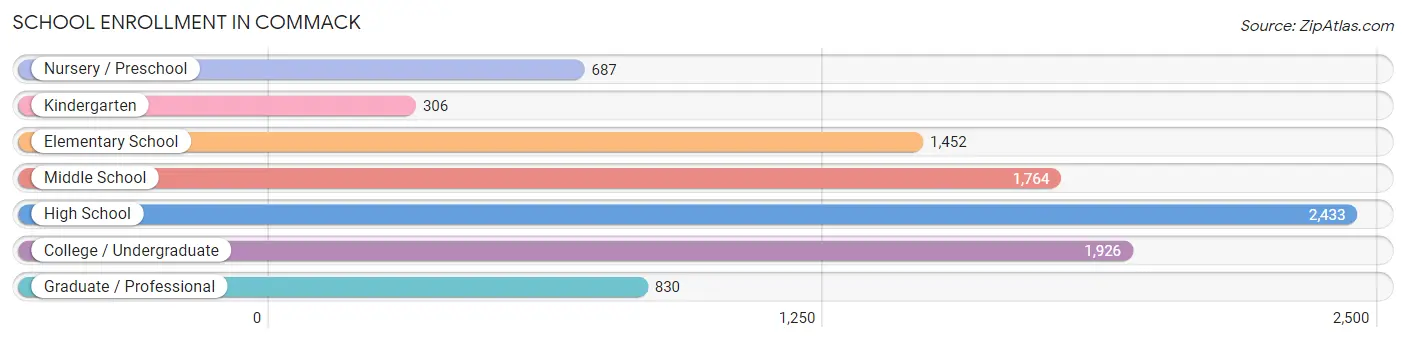
| School Level | # Students | % Students |
| Nursery / Preschool | 687 | 7.3% |
| Kindergarten | 306 | 3.3% |
| Elementary School | 1,452 | 15.4% |
| Middle School | 1,764 | 18.8% |
| High School | 2,433 | 25.9% |
| College / Undergraduate | 1,926 | 20.5% |
| Graduate / Professional | 830 | 8.8% |
| Total | 9,398 | 100.0% |
School Enrollment by Age by Funding Source in Commack
Out of a total of 9,398 students who are enrolled in schools in Commack, 1,504 (16.0%) attend a private institution, while the remaining 7,894 (84.0%) are enrolled in public schools. The age group of 3 to 4 year olds has the highest likelihood of being enrolled in private schools, with 364 (56.7% in the age bracket) enrolled. Conversely, the age group of 10 to 14 year olds has the lowest likelihood of being enrolled in a private school, with 2,366 (98.0% in the age bracket) attending a public institution.
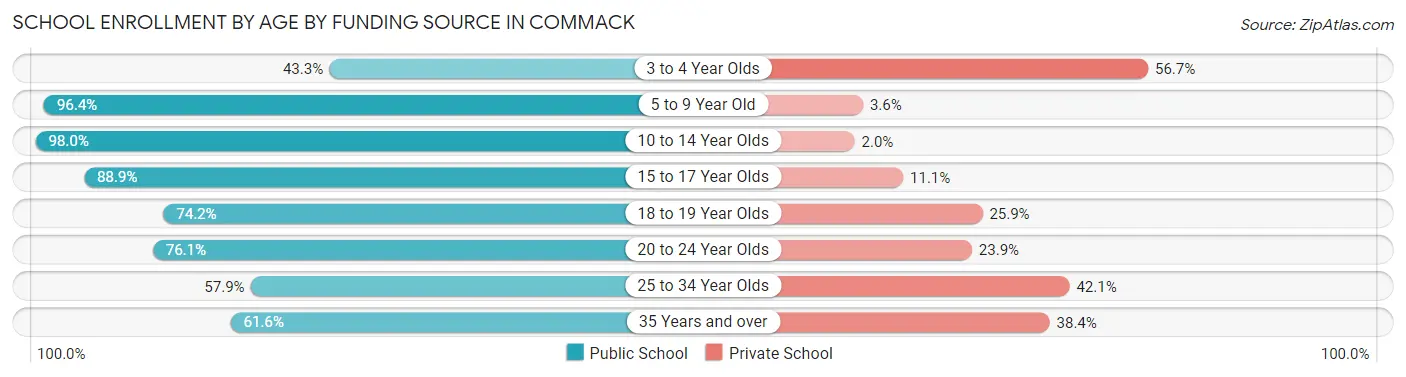
| Age Bracket | Public School | Private School |
| 3 to 4 Year Olds | 278 (43.3%) | 364 (56.7%) |
| 5 to 9 Year Old | 1,633 (96.4%) | 61 (3.6%) |
| 10 to 14 Year Olds | 2,366 (98.0%) | 49 (2.0%) |
| 15 to 17 Year Olds | 1,527 (88.9%) | 190 (11.1%) |
| 18 to 19 Year Olds | 631 (74.2%) | 220 (25.9%) |
| 20 to 24 Year Olds | 1,010 (76.1%) | 317 (23.9%) |
| 25 to 34 Year Olds | 259 (57.9%) | 188 (42.1%) |
| 35 Years and over | 188 (61.6%) | 117 (38.4%) |
| Total | 7,894 (84.0%) | 1,504 (16.0%) |
Educational Attainment by Field of Study in Commack
Business (3,201 | 21.1%), education (2,343 | 15.4%), science & technology (1,461 | 9.6%), social sciences (1,162 | 7.7%), and engineering (1,026 | 6.8%) are the most common fields of study among 15,163 individuals in Commack who have obtained a bachelor's degree or higher.
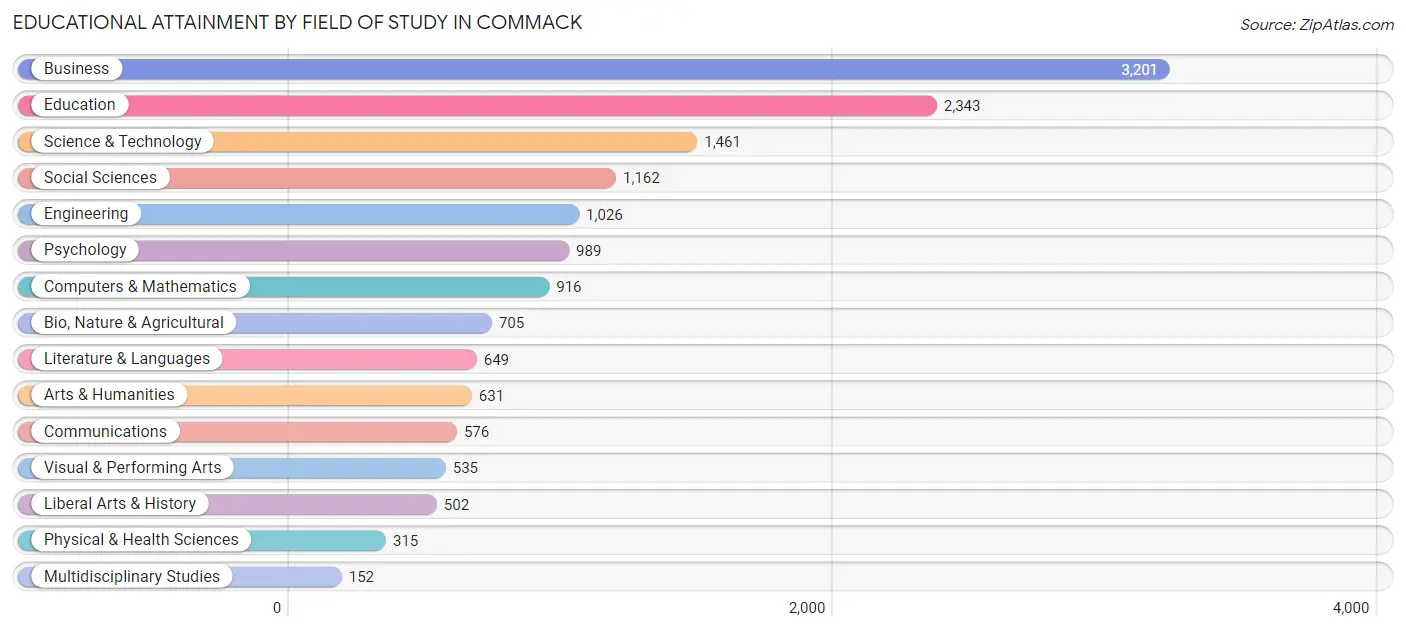
| Field of Study | # Graduates | % Graduates |
| Computers & Mathematics | 916 | 6.0% |
| Bio, Nature & Agricultural | 705 | 4.6% |
| Physical & Health Sciences | 315 | 2.1% |
| Psychology | 989 | 6.5% |
| Social Sciences | 1,162 | 7.7% |
| Engineering | 1,026 | 6.8% |
| Multidisciplinary Studies | 152 | 1.0% |
| Science & Technology | 1,461 | 9.6% |
| Business | 3,201 | 21.1% |
| Education | 2,343 | 15.4% |
| Literature & Languages | 649 | 4.3% |
| Liberal Arts & History | 502 | 3.3% |
| Visual & Performing Arts | 535 | 3.5% |
| Communications | 576 | 3.8% |
| Arts & Humanities | 631 | 4.2% |
| Total | 15,163 | 100.0% |
Transportation & Commute in Commack
Vehicle Availability by Sex in Commack
The most prevalent vehicle ownership categories in Commack are males with 2 vehicles (3,863, accounting for 40.4%) and females with 2 vehicles (3,676, making up 43.9%).
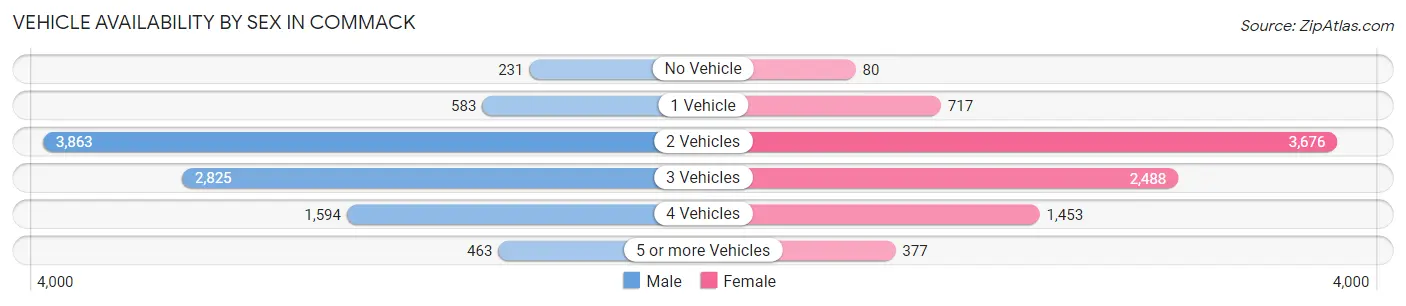
| Vehicles Available | Male | Female |
| No Vehicle | 231 (2.4%) | 80 (0.9%) |
| 1 Vehicle | 583 (6.1%) | 717 (8.2%) |
| 2 Vehicles | 3,863 (40.4%) | 3,676 (41.8%) |
| 3 Vehicles | 2,825 (29.5%) | 2,488 (28.3%) |
| 4 Vehicles | 1,594 (16.7%) | 1,453 (16.5%) |
| 5 or more Vehicles | 463 (4.8%) | 377 (4.3%) |
| Total | 9,559 (100.0%) | 8,791 (100.0%) |
Commute Time in Commack
The most frequently occuring commute durations in Commack are 30 to 34 minutes (2,256 commuters, 14.3%), 20 to 24 minutes (1,949 commuters, 12.3%), and 15 to 19 minutes (1,758 commuters, 11.1%).
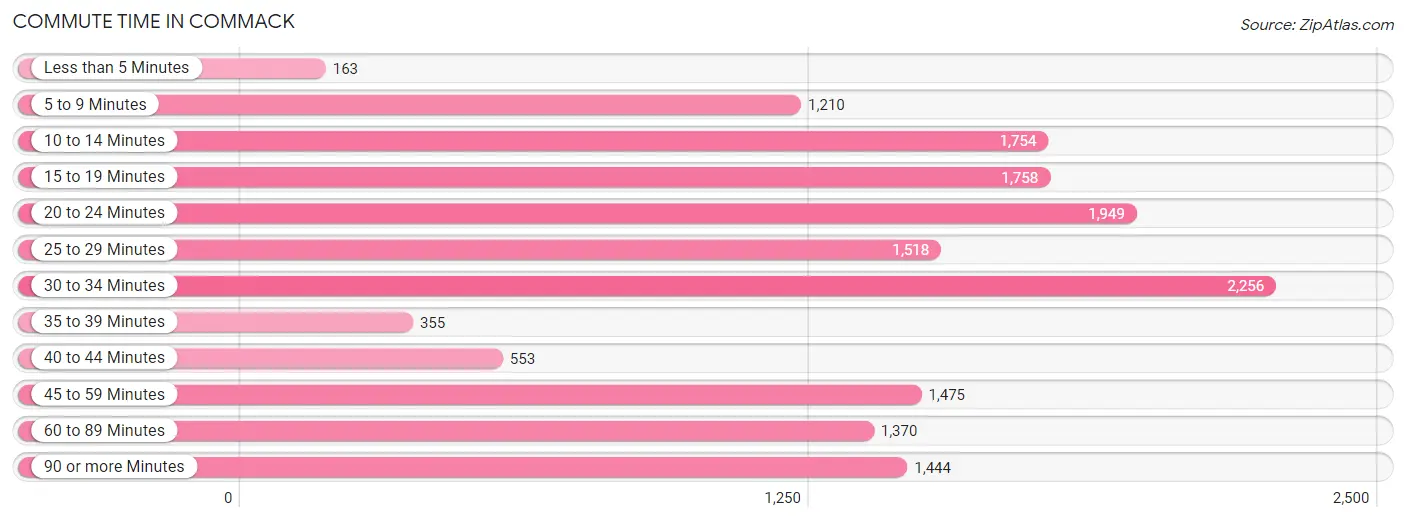
| Commute Time | # Commuters | % Commuters |
| Less than 5 Minutes | 163 | 1.0% |
| 5 to 9 Minutes | 1,210 | 7.7% |
| 10 to 14 Minutes | 1,754 | 11.1% |
| 15 to 19 Minutes | 1,758 | 11.1% |
| 20 to 24 Minutes | 1,949 | 12.3% |
| 25 to 29 Minutes | 1,518 | 9.6% |
| 30 to 34 Minutes | 2,256 | 14.3% |
| 35 to 39 Minutes | 355 | 2.2% |
| 40 to 44 Minutes | 553 | 3.5% |
| 45 to 59 Minutes | 1,475 | 9.3% |
| 60 to 89 Minutes | 1,370 | 8.7% |
| 90 or more Minutes | 1,444 | 9.1% |
Commute Time by Sex in Commack
The most common commute times in Commack are 30 to 34 minutes (1,313 commuters, 15.9%) for males and 15 to 19 minutes (1,052 commuters, 13.9%) for females.
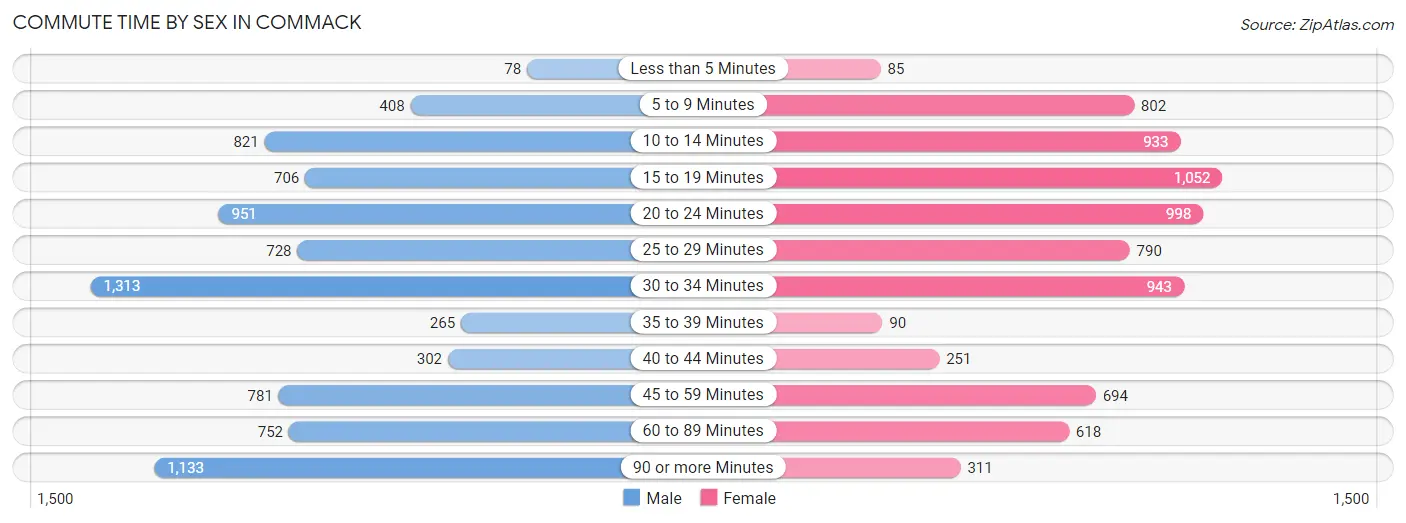
| Commute Time | Male | Female |
| Less than 5 Minutes | 78 (0.9%) | 85 (1.1%) |
| 5 to 9 Minutes | 408 (5.0%) | 802 (10.6%) |
| 10 to 14 Minutes | 821 (10.0%) | 933 (12.3%) |
| 15 to 19 Minutes | 706 (8.6%) | 1,052 (13.9%) |
| 20 to 24 Minutes | 951 (11.5%) | 998 (13.2%) |
| 25 to 29 Minutes | 728 (8.8%) | 790 (10.4%) |
| 30 to 34 Minutes | 1,313 (15.9%) | 943 (12.5%) |
| 35 to 39 Minutes | 265 (3.2%) | 90 (1.2%) |
| 40 to 44 Minutes | 302 (3.7%) | 251 (3.3%) |
| 45 to 59 Minutes | 781 (9.5%) | 694 (9.2%) |
| 60 to 89 Minutes | 752 (9.1%) | 618 (8.2%) |
| 90 or more Minutes | 1,133 (13.8%) | 311 (4.1%) |
Time of Departure to Work by Sex in Commack
The most frequent times of departure to work in Commack are 8:00 AM to 8:29 AM (1,290, 15.7%) for males and 8:00 AM to 8:29 AM (1,341, 17.7%) for females.
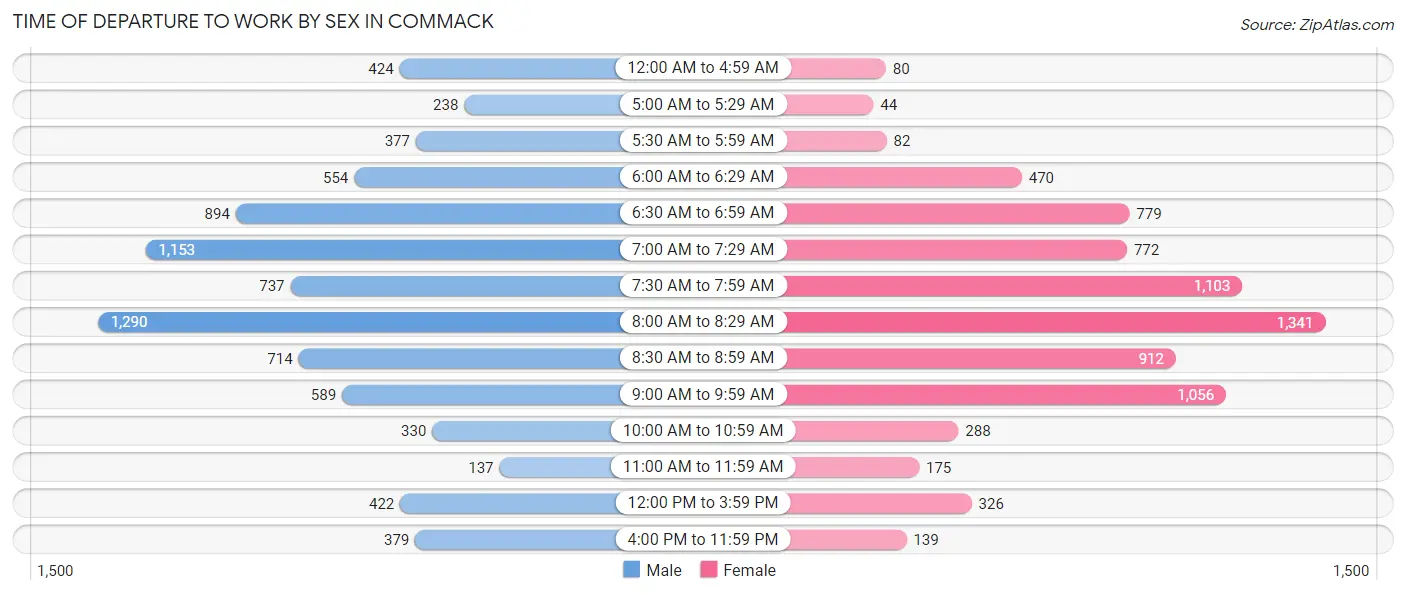
| Time of Departure | Male | Female |
| 12:00 AM to 4:59 AM | 424 (5.1%) | 80 (1.1%) |
| 5:00 AM to 5:29 AM | 238 (2.9%) | 44 (0.6%) |
| 5:30 AM to 5:59 AM | 377 (4.6%) | 82 (1.1%) |
| 6:00 AM to 6:29 AM | 554 (6.7%) | 470 (6.2%) |
| 6:30 AM to 6:59 AM | 894 (10.8%) | 779 (10.3%) |
| 7:00 AM to 7:29 AM | 1,153 (14.0%) | 772 (10.2%) |
| 7:30 AM to 7:59 AM | 737 (8.9%) | 1,103 (14.6%) |
| 8:00 AM to 8:29 AM | 1,290 (15.7%) | 1,341 (17.7%) |
| 8:30 AM to 8:59 AM | 714 (8.7%) | 912 (12.0%) |
| 9:00 AM to 9:59 AM | 589 (7.1%) | 1,056 (14.0%) |
| 10:00 AM to 10:59 AM | 330 (4.0%) | 288 (3.8%) |
| 11:00 AM to 11:59 AM | 137 (1.7%) | 175 (2.3%) |
| 12:00 PM to 3:59 PM | 422 (5.1%) | 326 (4.3%) |
| 4:00 PM to 11:59 PM | 379 (4.6%) | 139 (1.8%) |
| Total | 8,238 (100.0%) | 7,567 (100.0%) |
Housing Occupancy in Commack
Occupancy by Ownership in Commack
Of the total 11,430 dwellings in Commack, owner-occupied units account for 10,615 (92.9%), while renter-occupied units make up 815 (7.1%).
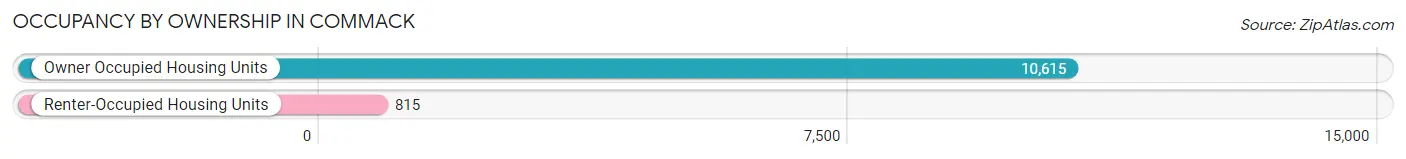
| Occupancy | # Housing Units | % Housing Units |
| Owner Occupied Housing Units | 10,615 | 92.9% |
| Renter-Occupied Housing Units | 815 | 7.1% |
| Total Occupied Housing Units | 11,430 | 100.0% |
Occupancy by Household Size in Commack
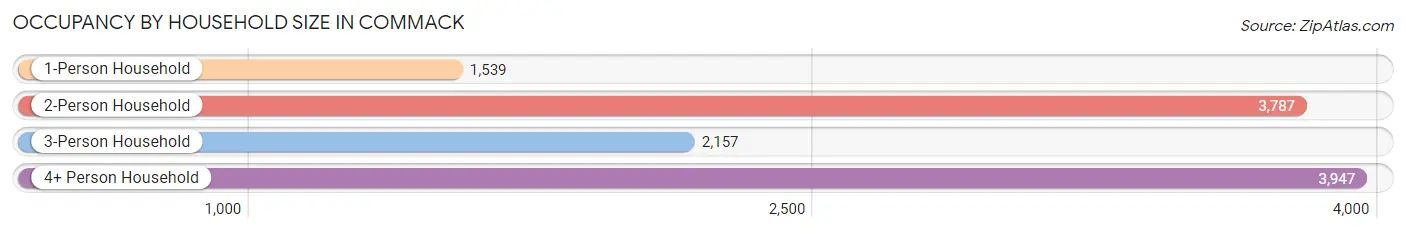
| Household Size | # Housing Units | % Housing Units |
| 1-Person Household | 1,539 | 13.5% |
| 2-Person Household | 3,787 | 33.1% |
| 3-Person Household | 2,157 | 18.9% |
| 4+ Person Household | 3,947 | 34.5% |
| Total Housing Units | 11,430 | 100.0% |
Occupancy by Ownership by Household Size in Commack
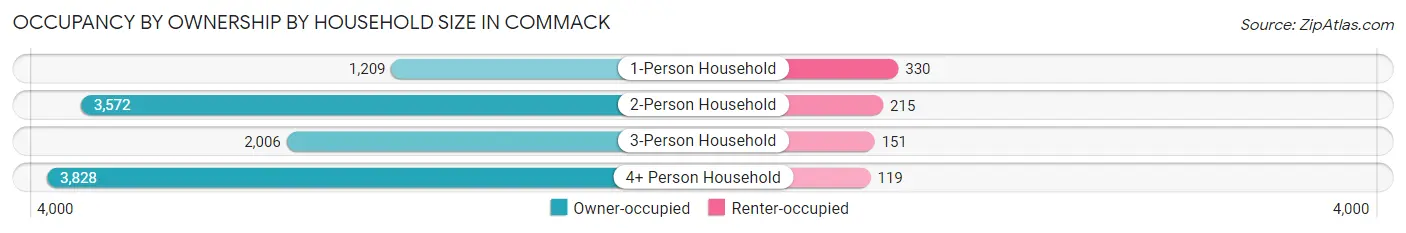
| Household Size | Owner-occupied | Renter-occupied |
| 1-Person Household | 1,209 (78.6%) | 330 (21.4%) |
| 2-Person Household | 3,572 (94.3%) | 215 (5.7%) |
| 3-Person Household | 2,006 (93.0%) | 151 (7.0%) |
| 4+ Person Household | 3,828 (97.0%) | 119 (3.0%) |
| Total Housing Units | 10,615 (92.9%) | 815 (7.1%) |
Occupancy by Educational Attainment in Commack
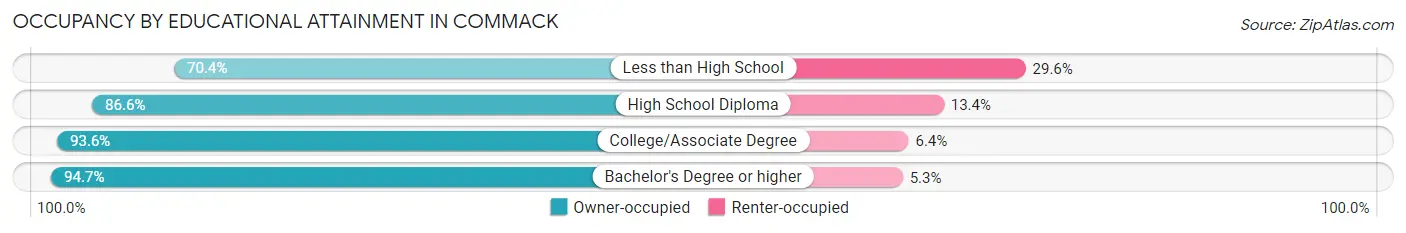
| Household Size | Owner-occupied | Renter-occupied |
| Less than High School | 171 (70.4%) | 72 (29.6%) |
| High School Diploma | 1,318 (86.6%) | 204 (13.4%) |
| College/Associate Degree | 2,478 (93.6%) | 170 (6.4%) |
| Bachelor's Degree or higher | 6,648 (94.7%) | 369 (5.3%) |
Occupancy by Age of Householder in Commack
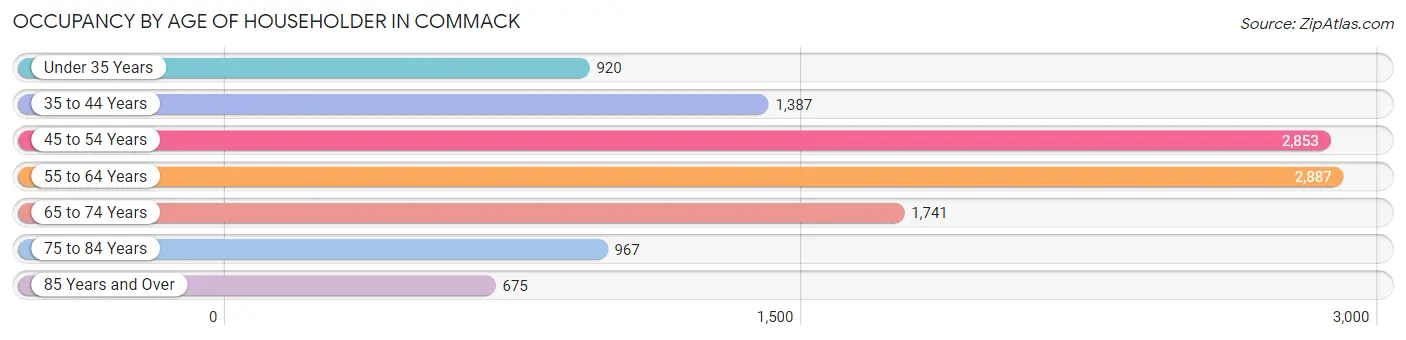
| Age Bracket | # Households | % Households |
| Under 35 Years | 920 | 8.1% |
| 35 to 44 Years | 1,387 | 12.1% |
| 45 to 54 Years | 2,853 | 25.0% |
| 55 to 64 Years | 2,887 | 25.3% |
| 65 to 74 Years | 1,741 | 15.2% |
| 75 to 84 Years | 967 | 8.5% |
| 85 Years and Over | 675 | 5.9% |
| Total | 11,430 | 100.0% |
Housing Finances in Commack
Median Income by Occupancy in Commack
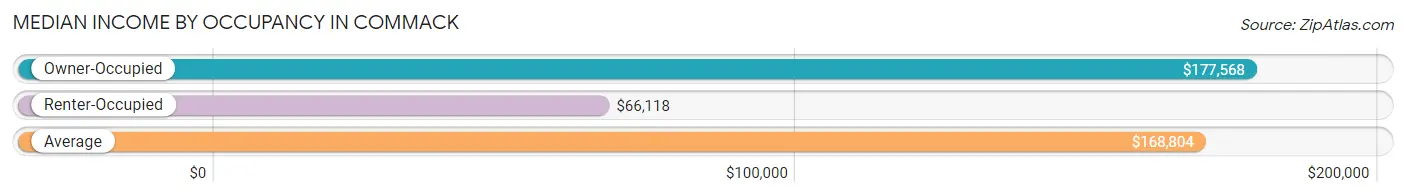
| Occupancy Type | # Households | Median Income |
| Owner-Occupied | 10,615 (92.9%) | $177,568 |
| Renter-Occupied | 815 (7.1%) | $66,118 |
| Average | 11,430 (100.0%) | $168,804 |
Occupancy by Householder Income Bracket in Commack
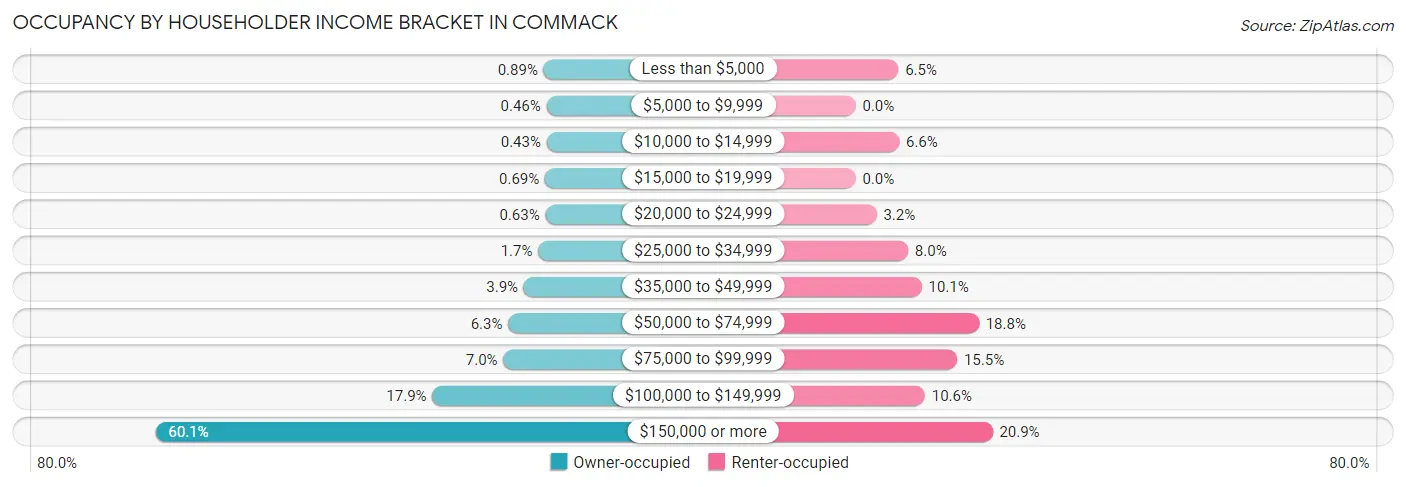
| Income Bracket | Owner-occupied | Renter-occupied |
| Less than $5,000 | 95 (0.9%) | 53 (6.5%) |
| $5,000 to $9,999 | 49 (0.5%) | 0 (0.0%) |
| $10,000 to $14,999 | 46 (0.4%) | 54 (6.6%) |
| $15,000 to $19,999 | 73 (0.7%) | 0 (0.0%) |
| $20,000 to $24,999 | 67 (0.6%) | 26 (3.2%) |
| $25,000 to $34,999 | 183 (1.7%) | 65 (8.0%) |
| $35,000 to $49,999 | 415 (3.9%) | 82 (10.1%) |
| $50,000 to $74,999 | 669 (6.3%) | 153 (18.8%) |
| $75,000 to $99,999 | 746 (7.0%) | 126 (15.5%) |
| $100,000 to $149,999 | 1,896 (17.9%) | 86 (10.5%) |
| $150,000 or more | 6,376 (60.1%) | 170 (20.9%) |
| Total | 10,615 (100.0%) | 815 (100.0%) |
Monthly Housing Cost Tiers in Commack
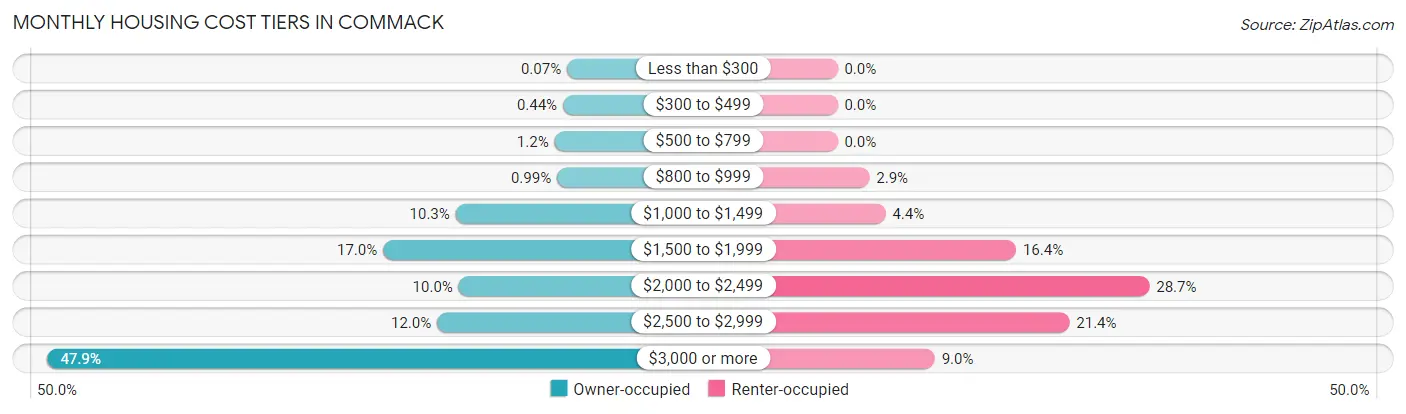
| Monthly Cost | Owner-occupied | Renter-occupied |
| Less than $300 | 7 (0.1%) | 0 (0.0%) |
| $300 to $499 | 47 (0.4%) | 0 (0.0%) |
| $500 to $799 | 129 (1.2%) | 0 (0.0%) |
| $800 to $999 | 105 (1.0%) | 24 (2.9%) |
| $1,000 to $1,499 | 1,095 (10.3%) | 36 (4.4%) |
| $1,500 to $1,999 | 1,805 (17.0%) | 134 (16.4%) |
| $2,000 to $2,499 | 1,066 (10.0%) | 234 (28.7%) |
| $2,500 to $2,999 | 1,277 (12.0%) | 174 (21.3%) |
| $3,000 or more | 5,084 (47.9%) | 73 (9.0%) |
| Total | 10,615 (100.0%) | 815 (100.0%) |
Physical Housing Characteristics in Commack
Housing Structures in Commack
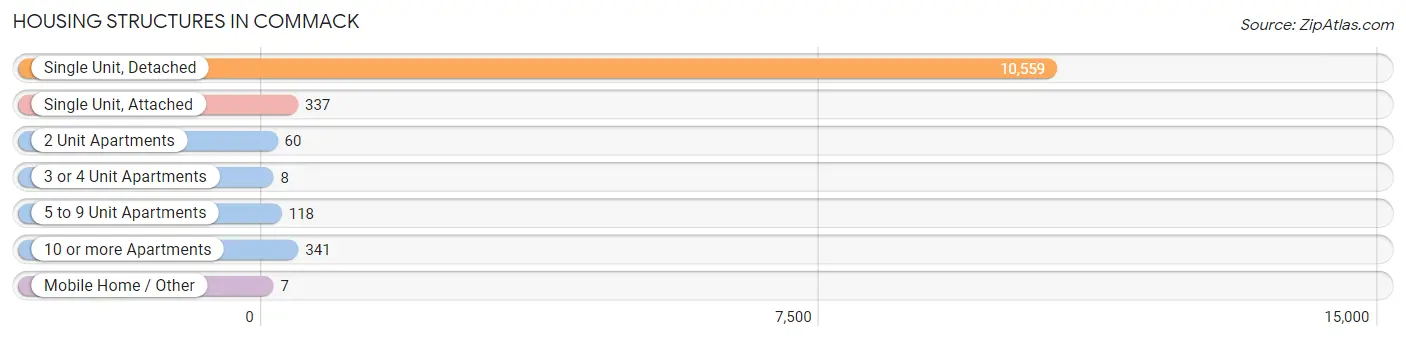
| Structure Type | # Housing Units | % Housing Units |
| Single Unit, Detached | 10,559 | 92.4% |
| Single Unit, Attached | 337 | 2.9% |
| 2 Unit Apartments | 60 | 0.5% |
| 3 or 4 Unit Apartments | 8 | 0.1% |
| 5 to 9 Unit Apartments | 118 | 1.0% |
| 10 or more Apartments | 341 | 3.0% |
| Mobile Home / Other | 7 | 0.1% |
| Total | 11,430 | 100.0% |
Housing Structures by Occupancy in Commack
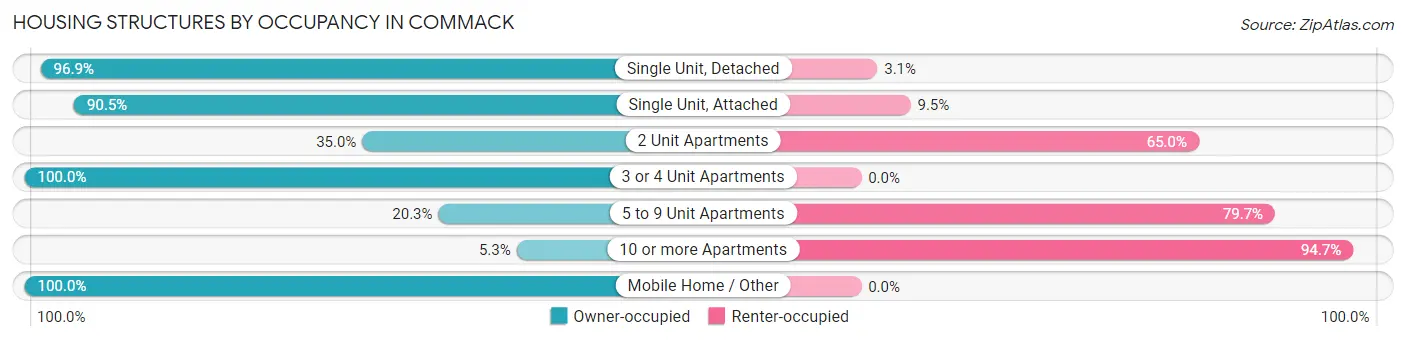
| Structure Type | Owner-occupied | Renter-occupied |
| Single Unit, Detached | 10,232 (96.9%) | 327 (3.1%) |
| Single Unit, Attached | 305 (90.5%) | 32 (9.5%) |
| 2 Unit Apartments | 21 (35.0%) | 39 (65.0%) |
| 3 or 4 Unit Apartments | 8 (100.0%) | 0 (0.0%) |
| 5 to 9 Unit Apartments | 24 (20.3%) | 94 (79.7%) |
| 10 or more Apartments | 18 (5.3%) | 323 (94.7%) |
| Mobile Home / Other | 7 (100.0%) | 0 (0.0%) |
| Total | 10,615 (92.9%) | 815 (7.1%) |
Housing Structures by Number of Rooms in Commack
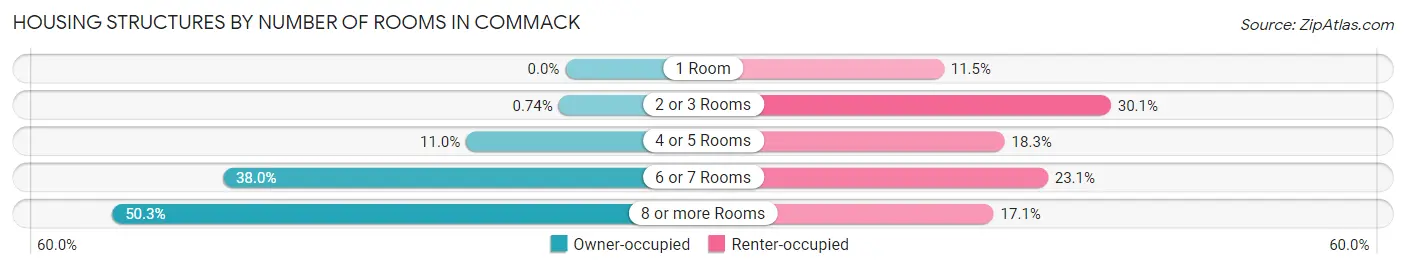
| Number of Rooms | Owner-occupied | Renter-occupied |
| 1 Room | 0 (0.0%) | 94 (11.5%) |
| 2 or 3 Rooms | 79 (0.7%) | 245 (30.1%) |
| 4 or 5 Rooms | 1,168 (11.0%) | 149 (18.3%) |
| 6 or 7 Rooms | 4,032 (38.0%) | 188 (23.1%) |
| 8 or more Rooms | 5,336 (50.3%) | 139 (17.1%) |
| Total | 10,615 (100.0%) | 815 (100.0%) |
Housing Structure by Heating Type in Commack
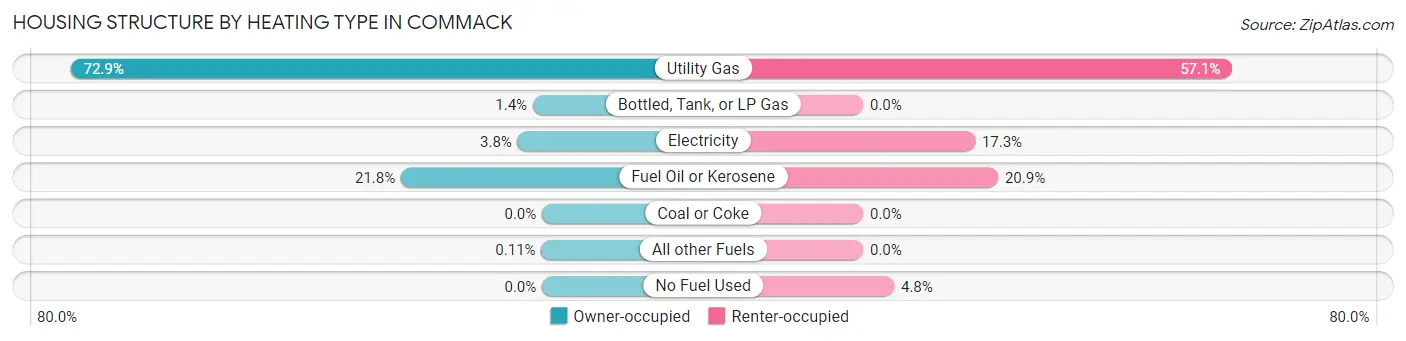
| Heating Type | Owner-occupied | Renter-occupied |
| Utility Gas | 7,737 (72.9%) | 465 (57.1%) |
| Bottled, Tank, or LP Gas | 151 (1.4%) | 0 (0.0%) |
| Electricity | 401 (3.8%) | 141 (17.3%) |
| Fuel Oil or Kerosene | 2,314 (21.8%) | 170 (20.9%) |
| Coal or Coke | 0 (0.0%) | 0 (0.0%) |
| All other Fuels | 12 (0.1%) | 0 (0.0%) |
| No Fuel Used | 0 (0.0%) | 39 (4.8%) |
| Total | 10,615 (100.0%) | 815 (100.0%) |
Household Vehicle Usage in Commack
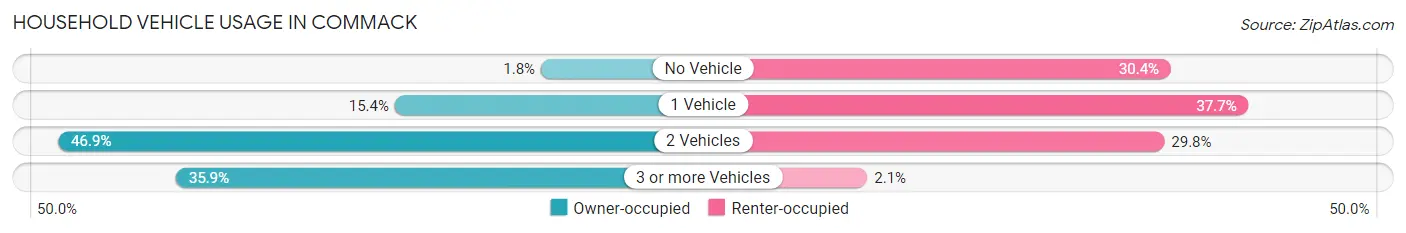
| Vehicles per Household | Owner-occupied | Renter-occupied |
| No Vehicle | 191 (1.8%) | 248 (30.4%) |
| 1 Vehicle | 1,639 (15.4%) | 307 (37.7%) |
| 2 Vehicles | 4,976 (46.9%) | 243 (29.8%) |
| 3 or more Vehicles | 3,809 (35.9%) | 17 (2.1%) |
| Total | 10,615 (100.0%) | 815 (100.0%) |
Real Estate & Mortgages in Commack
Real Estate and Mortgage Overview in Commack
| Characteristic | Without Mortgage | With Mortgage |
| Housing Units | 3,795 | 6,820 |
| Median Property Value | $598,100 | $642,200 |
| Median Household Income | $141,288 | $4,605 |
| Monthly Housing Costs | $1,501 | $5,001 |
| Real Estate Taxes | $10,001 | $19 |
Property Value by Mortgage Status in Commack
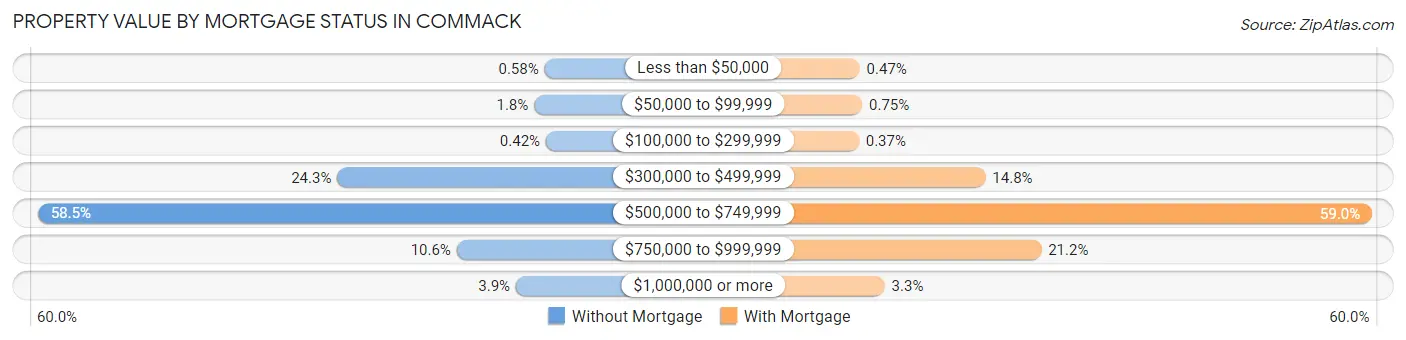
| Property Value | Without Mortgage | With Mortgage |
| Less than $50,000 | 22 (0.6%) | 32 (0.5%) |
| $50,000 to $99,999 | 67 (1.8%) | 51 (0.7%) |
| $100,000 to $299,999 | 16 (0.4%) | 25 (0.4%) |
| $300,000 to $499,999 | 921 (24.3%) | 1,012 (14.8%) |
| $500,000 to $749,999 | 2,220 (58.5%) | 4,026 (59.0%) |
| $750,000 to $999,999 | 403 (10.6%) | 1,447 (21.2%) |
| $1,000,000 or more | 146 (3.8%) | 227 (3.3%) |
| Total | 3,795 (100.0%) | 6,820 (100.0%) |
Household Income by Mortgage Status in Commack
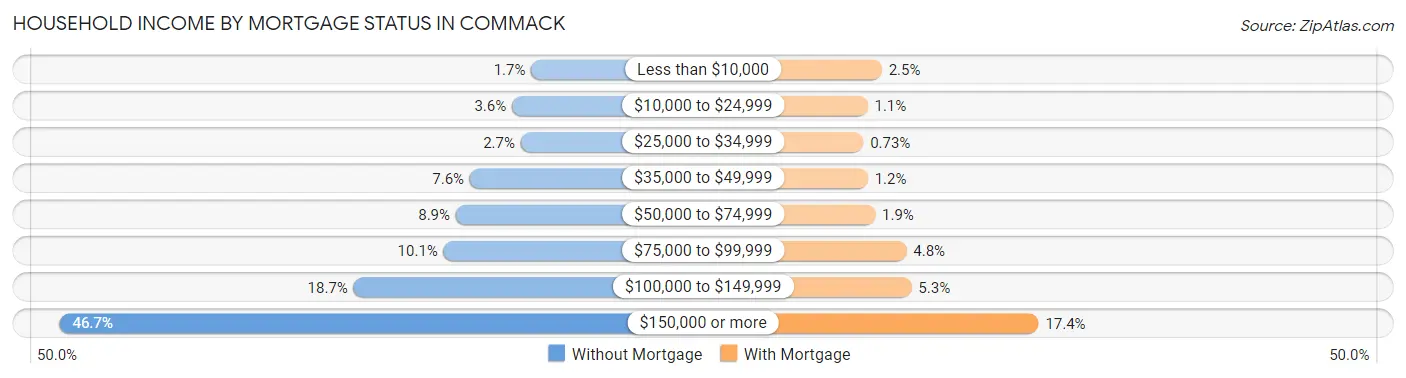
| Household Income | Without Mortgage | With Mortgage |
| Less than $10,000 | 66 (1.7%) | 170 (2.5%) |
| $10,000 to $24,999 | 136 (3.6%) | 78 (1.1%) |
| $25,000 to $34,999 | 104 (2.7%) | 50 (0.7%) |
| $35,000 to $49,999 | 288 (7.6%) | 79 (1.2%) |
| $50,000 to $74,999 | 339 (8.9%) | 127 (1.9%) |
| $75,000 to $99,999 | 383 (10.1%) | 330 (4.8%) |
| $100,000 to $149,999 | 708 (18.7%) | 363 (5.3%) |
| $150,000 or more | 1,771 (46.7%) | 1,188 (17.4%) |
| Total | 3,795 (100.0%) | 6,820 (100.0%) |
Property Value to Household Income Ratio in Commack
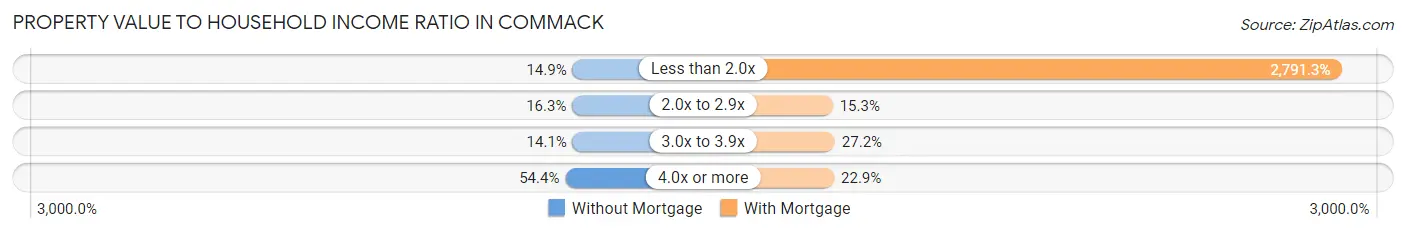
| Value-to-Income Ratio | Without Mortgage | With Mortgage |
| Less than 2.0x | 565 (14.9%) | 190,368 (2,791.3%) |
| 2.0x to 2.9x | 617 (16.3%) | 1,045 (15.3%) |
| 3.0x to 3.9x | 536 (14.1%) | 1,857 (27.2%) |
| 4.0x or more | 2,063 (54.4%) | 1,560 (22.9%) |
| Total | 3,795 (100.0%) | 6,820 (100.0%) |
Real Estate Taxes by Mortgage Status in Commack
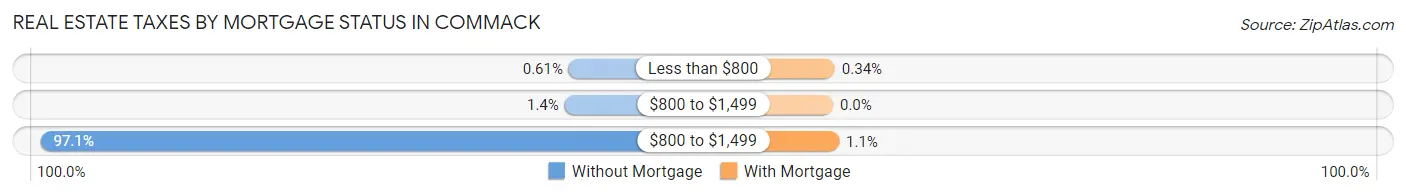
| Property Taxes | Without Mortgage | With Mortgage |
| Less than $800 | 23 (0.6%) | 23 (0.3%) |
| $800 to $1,499 | 52 (1.4%) | 0 (0.0%) |
| $800 to $1,499 | 3,684 (97.1%) | 76 (1.1%) |
| Total | 3,795 (100.0%) | 6,820 (100.0%) |
Health & Disability in Commack
Health Insurance Coverage by Age in Commack
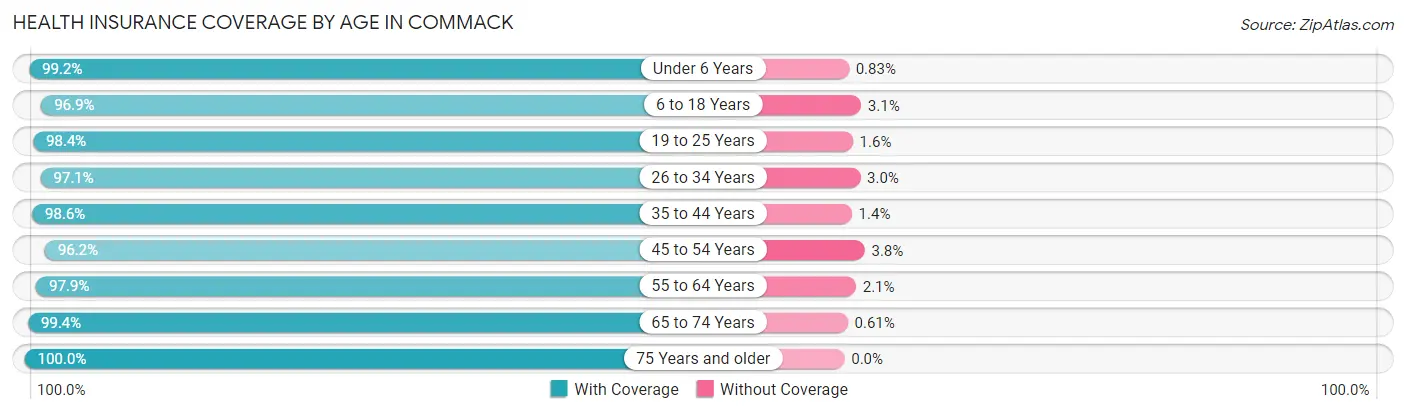
| Age Bracket | With Coverage | Without Coverage |
| Under 6 Years | 2,037 (99.2%) | 17 (0.8%) |
| 6 to 18 Years | 6,090 (96.9%) | 195 (3.1%) |
| 19 to 25 Years | 2,896 (98.4%) | 46 (1.6%) |
| 26 to 34 Years | 3,460 (97.1%) | 105 (2.9%) |
| 35 to 44 Years | 3,374 (98.6%) | 47 (1.4%) |
| 45 to 54 Years | 5,574 (96.2%) | 219 (3.8%) |
| 55 to 64 Years | 5,397 (97.9%) | 118 (2.1%) |
| 65 to 74 Years | 3,071 (99.4%) | 19 (0.6%) |
| 75 Years and older | 2,792 (100.0%) | 0 (0.0%) |
| Total | 34,691 (97.8%) | 766 (2.2%) |
Health Insurance Coverage by Citizenship Status in Commack
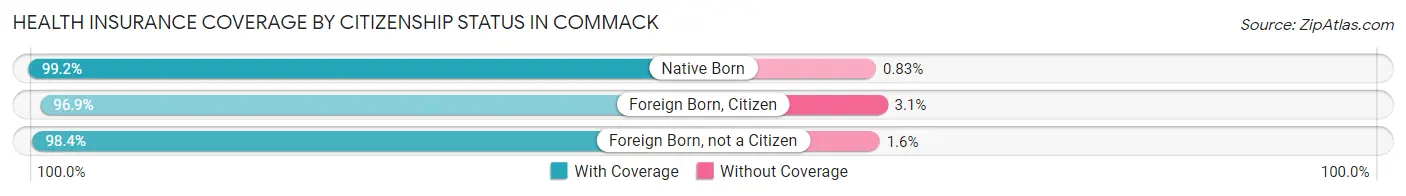
| Citizenship Status | With Coverage | Without Coverage |
| Native Born | 2,037 (99.2%) | 17 (0.8%) |
| Foreign Born, Citizen | 6,090 (96.9%) | 195 (3.1%) |
| Foreign Born, not a Citizen | 2,896 (98.4%) | 46 (1.6%) |
Health Insurance Coverage by Household Income in Commack
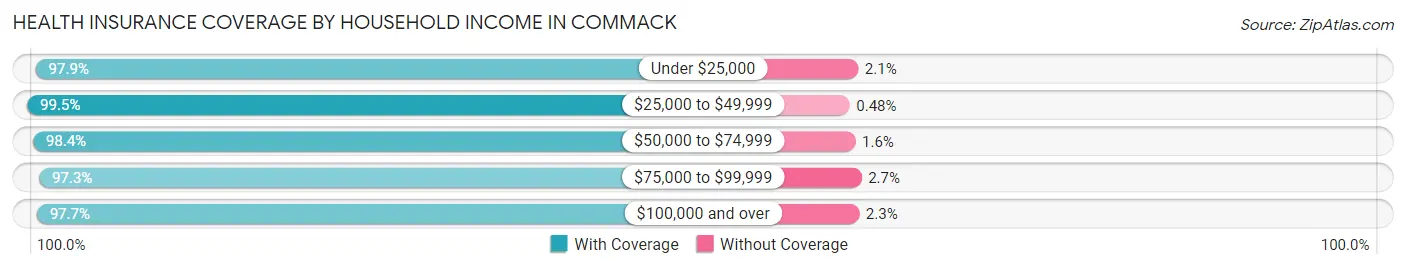
| Household Income | With Coverage | Without Coverage |
| Under $25,000 | 658 (97.9%) | 14 (2.1%) |
| $25,000 to $49,999 | 1,466 (99.5%) | 7 (0.5%) |
| $50,000 to $74,999 | 1,825 (98.4%) | 29 (1.6%) |
| $75,000 to $99,999 | 1,871 (97.3%) | 52 (2.7%) |
| $100,000 and over | 28,612 (97.7%) | 664 (2.3%) |
Public vs Private Health Insurance Coverage by Age in Commack
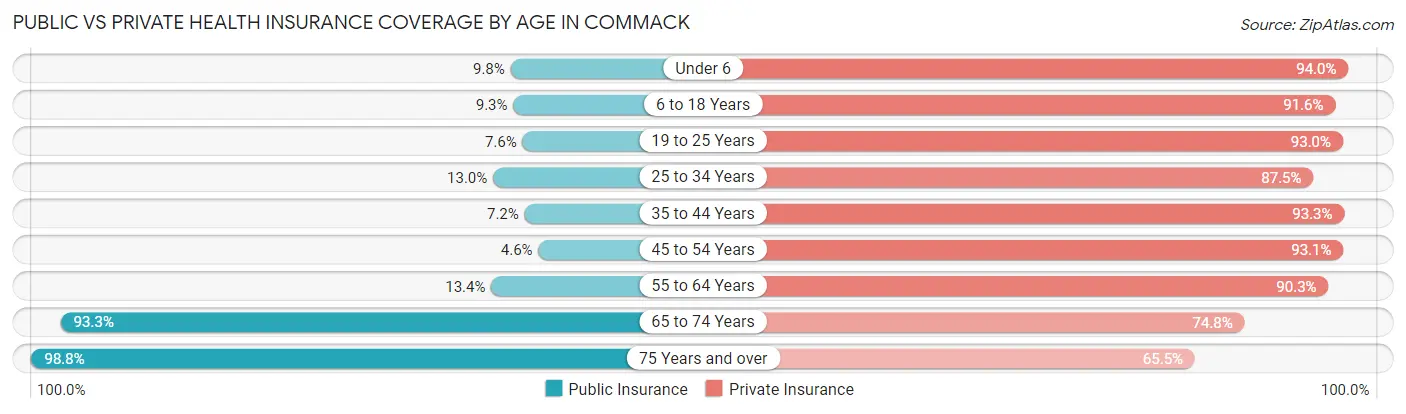
| Age Bracket | Public Insurance | Private Insurance |
| Under 6 | 201 (9.8%) | 1,931 (94.0%) |
| 6 to 18 Years | 583 (9.3%) | 5,757 (91.6%) |
| 19 to 25 Years | 223 (7.6%) | 2,736 (93.0%) |
| 25 to 34 Years | 465 (13.0%) | 3,120 (87.5%) |
| 35 to 44 Years | 246 (7.2%) | 3,191 (93.3%) |
| 45 to 54 Years | 268 (4.6%) | 5,392 (93.1%) |
| 55 to 64 Years | 738 (13.4%) | 4,981 (90.3%) |
| 65 to 74 Years | 2,884 (93.3%) | 2,310 (74.8%) |
| 75 Years and over | 2,757 (98.8%) | 1,830 (65.5%) |
| Total | 8,365 (23.6%) | 31,248 (88.1%) |
Disability Status by Sex by Age in Commack
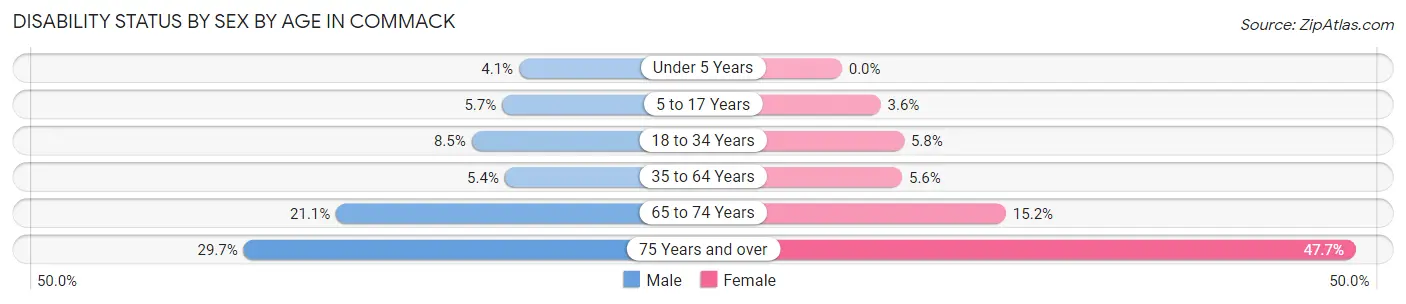
| Age Bracket | Male | Female |
| Under 5 Years | 33 (4.1%) | 0 (0.0%) |
| 5 to 17 Years | 183 (5.7%) | 100 (3.6%) |
| 18 to 34 Years | 322 (8.5%) | 189 (5.8%) |
| 35 to 64 Years | 400 (5.4%) | 412 (5.6%) |
| 65 to 74 Years | 322 (21.1%) | 238 (15.2%) |
| 75 Years and over | 344 (29.7%) | 779 (47.7%) |
Disability Class by Sex by Age in Commack
Disability Class: Hearing Difficulty
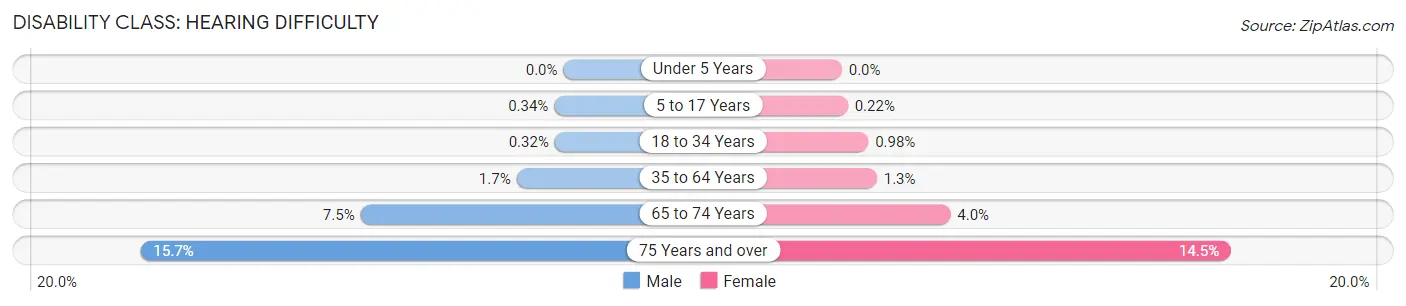
| Age Bracket | Male | Female |
| Under 5 Years | 0 (0.0%) | 0 (0.0%) |
| 5 to 17 Years | 11 (0.3%) | 6 (0.2%) |
| 18 to 34 Years | 12 (0.3%) | 32 (1.0%) |
| 35 to 64 Years | 128 (1.7%) | 96 (1.3%) |
| 65 to 74 Years | 115 (7.5%) | 63 (4.0%) |
| 75 Years and over | 182 (15.7%) | 236 (14.4%) |
Disability Class: Vision Difficulty
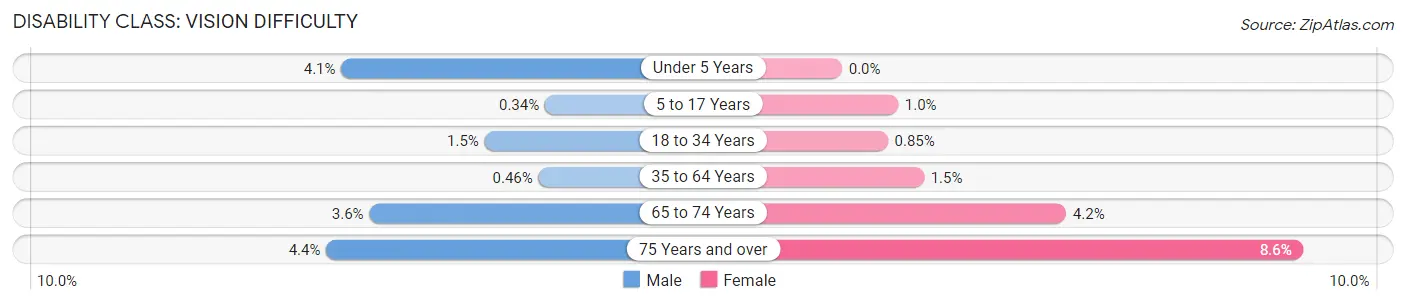
| Age Bracket | Male | Female |
| Under 5 Years | 33 (4.1%) | 0 (0.0%) |
| 5 to 17 Years | 11 (0.3%) | 29 (1.0%) |
| 18 to 34 Years | 55 (1.5%) | 28 (0.9%) |
| 35 to 64 Years | 34 (0.5%) | 112 (1.5%) |
| 65 to 74 Years | 55 (3.6%) | 65 (4.2%) |
| 75 Years and over | 51 (4.4%) | 140 (8.6%) |
Disability Class: Cognitive Difficulty
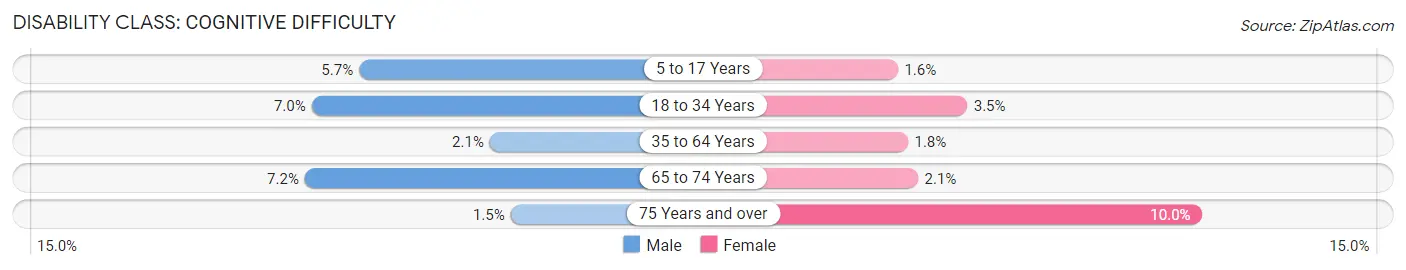
| Age Bracket | Male | Female |
| 5 to 17 Years | 183 (5.7%) | 43 (1.5%) |
| 18 to 34 Years | 265 (7.0%) | 114 (3.5%) |
| 35 to 64 Years | 151 (2.1%) | 135 (1.8%) |
| 65 to 74 Years | 110 (7.2%) | 33 (2.1%) |
| 75 Years and over | 17 (1.5%) | 164 (10.0%) |
Disability Class: Ambulatory Difficulty
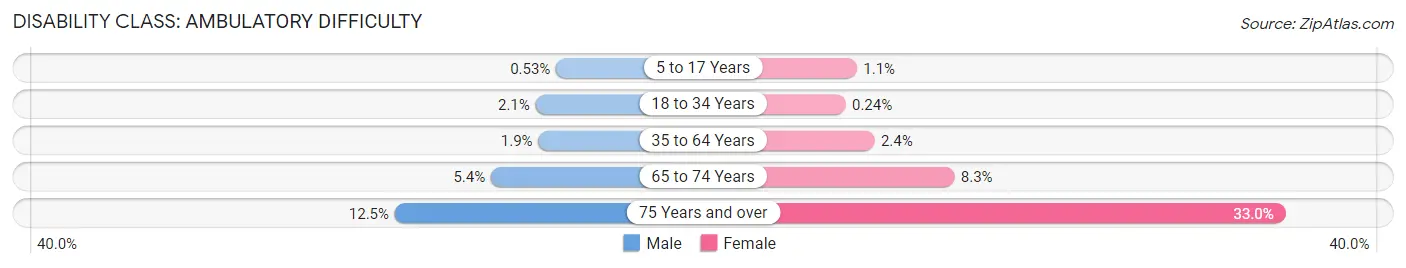
| Age Bracket | Male | Female |
| 5 to 17 Years | 17 (0.5%) | 30 (1.1%) |
| 18 to 34 Years | 78 (2.1%) | 8 (0.2%) |
| 35 to 64 Years | 136 (1.8%) | 176 (2.4%) |
| 65 to 74 Years | 82 (5.4%) | 130 (8.3%) |
| 75 Years and over | 145 (12.5%) | 538 (33.0%) |
Disability Class: Self-Care Difficulty
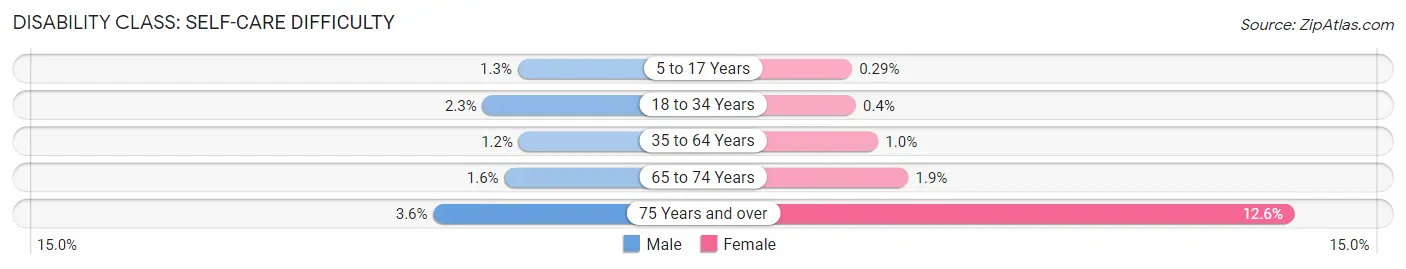
| Age Bracket | Male | Female |
| 5 to 17 Years | 41 (1.3%) | 8 (0.3%) |
| 18 to 34 Years | 85 (2.2%) | 13 (0.4%) |
| 35 to 64 Years | 91 (1.2%) | 75 (1.0%) |
| 65 to 74 Years | 25 (1.6%) | 29 (1.9%) |
| 75 Years and over | 42 (3.6%) | 206 (12.6%) |
Technology Access in Commack
Computing Device Access in Commack
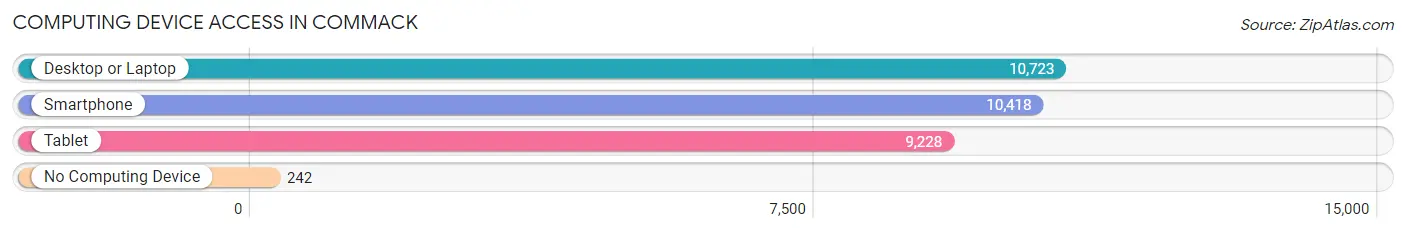
| Device Type | # Households | % Households |
| Desktop or Laptop | 10,723 | 93.8% |
| Smartphone | 10,418 | 91.1% |
| Tablet | 9,228 | 80.7% |
| No Computing Device | 242 | 2.1% |
| Total | 11,430 | 100.0% |
Internet Access in Commack
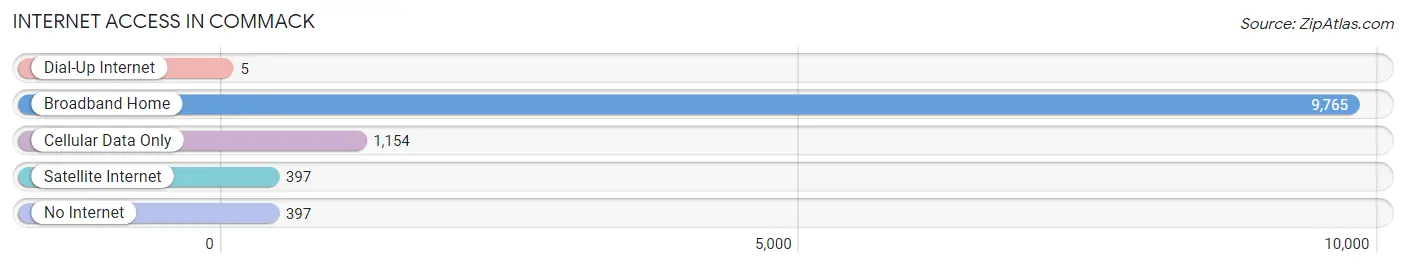
| Internet Type | # Households | % Households |
| Dial-Up Internet | 5 | 0.0% |
| Broadband Home | 9,765 | 85.4% |
| Cellular Data Only | 1,154 | 10.1% |
| Satellite Internet | 397 | 3.5% |
| No Internet | 397 | 3.5% |
| Total | 11,430 | 100.0% |
Commack Summary
Commack, NY is a hamlet located in Suffolk County, New York. It is part of the Town of Huntington and is located on Long Island. The hamlet is situated between the towns of Smithtown and Huntington, and is approximately 40 miles east of New York City.
History
The area that is now Commack was originally inhabited by the Secatogue Indians, a branch of the Algonquin tribe. The Secatogue Indians were a peaceful tribe that lived off the land, hunting and fishing. The first European settlers arrived in the area in the 1650s. The area was originally known as the “Commack Purchase” and was part of the Town of Huntington. The name “Commack” is derived from the Secatogue Indian word “Komak”, which means “place of plenty”.
In the late 1700s, the area was divided into two parts: the “Upper Purchase” and the “Lower Purchase”. The Upper Purchase was located in what is now the hamlet of Commack, while the Lower Purchase was located in what is now the hamlet of East Northport. The two areas were separated by a line that ran from the headwaters of the Nissequogue River to the headwaters of the Connetquot River.
In the early 1800s, the area began to develop as a farming community. The hamlet of Commack was officially established in 1845. The hamlet was named after the Secatogue Indian word “Komak”, which means “place of plenty”.
Geography
Commack is located in Suffolk County, New York. It is part of the Town of Huntington and is located on Long Island. The hamlet is situated between the towns of Smithtown and Huntington, and is approximately 40 miles east of New York City.
The hamlet of Commack is located in the northern part of Suffolk County. It is bordered by the hamlets of Smithtown to the west, East Northport to the east, and Huntington Station to the south. The hamlet is located on the Nissequogue River, which flows through the center of the hamlet.
The hamlet of Commack covers an area of approximately 8.5 square miles. The terrain is mostly flat, with some rolling hills in the northern part of the hamlet. The highest point in the hamlet is located at the intersection of Jericho Turnpike and Commack Road, which is approximately 200 feet above sea level.
Economy
The economy of Commack is largely based on retail and services. The hamlet is home to several large shopping centers, including the Commack Shopping Center, the Commack Plaza Shopping Center, and the Commack Mall. These shopping centers are home to a variety of stores, restaurants, and other businesses.
The hamlet is also home to several corporate headquarters, including the headquarters of the Long Island Power Authority, the Long Island Rail Road, and the Long Island Lighting Company.
Demographics
As of the 2010 census, the population of Commack was 36,124. The population is predominantly white (90.2%), with small percentages of African Americans (3.2%), Asians (3.1%), and Hispanics (2.3%). The median household income in Commack is $107,845, which is significantly higher than the national median of $53,482.
The hamlet of Commack is served by the Commack Union Free School District, which consists of seven elementary schools, two middle schools, and one high school. The hamlet is also home to several private schools, including the St. John the Baptist Diocesan High School and the Commack Christian Academy.
Common Questions
What is Per Capita Income in Commack?
Per Capita income in Commack is $67,118.
What is the Median Family Income in Commack?
Median Family Income in Commack is $183,458.
What is the Median Household income in Commack?
Median Household Income in Commack is $168,804.
What is Income or Wage Gap in Commack?
Income or Wage Gap in Commack is 38.8%.
Women in Commack earn 61.2 cents for every dollar earned by a man.
What is Inequality or Gini Index in Commack?
Inequality or Gini Index in Commack is 0.40.
What is the Total Population of Commack?
Total Population of Commack is 35,770.
What is the Total Male Population of Commack?
Total Male Population of Commack is 17,907.
What is the Total Female Population of Commack?
Total Female Population of Commack is 17,863.
What is the Ratio of Males per 100 Females in Commack?
There are 100.25 Males per 100 Females in Commack.
What is the Ratio of Females per 100 Males in Commack?
There are 99.75 Females per 100 Males in Commack.
What is the Median Population Age in Commack?
Median Population Age in Commack is 44.2 Years.
What is the Average Family Size in Commack
Average Family Size in Commack is 3.4 People.
What is the Average Household Size in Commack
Average Household Size in Commack is 3.1 People.
How Large is the Labor Force in Commack?
There are 19,553 People in the Labor Forcein in Commack.
What is the Percentage of People in the Labor Force in Commack?
67.0% of People are in the Labor Force in Commack.
What is the Unemployment Rate in Commack?
Unemployment Rate in Commack is 3.8%.