Canby, OR Map & Demographics
Canby Map
Canby Overview
$40,861
PER CAPITA INCOME
$102,622
AVG FAMILY INCOME
$91,823
AVG HOUSEHOLD INCOME
34.1%
WAGE / INCOME GAP [ % ]
65.9¢/ $1
WAGE / INCOME GAP [ $ ]
0.43
INEQUALITY / GINI INDEX
18,127
TOTAL POPULATION
8,612
MALE POPULATION
9,515
FEMALE POPULATION
90.51
MALES / 100 FEMALES
110.49
FEMALES / 100 MALES
41.1
MEDIAN AGE
3.1
AVG FAMILY SIZE
2.6
AVG HOUSEHOLD SIZE
9,168
LABOR FORCE [ PEOPLE ]
62.4%
PERCENT IN LABOR FORCE
3.1%
UNEMPLOYMENT RATE
Canby Zip Codes
Canby Area Codes
Income in Canby
Income Overview in Canby
Per Capita Income in Canby is $40,861, while median incomes of families and households are $102,622 and $91,823 respectively.
| Characteristic | Number | Measure |
| Per Capita Income | 18,127 | $40,861 |
| Median Family Income | 4,883 | $102,622 |
| Mean Family Income | 4,883 | $124,822 |
| Median Household Income | 6,836 | $91,823 |
| Mean Household Income | 6,836 | $106,416 |
| Income Deficit | 4,883 | $0 |
| Wage / Income Gap (%) | 18,127 | 34.13% |
| Wage / Income Gap ($) | 18,127 | 65.87¢ per $1 |
| Gini / Inequality Index | 18,127 | 0.43 |
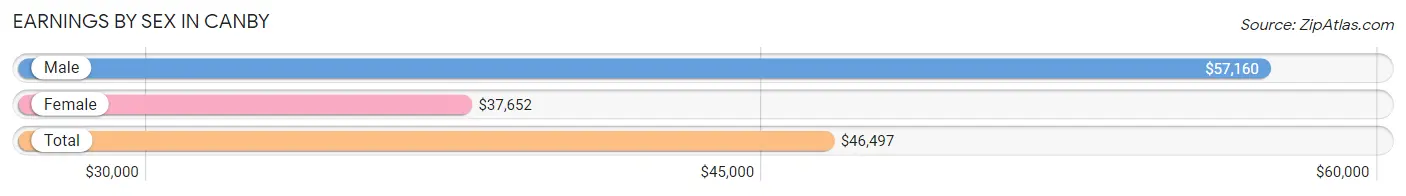
Earnings by Sex in Canby
Average Earnings in Canby are $46,497, $57,160 for men and $37,652 for women, a difference of 34.1%.
| Sex | Number | Average Earnings |
| Male | 5,135 (54.3%) | $57,160 |
| Female | 4,314 (45.7%) | $37,652 |
| Total | 9,449 (100.0%) | $46,497 |
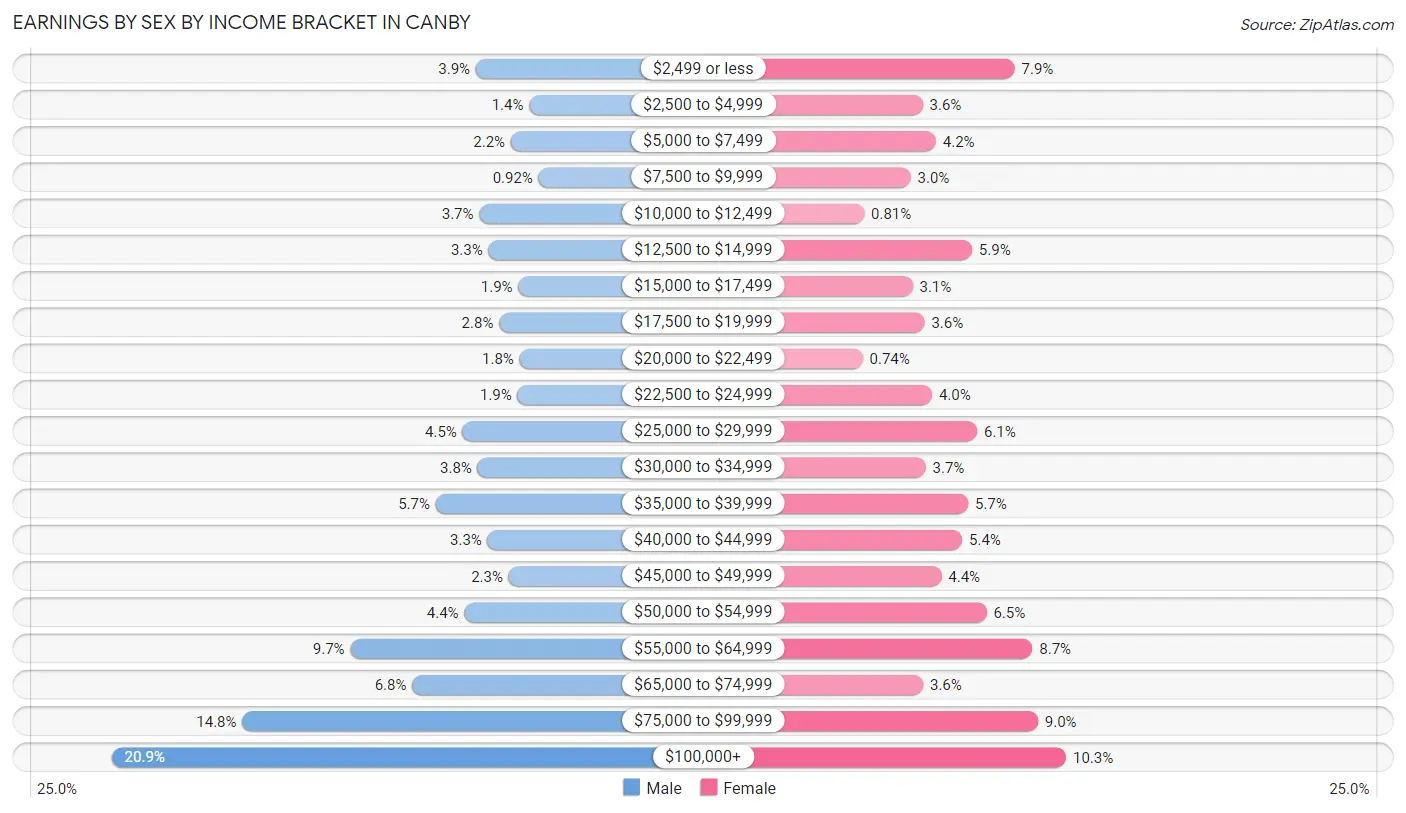
Earnings by Sex by Income Bracket in Canby
The most common earnings brackets in Canby are $100,000+ for men (1,074 | 20.9%) and $100,000+ for women (443 | 10.3%).
| Income | Male | Female |
| $2,499 or less | 198 (3.9%) | 339 (7.9%) |
| $2,500 to $4,999 | 70 (1.4%) | 153 (3.5%) |
| $5,000 to $7,499 | 114 (2.2%) | 180 (4.2%) |
| $7,500 to $9,999 | 47 (0.9%) | 129 (3.0%) |
| $10,000 to $12,499 | 190 (3.7%) | 35 (0.8%) |
| $12,500 to $14,999 | 168 (3.3%) | 253 (5.9%) |
| $15,000 to $17,499 | 96 (1.9%) | 133 (3.1%) |
| $17,500 to $19,999 | 142 (2.8%) | 157 (3.6%) |
| $20,000 to $22,499 | 93 (1.8%) | 32 (0.7%) |
| $22,500 to $24,999 | 98 (1.9%) | 172 (4.0%) |
| $25,000 to $29,999 | 230 (4.5%) | 263 (6.1%) |
| $30,000 to $34,999 | 194 (3.8%) | 159 (3.7%) |
| $35,000 to $39,999 | 295 (5.7%) | 245 (5.7%) |
| $40,000 to $44,999 | 170 (3.3%) | 233 (5.4%) |
| $45,000 to $49,999 | 119 (2.3%) | 191 (4.4%) |
| $50,000 to $54,999 | 226 (4.4%) | 282 (6.5%) |
| $55,000 to $64,999 | 500 (9.7%) | 375 (8.7%) |
| $65,000 to $74,999 | 351 (6.8%) | 154 (3.6%) |
| $75,000 to $99,999 | 760 (14.8%) | 386 (8.9%) |
| $100,000+ | 1,074 (20.9%) | 443 (10.3%) |
| Total | 5,135 (100.0%) | 4,314 (100.0%) |
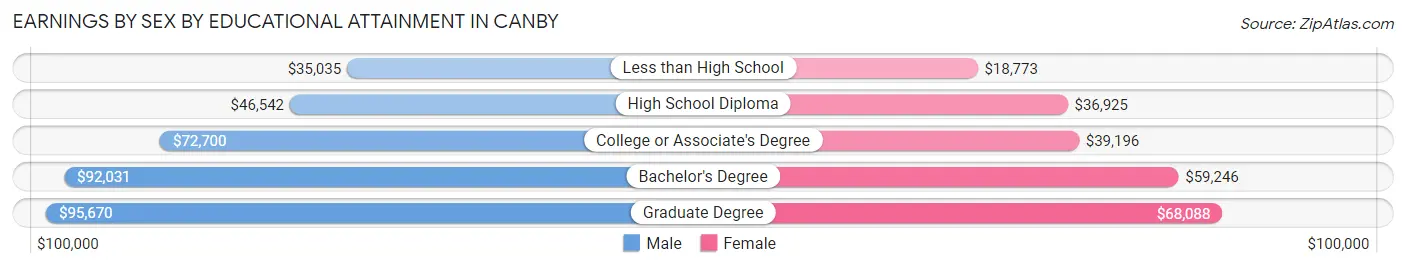
Earnings by Sex by Educational Attainment in Canby
Average earnings in Canby are $64,331 for men and $44,714 for women, a difference of 30.5%. Men with an educational attainment of graduate degree enjoy the highest average annual earnings of $95,670, while those with less than high school education earn the least with $35,035. Women with an educational attainment of graduate degree earn the most with the average annual earnings of $68,088, while those with less than high school education have the smallest earnings of $18,773.
| Educational Attainment | Male Income | Female Income |
| Less than High School | $35,035 | $18,773 |
| High School Diploma | $46,542 | $36,925 |
| College or Associate's Degree | $72,700 | $39,196 |
| Bachelor's Degree | $92,031 | $59,246 |
| Graduate Degree | $95,670 | $68,088 |
| Total | $64,331 | $44,714 |
Family Income in Canby
Family Income Brackets in Canby
According to the Canby family income data, there are 1,314 families falling into the $100,000 to $149,999 income range, which is the most common income bracket and makes up 26.9% of all families. Conversely, the less than $10,000 income bracket is the least frequent group with only 49 families (1.0%) belonging to this category.
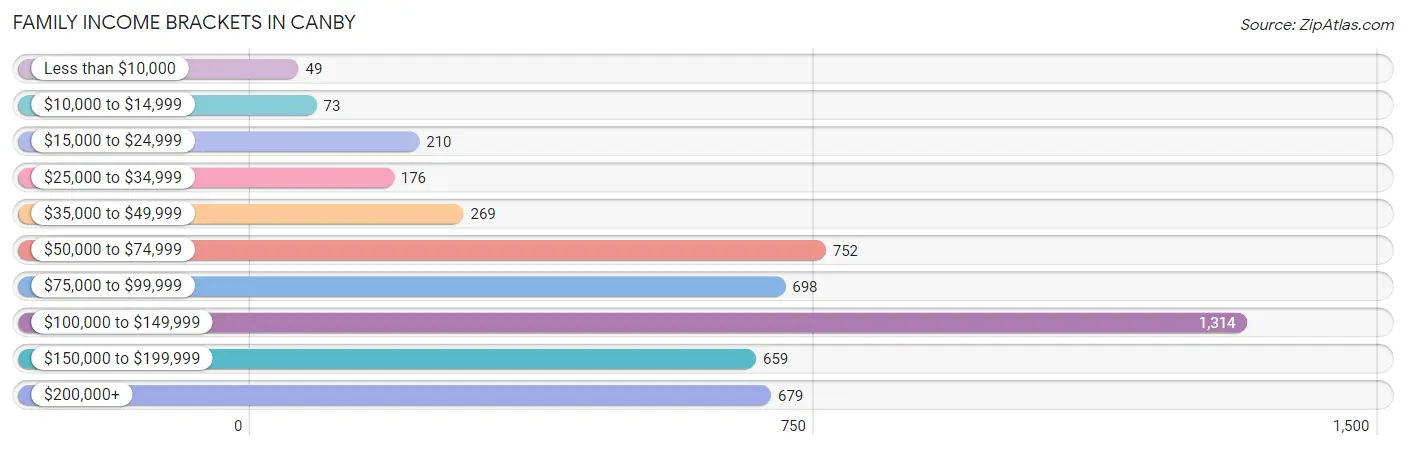
| Income Bracket | # Families | % Families |
| Less than $10,000 | 49 | 1.0% |
| $10,000 to $14,999 | 73 | 1.5% |
| $15,000 to $24,999 | 210 | 4.3% |
| $25,000 to $34,999 | 176 | 3.6% |
| $35,000 to $49,999 | 269 | 5.5% |
| $50,000 to $74,999 | 752 | 15.4% |
| $75,000 to $99,999 | 698 | 14.3% |
| $100,000 to $149,999 | 1,314 | 26.9% |
| $150,000 to $199,999 | 659 | 13.5% |
| $200,000+ | 679 | 13.9% |
Family Income by Famaliy Size in Canby
7+ person families (35 | 0.7%) account for the highest median family income in Canby with $250,001 per family, while 2-person families (2,523 | 51.7%) have the highest median income of $49,062 per family member.

| Income Bracket | # Families | Median Income |
| 2-Person Families | 2,523 (51.7%) | $98,125 |
| 3-Person Families | 746 (15.3%) | $104,128 |
| 4-Person Families | 955 (19.6%) | $107,031 |
| 5-Person Families | 496 (10.2%) | $116,250 |
| 6-Person Families | 128 (2.6%) | $119,722 |
| 7+ Person Families | 35 (0.7%) | $250,001 |
| Total | 4,883 (100.0%) | $102,622 |
Family Income by Number of Earners in Canby
The median family income in Canby is $102,622, with families comprising 3+ earners (734) having the highest median family income of $148,693, while families with no earners (944) have the lowest median family income of $65,313, accounting for 15.0% and 19.3% of families, respectively.
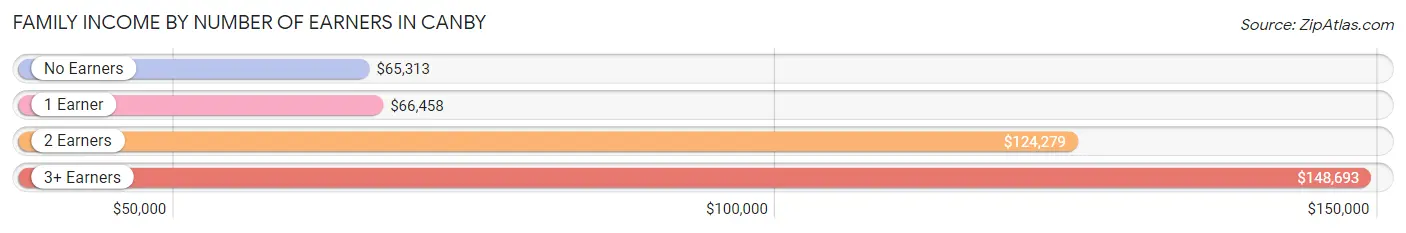
| Number of Earners | # Families | Median Income |
| No Earners | 944 (19.3%) | $65,313 |
| 1 Earner | 1,240 (25.4%) | $66,458 |
| 2 Earners | 1,965 (40.2%) | $124,279 |
| 3+ Earners | 734 (15.0%) | $148,693 |
| Total | 4,883 (100.0%) | $102,622 |
Household Income in Canby
Household Income Brackets in Canby
With 1,593 households falling in the category, the $100,000 to $149,999 income range is the most frequent in Canby, accounting for 23.3% of all households. In contrast, only 198 households (2.9%) fall into the less than $10,000 income bracket, making it the least populous group.
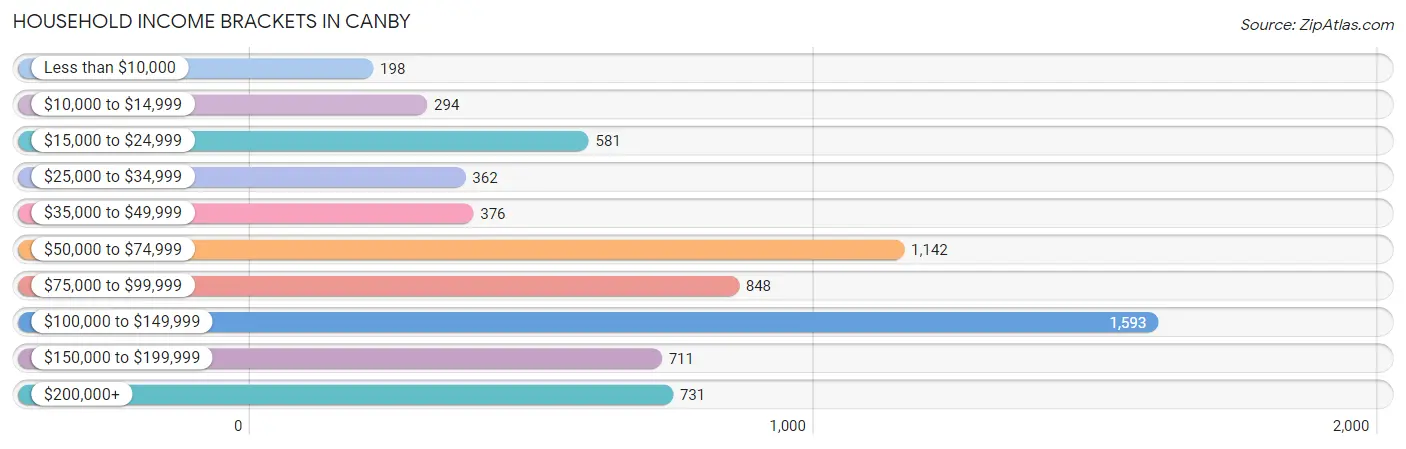
| Income Bracket | # Households | % Households |
| Less than $10,000 | 198 | 2.9% |
| $10,000 to $14,999 | 294 | 4.3% |
| $15,000 to $24,999 | 581 | 8.5% |
| $25,000 to $34,999 | 362 | 5.3% |
| $35,000 to $49,999 | 376 | 5.5% |
| $50,000 to $74,999 | 1,142 | 16.7% |
| $75,000 to $99,999 | 848 | 12.4% |
| $100,000 to $149,999 | 1,593 | 23.3% |
| $150,000 to $199,999 | 711 | 10.4% |
| $200,000+ | 731 | 10.7% |
Household Income by Householder Age in Canby
The median household income in Canby is $91,823, with the highest median household income of $104,231 found in the 45 to 64 years age bracket for the primary householder. A total of 2,779 households (40.6%) fall into this category. Meanwhile, the 15 to 24 years age bracket for the primary householder has the lowest median household income of $0, with 148 households (2.2%) in this group.
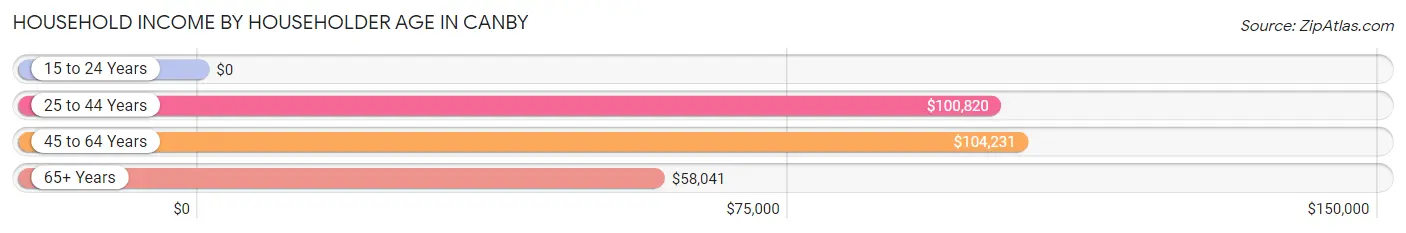
| Income Bracket | # Households | Median Income |
| 15 to 24 Years | 148 (2.2%) | $0 |
| 25 to 44 Years | 1,779 (26.0%) | $100,820 |
| 45 to 64 Years | 2,779 (40.6%) | $104,231 |
| 65+ Years | 2,130 (31.2%) | $58,041 |
| Total | 6,836 (100.0%) | $91,823 |
Poverty in Canby
Income Below Poverty by Sex and Age in Canby
With 7.0% poverty level for males and 10.4% for females among the residents of Canby, 16 and 17 year old males and 18 to 24 year old females are the most vulnerable to poverty, with 55 males (21.7%) and 227 females (30.1%) in their respective age groups living below the poverty level.
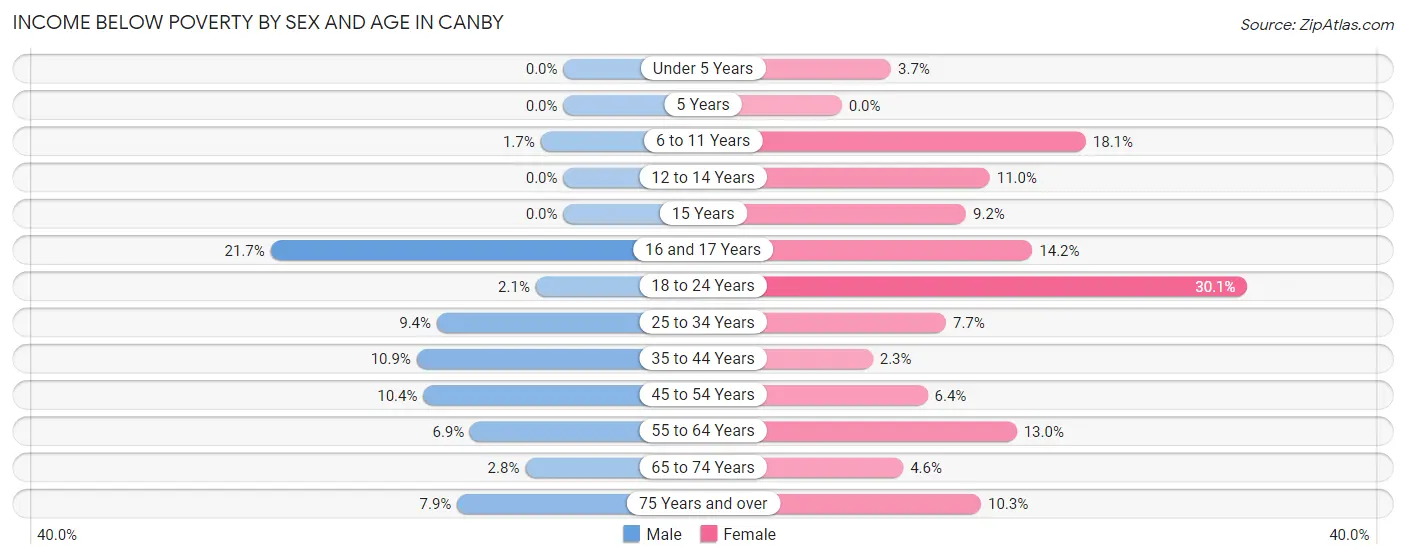
| Age Bracket | Male | Female |
| Under 5 Years | 0 (0.0%) | 17 (3.7%) |
| 5 Years | 0 (0.0%) | 0 (0.0%) |
| 6 to 11 Years | 11 (1.7%) | 152 (18.1%) |
| 12 to 14 Years | 0 (0.0%) | 31 (11.0%) |
| 15 Years | 0 (0.0%) | 12 (9.2%) |
| 16 and 17 Years | 55 (21.7%) | 44 (14.1%) |
| 18 to 24 Years | 13 (2.1%) | 227 (30.1%) |
| 25 to 34 Years | 103 (9.4%) | 83 (7.7%) |
| 35 to 44 Years | 134 (10.9%) | 23 (2.3%) |
| 45 to 54 Years | 134 (10.4%) | 78 (6.4%) |
| 55 to 64 Years | 78 (6.9%) | 169 (13.0%) |
| 65 to 74 Years | 21 (2.8%) | 48 (4.6%) |
| 75 Years and over | 49 (7.9%) | 90 (10.3%) |
| Total | 598 (7.0%) | 974 (10.4%) |
Income Above Poverty by Sex and Age in Canby
According to the poverty statistics in Canby, males aged under 5 years and females aged 5 years are the age groups that are most secure financially, with 100.0% of males and 100.0% of females in these age groups living above the poverty line.
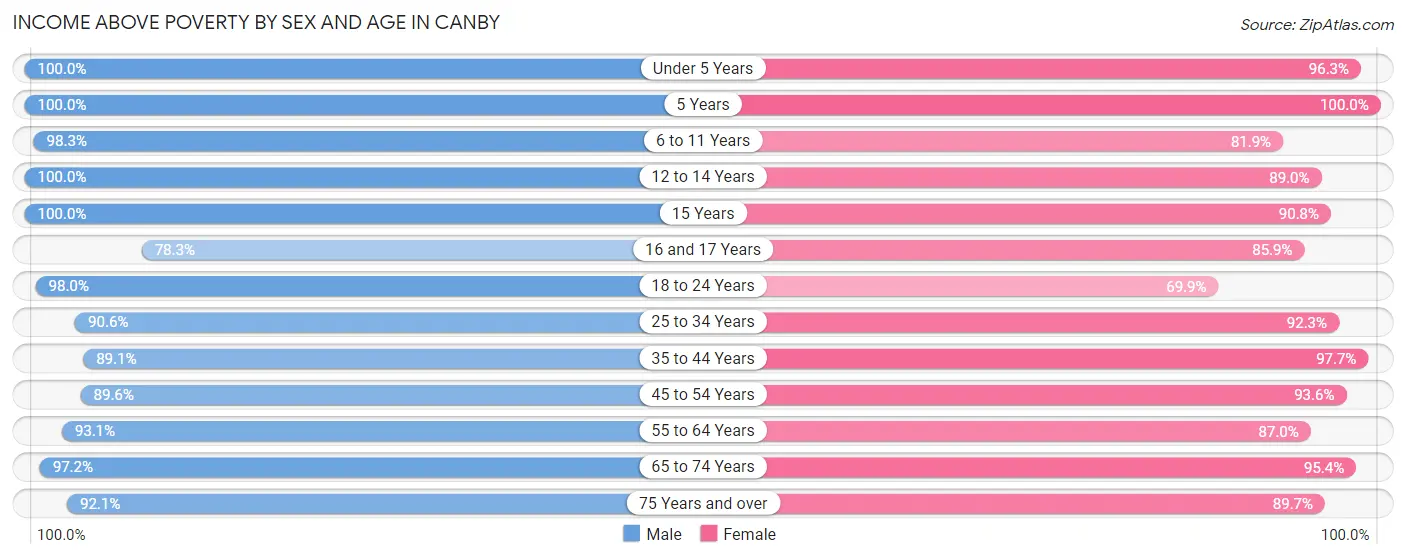
| Age Bracket | Male | Female |
| Under 5 Years | 378 (100.0%) | 448 (96.3%) |
| 5 Years | 85 (100.0%) | 79 (100.0%) |
| 6 to 11 Years | 641 (98.3%) | 687 (81.9%) |
| 12 to 14 Years | 309 (100.0%) | 251 (89.0%) |
| 15 Years | 136 (100.0%) | 118 (90.8%) |
| 16 and 17 Years | 198 (78.3%) | 267 (85.9%) |
| 18 to 24 Years | 621 (98.0%) | 527 (69.9%) |
| 25 to 34 Years | 994 (90.6%) | 989 (92.3%) |
| 35 to 44 Years | 1,096 (89.1%) | 976 (97.7%) |
| 45 to 54 Years | 1,154 (89.6%) | 1,146 (93.6%) |
| 55 to 64 Years | 1,049 (93.1%) | 1,132 (87.0%) |
| 65 to 74 Years | 721 (97.2%) | 1,005 (95.4%) |
| 75 Years and over | 573 (92.1%) | 780 (89.7%) |
| Total | 7,955 (93.0%) | 8,405 (89.6%) |
Income Below Poverty Among Married-Couple Families in Canby
The poverty statistics for married-couple families in Canby show that 1.2% or 49 of the total 4,001 families live below the poverty line. Families with 1 or 2 children have the highest poverty rate of 1.8%, comprising of 24 families. On the other hand, families with 3 or 4 children have the lowest poverty rate of 0.0%, which includes 0 families.
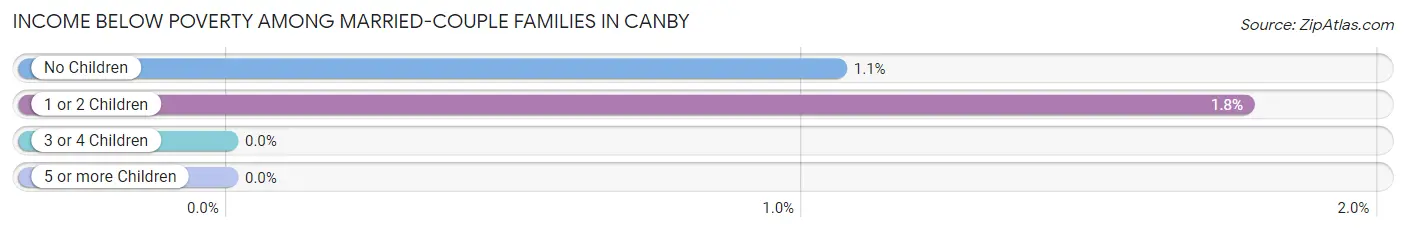
| Children | Above Poverty | Below Poverty |
| No Children | 2,335 (98.9%) | 25 (1.1%) |
| 1 or 2 Children | 1,334 (98.2%) | 24 (1.8%) |
| 3 or 4 Children | 277 (100.0%) | 0 (0.0%) |
| 5 or more Children | 6 (100.0%) | 0 (0.0%) |
| Total | 3,952 (98.8%) | 49 (1.2%) |
Income Below Poverty Among Single-Parent Households in Canby
According to the poverty data in Canby, 10.9% or 26 single-father households and 27.0% or 174 single-mother households are living below the poverty line. Among single-father households, those with no children have the highest poverty rate, with 15 households (17.2%) experiencing poverty. Likewise, among single-mother households, those with 1 or 2 children have the highest poverty rate, with 155 households (36.6%) falling below the poverty line.
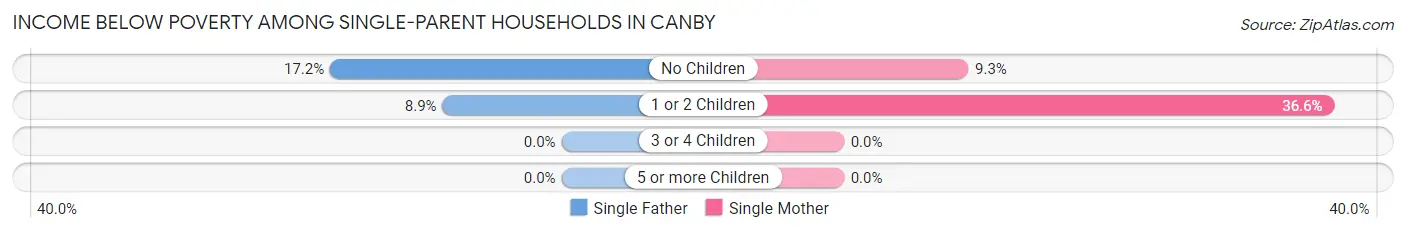
| Children | Single Father | Single Mother |
| No Children | 15 (17.2%) | 19 (9.3%) |
| 1 or 2 Children | 11 (8.9%) | 155 (36.6%) |
| 3 or 4 Children | 0 (0.0%) | 0 (0.0%) |
| 5 or more Children | 0 (0.0%) | 0 (0.0%) |
| Total | 26 (10.9%) | 174 (27.0%) |
Income Below Poverty Among Married-Couple vs Single-Parent Households in Canby
The poverty data for Canby shows that 49 of the married-couple family households (1.2%) and 200 of the single-parent households (22.7%) are living below the poverty level. Within the married-couple family households, those with 1 or 2 children have the highest poverty rate, with 24 households (1.8%) falling below the poverty line. Among the single-parent households, those with 1 or 2 children have the highest poverty rate, with 166 household (30.3%) living below poverty.
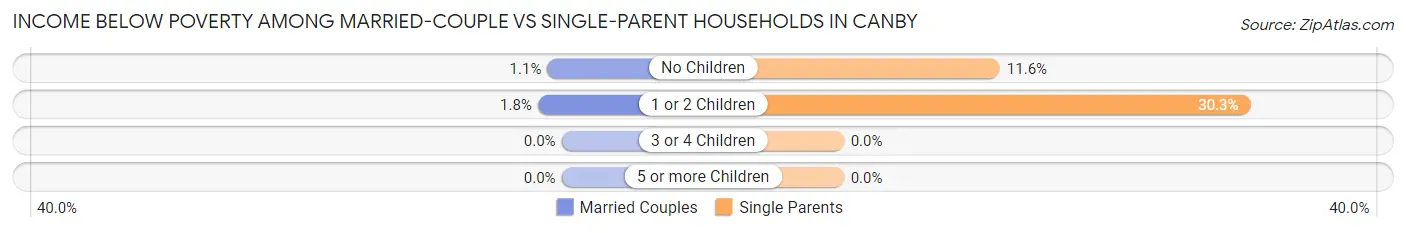
| Children | Married-Couple Families | Single-Parent Households |
| No Children | 25 (1.1%) | 34 (11.6%) |
| 1 or 2 Children | 24 (1.8%) | 166 (30.3%) |
| 3 or 4 Children | 0 (0.0%) | 0 (0.0%) |
| 5 or more Children | 0 (0.0%) | 0 (0.0%) |
| Total | 49 (1.2%) | 200 (22.7%) |
Race in Canby
The most populous races in Canby are White / Caucasian (14,750 | 81.4%), Hispanic or Latino (3,244 | 17.9%), and Two or more Races (1,639 | 9.0%).
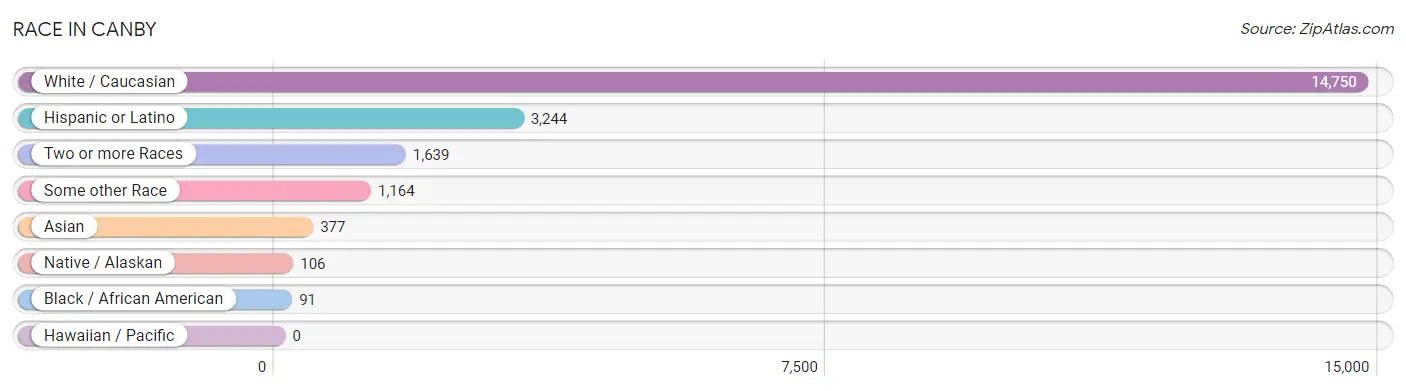
| Race | # Population | % Population |
| Asian | 377 | 2.1% |
| Black / African American | 91 | 0.5% |
| Hawaiian / Pacific | 0 | 0.0% |
| Hispanic or Latino | 3,244 | 17.9% |
| Native / Alaskan | 106 | 0.6% |
| White / Caucasian | 14,750 | 81.4% |
| Two or more Races | 1,639 | 9.0% |
| Some other Race | 1,164 | 6.4% |
| Total | 18,127 | 100.0% |
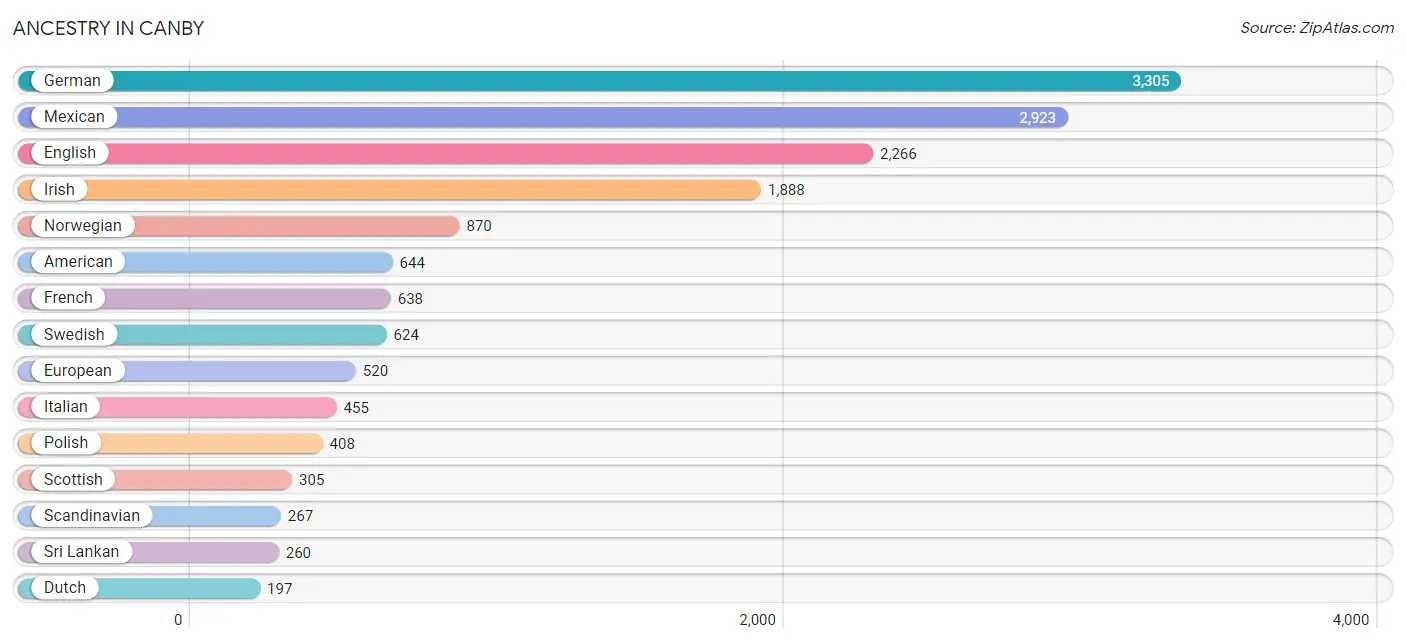
Ancestry in Canby
The most populous ancestries reported in Canby are German (3,305 | 18.2%), Mexican (2,923 | 16.1%), English (2,266 | 12.5%), Irish (1,888 | 10.4%), and Norwegian (870 | 4.8%), together accounting for 62.1% of all Canby residents.
| Ancestry | # Population | % Population |
| African | 28 | 0.2% |
| American | 644 | 3.5% |
| Apache | 35 | 0.2% |
| Arab | 36 | 0.2% |
| Austrian | 12 | 0.1% |
| Bangladeshi | 30 | 0.2% |
| Belgian | 47 | 0.3% |
| Bhutanese | 42 | 0.2% |
| British | 118 | 0.6% |
| Burmese | 46 | 0.3% |
| Canadian | 123 | 0.7% |
| Central American | 58 | 0.3% |
| Cherokee | 28 | 0.2% |
| Chickasaw | 26 | 0.1% |
| Chippewa | 59 | 0.3% |
| Colombian | 20 | 0.1% |
| Croatian | 20 | 0.1% |
| Cuban | 13 | 0.1% |
| Czech | 57 | 0.3% |
| Czechoslovakian | 33 | 0.2% |
| Danish | 131 | 0.7% |
| Dutch | 197 | 1.1% |
| Eastern European | 52 | 0.3% |
| Ecuadorian | 9 | 0.1% |
| English | 2,266 | 12.5% |
| Estonian | 10 | 0.1% |
| European | 520 | 2.9% |
| Finnish | 42 | 0.2% |
| French | 638 | 3.5% |
| French Canadian | 68 | 0.4% |
| German | 3,305 | 18.2% |
| Greek | 83 | 0.5% |
| Guatemalan | 10 | 0.1% |
| Hungarian | 36 | 0.2% |
| Indian (Asian) | 91 | 0.5% |
| Iranian | 35 | 0.2% |
| Irish | 1,888 | 10.4% |
| Italian | 455 | 2.5% |
| Japanese | 7 | 0.0% |
| Korean | 66 | 0.4% |
| Lebanese | 36 | 0.2% |
| Lithuanian | 8 | 0.0% |
| Malaysian | 27 | 0.2% |
| Mexican | 2,923 | 16.1% |
| Native Hawaiian | 26 | 0.1% |
| Nigerian | 15 | 0.1% |
| Northern European | 8 | 0.0% |
| Norwegian | 870 | 4.8% |
| Pakistani | 5 | 0.0% |
| Pennsylvania German | 9 | 0.1% |
| Peruvian | 15 | 0.1% |
| Polish | 408 | 2.2% |
| Portuguese | 92 | 0.5% |
| Romanian | 3 | 0.0% |
| Russian | 73 | 0.4% |
| Salvadoran | 48 | 0.3% |
| Scandinavian | 267 | 1.5% |
| Scotch-Irish | 134 | 0.7% |
| Scottish | 305 | 1.7% |
| Sierra Leonean | 13 | 0.1% |
| Slovak | 24 | 0.1% |
| Slovene | 22 | 0.1% |
| South American | 44 | 0.2% |
| Spaniard | 11 | 0.1% |
| Spanish | 40 | 0.2% |
| Sri Lankan | 260 | 1.4% |
| Subsaharan African | 66 | 0.4% |
| Swedish | 624 | 3.4% |
| Swiss | 83 | 0.5% |
| Thai | 33 | 0.2% |
| Welsh | 112 | 0.6% |
| Zimbabwean | 10 | 0.1% | View All 72 Rows |
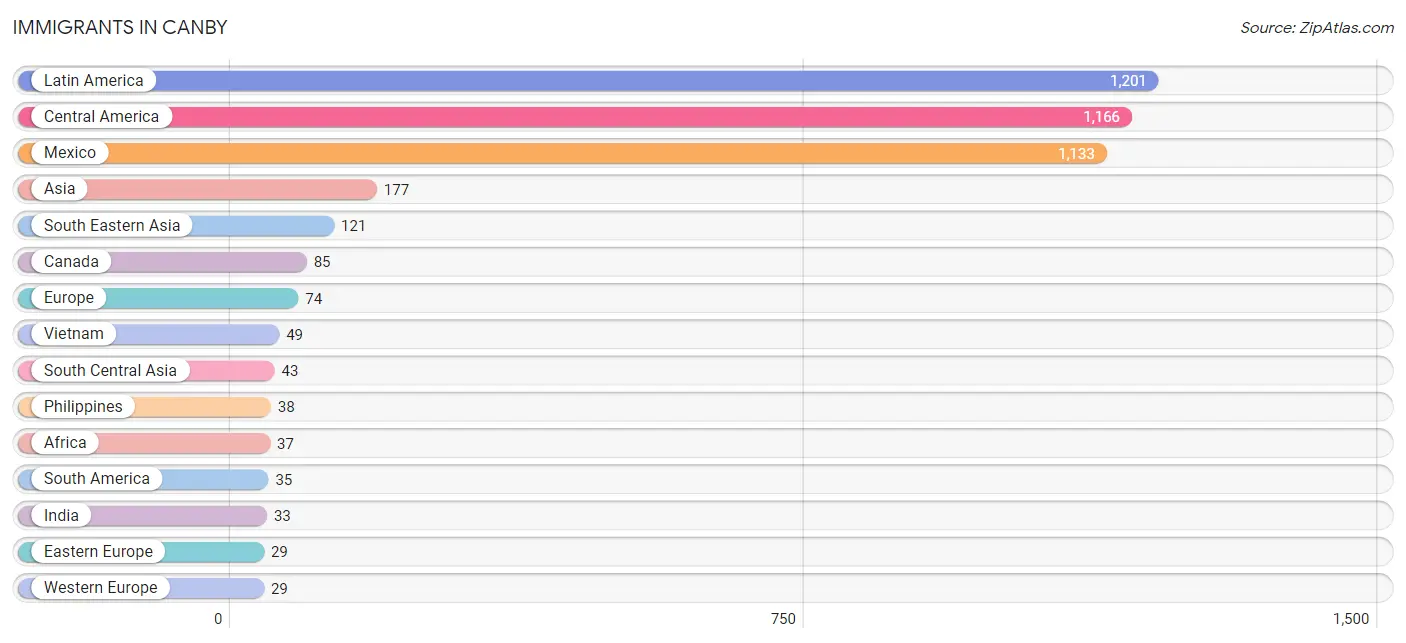
Immigrants in Canby
The most numerous immigrant groups reported in Canby came from Latin America (1,201 | 6.6%), Central America (1,166 | 6.4%), Mexico (1,133 | 6.2%), Asia (177 | 1.0%), and South Eastern Asia (121 | 0.7%), together accounting for 21.0% of all Canby residents.
| Immigration Origin | # Population | % Population |
| Africa | 37 | 0.2% |
| Asia | 177 | 1.0% |
| Belgium | 7 | 0.0% |
| Cambodia | 7 | 0.0% |
| Canada | 85 | 0.5% |
| Central America | 1,166 | 6.4% |
| Colombia | 20 | 0.1% |
| Czechoslovakia | 26 | 0.1% |
| Eastern Africa | 22 | 0.1% |
| Eastern Asia | 13 | 0.1% |
| Eastern Europe | 29 | 0.2% |
| El Salvador | 23 | 0.1% |
| Europe | 74 | 0.4% |
| Germany | 15 | 0.1% |
| Guatemala | 10 | 0.1% |
| India | 33 | 0.2% |
| Iran | 10 | 0.1% |
| Japan | 13 | 0.1% |
| Laos | 27 | 0.2% |
| Latin America | 1,201 | 6.6% |
| Mexico | 1,133 | 6.2% |
| Netherlands | 7 | 0.0% |
| Nigeria | 15 | 0.1% |
| Northern Europe | 16 | 0.1% |
| Peru | 15 | 0.1% |
| Philippines | 38 | 0.2% |
| Romania | 3 | 0.0% |
| Scotland | 7 | 0.0% |
| South America | 35 | 0.2% |
| South Central Asia | 43 | 0.2% |
| South Eastern Asia | 121 | 0.7% |
| Vietnam | 49 | 0.3% |
| Western Africa | 15 | 0.1% |
| Western Europe | 29 | 0.2% |
| Zimbabwe | 10 | 0.1% | View All 35 Rows |
Sex and Age in Canby
Sex and Age in Canby
The most populous age groups in Canby are 50 to 54 Years (798 | 9.3%) for men and 15 to 19 Years (767 | 8.1%) for women.
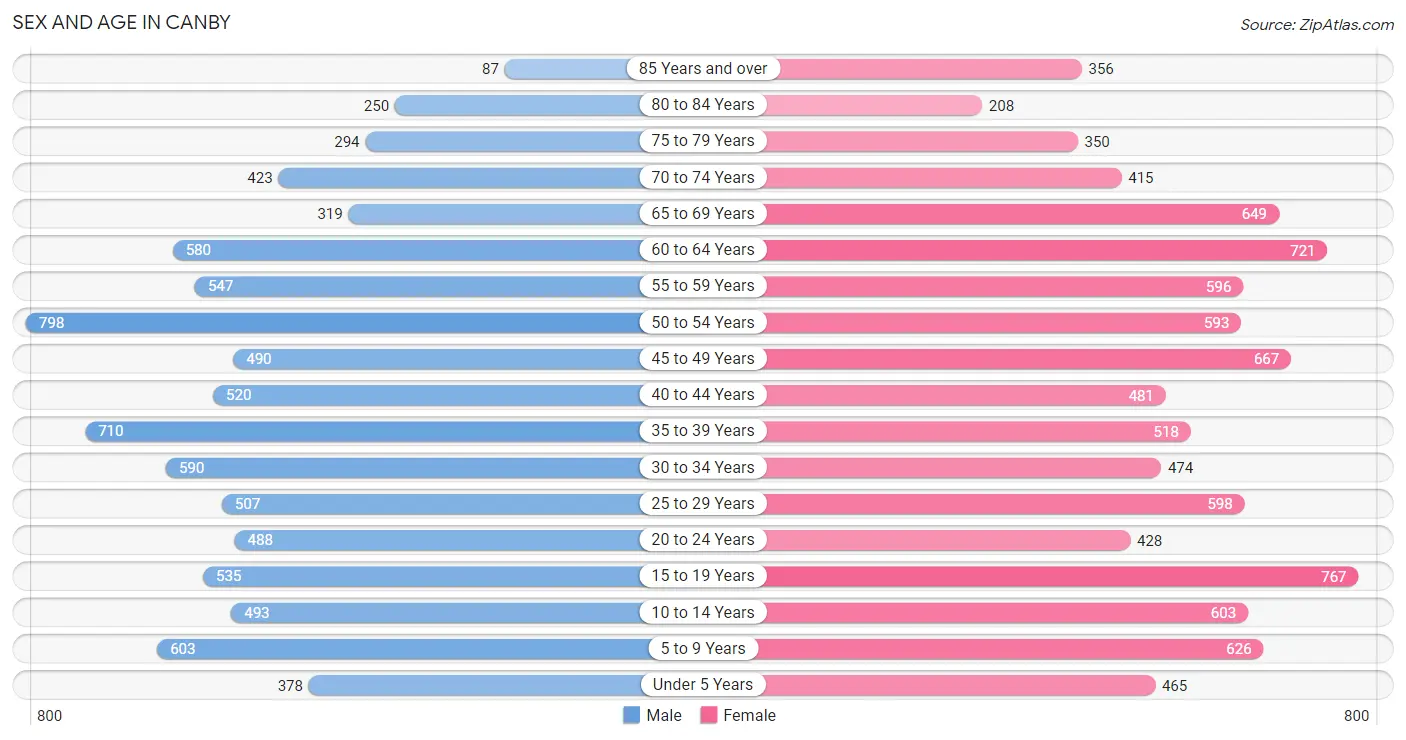
| Age Bracket | Male | Female |
| Under 5 Years | 378 (4.4%) | 465 (4.9%) |
| 5 to 9 Years | 603 (7.0%) | 626 (6.6%) |
| 10 to 14 Years | 493 (5.7%) | 603 (6.3%) |
| 15 to 19 Years | 535 (6.2%) | 767 (8.1%) |
| 20 to 24 Years | 488 (5.7%) | 428 (4.5%) |
| 25 to 29 Years | 507 (5.9%) | 598 (6.3%) |
| 30 to 34 Years | 590 (6.9%) | 474 (5.0%) |
| 35 to 39 Years | 710 (8.2%) | 518 (5.4%) |
| 40 to 44 Years | 520 (6.0%) | 481 (5.1%) |
| 45 to 49 Years | 490 (5.7%) | 667 (7.0%) |
| 50 to 54 Years | 798 (9.3%) | 593 (6.2%) |
| 55 to 59 Years | 547 (6.4%) | 596 (6.3%) |
| 60 to 64 Years | 580 (6.7%) | 721 (7.6%) |
| 65 to 69 Years | 319 (3.7%) | 649 (6.8%) |
| 70 to 74 Years | 423 (4.9%) | 415 (4.4%) |
| 75 to 79 Years | 294 (3.4%) | 350 (3.7%) |
| 80 to 84 Years | 250 (2.9%) | 208 (2.2%) |
| 85 Years and over | 87 (1.0%) | 356 (3.7%) |
| Total | 8,612 (100.0%) | 9,515 (100.0%) |
Families and Households in Canby
Median Family Size in Canby
The median family size in Canby is 3.09 persons per family, with married-couple families (4,001 | 81.9%) accounting for the largest median family size of 3.14 persons per family. On the other hand, single male/father families (238 | 4.9%) represent the smallest median family size with 2.81 persons per family.
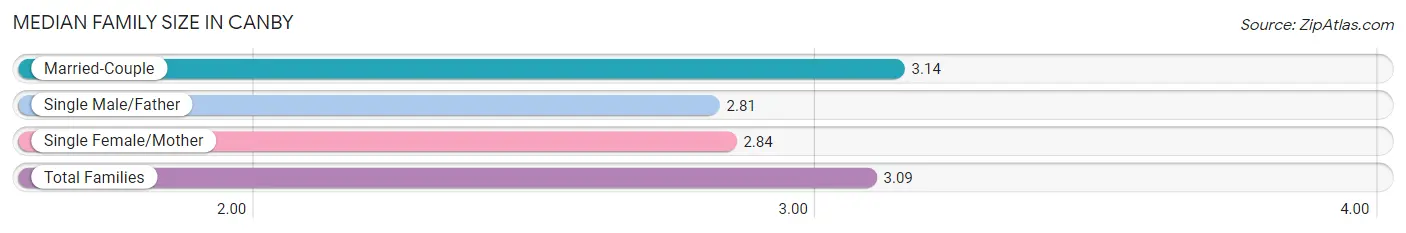
| Family Type | # Families | Family Size |
| Married-Couple | 4,001 (81.9%) | 3.14 |
| Single Male/Father | 238 (4.9%) | 2.81 |
| Single Female/Mother | 644 (13.2%) | 2.84 |
| Total Families | 4,883 (100.0%) | 3.09 |
Median Household Size in Canby
The median household size in Canby is 2.63 persons per household, with single male/father households (238 | 3.5%) accounting for the largest median household size of 3.58 persons per household. non-family households (1,953 | 28.6%) represent the smallest median household size with 1.27 persons per household.
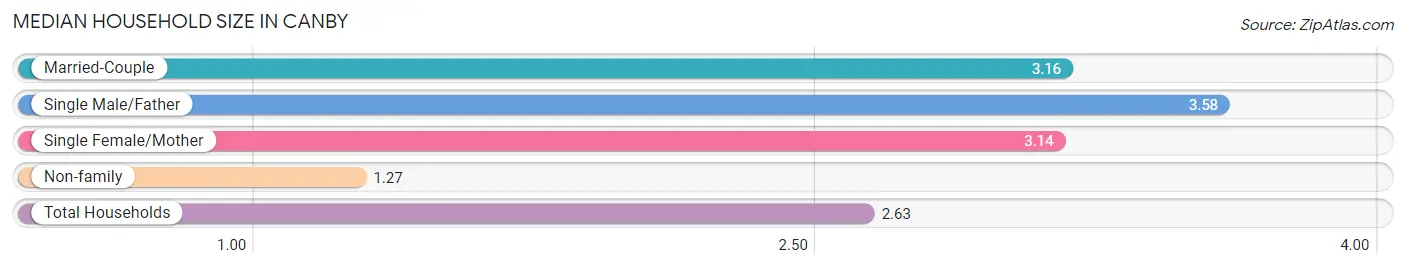
| Household Type | # Households | Household Size |
| Married-Couple | 4,001 (58.5%) | 3.16 |
| Single Male/Father | 238 (3.5%) | 3.58 |
| Single Female/Mother | 644 (9.4%) | 3.14 |
| Non-family | 1,953 (28.6%) | 1.27 |
| Total Households | 6,836 (100.0%) | 2.63 |
Household Size by Marriage Status in Canby
Out of a total of 6,836 households in Canby, 4,883 (71.4%) are family households, while 1,953 (28.6%) are nonfamily households. The most numerous type of family households are 2-person households, comprising 2,380, and the most common type of nonfamily households are 1-person households, comprising 1,566.
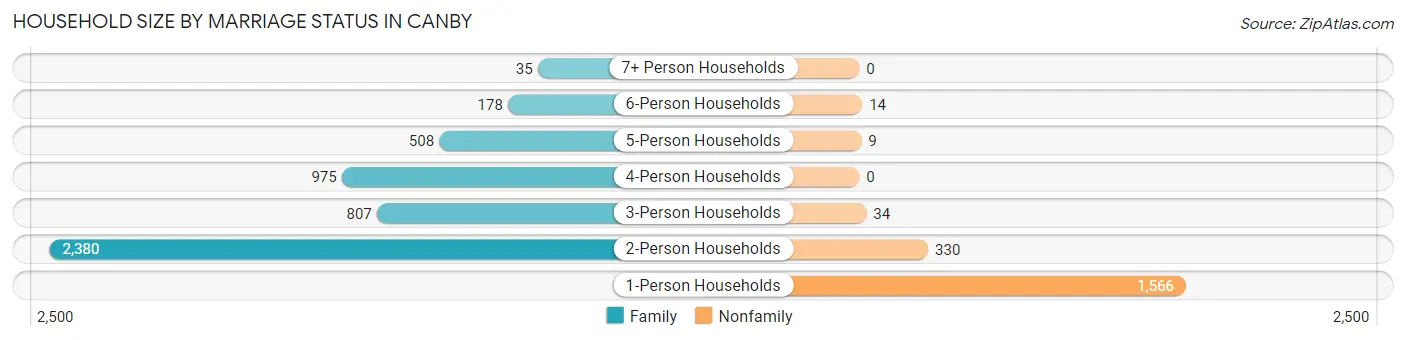
| Household Size | Family Households | Nonfamily Households |
| 1-Person Households | - | 1,566 (22.9%) |
| 2-Person Households | 2,380 (34.8%) | 330 (4.8%) |
| 3-Person Households | 807 (11.8%) | 34 (0.5%) |
| 4-Person Households | 975 (14.3%) | 0 (0.0%) |
| 5-Person Households | 508 (7.4%) | 9 (0.1%) |
| 6-Person Households | 178 (2.6%) | 14 (0.2%) |
| 7+ Person Households | 35 (0.5%) | 0 (0.0%) |
| Total | 4,883 (71.4%) | 1,953 (28.6%) |
Female Fertility in Canby
Fertility by Age in Canby
Average fertility rate in Canby is 48.0 births per 1,000 women. Women in the age bracket of 20 to 34 years have the highest fertility rate with 99.0 births per 1,000 women. Women in the age bracket of 20 to 34 years acount for 76.7% of all women with births.
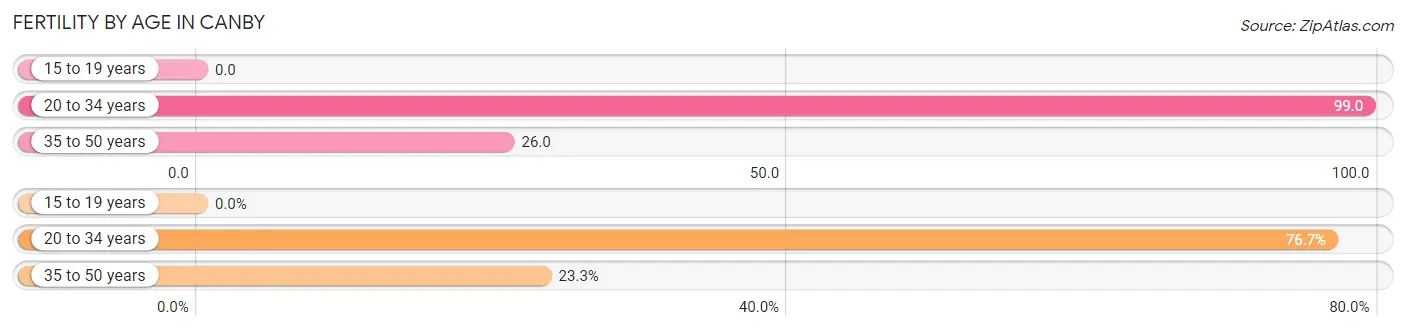
| Age Bracket | Women with Births | Births / 1,000 Women |
| 15 to 19 years | 0 (0.0%) | 0.0 |
| 20 to 34 years | 148 (76.7%) | 99.0 |
| 35 to 50 years | 45 (23.3%) | 26.0 |
| Total | 193 (100.0%) | 48.0 |
Fertility by Age by Marriage Status in Canby
62.7% of women with births (193) in Canby are married. The highest percentage of unmarried women with births falls into 20 to 34 years age bracket with 48.6% of them unmarried at the time of birth, while the lowest percentage of unmarried women with births belong to 35 to 50 years age bracket with 0.0% of them unmarried.
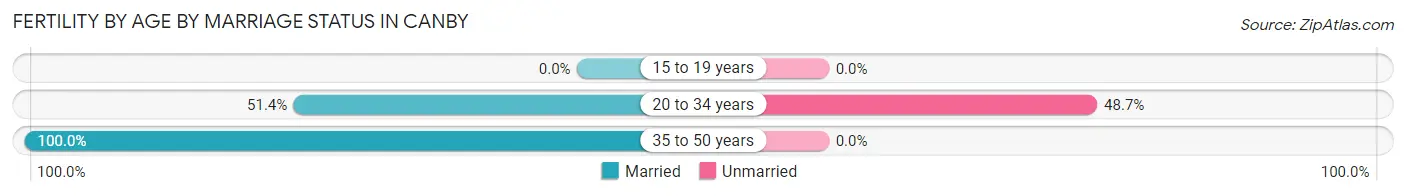
| Age Bracket | Married | Unmarried |
| 15 to 19 years | 0 (0.0%) | 0 (0.0%) |
| 20 to 34 years | 76 (51.3%) | 72 (48.6%) |
| 35 to 50 years | 45 (100.0%) | 0 (0.0%) |
| Total | 121 (62.7%) | 72 (37.3%) |
Fertility by Education in Canby
Average fertility rate in Canby is 48.0 births per 1,000 women. Women with the education attainment of graduate degree have the highest fertility rate of 111.0 births per 1,000 women, while women with the education attainment of less than high school have the lowest fertility at 9.0 births per 1,000 women. Women with the education attainment of high school diploma represent 49.7% of all women with births.
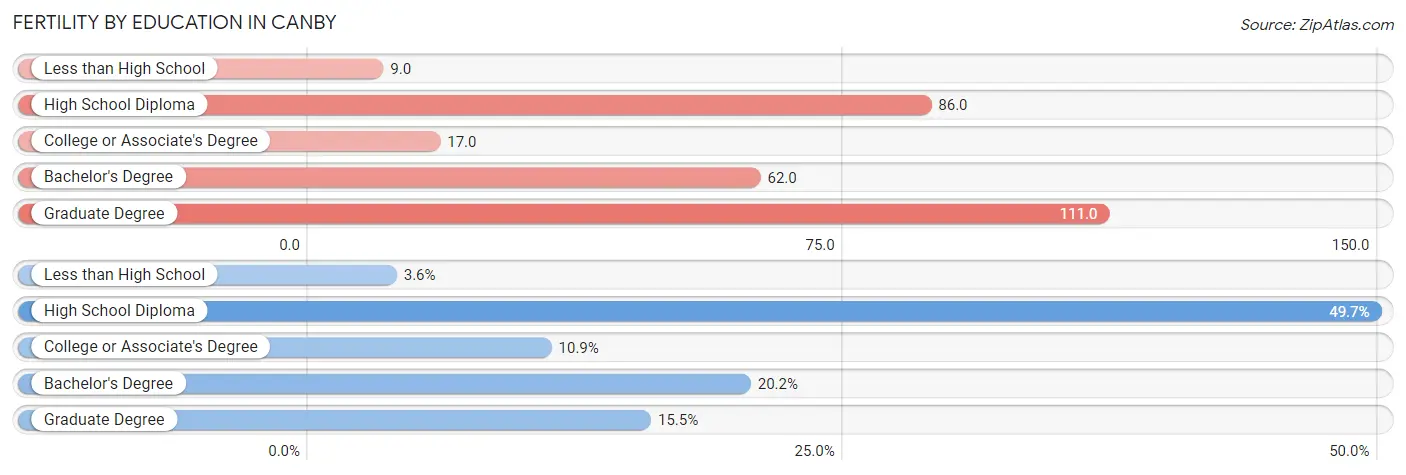
| Educational Attainment | Women with Births | Births / 1,000 Women |
| Less than High School | 7 (3.6%) | 9.0 |
| High School Diploma | 96 (49.7%) | 86.0 |
| College or Associate's Degree | 21 (10.9%) | 17.0 |
| Bachelor's Degree | 39 (20.2%) | 62.0 |
| Graduate Degree | 30 (15.5%) | 111.0 |
| Total | 193 (100.0%) | 48.0 |
Fertility by Education by Marriage Status in Canby
37.3% of women with births in Canby are unmarried. Women with the educational attainment of less than high school are most likely to be married with 100.0% of them married at childbirth, while women with the educational attainment of high school diploma are least likely to be married with 75.0% of them unmarried at childbirth.
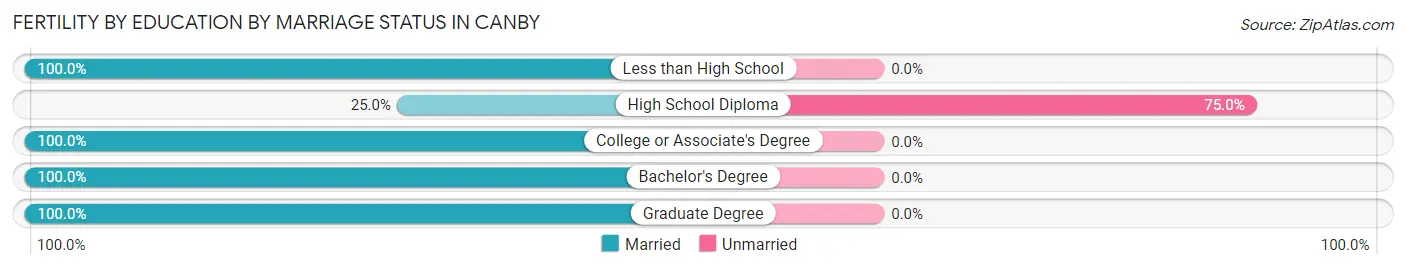
| Educational Attainment | Married | Unmarried |
| Less than High School | 7 (100.0%) | 0 (0.0%) |
| High School Diploma | 24 (25.0%) | 72 (75.0%) |
| College or Associate's Degree | 21 (100.0%) | 0 (0.0%) |
| Bachelor's Degree | 39 (100.0%) | 0 (0.0%) |
| Graduate Degree | 30 (100.0%) | 0 (0.0%) |
| Total | 121 (62.7%) | 72 (37.3%) |
Employment Characteristics in Canby
Employment by Class of Employer in Canby
Among the 8,718 employed individuals in Canby, private company employees (6,088 | 69.8%), not-for-profit organizations (823 | 9.4%), and local government employees (668 | 7.7%) make up the most common classes of employment.
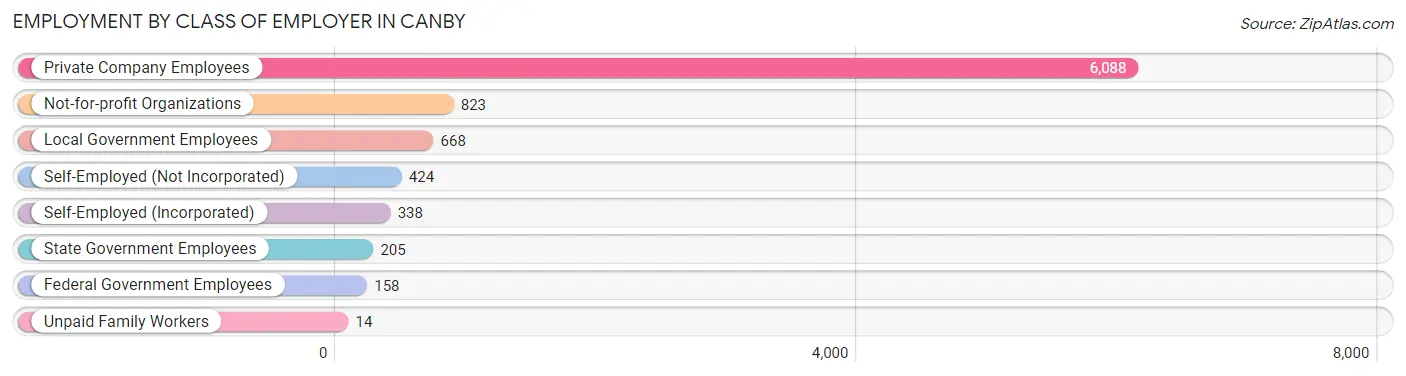
| Employer Class | # Employees | % Employees |
| Private Company Employees | 6,088 | 69.8% |
| Self-Employed (Incorporated) | 338 | 3.9% |
| Self-Employed (Not Incorporated) | 424 | 4.9% |
| Not-for-profit Organizations | 823 | 9.4% |
| Local Government Employees | 668 | 7.7% |
| State Government Employees | 205 | 2.4% |
| Federal Government Employees | 158 | 1.8% |
| Unpaid Family Workers | 14 | 0.2% |
| Total | 8,718 | 100.0% |
Employment Status by Age in Canby
According to the labor force statistics for Canby, out of the total population over 16 years of age (14,693), 62.4% or 9,168 individuals are in the labor force, with 3.1% or 284 of them unemployed. The age group with the highest labor force participation rate is 30 to 34 years, with 89.3% or 950 individuals in the labor force. Within the labor force, the 16 to 19 years age range has the highest percentage of unemployed individuals, with 9.0% or 50 of them being unemployed.
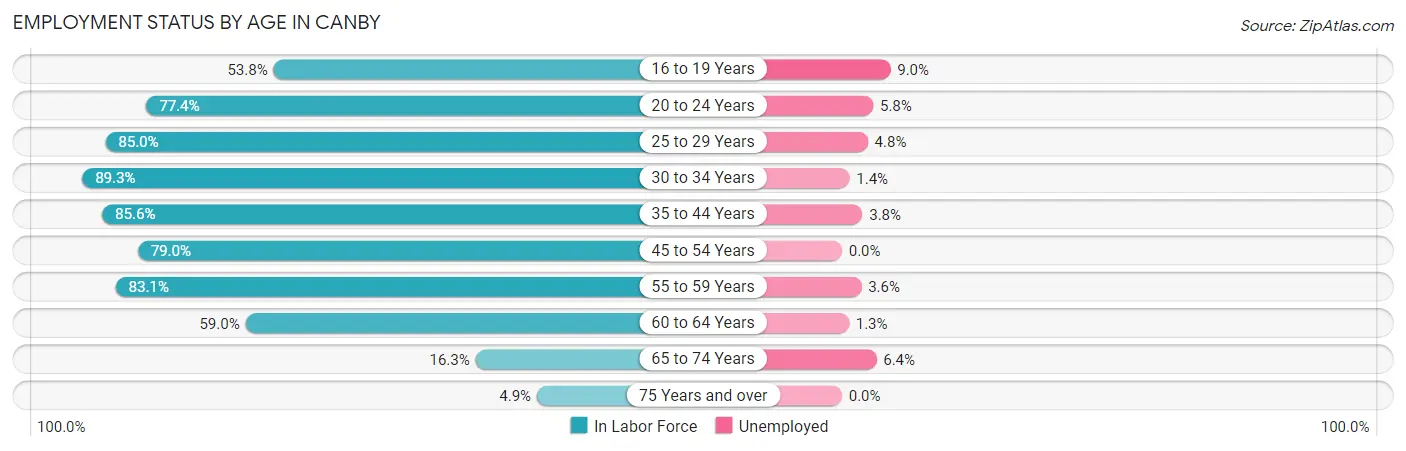
| Age Bracket | In Labor Force | Unemployed |
| 16 to 19 Years | 557 (53.8%) | 50 (9.0%) |
| 20 to 24 Years | 709 (77.4%) | 41 (5.8%) |
| 25 to 29 Years | 939 (85.0%) | 45 (4.8%) |
| 30 to 34 Years | 950 (89.3%) | 13 (1.4%) |
| 35 to 44 Years | 1,908 (85.6%) | 73 (3.8%) |
| 45 to 54 Years | 2,013 (79.0%) | 0 (0.0%) |
| 55 to 59 Years | 950 (83.1%) | 34 (3.6%) |
| 60 to 64 Years | 768 (59.0%) | 10 (1.3%) |
| 65 to 74 Years | 294 (16.3%) | 19 (6.4%) |
| 75 Years and over | 76 (4.9%) | 0 (0.0%) |
| Total | 9,168 (62.4%) | 284 (3.1%) |
Employment Status by Educational Attainment in Canby
According to labor force statistics for Canby, 80.2% of individuals (7,531) out of the total population between 25 and 64 years of age (9,390) are in the labor force, with 2.3% or 173 of them being unemployed. The group with the highest labor force participation rate are those with the educational attainment of bachelor's degree or higher, with 87.2% or 2,385 individuals in the labor force. Within the labor force, individuals with less than high school education have the highest percentage of unemployment, with 3.7% or 30 of them being unemployed.
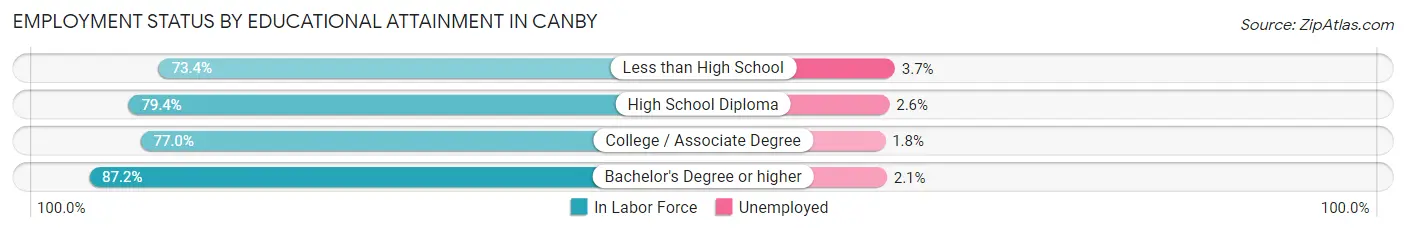
| Educational Attainment | In Labor Force | Unemployed |
| Less than High School | 802 (73.4%) | 40 (3.7%) |
| High School Diploma | 1,945 (79.4%) | 64 (2.6%) |
| College / Associate Degree | 2,397 (77.0%) | 56 (1.8%) |
| Bachelor's Degree or higher | 2,385 (87.2%) | 57 (2.1%) |
| Total | 7,531 (80.2%) | 216 (2.3%) |
Employment Occupations by Sex in Canby
Management, Business, Science and Arts Occupations
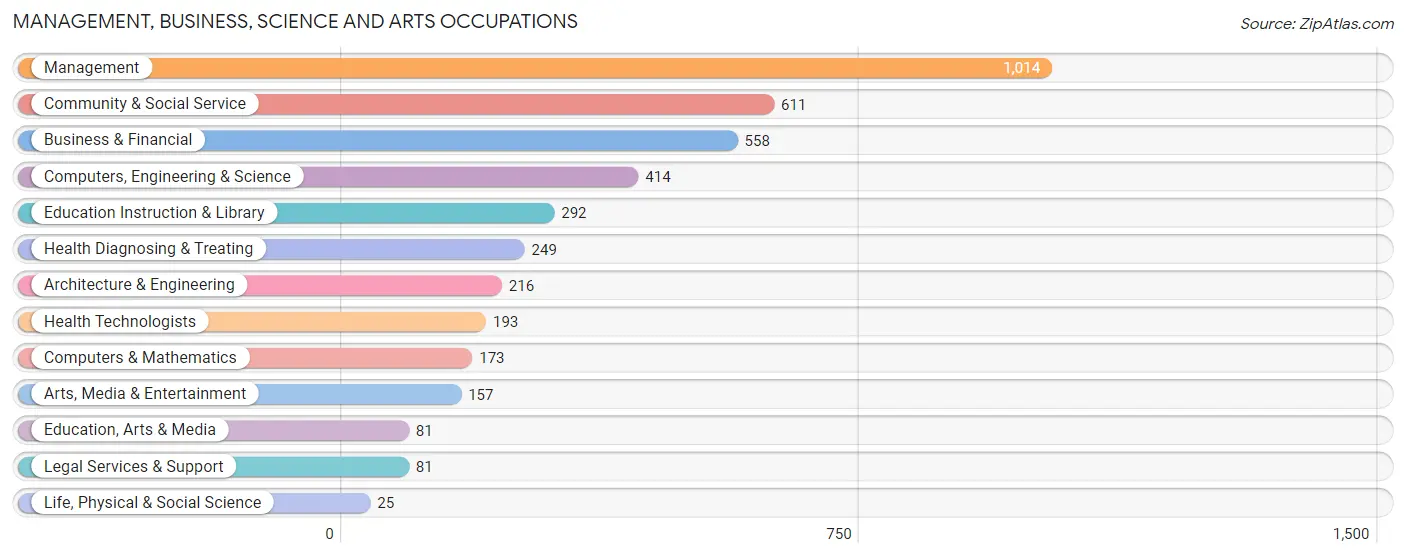
The most common Management, Business, Science and Arts occupations in Canby are Management (1,014 | 11.4%), Community & Social Service (611 | 6.9%), Business & Financial (558 | 6.3%), Computers, Engineering & Science (414 | 4.7%), and Education Instruction & Library (292 | 3.3%).
Management, Business, Science and Arts Occupations by Sex
Within the Management, Business, Science and Arts occupations in Canby, the most male-oriented occupations are Life, Physical & Social Science (100.0%), Architecture & Engineering (90.7%), and Computers, Engineering & Science (88.9%), while the most female-oriented occupations are Health Technologists (85.5%), Health Diagnosing & Treating (80.7%), and Education Instruction & Library (76.4%).
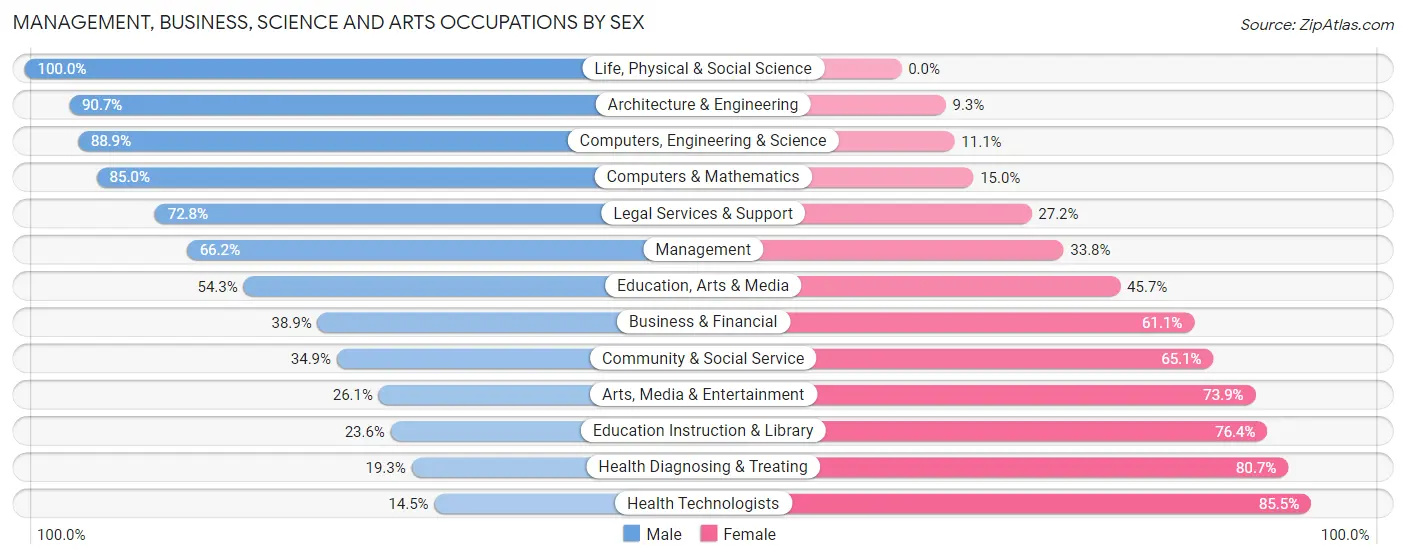
| Occupation | Male | Female |
| Management | 671 (66.2%) | 343 (33.8%) |
| Business & Financial | 217 (38.9%) | 341 (61.1%) |
| Computers, Engineering & Science | 368 (88.9%) | 46 (11.1%) |
| Computers & Mathematics | 147 (85.0%) | 26 (15.0%) |
| Architecture & Engineering | 196 (90.7%) | 20 (9.3%) |
| Life, Physical & Social Science | 25 (100.0%) | 0 (0.0%) |
| Community & Social Service | 213 (34.9%) | 398 (65.1%) |
| Education, Arts & Media | 44 (54.3%) | 37 (45.7%) |
| Legal Services & Support | 59 (72.8%) | 22 (27.2%) |
| Education Instruction & Library | 69 (23.6%) | 223 (76.4%) |
| Arts, Media & Entertainment | 41 (26.1%) | 116 (73.9%) |
| Health Diagnosing & Treating | 48 (19.3%) | 201 (80.7%) |
| Health Technologists | 28 (14.5%) | 165 (85.5%) |
| Total (Category) | 1,517 (53.3%) | 1,329 (46.7%) |
| Total (Overall) | 4,931 (55.5%) | 3,949 (44.5%) |
Services Occupations
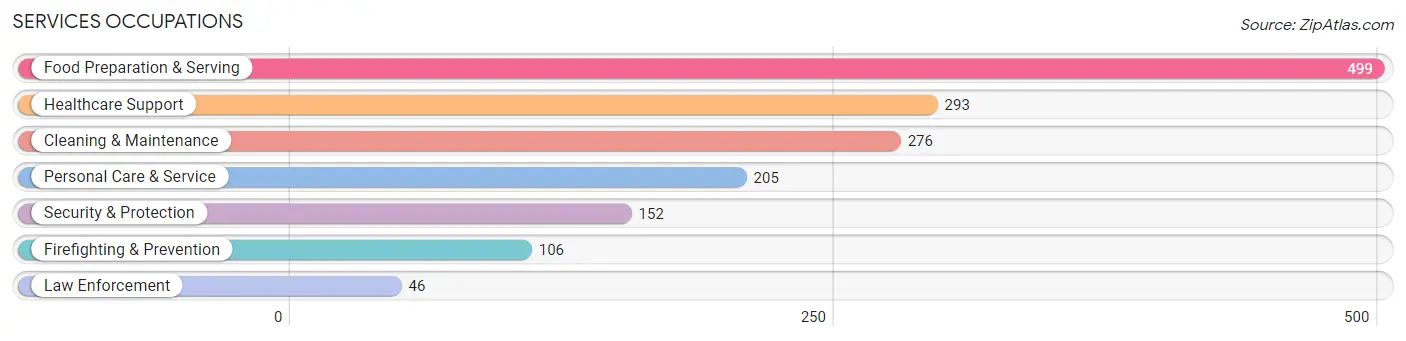
The most common Services occupations in Canby are Food Preparation & Serving (499 | 5.6%), Healthcare Support (293 | 3.3%), Cleaning & Maintenance (276 | 3.1%), Personal Care & Service (205 | 2.3%), and Security & Protection (152 | 1.7%).
Services Occupations by Sex
Within the Services occupations in Canby, the most male-oriented occupations are Cleaning & Maintenance (91.7%), Law Enforcement (56.5%), and Security & Protection (55.3%), while the most female-oriented occupations are Healthcare Support (93.2%), Personal Care & Service (92.2%), and Food Preparation & Serving (78.4%).
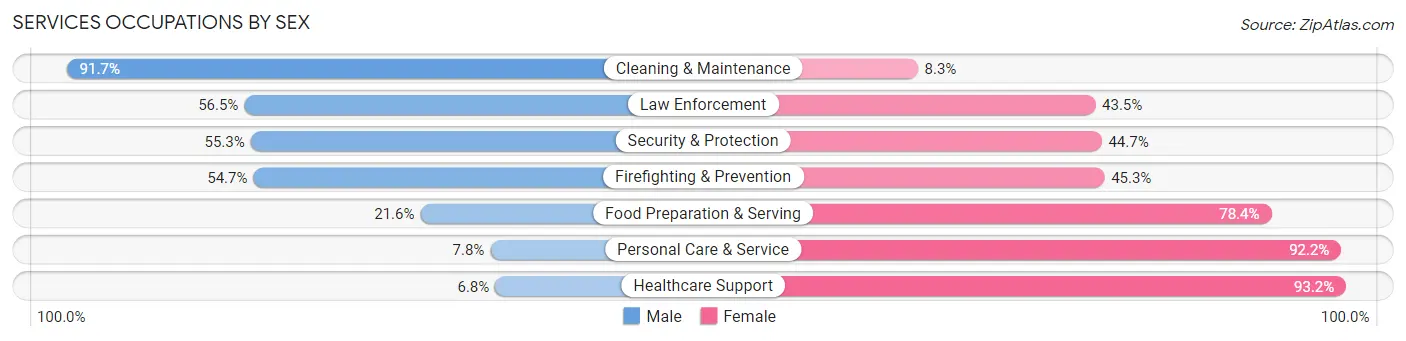
| Occupation | Male | Female |
| Healthcare Support | 20 (6.8%) | 273 (93.2%) |
| Security & Protection | 84 (55.3%) | 68 (44.7%) |
| Firefighting & Prevention | 58 (54.7%) | 48 (45.3%) |
| Law Enforcement | 26 (56.5%) | 20 (43.5%) |
| Food Preparation & Serving | 108 (21.6%) | 391 (78.4%) |
| Cleaning & Maintenance | 253 (91.7%) | 23 (8.3%) |
| Personal Care & Service | 16 (7.8%) | 189 (92.2%) |
| Total (Category) | 481 (33.8%) | 944 (66.2%) |
| Total (Overall) | 4,931 (55.5%) | 3,949 (44.5%) |
Sales and Office Occupations
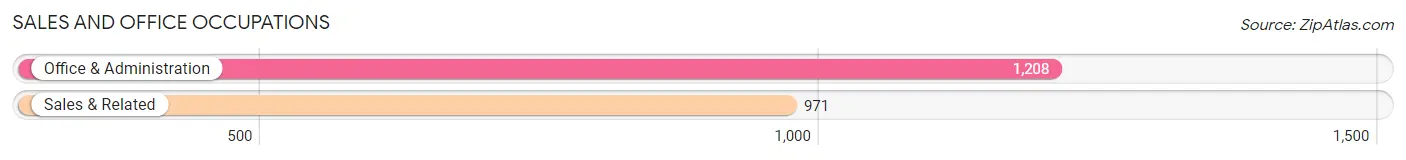
The most common Sales and Office occupations in Canby are Office & Administration (1,208 | 13.6%), and Sales & Related (971 | 10.9%).
Sales and Office Occupations by Sex
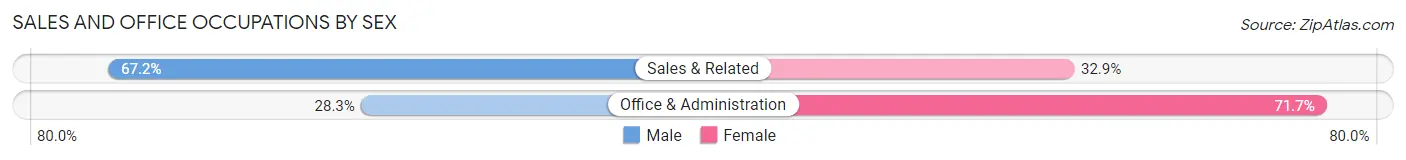
| Occupation | Male | Female |
| Sales & Related | 652 (67.1%) | 319 (32.9%) |
| Office & Administration | 342 (28.3%) | 866 (71.7%) |
| Total (Category) | 994 (45.6%) | 1,185 (54.4%) |
| Total (Overall) | 4,931 (55.5%) | 3,949 (44.5%) |
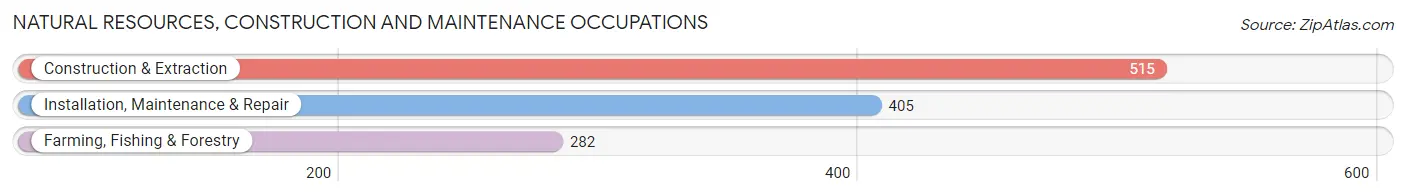
Natural Resources, Construction and Maintenance Occupations
The most common Natural Resources, Construction and Maintenance occupations in Canby are Construction & Extraction (515 | 5.8%), Installation, Maintenance & Repair (405 | 4.6%), and Farming, Fishing & Forestry (282 | 3.2%).
Natural Resources, Construction and Maintenance Occupations by Sex
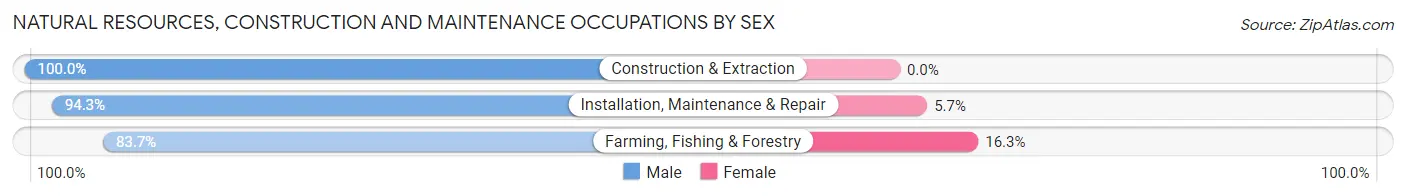
| Occupation | Male | Female |
| Farming, Fishing & Forestry | 236 (83.7%) | 46 (16.3%) |
| Construction & Extraction | 515 (100.0%) | 0 (0.0%) |
| Installation, Maintenance & Repair | 382 (94.3%) | 23 (5.7%) |
| Total (Category) | 1,133 (94.3%) | 69 (5.7%) |
| Total (Overall) | 4,931 (55.5%) | 3,949 (44.5%) |
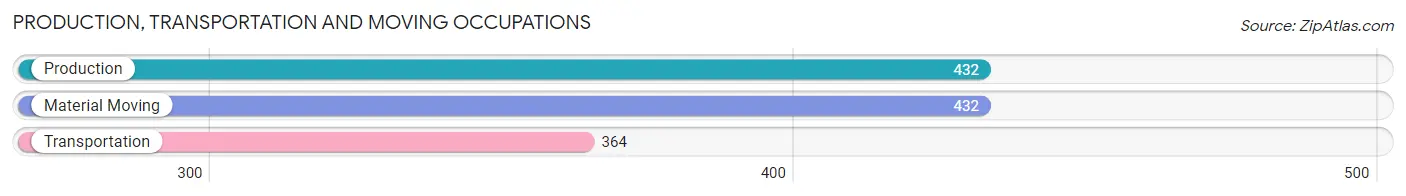
Production, Transportation and Moving Occupations
The most common Production, Transportation and Moving occupations in Canby are Production (432 | 4.9%), Material Moving (432 | 4.9%), and Transportation (364 | 4.1%).
Production, Transportation and Moving Occupations by Sex
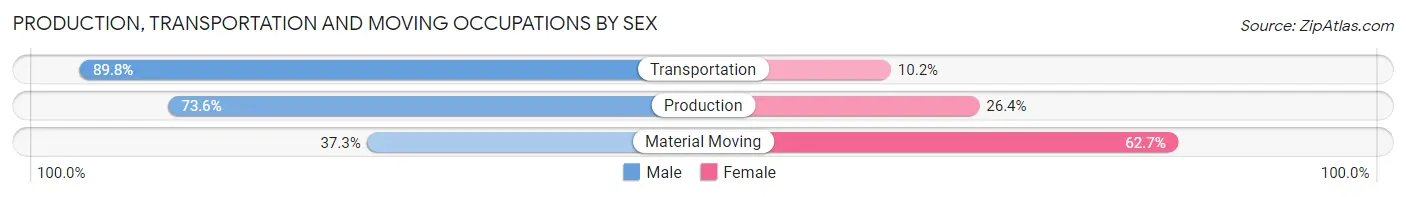
| Occupation | Male | Female |
| Production | 318 (73.6%) | 114 (26.4%) |
| Transportation | 327 (89.8%) | 37 (10.2%) |
| Material Moving | 161 (37.3%) | 271 (62.7%) |
| Total (Category) | 806 (65.6%) | 422 (34.4%) |
| Total (Overall) | 4,931 (55.5%) | 3,949 (44.5%) |
Employment Industries by Sex in Canby
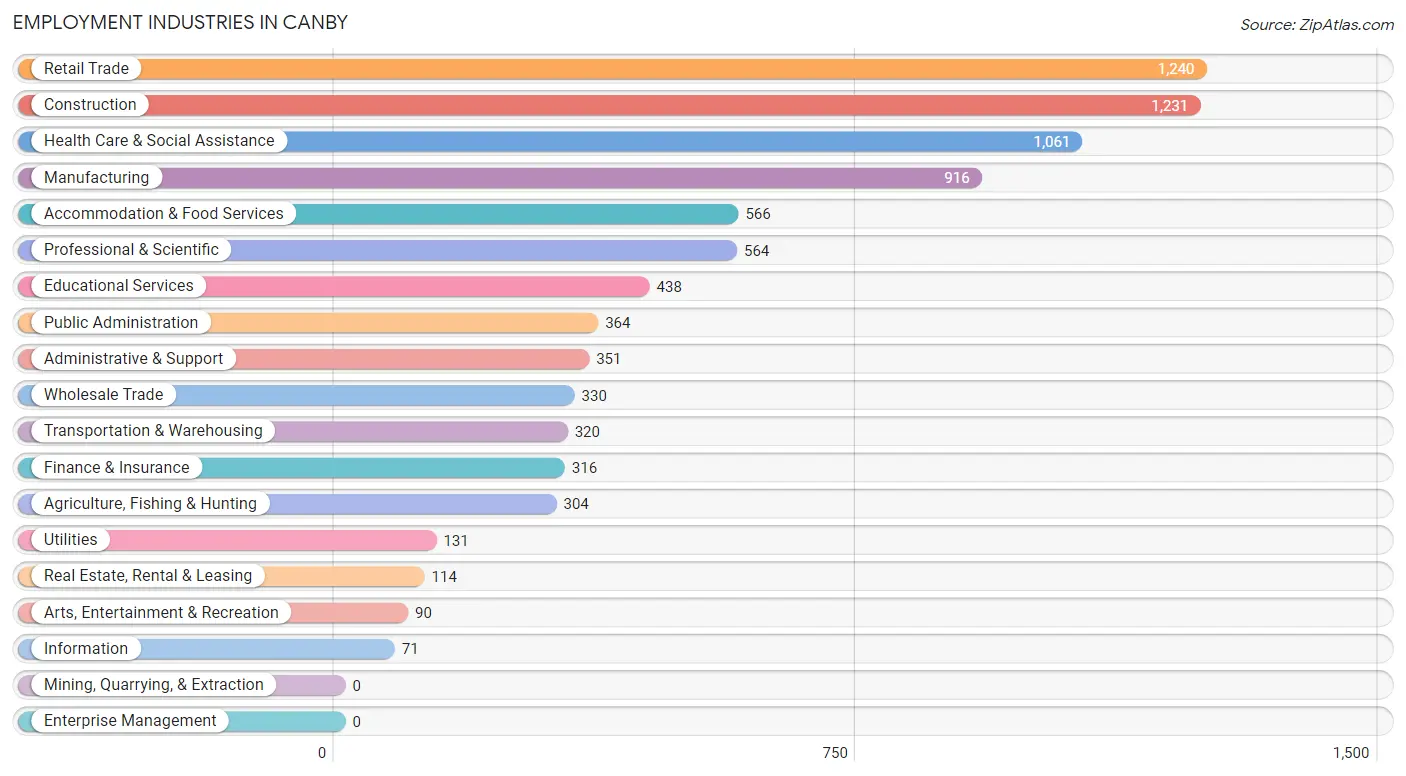
Employment Industries in Canby
The major employment industries in Canby include Retail Trade (1,240 | 14.0%), Construction (1,231 | 13.9%), Health Care & Social Assistance (1,061 | 11.9%), Manufacturing (916 | 10.3%), and Accommodation & Food Services (566 | 6.4%).
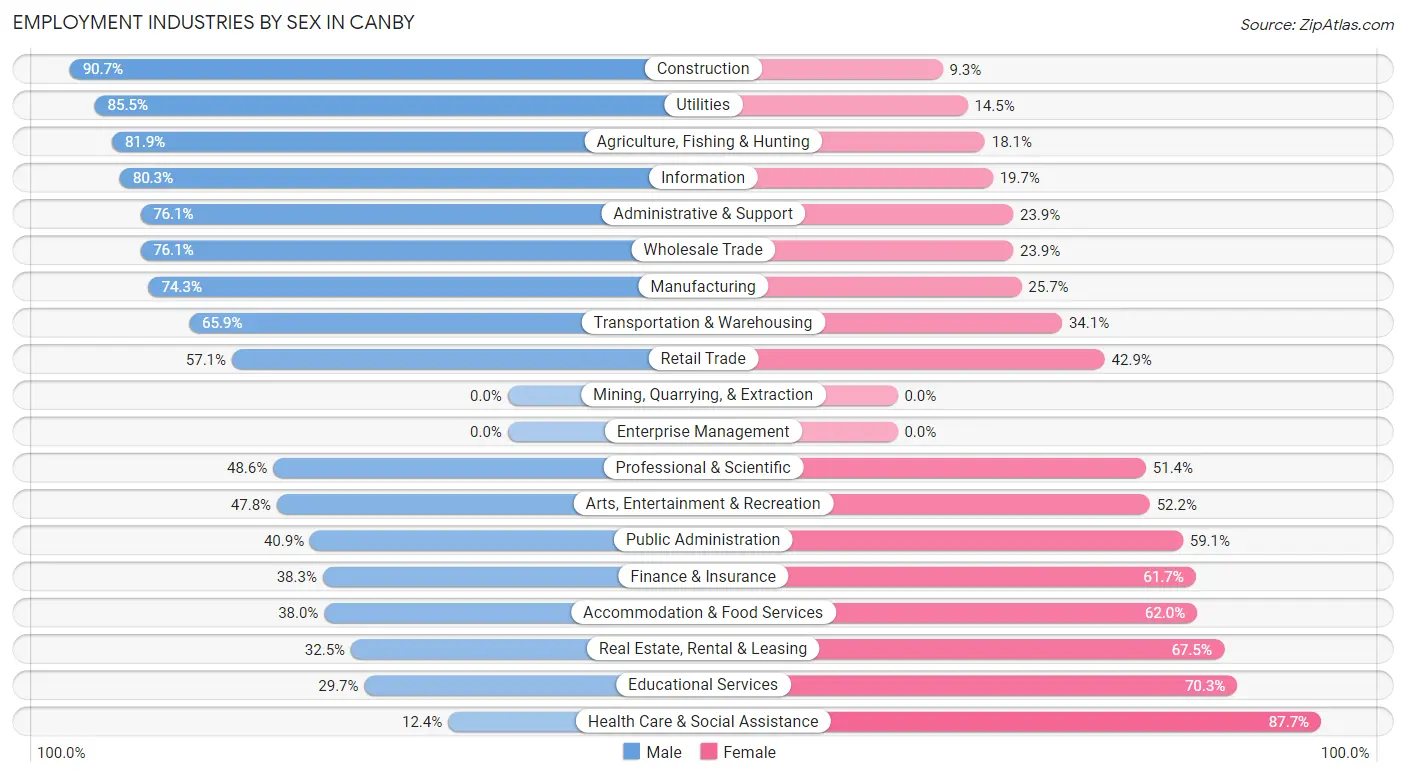
Employment Industries by Sex in Canby
The Canby industries that see more men than women are Construction (90.7%), Utilities (85.5%), and Agriculture, Fishing & Hunting (81.9%), whereas the industries that tend to have a higher number of women are Health Care & Social Assistance (87.6%), Educational Services (70.3%), and Real Estate, Rental & Leasing (67.5%).
| Industry | Male | Female |
| Agriculture, Fishing & Hunting | 249 (81.9%) | 55 (18.1%) |
| Mining, Quarrying, & Extraction | 0 (0.0%) | 0 (0.0%) |
| Construction | 1,116 (90.7%) | 115 (9.3%) |
| Manufacturing | 681 (74.3%) | 235 (25.7%) |
| Wholesale Trade | 251 (76.1%) | 79 (23.9%) |
| Retail Trade | 708 (57.1%) | 532 (42.9%) |
| Transportation & Warehousing | 211 (65.9%) | 109 (34.1%) |
| Utilities | 112 (85.5%) | 19 (14.5%) |
| Information | 57 (80.3%) | 14 (19.7%) |
| Finance & Insurance | 121 (38.3%) | 195 (61.7%) |
| Real Estate, Rental & Leasing | 37 (32.5%) | 77 (67.5%) |
| Professional & Scientific | 274 (48.6%) | 290 (51.4%) |
| Enterprise Management | 0 (0.0%) | 0 (0.0%) |
| Administrative & Support | 267 (76.1%) | 84 (23.9%) |
| Educational Services | 130 (29.7%) | 308 (70.3%) |
| Health Care & Social Assistance | 131 (12.3%) | 930 (87.6%) |
| Arts, Entertainment & Recreation | 43 (47.8%) | 47 (52.2%) |
| Accommodation & Food Services | 215 (38.0%) | 351 (62.0%) |
| Public Administration | 149 (40.9%) | 215 (59.1%) |
| Total | 4,931 (55.5%) | 3,949 (44.5%) |
Education in Canby
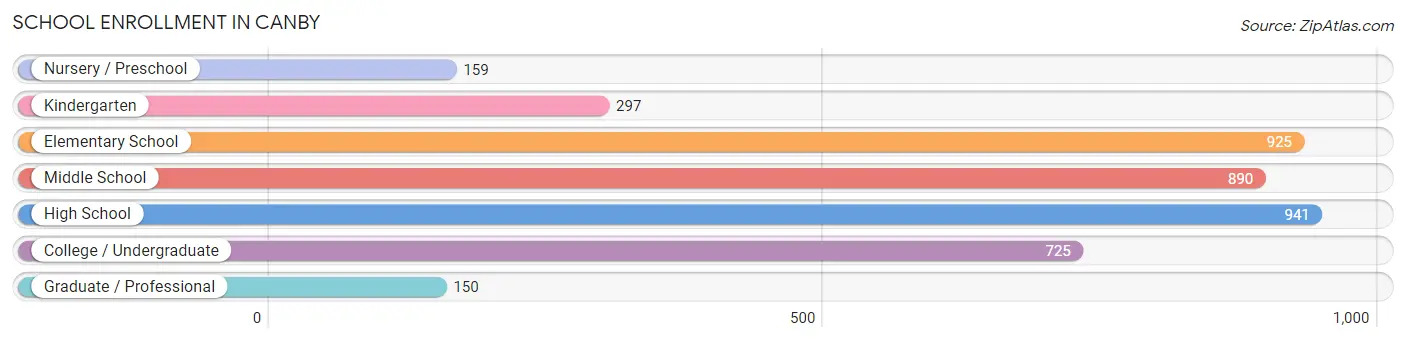
School Enrollment in Canby
The most common levels of schooling among the 4,087 students in Canby are high school (941 | 23.0%), elementary school (925 | 22.6%), and middle school (890 | 21.8%).
| School Level | # Students | % Students |
| Nursery / Preschool | 159 | 3.9% |
| Kindergarten | 297 | 7.3% |
| Elementary School | 925 | 22.6% |
| Middle School | 890 | 21.8% |
| High School | 941 | 23.0% |
| College / Undergraduate | 725 | 17.7% |
| Graduate / Professional | 150 | 3.7% |
| Total | 4,087 | 100.0% |
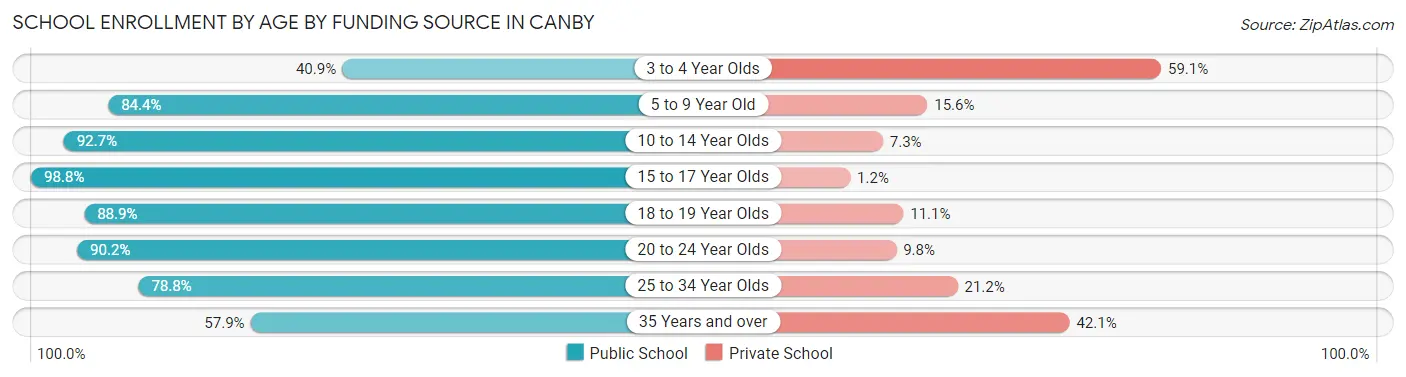
School Enrollment by Age by Funding Source in Canby
Out of a total of 4,087 students who are enrolled in schools in Canby, 503 (12.3%) attend a private institution, while the remaining 3,584 (87.7%) are enrolled in public schools. The age group of 3 to 4 year olds has the highest likelihood of being enrolled in private schools, with 81 (59.1% in the age bracket) enrolled. Conversely, the age group of 15 to 17 year olds has the lowest likelihood of being enrolled in a private school, with 735 (98.8% in the age bracket) attending a public institution.
| Age Bracket | Public School | Private School |
| 3 to 4 Year Olds | 56 (40.9%) | 81 (59.1%) |
| 5 to 9 Year Old | 943 (84.4%) | 174 (15.6%) |
| 10 to 14 Year Olds | 978 (92.7%) | 77 (7.3%) |
| 15 to 17 Year Olds | 735 (98.8%) | 9 (1.2%) |
| 18 to 19 Year Olds | 312 (88.9%) | 39 (11.1%) |
| 20 to 24 Year Olds | 341 (90.2%) | 37 (9.8%) |
| 25 to 34 Year Olds | 156 (78.8%) | 42 (21.2%) |
| 35 Years and over | 62 (57.9%) | 45 (42.1%) |
| Total | 3,584 (87.7%) | 503 (12.3%) |
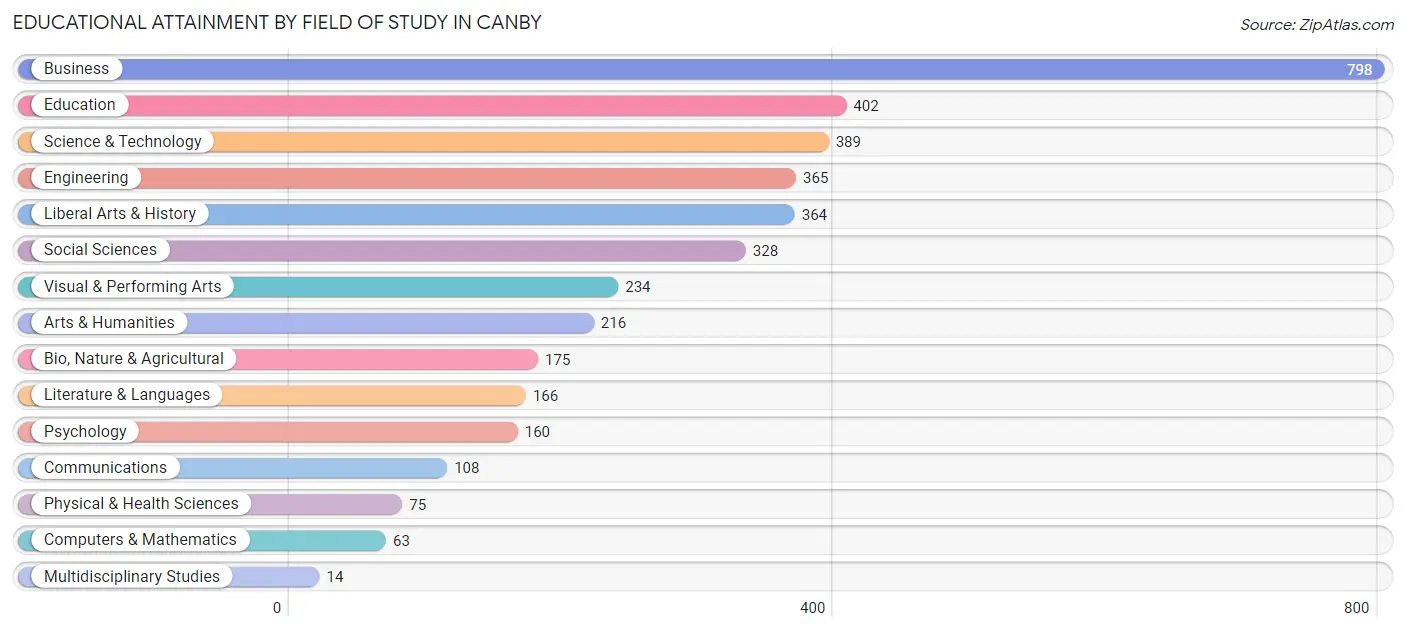
Educational Attainment by Field of Study in Canby
Business (798 | 20.7%), education (402 | 10.4%), science & technology (389 | 10.1%), engineering (365 | 9.5%), and liberal arts & history (364 | 9.4%) are the most common fields of study among 3,857 individuals in Canby who have obtained a bachelor's degree or higher.
| Field of Study | # Graduates | % Graduates |
| Computers & Mathematics | 63 | 1.6% |
| Bio, Nature & Agricultural | 175 | 4.5% |
| Physical & Health Sciences | 75 | 1.9% |
| Psychology | 160 | 4.2% |
| Social Sciences | 328 | 8.5% |
| Engineering | 365 | 9.5% |
| Multidisciplinary Studies | 14 | 0.4% |
| Science & Technology | 389 | 10.1% |
| Business | 798 | 20.7% |
| Education | 402 | 10.4% |
| Literature & Languages | 166 | 4.3% |
| Liberal Arts & History | 364 | 9.4% |
| Visual & Performing Arts | 234 | 6.1% |
| Communications | 108 | 2.8% |
| Arts & Humanities | 216 | 5.6% |
| Total | 3,857 | 100.0% |
Transportation & Commute in Canby
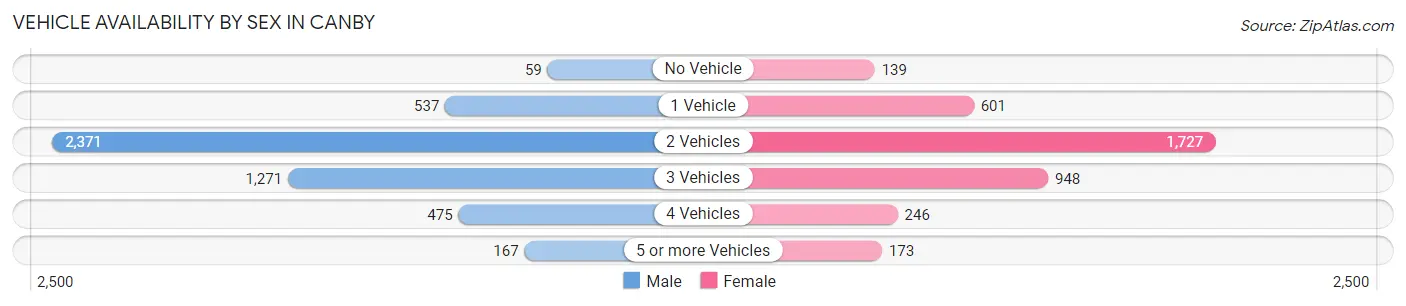
Vehicle Availability by Sex in Canby
The most prevalent vehicle ownership categories in Canby are males with 2 vehicles (2,371, accounting for 48.6%) and females with 2 vehicles (1,727, making up 61.8%).
| Vehicles Available | Male | Female |
| No Vehicle | 59 (1.2%) | 139 (3.6%) |
| 1 Vehicle | 537 (11.0%) | 601 (15.7%) |
| 2 Vehicles | 2,371 (48.6%) | 1,727 (45.0%) |
| 3 Vehicles | 1,271 (26.1%) | 948 (24.7%) |
| 4 Vehicles | 475 (9.7%) | 246 (6.4%) |
| 5 or more Vehicles | 167 (3.4%) | 173 (4.5%) |
| Total | 4,880 (100.0%) | 3,834 (100.0%) |
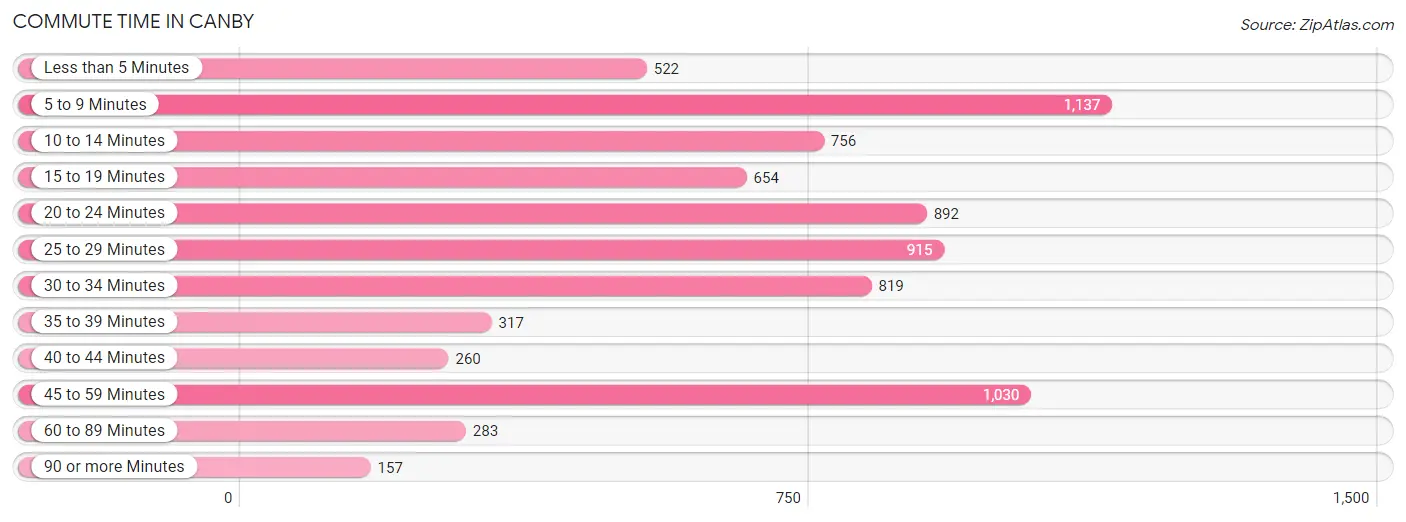
Commute Time in Canby
The most frequently occuring commute durations in Canby are 5 to 9 minutes (1,137 commuters, 14.7%), 45 to 59 minutes (1,030 commuters, 13.3%), and 25 to 29 minutes (915 commuters, 11.8%).
| Commute Time | # Commuters | % Commuters |
| Less than 5 Minutes | 522 | 6.7% |
| 5 to 9 Minutes | 1,137 | 14.7% |
| 10 to 14 Minutes | 756 | 9.8% |
| 15 to 19 Minutes | 654 | 8.5% |
| 20 to 24 Minutes | 892 | 11.5% |
| 25 to 29 Minutes | 915 | 11.8% |
| 30 to 34 Minutes | 819 | 10.6% |
| 35 to 39 Minutes | 317 | 4.1% |
| 40 to 44 Minutes | 260 | 3.4% |
| 45 to 59 Minutes | 1,030 | 13.3% |
| 60 to 89 Minutes | 283 | 3.7% |
| 90 or more Minutes | 157 | 2.0% |
Commute Time by Sex in Canby
The most common commute times in Canby are 45 to 59 minutes (660 commuters, 14.7%) for males and 5 to 9 minutes (583 commuters, 18.0%) for females.
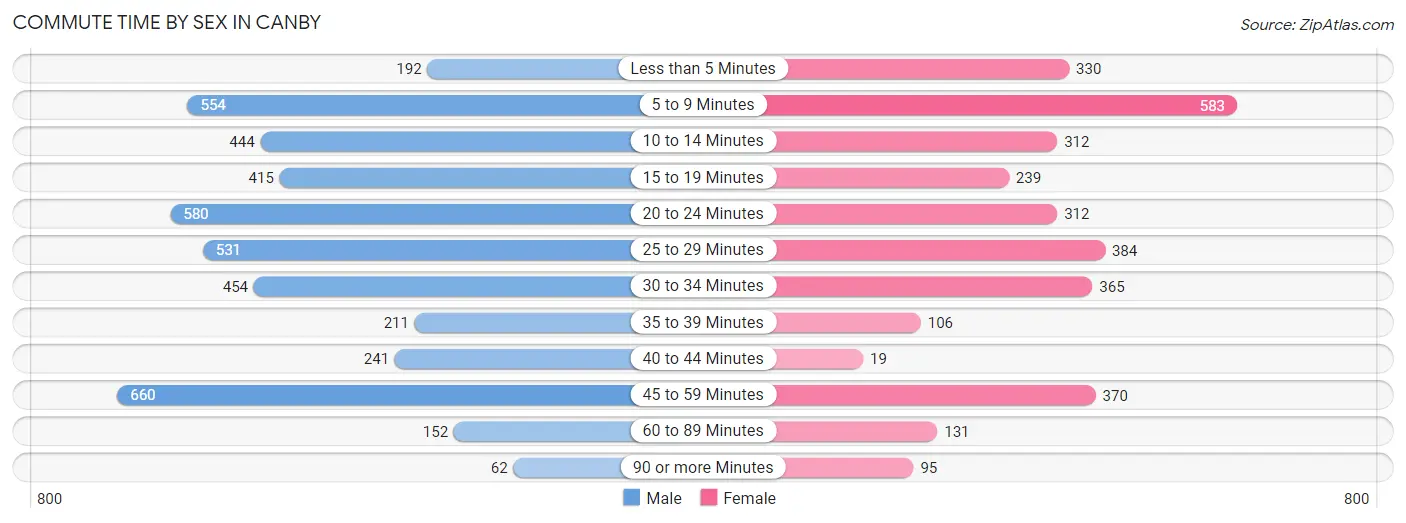
| Commute Time | Male | Female |
| Less than 5 Minutes | 192 (4.3%) | 330 (10.2%) |
| 5 to 9 Minutes | 554 (12.3%) | 583 (18.0%) |
| 10 to 14 Minutes | 444 (9.9%) | 312 (9.6%) |
| 15 to 19 Minutes | 415 (9.2%) | 239 (7.4%) |
| 20 to 24 Minutes | 580 (12.9%) | 312 (9.6%) |
| 25 to 29 Minutes | 531 (11.8%) | 384 (11.8%) |
| 30 to 34 Minutes | 454 (10.1%) | 365 (11.2%) |
| 35 to 39 Minutes | 211 (4.7%) | 106 (3.3%) |
| 40 to 44 Minutes | 241 (5.4%) | 19 (0.6%) |
| 45 to 59 Minutes | 660 (14.7%) | 370 (11.4%) |
| 60 to 89 Minutes | 152 (3.4%) | 131 (4.0%) |
| 90 or more Minutes | 62 (1.4%) | 95 (2.9%) |
Time of Departure to Work by Sex in Canby
The most frequent times of departure to work in Canby are 6:30 AM to 6:59 AM (611, 13.6%) for males and 7:30 AM to 7:59 AM (521, 16.1%) for females.
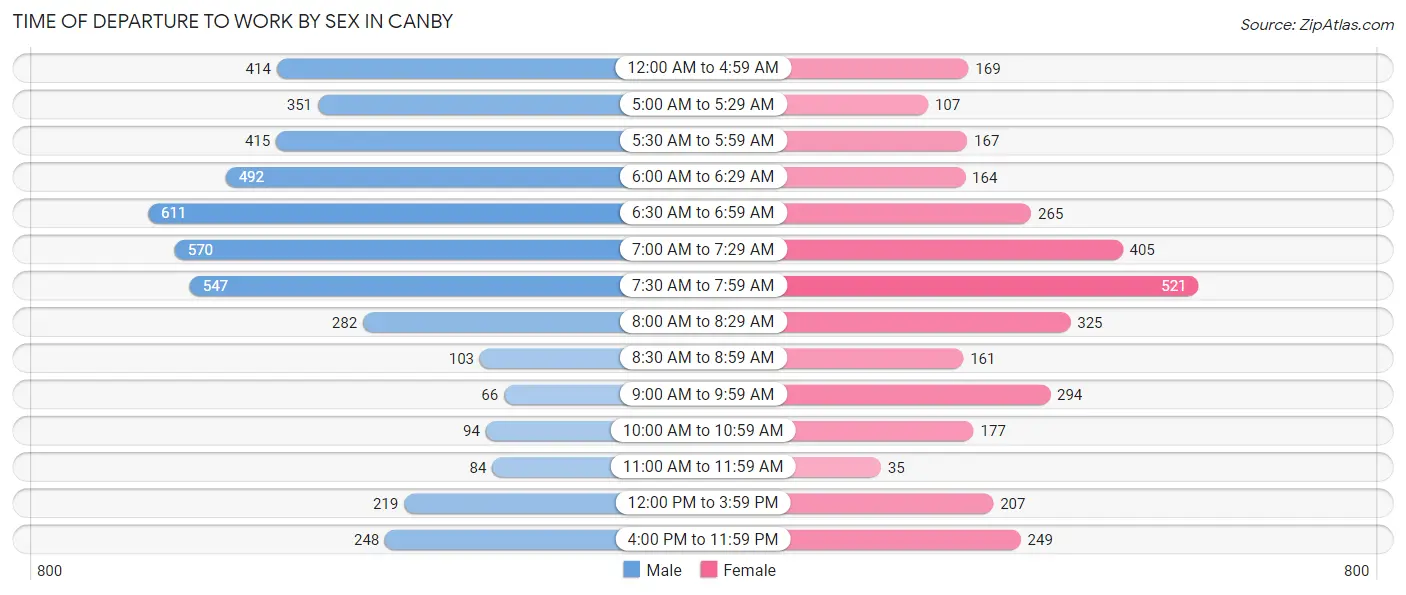
| Time of Departure | Male | Female |
| 12:00 AM to 4:59 AM | 414 (9.2%) | 169 (5.2%) |
| 5:00 AM to 5:29 AM | 351 (7.8%) | 107 (3.3%) |
| 5:30 AM to 5:59 AM | 415 (9.2%) | 167 (5.1%) |
| 6:00 AM to 6:29 AM | 492 (10.9%) | 164 (5.1%) |
| 6:30 AM to 6:59 AM | 611 (13.6%) | 265 (8.2%) |
| 7:00 AM to 7:29 AM | 570 (12.7%) | 405 (12.5%) |
| 7:30 AM to 7:59 AM | 547 (12.2%) | 521 (16.1%) |
| 8:00 AM to 8:29 AM | 282 (6.3%) | 325 (10.0%) |
| 8:30 AM to 8:59 AM | 103 (2.3%) | 161 (5.0%) |
| 9:00 AM to 9:59 AM | 66 (1.5%) | 294 (9.1%) |
| 10:00 AM to 10:59 AM | 94 (2.1%) | 177 (5.4%) |
| 11:00 AM to 11:59 AM | 84 (1.9%) | 35 (1.1%) |
| 12:00 PM to 3:59 PM | 219 (4.9%) | 207 (6.4%) |
| 4:00 PM to 11:59 PM | 248 (5.5%) | 249 (7.7%) |
| Total | 4,496 (100.0%) | 3,246 (100.0%) |
Housing Occupancy in Canby
Occupancy by Ownership in Canby
Of the total 6,836 dwellings in Canby, owner-occupied units account for 4,672 (68.3%), while renter-occupied units make up 2,164 (31.7%).
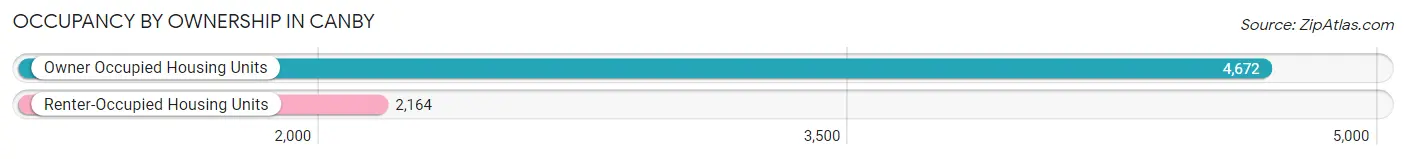
| Occupancy | # Housing Units | % Housing Units |
| Owner Occupied Housing Units | 4,672 | 68.3% |
| Renter-Occupied Housing Units | 2,164 | 31.7% |
| Total Occupied Housing Units | 6,836 | 100.0% |
Occupancy by Household Size in Canby
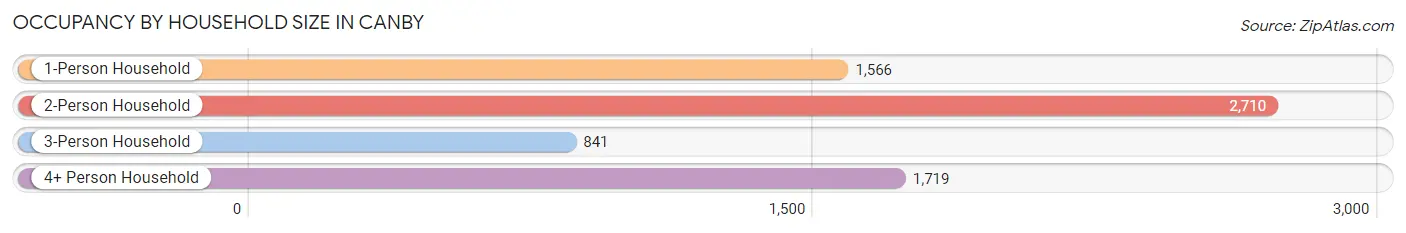
| Household Size | # Housing Units | % Housing Units |
| 1-Person Household | 1,566 | 22.9% |
| 2-Person Household | 2,710 | 39.6% |
| 3-Person Household | 841 | 12.3% |
| 4+ Person Household | 1,719 | 25.2% |
| Total Housing Units | 6,836 | 100.0% |
Occupancy by Ownership by Household Size in Canby
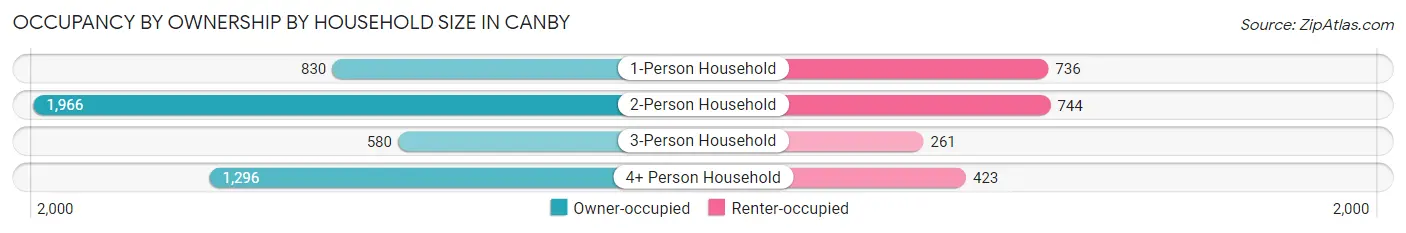
| Household Size | Owner-occupied | Renter-occupied |
| 1-Person Household | 830 (53.0%) | 736 (47.0%) |
| 2-Person Household | 1,966 (72.6%) | 744 (27.5%) |
| 3-Person Household | 580 (69.0%) | 261 (31.0%) |
| 4+ Person Household | 1,296 (75.4%) | 423 (24.6%) |
| Total Housing Units | 4,672 (68.3%) | 2,164 (31.7%) |
Occupancy by Educational Attainment in Canby
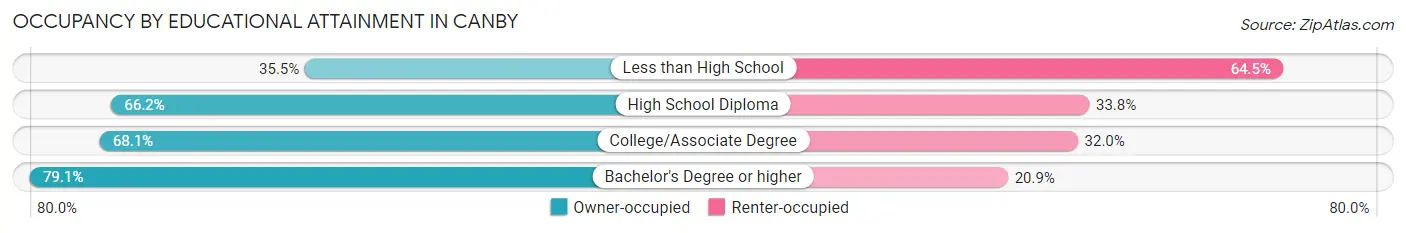
| Household Size | Owner-occupied | Renter-occupied |
| Less than High School | 207 (35.5%) | 376 (64.5%) |
| High School Diploma | 918 (66.2%) | 468 (33.8%) |
| College/Associate Degree | 1,870 (68.0%) | 878 (32.0%) |
| Bachelor's Degree or higher | 1,677 (79.1%) | 442 (20.9%) |
Occupancy by Age of Householder in Canby
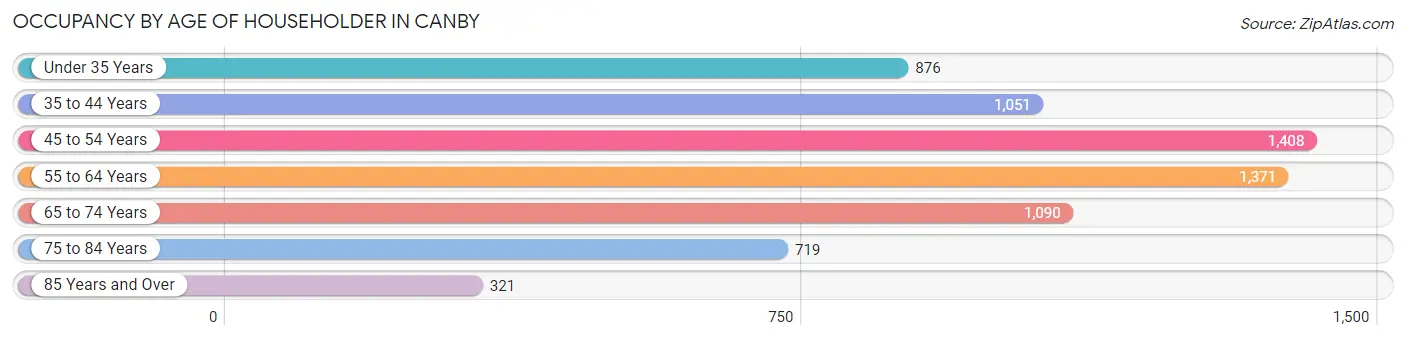
| Age Bracket | # Households | % Households |
| Under 35 Years | 876 | 12.8% |
| 35 to 44 Years | 1,051 | 15.4% |
| 45 to 54 Years | 1,408 | 20.6% |
| 55 to 64 Years | 1,371 | 20.1% |
| 65 to 74 Years | 1,090 | 15.9% |
| 75 to 84 Years | 719 | 10.5% |
| 85 Years and Over | 321 | 4.7% |
| Total | 6,836 | 100.0% |
Housing Finances in Canby
Median Income by Occupancy in Canby
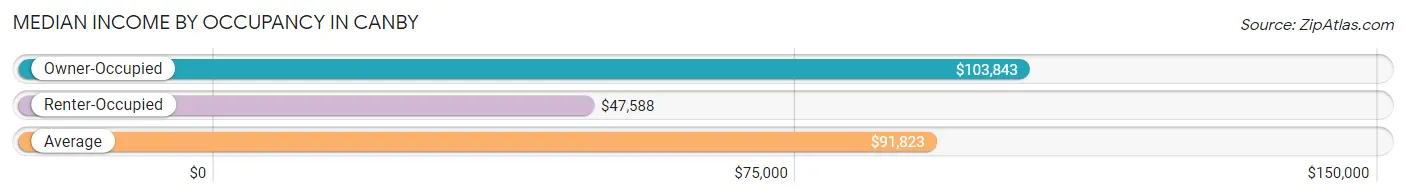
| Occupancy Type | # Households | Median Income |
| Owner-Occupied | 4,672 (68.3%) | $103,843 |
| Renter-Occupied | 2,164 (31.7%) | $47,588 |
| Average | 6,836 (100.0%) | $91,823 |
Occupancy by Householder Income Bracket in Canby
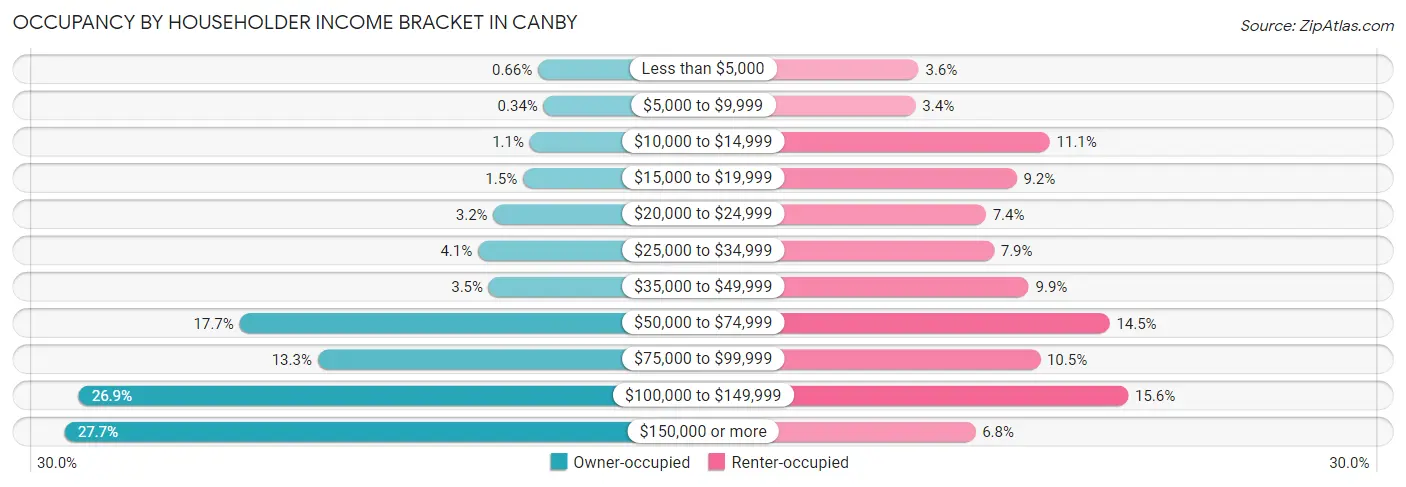
| Income Bracket | Owner-occupied | Renter-occupied |
| Less than $5,000 | 31 (0.7%) | 78 (3.6%) |
| $5,000 to $9,999 | 16 (0.3%) | 74 (3.4%) |
| $10,000 to $14,999 | 53 (1.1%) | 240 (11.1%) |
| $15,000 to $19,999 | 71 (1.5%) | 199 (9.2%) |
| $20,000 to $24,999 | 150 (3.2%) | 161 (7.4%) |
| $25,000 to $34,999 | 191 (4.1%) | 171 (7.9%) |
| $35,000 to $49,999 | 162 (3.5%) | 214 (9.9%) |
| $50,000 to $74,999 | 828 (17.7%) | 314 (14.5%) |
| $75,000 to $99,999 | 619 (13.3%) | 228 (10.5%) |
| $100,000 to $149,999 | 1,257 (26.9%) | 337 (15.6%) |
| $150,000 or more | 1,294 (27.7%) | 148 (6.8%) |
| Total | 4,672 (100.0%) | 2,164 (100.0%) |
Monthly Housing Cost Tiers in Canby
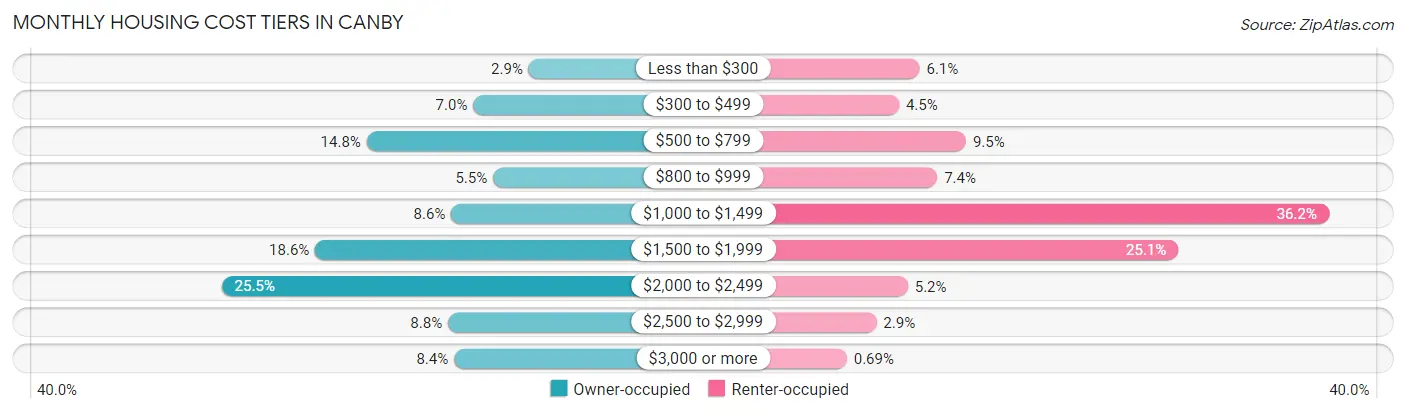
| Monthly Cost | Owner-occupied | Renter-occupied |
| Less than $300 | 134 (2.9%) | 131 (6.0%) |
| $300 to $499 | 325 (7.0%) | 98 (4.5%) |
| $500 to $799 | 692 (14.8%) | 205 (9.5%) |
| $800 to $999 | 257 (5.5%) | 159 (7.3%) |
| $1,000 to $1,499 | 401 (8.6%) | 783 (36.2%) |
| $1,500 to $1,999 | 869 (18.6%) | 543 (25.1%) |
| $2,000 to $2,499 | 1,191 (25.5%) | 112 (5.2%) |
| $2,500 to $2,999 | 412 (8.8%) | 62 (2.9%) |
| $3,000 or more | 391 (8.4%) | 15 (0.7%) |
| Total | 4,672 (100.0%) | 2,164 (100.0%) |
Physical Housing Characteristics in Canby
Housing Structures in Canby
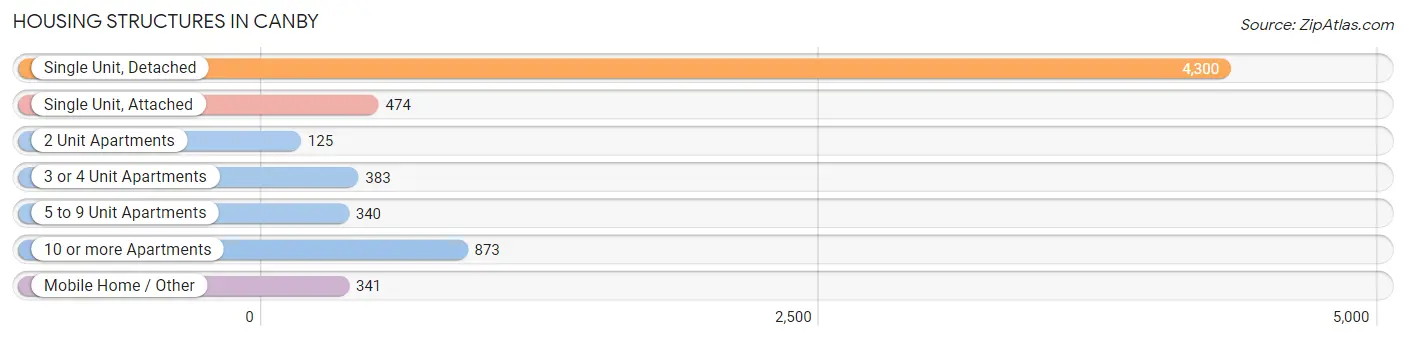
| Structure Type | # Housing Units | % Housing Units |
| Single Unit, Detached | 4,300 | 62.9% |
| Single Unit, Attached | 474 | 6.9% |
| 2 Unit Apartments | 125 | 1.8% |
| 3 or 4 Unit Apartments | 383 | 5.6% |
| 5 to 9 Unit Apartments | 340 | 5.0% |
| 10 or more Apartments | 873 | 12.8% |
| Mobile Home / Other | 341 | 5.0% |
| Total | 6,836 | 100.0% |
Housing Structures by Occupancy in Canby
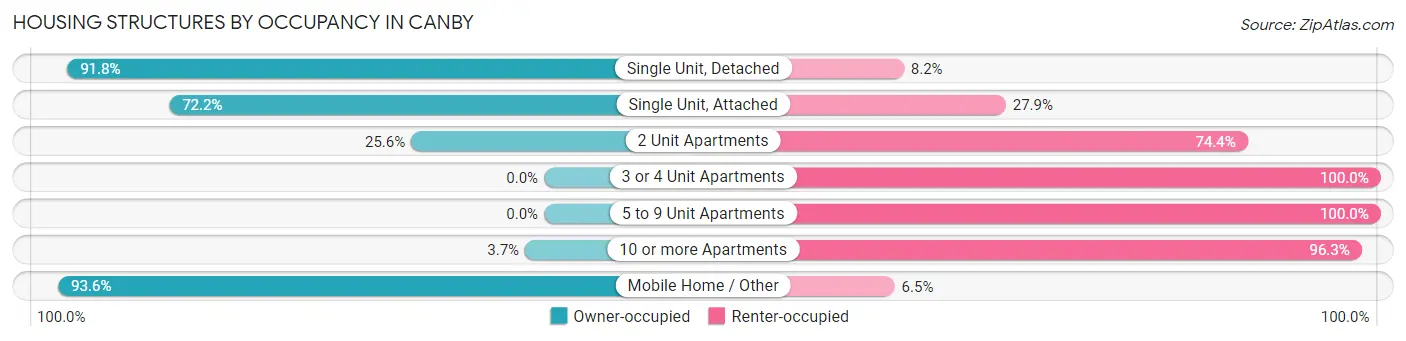
| Structure Type | Owner-occupied | Renter-occupied |
| Single Unit, Detached | 3,947 (91.8%) | 353 (8.2%) |
| Single Unit, Attached | 342 (72.2%) | 132 (27.9%) |
| 2 Unit Apartments | 32 (25.6%) | 93 (74.4%) |
| 3 or 4 Unit Apartments | 0 (0.0%) | 383 (100.0%) |
| 5 to 9 Unit Apartments | 0 (0.0%) | 340 (100.0%) |
| 10 or more Apartments | 32 (3.7%) | 841 (96.3%) |
| Mobile Home / Other | 319 (93.5%) | 22 (6.5%) |
| Total | 4,672 (68.3%) | 2,164 (31.7%) |
Housing Structures by Number of Rooms in Canby
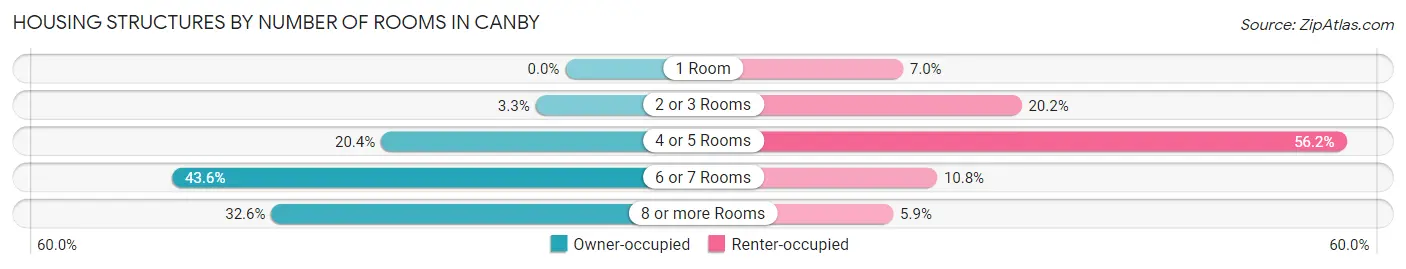
| Number of Rooms | Owner-occupied | Renter-occupied |
| 1 Room | 0 (0.0%) | 151 (7.0%) |
| 2 or 3 Rooms | 154 (3.3%) | 436 (20.2%) |
| 4 or 5 Rooms | 955 (20.4%) | 1,216 (56.2%) |
| 6 or 7 Rooms | 2,039 (43.6%) | 233 (10.8%) |
| 8 or more Rooms | 1,524 (32.6%) | 128 (5.9%) |
| Total | 4,672 (100.0%) | 2,164 (100.0%) |
Housing Structure by Heating Type in Canby
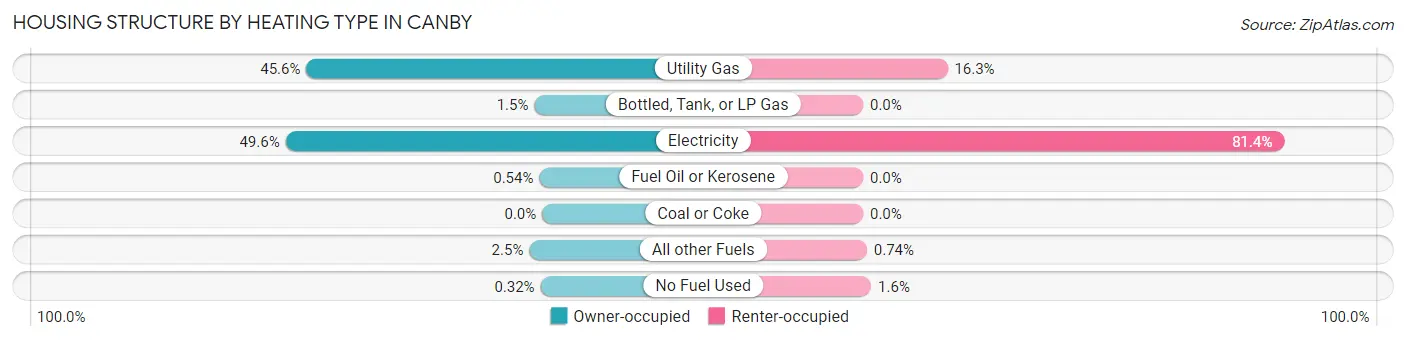
| Heating Type | Owner-occupied | Renter-occupied |
| Utility Gas | 2,129 (45.6%) | 353 (16.3%) |
| Bottled, Tank, or LP Gas | 70 (1.5%) | 0 (0.0%) |
| Electricity | 2,317 (49.6%) | 1,761 (81.4%) |
| Fuel Oil or Kerosene | 25 (0.5%) | 0 (0.0%) |
| Coal or Coke | 0 (0.0%) | 0 (0.0%) |
| All other Fuels | 116 (2.5%) | 16 (0.7%) |
| No Fuel Used | 15 (0.3%) | 34 (1.6%) |
| Total | 4,672 (100.0%) | 2,164 (100.0%) |
Household Vehicle Usage in Canby
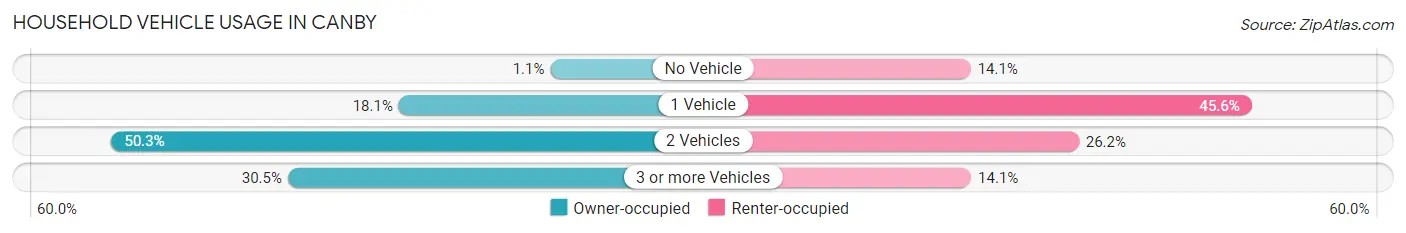
| Vehicles per Household | Owner-occupied | Renter-occupied |
| No Vehicle | 52 (1.1%) | 305 (14.1%) |
| 1 Vehicle | 845 (18.1%) | 986 (45.6%) |
| 2 Vehicles | 2,349 (50.3%) | 567 (26.2%) |
| 3 or more Vehicles | 1,426 (30.5%) | 306 (14.1%) |
| Total | 4,672 (100.0%) | 2,164 (100.0%) |
Real Estate & Mortgages in Canby
Real Estate and Mortgage Overview in Canby
| Characteristic | Without Mortgage | With Mortgage |
| Housing Units | 1,444 | 3,228 |
| Median Property Value | $405,000 | $469,400 |
| Median Household Income | $70,357 | $1,067 |
| Monthly Housing Costs | $608 | $391 |
| Real Estate Taxes | $3,509 | $49 |
Property Value by Mortgage Status in Canby
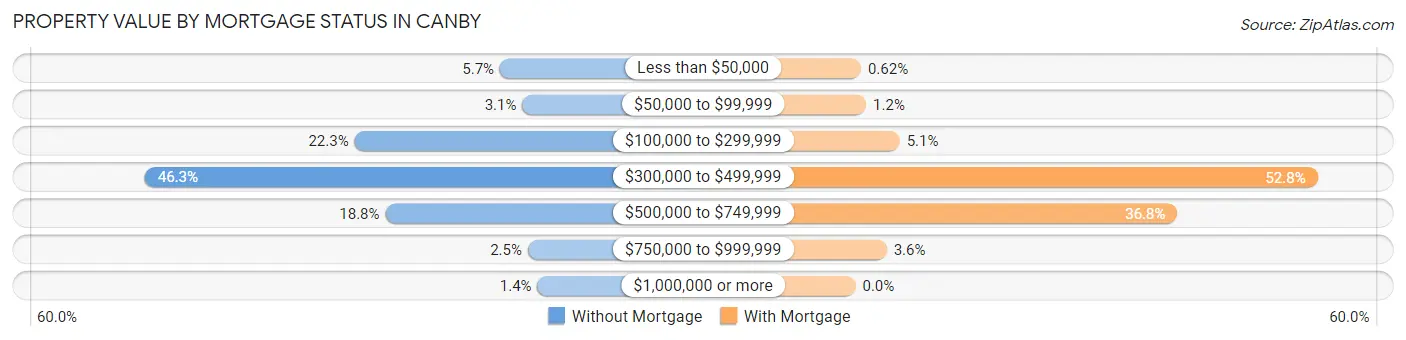
| Property Value | Without Mortgage | With Mortgage |
| Less than $50,000 | 82 (5.7%) | 20 (0.6%) |
| $50,000 to $99,999 | 45 (3.1%) | 39 (1.2%) |
| $100,000 to $299,999 | 322 (22.3%) | 163 (5.1%) |
| $300,000 to $499,999 | 668 (46.3%) | 1,704 (52.8%) |
| $500,000 to $749,999 | 271 (18.8%) | 1,187 (36.8%) |
| $750,000 to $999,999 | 36 (2.5%) | 115 (3.6%) |
| $1,000,000 or more | 20 (1.4%) | 0 (0.0%) |
| Total | 1,444 (100.0%) | 3,228 (100.0%) |
Household Income by Mortgage Status in Canby
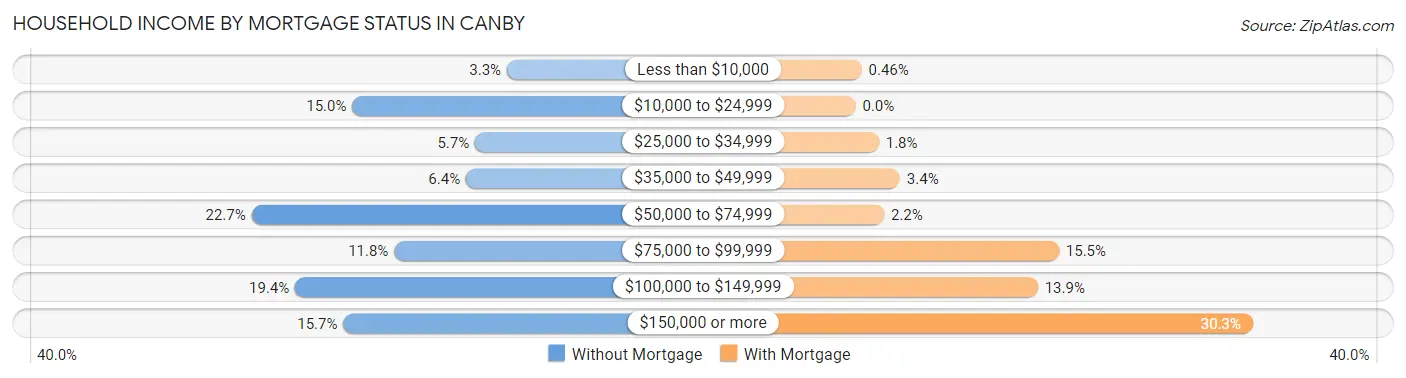
| Household Income | Without Mortgage | With Mortgage |
| Less than $10,000 | 47 (3.3%) | 15 (0.5%) |
| $10,000 to $24,999 | 217 (15.0%) | 0 (0.0%) |
| $25,000 to $34,999 | 82 (5.7%) | 57 (1.8%) |
| $35,000 to $49,999 | 92 (6.4%) | 109 (3.4%) |
| $50,000 to $74,999 | 328 (22.7%) | 70 (2.2%) |
| $75,000 to $99,999 | 171 (11.8%) | 500 (15.5%) |
| $100,000 to $149,999 | 280 (19.4%) | 448 (13.9%) |
| $150,000 or more | 227 (15.7%) | 977 (30.3%) |
| Total | 1,444 (100.0%) | 3,228 (100.0%) |
Property Value to Household Income Ratio in Canby
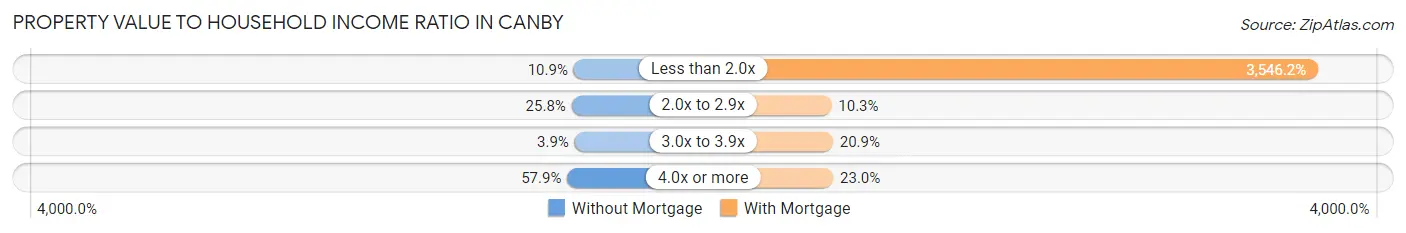
| Value-to-Income Ratio | Without Mortgage | With Mortgage |
| Less than 2.0x | 157 (10.9%) | 114,472 (3,546.2%) |
| 2.0x to 2.9x | 373 (25.8%) | 333 (10.3%) |
| 3.0x to 3.9x | 56 (3.9%) | 673 (20.8%) |
| 4.0x or more | 836 (57.9%) | 743 (23.0%) |
| Total | 1,444 (100.0%) | 3,228 (100.0%) |
Real Estate Taxes by Mortgage Status in Canby
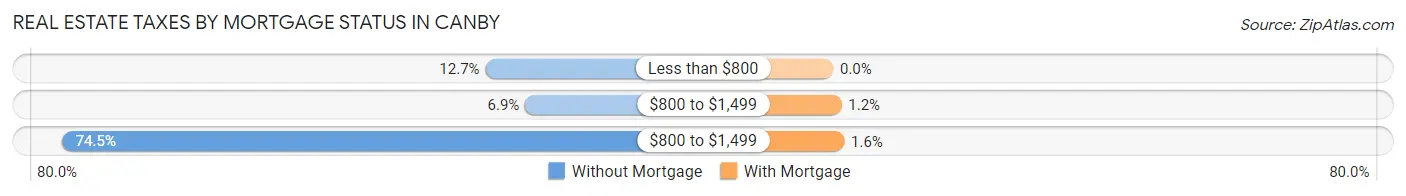
| Property Taxes | Without Mortgage | With Mortgage |
| Less than $800 | 183 (12.7%) | 0 (0.0%) |
| $800 to $1,499 | 99 (6.9%) | 39 (1.2%) |
| $800 to $1,499 | 1,075 (74.5%) | 52 (1.6%) |
| Total | 1,444 (100.0%) | 3,228 (100.0%) |
Health & Disability in Canby
Health Insurance Coverage by Age in Canby
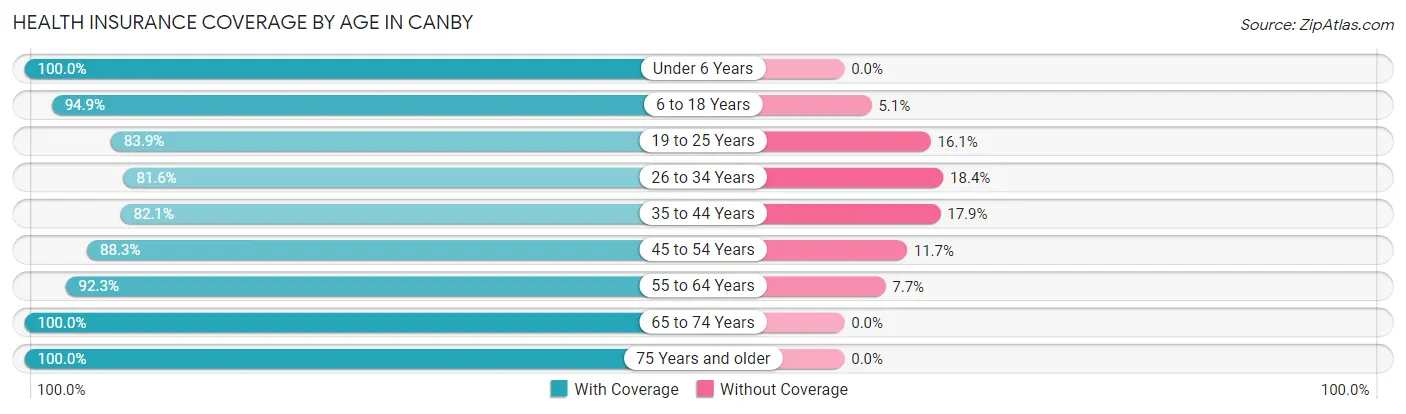
| Age Bracket | With Coverage | Without Coverage |
| Under 6 Years | 1,007 (100.0%) | 0 (0.0%) |
| 6 to 18 Years | 3,003 (94.9%) | 160 (5.1%) |
| 19 to 25 Years | 1,120 (83.9%) | 215 (16.1%) |
| 26 to 34 Years | 1,672 (81.6%) | 378 (18.4%) |
| 35 to 44 Years | 1,830 (82.1%) | 399 (17.9%) |
| 45 to 54 Years | 2,219 (88.3%) | 293 (11.7%) |
| 55 to 64 Years | 2,242 (92.3%) | 186 (7.7%) |
| 65 to 74 Years | 1,795 (100.0%) | 0 (0.0%) |
| 75 Years and older | 1,492 (100.0%) | 0 (0.0%) |
| Total | 16,380 (90.9%) | 1,631 (9.1%) |
Health Insurance Coverage by Citizenship Status in Canby
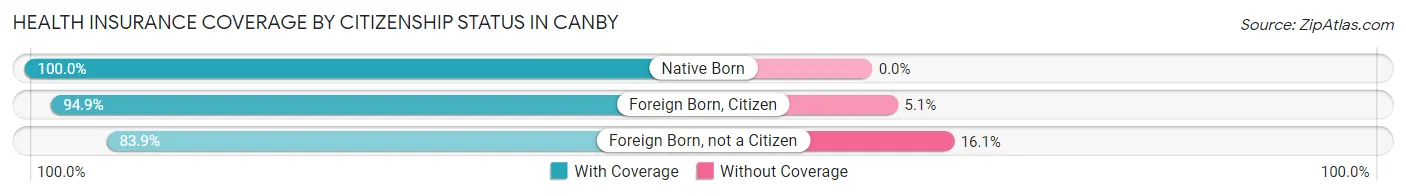
| Citizenship Status | With Coverage | Without Coverage |
| Native Born | 1,007 (100.0%) | 0 (0.0%) |
| Foreign Born, Citizen | 3,003 (94.9%) | 160 (5.1%) |
| Foreign Born, not a Citizen | 1,120 (83.9%) | 215 (16.1%) |
Health Insurance Coverage by Household Income in Canby
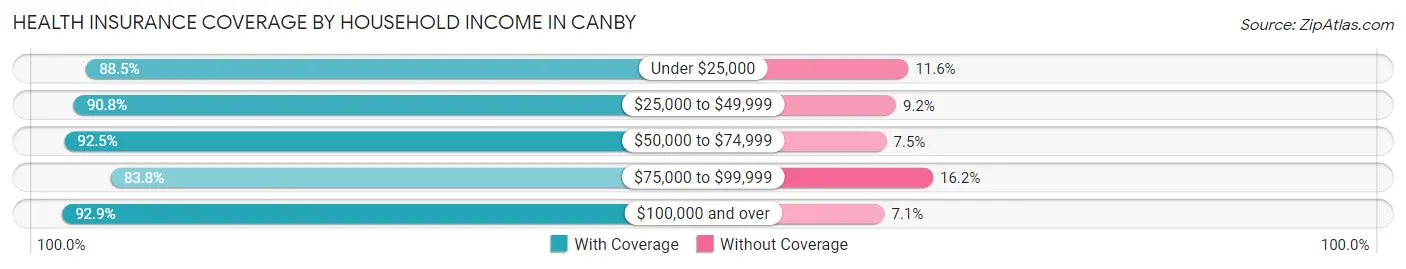
| Household Income | With Coverage | Without Coverage |
| Under $25,000 | 1,448 (88.4%) | 189 (11.6%) |
| $25,000 to $49,999 | 1,701 (90.8%) | 173 (9.2%) |
| $50,000 to $74,999 | 2,197 (92.5%) | 177 (7.5%) |
| $75,000 to $99,999 | 2,195 (83.8%) | 423 (16.2%) |
| $100,000 and over | 8,810 (92.9%) | 669 (7.1%) |
Public vs Private Health Insurance Coverage by Age in Canby
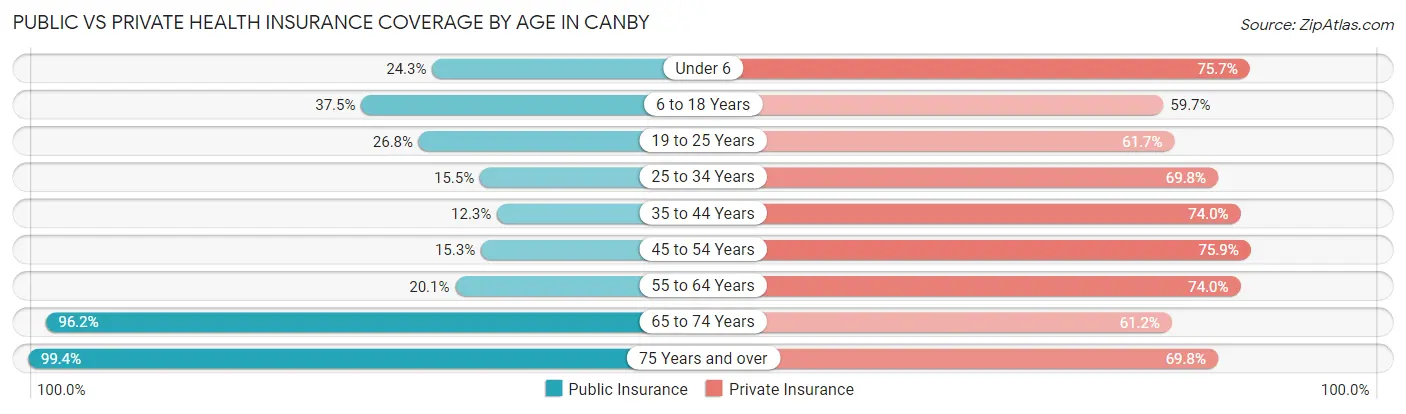
| Age Bracket | Public Insurance | Private Insurance |
| Under 6 | 245 (24.3%) | 762 (75.7%) |
| 6 to 18 Years | 1,186 (37.5%) | 1,888 (59.7%) |
| 19 to 25 Years | 358 (26.8%) | 824 (61.7%) |
| 25 to 34 Years | 317 (15.5%) | 1,431 (69.8%) |
| 35 to 44 Years | 274 (12.3%) | 1,649 (74.0%) |
| 45 to 54 Years | 384 (15.3%) | 1,906 (75.9%) |
| 55 to 64 Years | 487 (20.1%) | 1,796 (74.0%) |
| 65 to 74 Years | 1,726 (96.2%) | 1,099 (61.2%) |
| 75 Years and over | 1,483 (99.4%) | 1,041 (69.8%) |
| Total | 6,460 (35.9%) | 12,396 (68.8%) |
Disability Status by Sex by Age in Canby
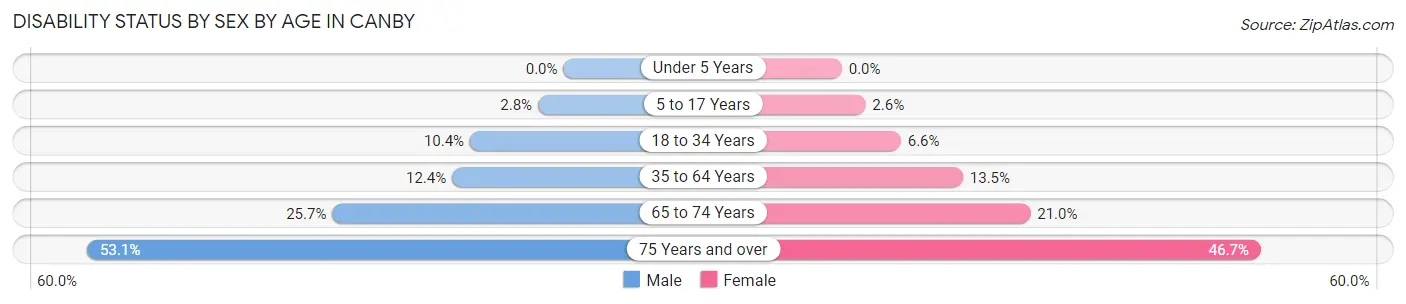
| Age Bracket | Male | Female |
| Under 5 Years | 0 (0.0%) | 0 (0.0%) |
| 5 to 17 Years | 42 (2.8%) | 44 (2.6%) |
| 18 to 34 Years | 180 (10.4%) | 120 (6.6%) |
| 35 to 64 Years | 452 (12.4%) | 475 (13.5%) |
| 65 to 74 Years | 191 (25.7%) | 221 (21.0%) |
| 75 Years and over | 330 (53.0%) | 406 (46.7%) |
Disability Class by Sex by Age in Canby
Disability Class: Hearing Difficulty
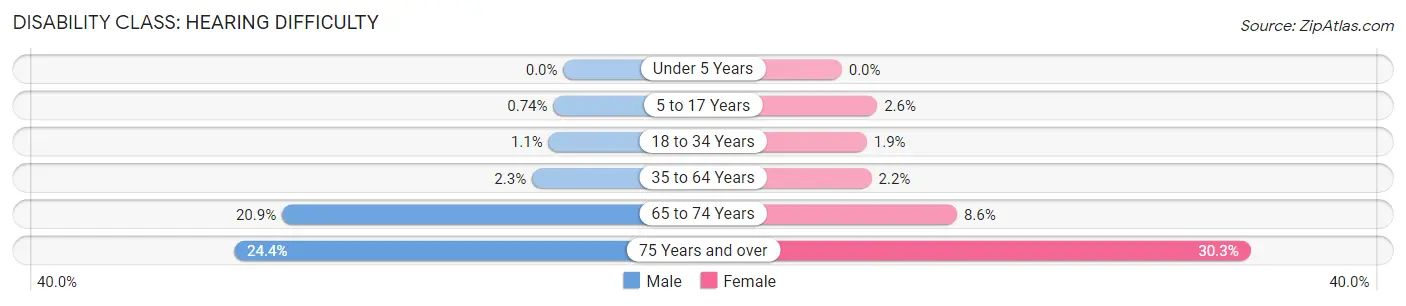
| Age Bracket | Male | Female |
| Under 5 Years | 0 (0.0%) | 0 (0.0%) |
| 5 to 17 Years | 11 (0.7%) | 44 (2.6%) |
| 18 to 34 Years | 19 (1.1%) | 34 (1.9%) |
| 35 to 64 Years | 85 (2.3%) | 78 (2.2%) |
| 65 to 74 Years | 155 (20.9%) | 90 (8.6%) |
| 75 Years and over | 152 (24.4%) | 264 (30.3%) |
Disability Class: Vision Difficulty
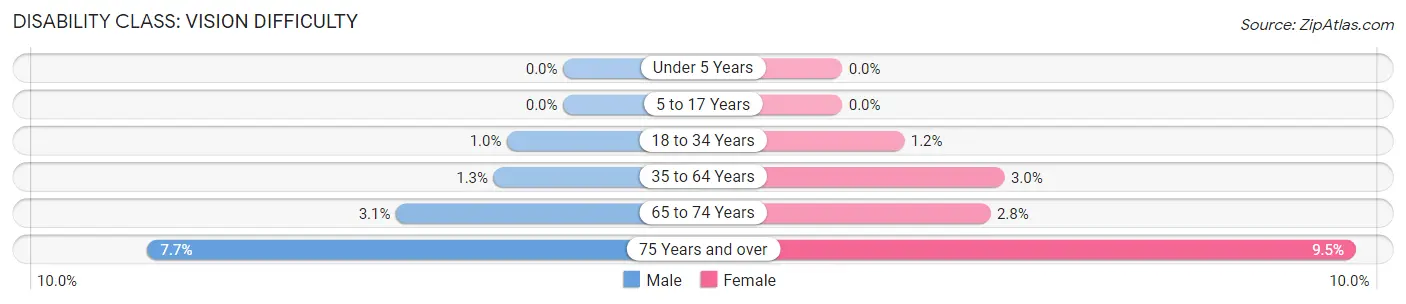
| Age Bracket | Male | Female |
| Under 5 Years | 0 (0.0%) | 0 (0.0%) |
| 5 to 17 Years | 0 (0.0%) | 0 (0.0%) |
| 18 to 34 Years | 18 (1.0%) | 21 (1.1%) |
| 35 to 64 Years | 47 (1.3%) | 106 (3.0%) |
| 65 to 74 Years | 23 (3.1%) | 29 (2.8%) |
| 75 Years and over | 48 (7.7%) | 83 (9.5%) |
Disability Class: Cognitive Difficulty
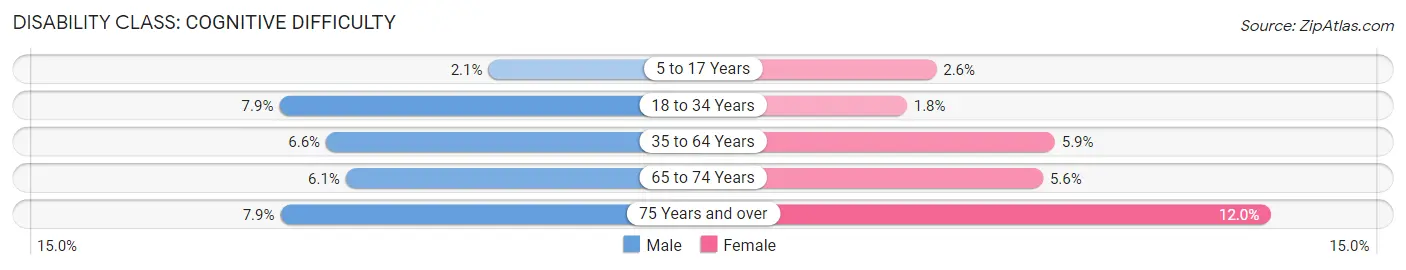
| Age Bracket | Male | Female |
| 5 to 17 Years | 31 (2.1%) | 44 (2.6%) |
| 18 to 34 Years | 137 (7.9%) | 33 (1.8%) |
| 35 to 64 Years | 241 (6.6%) | 209 (5.9%) |
| 65 to 74 Years | 45 (6.1%) | 59 (5.6%) |
| 75 Years and over | 49 (7.9%) | 104 (11.9%) |
Disability Class: Ambulatory Difficulty
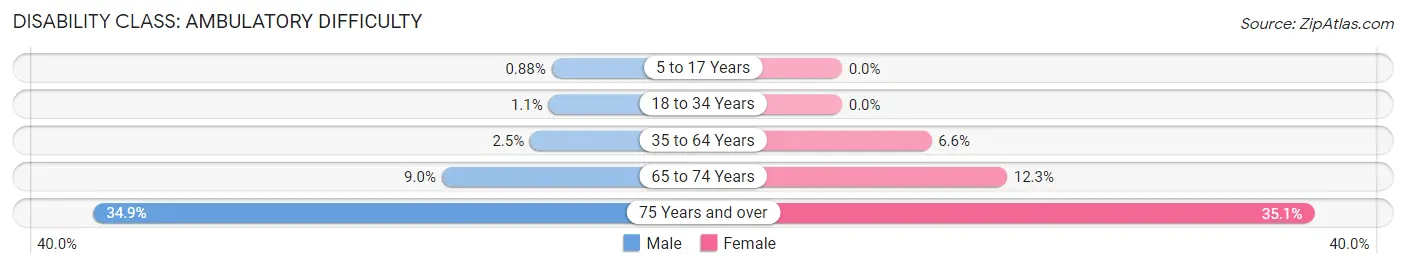
| Age Bracket | Male | Female |
| 5 to 17 Years | 13 (0.9%) | 0 (0.0%) |
| 18 to 34 Years | 19 (1.1%) | 0 (0.0%) |
| 35 to 64 Years | 90 (2.5%) | 234 (6.6%) |
| 65 to 74 Years | 67 (9.0%) | 129 (12.2%) |
| 75 Years and over | 217 (34.9%) | 305 (35.1%) |
Disability Class: Self-Care Difficulty
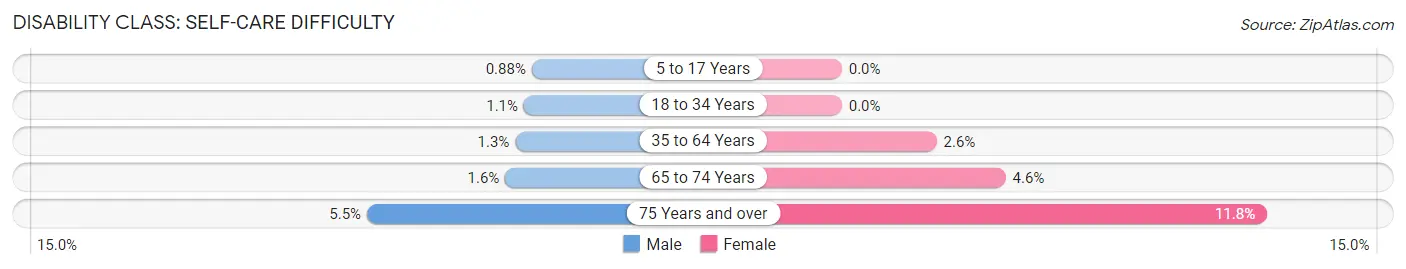
| Age Bracket | Male | Female |
| 5 to 17 Years | 13 (0.9%) | 0 (0.0%) |
| 18 to 34 Years | 19 (1.1%) | 0 (0.0%) |
| 35 to 64 Years | 49 (1.3%) | 93 (2.6%) |
| 65 to 74 Years | 12 (1.6%) | 48 (4.6%) |
| 75 Years and over | 34 (5.5%) | 103 (11.8%) |
Technology Access in Canby
Computing Device Access in Canby
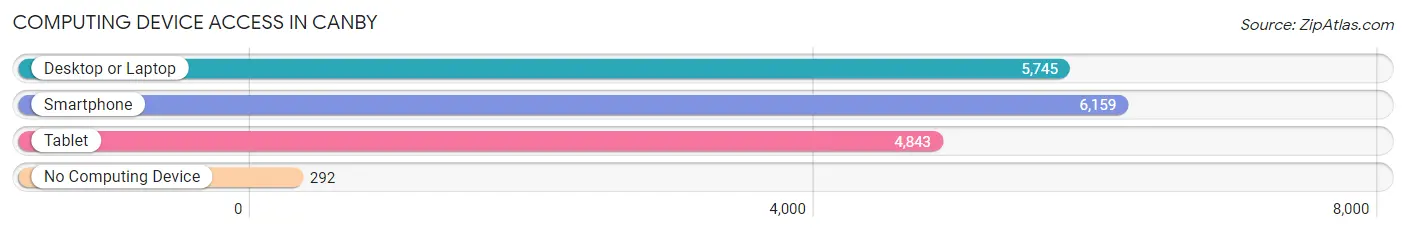
| Device Type | # Households | % Households |
| Desktop or Laptop | 5,745 | 84.0% |
| Smartphone | 6,159 | 90.1% |
| Tablet | 4,843 | 70.9% |
| No Computing Device | 292 | 4.3% |
| Total | 6,836 | 100.0% |
Internet Access in Canby
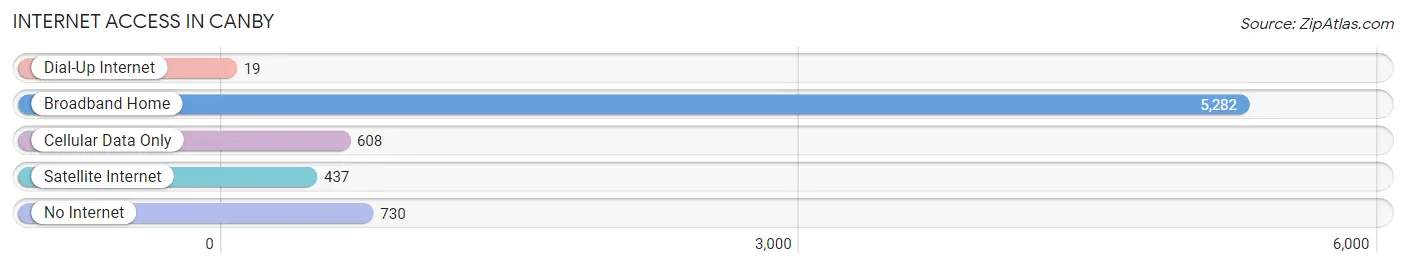
| Internet Type | # Households | % Households |
| Dial-Up Internet | 19 | 0.3% |
| Broadband Home | 5,282 | 77.3% |
| Cellular Data Only | 608 | 8.9% |
| Satellite Internet | 437 | 6.4% |
| No Internet | 730 | 10.7% |
| Total | 6,836 | 100.0% |
Canby Summary
Canby, Oregon is a small city located in Clackamas County, Oregon, United States. It is located about 20 miles south of Portland and is part of the Portland metropolitan area. The city has a population of about 17,000 people and is the second-largest city in Clackamas County.
History
Canby was founded in 1857 by a group of settlers from the Oregon Trail. The city was named after Edward Richard Canby, a Civil War general who was killed in the Modoc War. The city was incorporated in 1893 and has since grown to become the second-largest city in Clackamas County.
Geography
Canby is located in the Willamette Valley, about 20 miles south of Portland. The city is situated on the Molalla River, which flows through the city and is a popular spot for fishing and other recreational activities. The city is surrounded by rolling hills and farmland, and is home to several parks and trails.
Economy
Canby’s economy is largely based on agriculture and manufacturing. The city is home to several large farms, including the Canby Farms, which produces a variety of fruits and vegetables. The city is also home to several manufacturing companies, including the Canby Manufacturing Company, which produces a variety of products, including furniture and automotive parts.
Demographics
As of the 2010 census, Canby had a population of 17,000 people. The racial makeup of the city was 87.3% White, 1.2% African American, 0.7% Native American, 1.7% Asian, 0.2% Pacific Islander, and 6.2% from other races. The median household income was $50,000, and the median family income was $60,000.
Canby is a diverse city with a variety of cultures and backgrounds. The city is home to a large Hispanic population, as well as a growing Asian population. The city is also home to a large number of churches, including the Canby United Methodist Church, the Canby Baptist Church, and the Canby Lutheran Church.
Conclusion
Canby, Oregon is a small city located in Clackamas County, Oregon, United States. It is located about 20 miles south of Portland and is part of the Portland metropolitan area. The city has a population of about 17,000 people and is the second-largest city in Clackamas County. Canby was founded in 1857 by a group of settlers from the Oregon Trail and has since grown to become a diverse city with a variety of cultures and backgrounds. The city’s economy is largely based on agriculture and manufacturing, and the median household income is $50,000. Canby is a great place to live and work, and is home to several parks and trails, as well as a variety of churches.
Common Questions
What is Per Capita Income in Canby?
Per Capita income in Canby is $40,861.
What is the Median Family Income in Canby?
Median Family Income in Canby is $102,622.
What is the Median Household income in Canby?
Median Household Income in Canby is $91,823.
What is Income or Wage Gap in Canby?
Income or Wage Gap in Canby is 34.1%.
Women in Canby earn 65.9 cents for every dollar earned by a man.
What is Inequality or Gini Index in Canby?
Inequality or Gini Index in Canby is 0.43.
What is the Total Population of Canby?
Total Population of Canby is 18,127.
What is the Total Male Population of Canby?
Total Male Population of Canby is 8,612.
What is the Total Female Population of Canby?
Total Female Population of Canby is 9,515.
What is the Ratio of Males per 100 Females in Canby?
There are 90.51 Males per 100 Females in Canby.
What is the Ratio of Females per 100 Males in Canby?
There are 110.49 Females per 100 Males in Canby.
What is the Median Population Age in Canby?
Median Population Age in Canby is 41.1 Years.
What is the Average Family Size in Canby
Average Family Size in Canby is 3.1 People.
What is the Average Household Size in Canby
Average Household Size in Canby is 2.6 People.
How Large is the Labor Force in Canby?
There are 9,168 People in the Labor Forcein in Canby.
What is the Percentage of People in the Labor Force in Canby?
62.4% of People are in the Labor Force in Canby.
What is the Unemployment Rate in Canby?
Unemployment Rate in Canby is 3.1%.