East Moriches, NY Map & Demographics
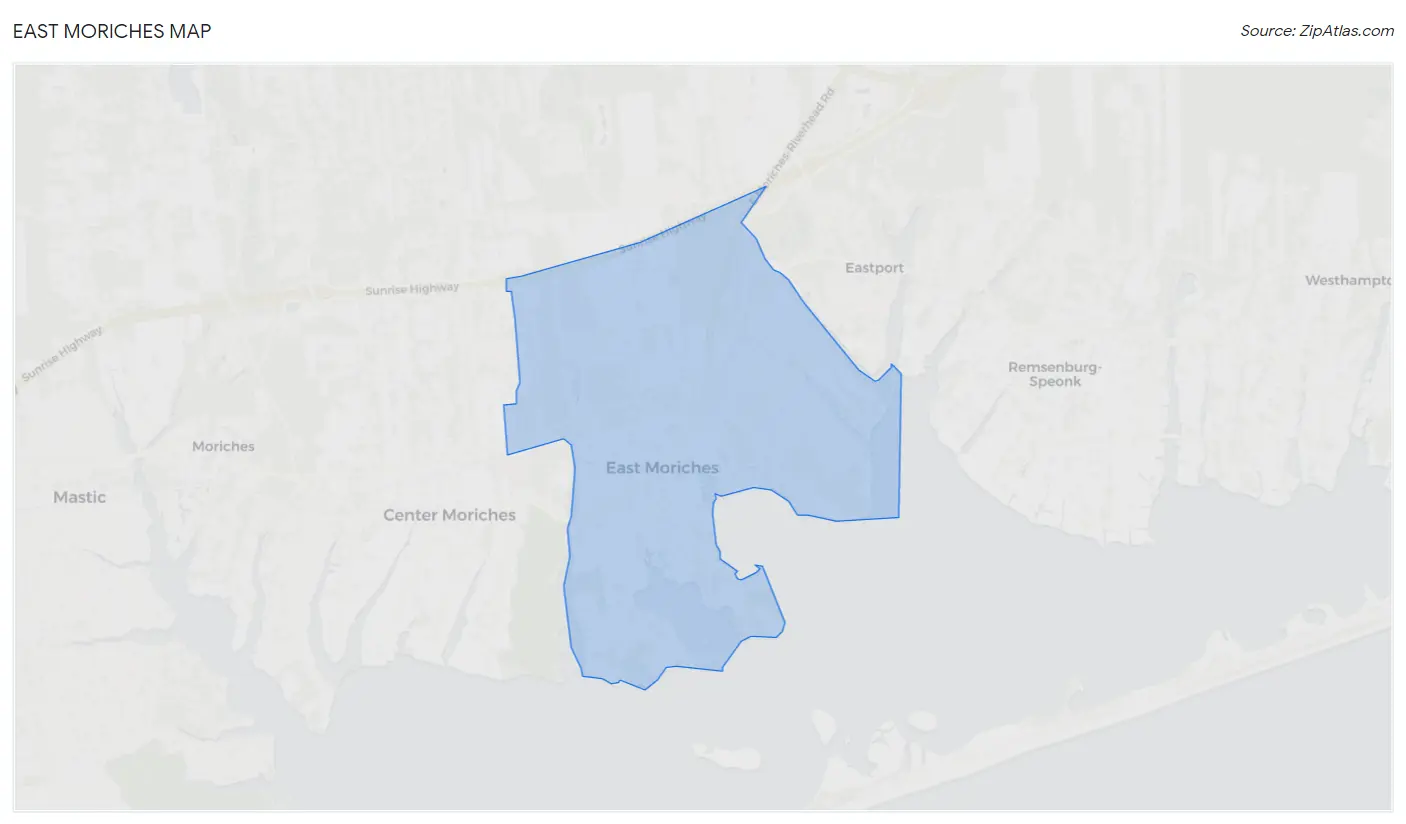
East Moriches Map
East Moriches Overview
$63,153
PER CAPITA INCOME
$173,152
AVG FAMILY INCOME
$128,788
AVG HOUSEHOLD INCOME
52.9%
WAGE / INCOME GAP [ % ]
47.1¢/ $1
WAGE / INCOME GAP [ $ ]
0.45
INEQUALITY / GINI INDEX
5,581
TOTAL POPULATION
2,846
MALE POPULATION
2,735
FEMALE POPULATION
104.06
MALES / 100 FEMALES
96.10
FEMALES / 100 MALES
47.2
MEDIAN AGE
3.3
AVG FAMILY SIZE
2.8
AVG HOUSEHOLD SIZE
2,733
LABOR FORCE [ PEOPLE ]
61.3%
PERCENT IN LABOR FORCE
2.2%
UNEMPLOYMENT RATE
East Moriches Zip Codes
East Moriches Area Codes
Income in East Moriches
Income Overview in East Moriches
Per Capita Income in East Moriches is $63,153, while median incomes of families and households are $173,152 and $128,788 respectively.
| Characteristic | Number | Measure |
| Per Capita Income | 5,581 | $63,153 |
| Median Family Income | 1,440 | $173,152 |
| Mean Family Income | 1,440 | $200,202 |
| Median Household Income | 1,934 | $128,788 |
| Mean Household Income | 1,934 | $175,385 |
| Income Deficit | 1,440 | $0 |
| Wage / Income Gap (%) | 5,581 | 52.91% |
| Wage / Income Gap ($) | 5,581 | 47.09¢ per $1 |
| Gini / Inequality Index | 5,581 | 0.45 |
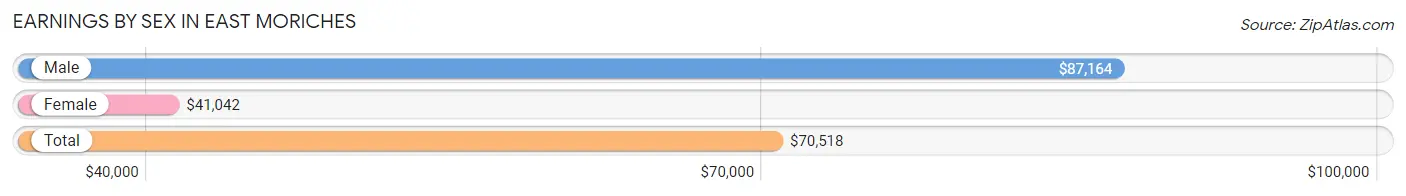
Earnings by Sex in East Moriches
Average Earnings in East Moriches are $70,518, $87,164 for men and $41,042 for women, a difference of 52.9%.
| Sex | Number | Average Earnings |
| Male | 1,566 (55.9%) | $87,164 |
| Female | 1,234 (44.1%) | $41,042 |
| Total | 2,800 (100.0%) | $70,518 |
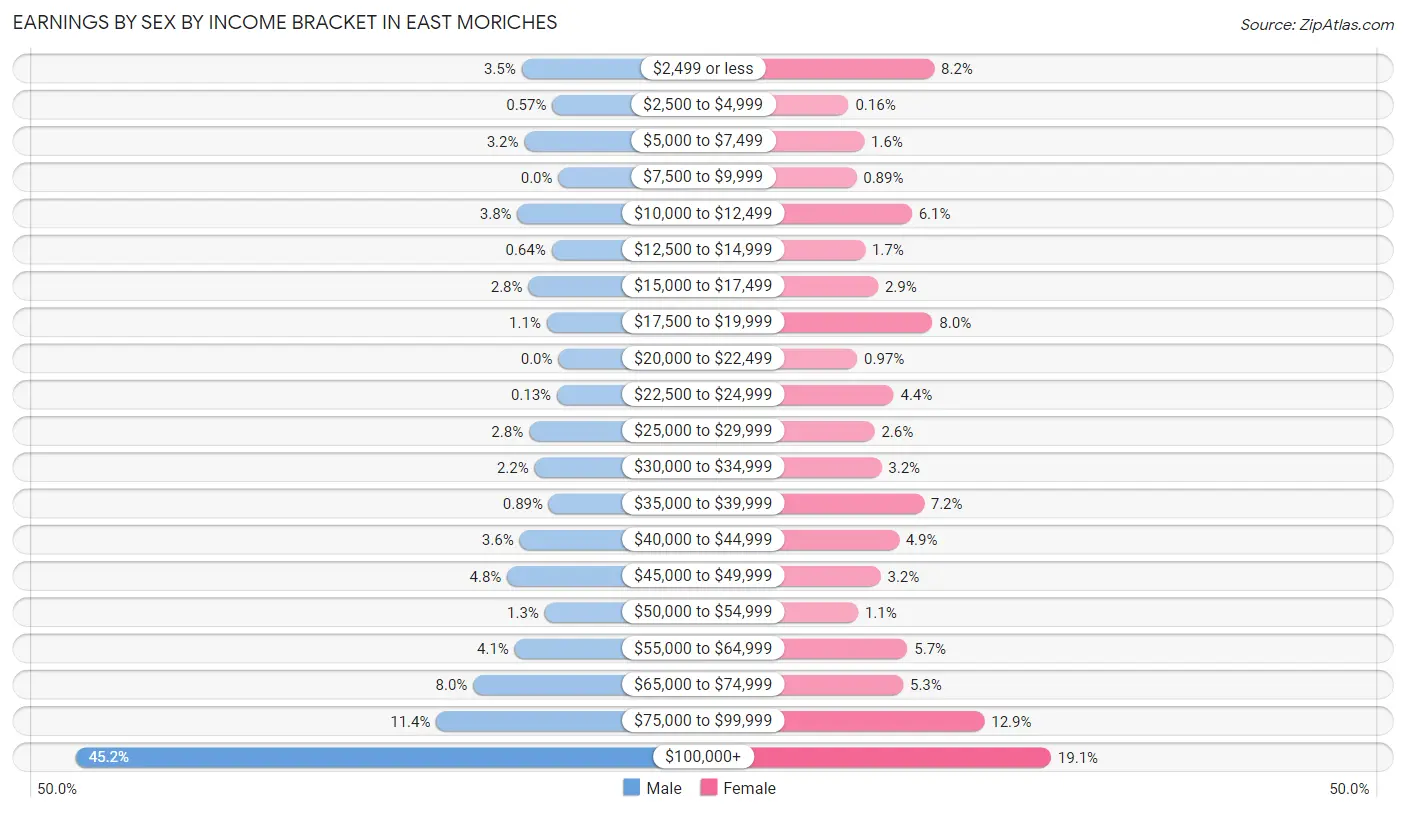
Earnings by Sex by Income Bracket in East Moriches
The most common earnings brackets in East Moriches are $100,000+ for men (708 | 45.2%) and $100,000+ for women (236 | 19.1%).
| Income | Male | Female |
| $2,499 or less | 54 (3.5%) | 101 (8.2%) |
| $2,500 to $4,999 | 9 (0.6%) | 2 (0.2%) |
| $5,000 to $7,499 | 50 (3.2%) | 20 (1.6%) |
| $7,500 to $9,999 | 0 (0.0%) | 11 (0.9%) |
| $10,000 to $12,499 | 60 (3.8%) | 75 (6.1%) |
| $12,500 to $14,999 | 10 (0.6%) | 21 (1.7%) |
| $15,000 to $17,499 | 44 (2.8%) | 36 (2.9%) |
| $17,500 to $19,999 | 17 (1.1%) | 99 (8.0%) |
| $20,000 to $22,499 | 0 (0.0%) | 12 (1.0%) |
| $22,500 to $24,999 | 2 (0.1%) | 54 (4.4%) |
| $25,000 to $29,999 | 43 (2.8%) | 32 (2.6%) |
| $30,000 to $34,999 | 35 (2.2%) | 40 (3.2%) |
| $35,000 to $39,999 | 14 (0.9%) | 89 (7.2%) |
| $40,000 to $44,999 | 57 (3.6%) | 60 (4.9%) |
| $45,000 to $49,999 | 75 (4.8%) | 39 (3.2%) |
| $50,000 to $54,999 | 20 (1.3%) | 13 (1.1%) |
| $55,000 to $64,999 | 64 (4.1%) | 70 (5.7%) |
| $65,000 to $74,999 | 125 (8.0%) | 65 (5.3%) |
| $75,000 to $99,999 | 179 (11.4%) | 159 (12.9%) |
| $100,000+ | 708 (45.2%) | 236 (19.1%) |
| Total | 1,566 (100.0%) | 1,234 (100.0%) |
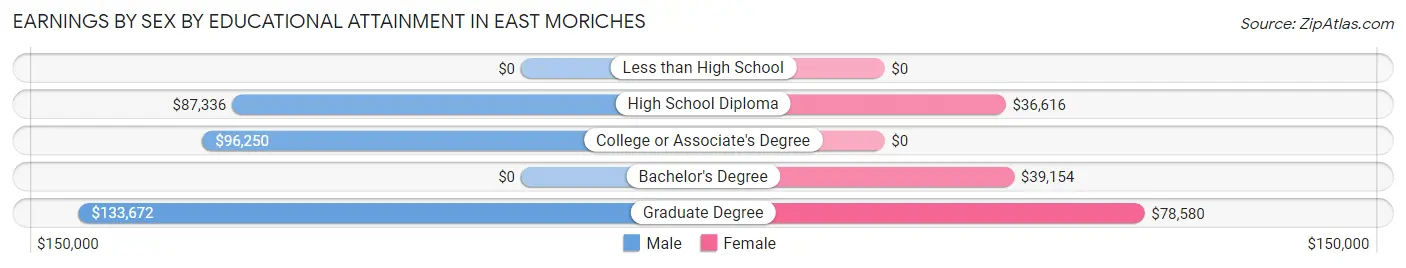
Earnings by Sex by Educational Attainment in East Moriches
Average earnings in East Moriches are $104,792 for men and $49,536 for women, a difference of 52.7%. Men with an educational attainment of graduate degree enjoy the highest average annual earnings of $133,672, while those with high school diploma education earn the least with $87,336. Women with an educational attainment of graduate degree earn the most with the average annual earnings of $78,580, while those with high school diploma education have the smallest earnings of $36,616.
| Educational Attainment | Male Income | Female Income |
| Less than High School | - | - |
| High School Diploma | $87,336 | $36,616 |
| College or Associate's Degree | $96,250 | $0 |
| Bachelor's Degree | - | - |
| Graduate Degree | $133,672 | $78,580 |
| Total | $104,792 | $49,536 |
Family Income in East Moriches
Family Income Brackets in East Moriches
According to the East Moriches family income data, there are 495 families falling into the $200,000+ income range, which is the most common income bracket and makes up 34.4% of all families. Conversely, the $10,000 to $14,999 income bracket is the least frequent group with only 6 families (0.4%) belonging to this category.
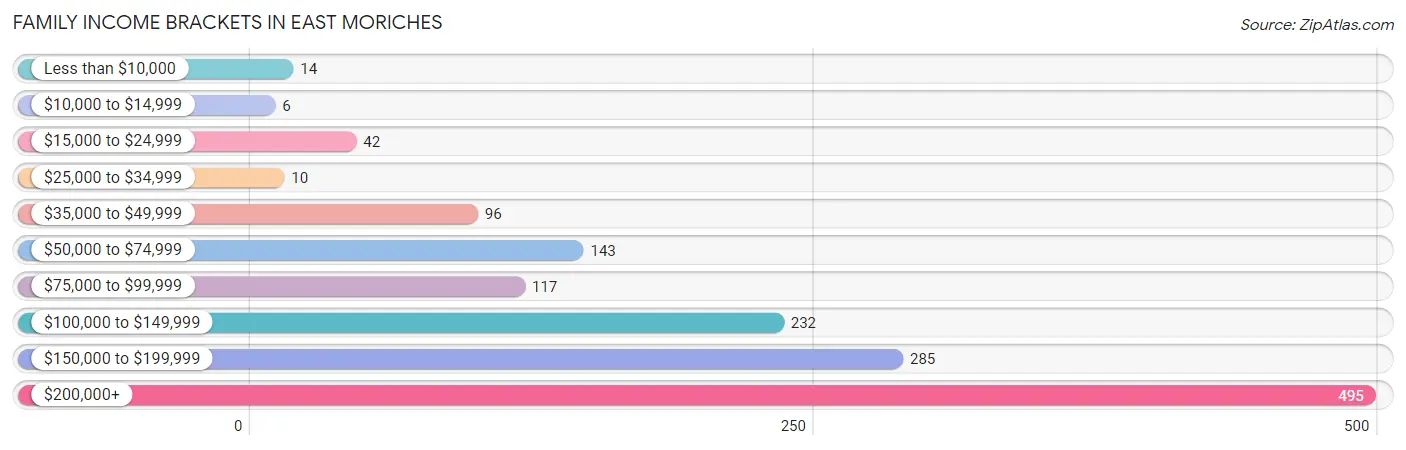
| Income Bracket | # Families | % Families |
| Less than $10,000 | 14 | 1.0% |
| $10,000 to $14,999 | 6 | 0.4% |
| $15,000 to $24,999 | 42 | 2.9% |
| $25,000 to $34,999 | 10 | 0.7% |
| $35,000 to $49,999 | 96 | 6.7% |
| $50,000 to $74,999 | 143 | 9.9% |
| $75,000 to $99,999 | 117 | 8.1% |
| $100,000 to $149,999 | 232 | 16.1% |
| $150,000 to $199,999 | 285 | 19.8% |
| $200,000+ | 495 | 34.4% |
Family Income by Famaliy Size in East Moriches
5-person families (97 | 6.7%) account for the highest median family income in East Moriches with $232,768 per family, while 2-person families (689 | 47.8%) have the highest median income of $65,670 per family member.
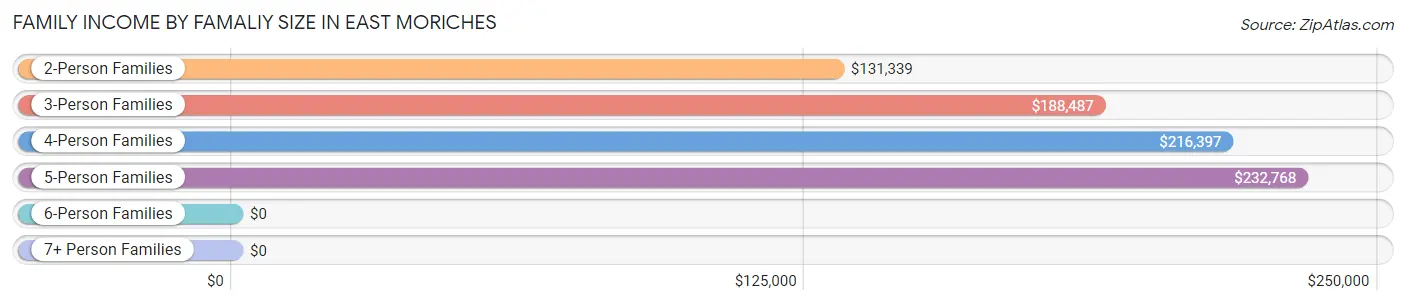
| Income Bracket | # Families | Median Income |
| 2-Person Families | 689 (47.8%) | $131,339 |
| 3-Person Families | 233 (16.2%) | $188,487 |
| 4-Person Families | 333 (23.1%) | $216,397 |
| 5-Person Families | 97 (6.7%) | $232,768 |
| 6-Person Families | 50 (3.5%) | $0 |
| 7+ Person Families | 38 (2.6%) | $0 |
| Total | 1,440 (100.0%) | $173,152 |
Family Income by Number of Earners in East Moriches
The median family income in East Moriches is $173,152, with families comprising 2 earners (676) having the highest median family income of $215,466, while families with no earners (285) have the lowest median family income of $56,587, accounting for 46.9% and 19.8% of families, respectively.
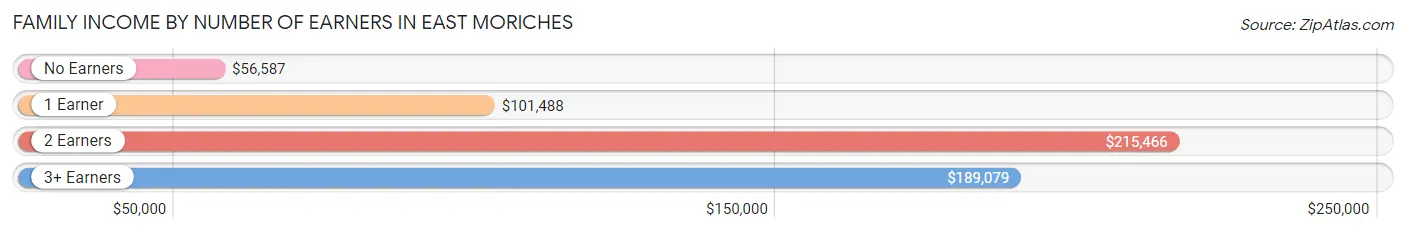
| Number of Earners | # Families | Median Income |
| No Earners | 285 (19.8%) | $56,587 |
| 1 Earner | 341 (23.7%) | $101,488 |
| 2 Earners | 676 (46.9%) | $215,466 |
| 3+ Earners | 138 (9.6%) | $189,079 |
| Total | 1,440 (100.0%) | $173,152 |
Household Income in East Moriches
Household Income Brackets in East Moriches
With 553 households falling in the category, the $200,000+ income range is the most frequent in East Moriches, accounting for 28.6% of all households.
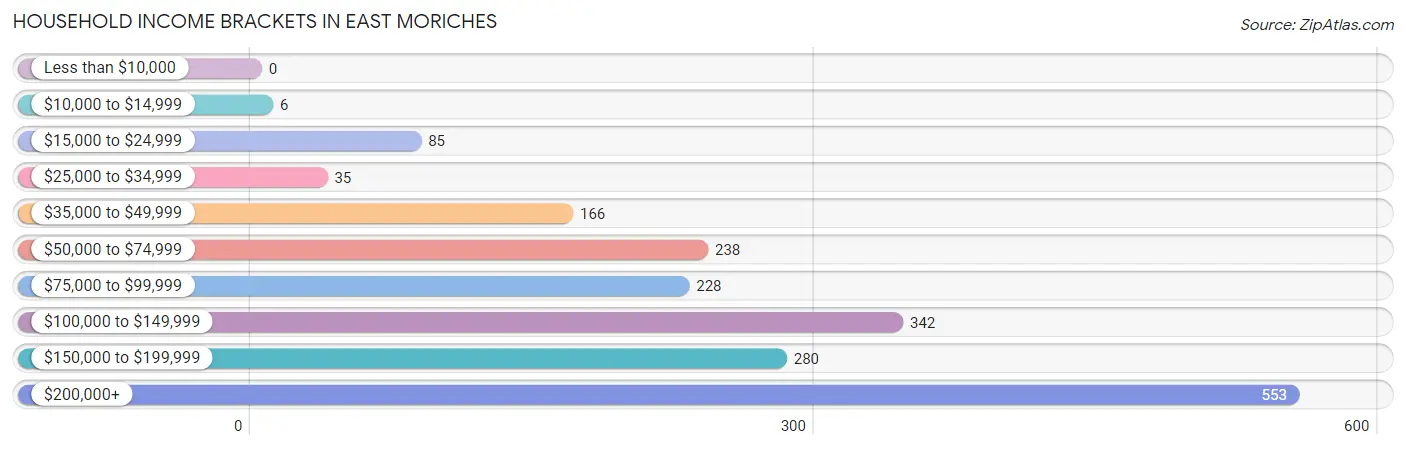
| Income Bracket | # Households | % Households |
| Less than $10,000 | 0 | 0.0% |
| $10,000 to $14,999 | 6 | 0.3% |
| $15,000 to $24,999 | 85 | 4.4% |
| $25,000 to $34,999 | 35 | 1.8% |
| $35,000 to $49,999 | 166 | 8.6% |
| $50,000 to $74,999 | 238 | 12.3% |
| $75,000 to $99,999 | 228 | 11.8% |
| $100,000 to $149,999 | 342 | 17.7% |
| $150,000 to $199,999 | 280 | 14.5% |
| $200,000+ | 553 | 28.6% |
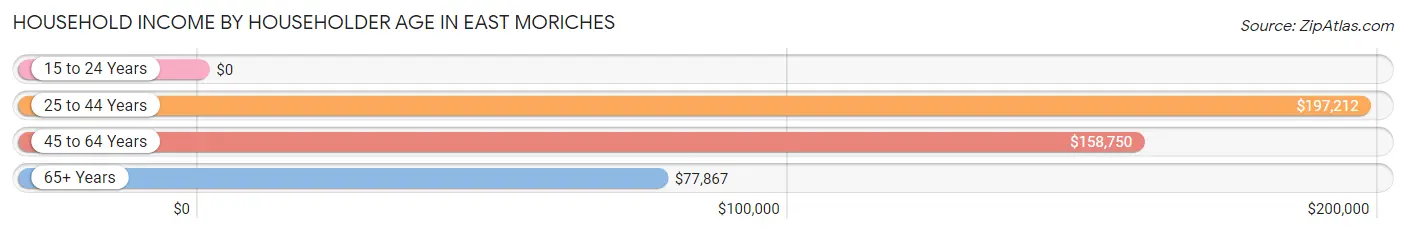
Household Income by Householder Age in East Moriches
The median household income in East Moriches is $128,788, with the highest median household income of $197,212 found in the 25 to 44 years age bracket for the primary householder. A total of 379 households (19.6%) fall into this category.
| Income Bracket | # Households | Median Income |
| 15 to 24 Years | 0 (0.0%) | $0 |
| 25 to 44 Years | 379 (19.6%) | $197,212 |
| 45 to 64 Years | 828 (42.8%) | $158,750 |
| 65+ Years | 727 (37.6%) | $77,867 |
| Total | 1,934 (100.0%) | $128,788 |
Poverty in East Moriches
Income Below Poverty by Sex and Age in East Moriches
With 2.9% poverty level for males and 3.7% for females among the residents of East Moriches, 55 to 64 year old males and 18 to 24 year old females are the most vulnerable to poverty, with 51 males (12.8%) and 19 females (11.8%) in their respective age groups living below the poverty level.
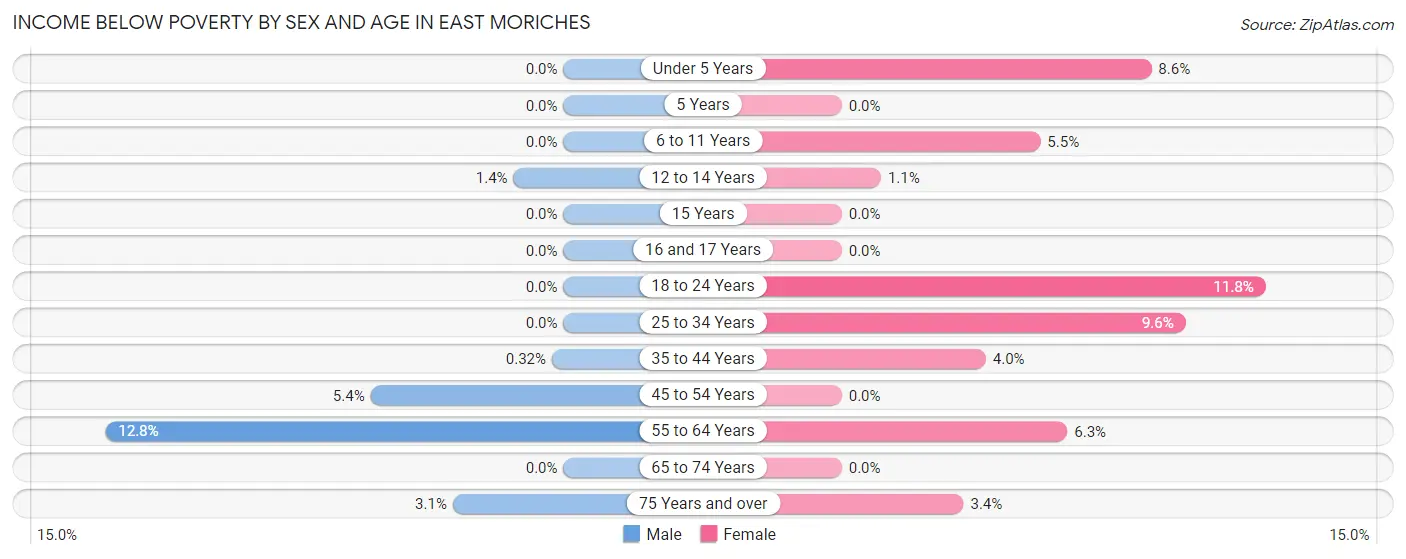
| Age Bracket | Male | Female |
| Under 5 Years | 0 (0.0%) | 10 (8.6%) |
| 5 Years | 0 (0.0%) | 0 (0.0%) |
| 6 to 11 Years | 0 (0.0%) | 14 (5.5%) |
| 12 to 14 Years | 2 (1.4%) | 1 (1.1%) |
| 15 Years | 0 (0.0%) | 0 (0.0%) |
| 16 and 17 Years | 0 (0.0%) | 0 (0.0%) |
| 18 to 24 Years | 0 (0.0%) | 19 (11.8%) |
| 25 to 34 Years | 0 (0.0%) | 9 (9.6%) |
| 35 to 44 Years | 1 (0.3%) | 14 (4.0%) |
| 45 to 54 Years | 22 (5.4%) | 0 (0.0%) |
| 55 to 64 Years | 51 (12.8%) | 23 (6.3%) |
| 65 to 74 Years | 0 (0.0%) | 0 (0.0%) |
| 75 Years and over | 6 (3.1%) | 8 (3.4%) |
| Total | 82 (2.9%) | 98 (3.7%) |
Income Above Poverty by Sex and Age in East Moriches
According to the poverty statistics in East Moriches, males aged under 5 years and females aged 15 years are the age groups that are most secure financially, with 100.0% of males and 100.0% of females in these age groups living above the poverty line.
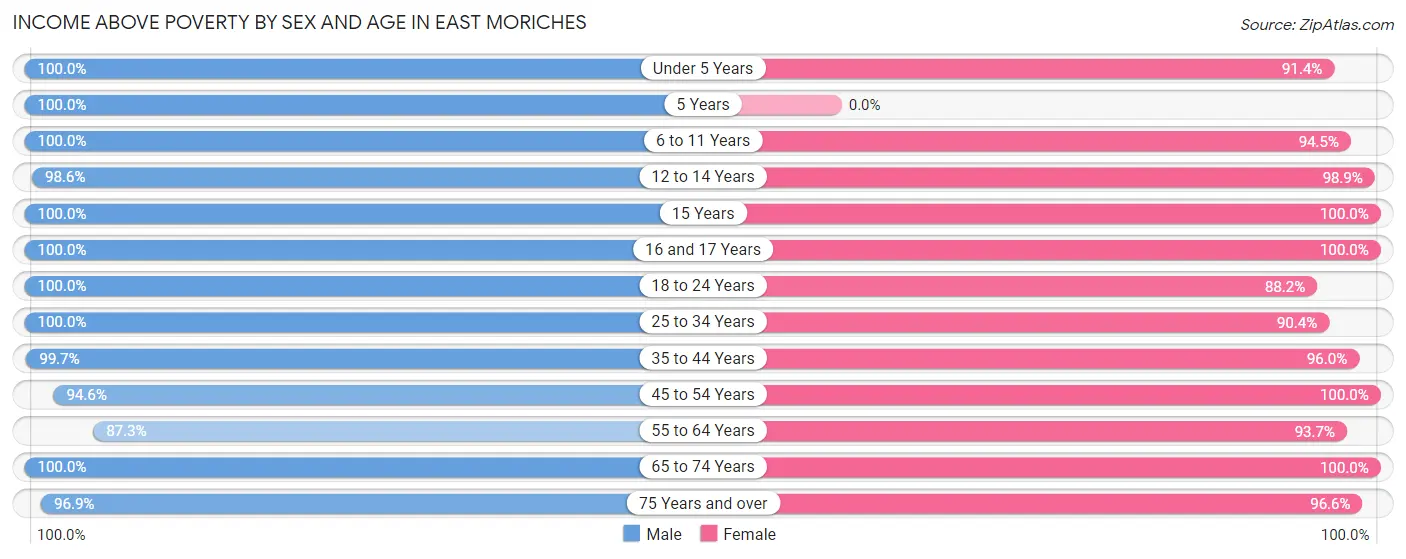
| Age Bracket | Male | Female |
| Under 5 Years | 152 (100.0%) | 106 (91.4%) |
| 5 Years | 14 (100.0%) | 0 (0.0%) |
| 6 to 11 Years | 247 (100.0%) | 239 (94.5%) |
| 12 to 14 Years | 142 (98.6%) | 91 (98.9%) |
| 15 Years | 34 (100.0%) | 66 (100.0%) |
| 16 and 17 Years | 61 (100.0%) | 32 (100.0%) |
| 18 to 24 Years | 244 (100.0%) | 142 (88.2%) |
| 25 to 34 Years | 231 (100.0%) | 85 (90.4%) |
| 35 to 44 Years | 309 (99.7%) | 335 (96.0%) |
| 45 to 54 Years | 388 (94.6%) | 430 (100.0%) |
| 55 to 64 Years | 349 (87.3%) | 343 (93.7%) |
| 65 to 74 Years | 365 (100.0%) | 478 (100.0%) |
| 75 Years and over | 189 (96.9%) | 228 (96.6%) |
| Total | 2,725 (97.1%) | 2,575 (96.3%) |
Income Below Poverty Among Married-Couple Families in East Moriches
The poverty statistics for married-couple families in East Moriches show that 0.4% or 6 of the total 1,320 families live below the poverty line. Families with no children have the highest poverty rate of 0.7%, comprising of 6 families. On the other hand, families with 1 or 2 children have the lowest poverty rate of 0.0%, which includes 0 families.
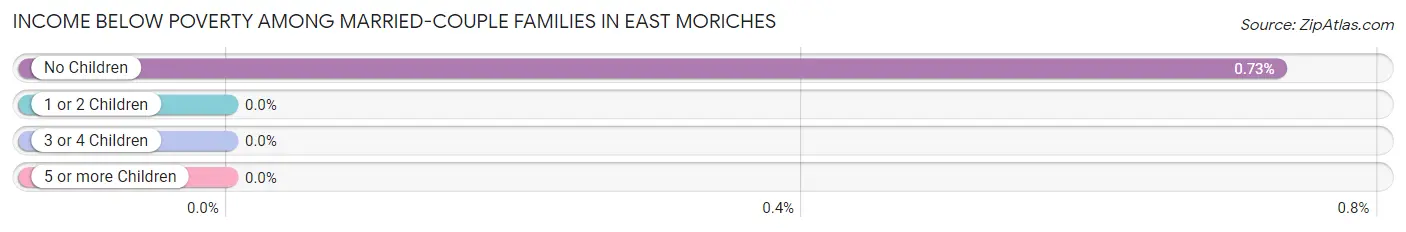
| Children | Above Poverty | Below Poverty |
| No Children | 819 (99.3%) | 6 (0.7%) |
| 1 or 2 Children | 403 (100.0%) | 0 (0.0%) |
| 3 or 4 Children | 92 (100.0%) | 0 (0.0%) |
| 5 or more Children | 0 (0.0%) | 0 (0.0%) |
| Total | 1,314 (99.6%) | 6 (0.4%) |
Income Below Poverty Among Single-Parent Households in East Moriches
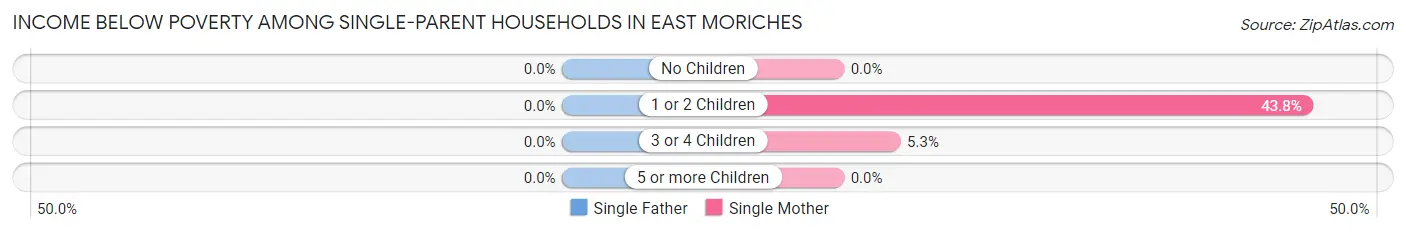
| Children | Single Father | Single Mother |
| No Children | 0 (0.0%) | 0 (0.0%) |
| 1 or 2 Children | 0 (0.0%) | 14 (43.8%) |
| 3 or 4 Children | 0 (0.0%) | 1 (5.3%) |
| 5 or more Children | 0 (0.0%) | 0 (0.0%) |
| Total | 0 (0.0%) | 15 (21.4%) |
Income Below Poverty Among Married-Couple vs Single-Parent Households in East Moriches
The poverty data for East Moriches shows that 6 of the married-couple family households (0.4%) and 15 of the single-parent households (12.5%) are living below the poverty level. Within the married-couple family households, those with no children have the highest poverty rate, with 6 households (0.7%) falling below the poverty line. Among the single-parent households, those with 1 or 2 children have the highest poverty rate, with 14 household (27.5%) living below poverty.
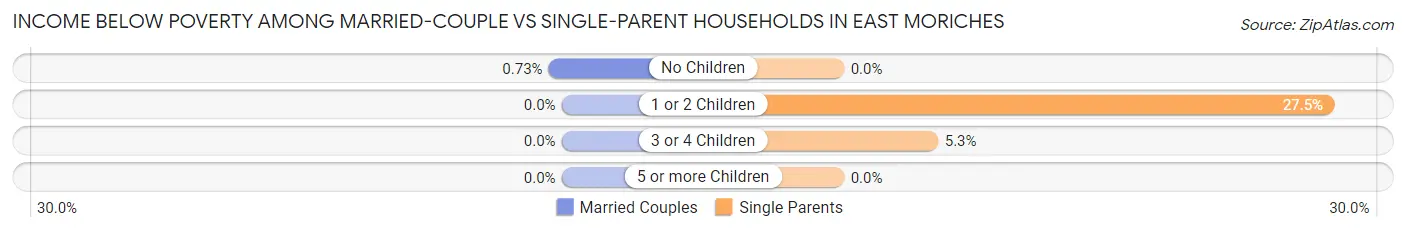
| Children | Married-Couple Families | Single-Parent Households |
| No Children | 6 (0.7%) | 0 (0.0%) |
| 1 or 2 Children | 0 (0.0%) | 14 (27.5%) |
| 3 or 4 Children | 0 (0.0%) | 1 (5.3%) |
| 5 or more Children | 0 (0.0%) | 0 (0.0%) |
| Total | 6 (0.4%) | 15 (12.5%) |
Race in East Moriches
The most populous races in East Moriches are White / Caucasian (4,955 | 88.8%), Two or more Races (274 | 4.9%), and Hispanic or Latino (253 | 4.5%).
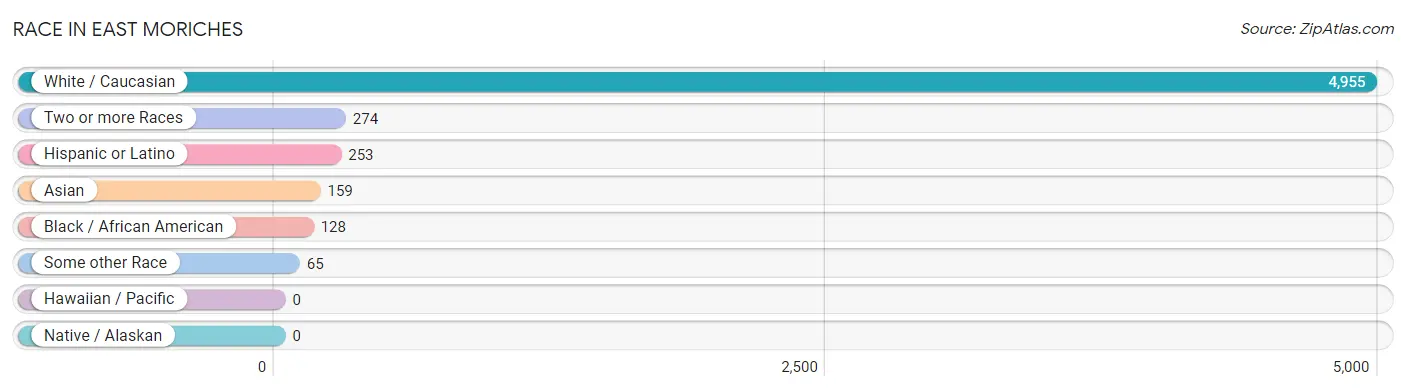
| Race | # Population | % Population |
| Asian | 159 | 2.9% |
| Black / African American | 128 | 2.3% |
| Hawaiian / Pacific | 0 | 0.0% |
| Hispanic or Latino | 253 | 4.5% |
| Native / Alaskan | 0 | 0.0% |
| White / Caucasian | 4,955 | 88.8% |
| Two or more Races | 274 | 4.9% |
| Some other Race | 65 | 1.2% |
| Total | 5,581 | 100.0% |
Ancestry in East Moriches
The most populous ancestries reported in East Moriches are Irish (1,391 | 24.9%), Italian (1,361 | 24.4%), German (1,288 | 23.1%), English (610 | 10.9%), and Polish (601 | 10.8%), together accounting for 94.1% of all East Moriches residents.
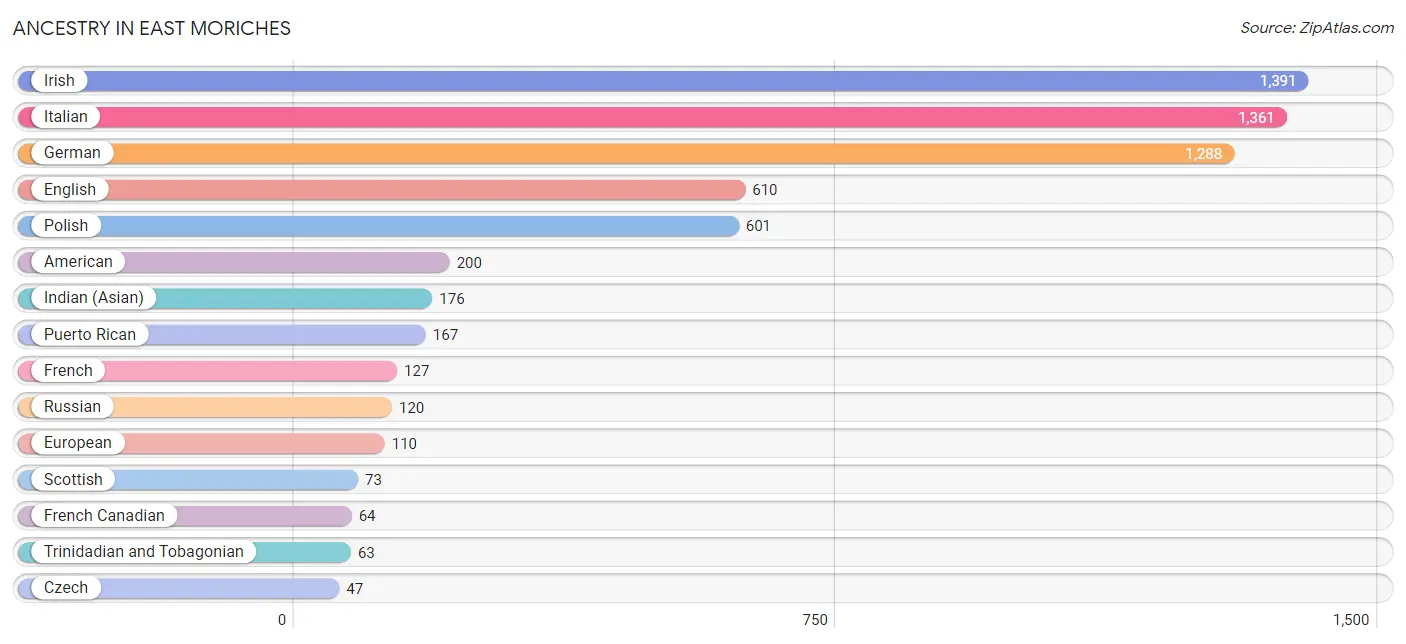
| Ancestry | # Population | % Population |
| American | 200 | 3.6% |
| Arab | 11 | 0.2% |
| British | 8 | 0.1% |
| Central American | 1 | 0.0% |
| Colombian | 1 | 0.0% |
| Czech | 47 | 0.8% |
| Czechoslovakian | 13 | 0.2% |
| Danish | 9 | 0.2% |
| Dutch | 14 | 0.3% |
| English | 610 | 10.9% |
| European | 110 | 2.0% |
| Filipino | 3 | 0.1% |
| French | 127 | 2.3% |
| French Canadian | 64 | 1.1% |
| German | 1,288 | 23.1% |
| Greek | 24 | 0.4% |
| Haitian | 37 | 0.7% |
| Indian (Asian) | 176 | 3.2% |
| Iranian | 10 | 0.2% |
| Irish | 1,391 | 24.9% |
| Italian | 1,361 | 24.4% |
| Lebanese | 10 | 0.2% |
| Lithuanian | 16 | 0.3% |
| Mexican | 24 | 0.4% |
| Polish | 601 | 10.8% |
| Puerto Rican | 167 | 3.0% |
| Russian | 120 | 2.1% |
| Salvadoran | 1 | 0.0% |
| Scotch-Irish | 34 | 0.6% |
| Scottish | 73 | 1.3% |
| Slovak | 9 | 0.2% |
| South American | 1 | 0.0% |
| Spaniard | 16 | 0.3% |
| Spanish | 13 | 0.2% |
| Swedish | 26 | 0.5% |
| Thai | 31 | 0.6% |
| Trinidadian and Tobagonian | 63 | 1.1% |
| Ukrainian | 23 | 0.4% | View All 38 Rows |
Immigrants in East Moriches
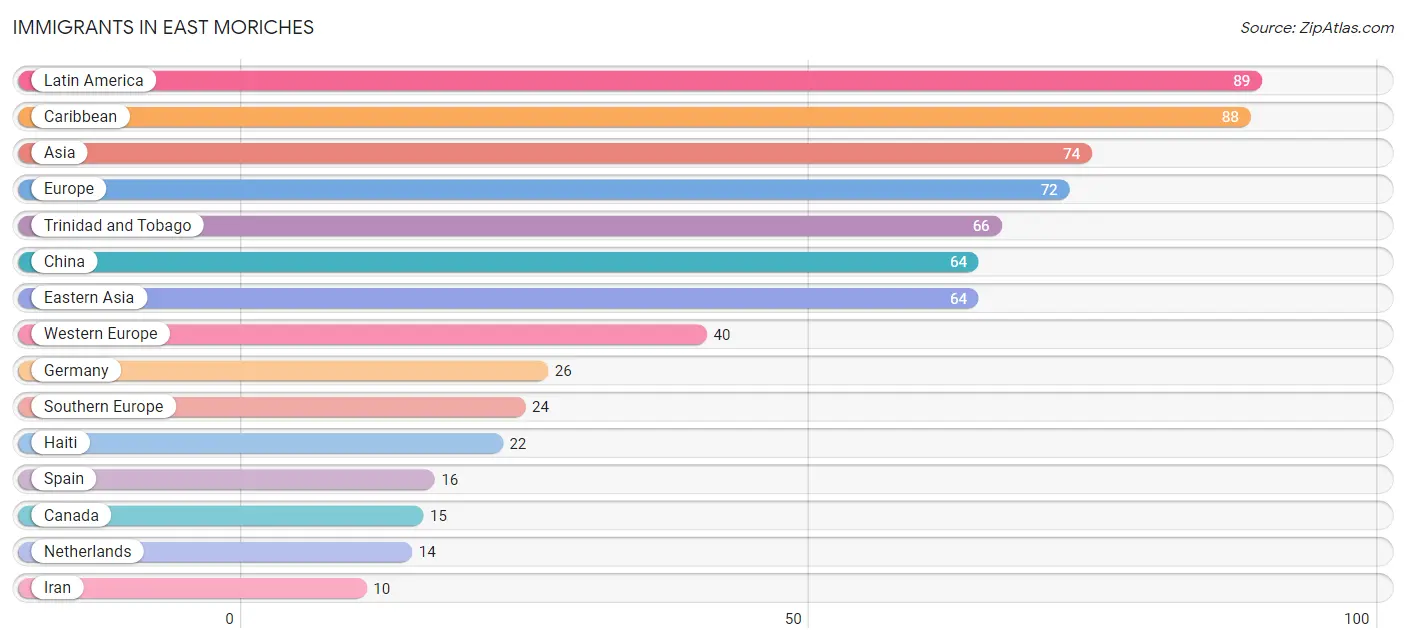
The most numerous immigrant groups reported in East Moriches came from Latin America (89 | 1.6%), Caribbean (88 | 1.6%), Asia (74 | 1.3%), Europe (72 | 1.3%), and Trinidad and Tobago (66 | 1.2%), together accounting for 7.0% of all East Moriches residents.
| Immigration Origin | # Population | % Population |
| Asia | 74 | 1.3% |
| Canada | 15 | 0.3% |
| Caribbean | 88 | 1.6% |
| Central America | 1 | 0.0% |
| China | 64 | 1.1% |
| Eastern Asia | 64 | 1.1% |
| Eastern Europe | 8 | 0.1% |
| Europe | 72 | 1.3% |
| Germany | 26 | 0.5% |
| Haiti | 22 | 0.4% |
| Honduras | 1 | 0.0% |
| Iran | 10 | 0.2% |
| Italy | 8 | 0.1% |
| Latin America | 89 | 1.6% |
| Lithuania | 8 | 0.1% |
| Netherlands | 14 | 0.3% |
| South Central Asia | 10 | 0.2% |
| Southern Europe | 24 | 0.4% |
| Spain | 16 | 0.3% |
| Taiwan | 3 | 0.1% |
| Trinidad and Tobago | 66 | 1.2% |
| Western Europe | 40 | 0.7% | View All 22 Rows |
Sex and Age in East Moriches
Sex and Age in East Moriches
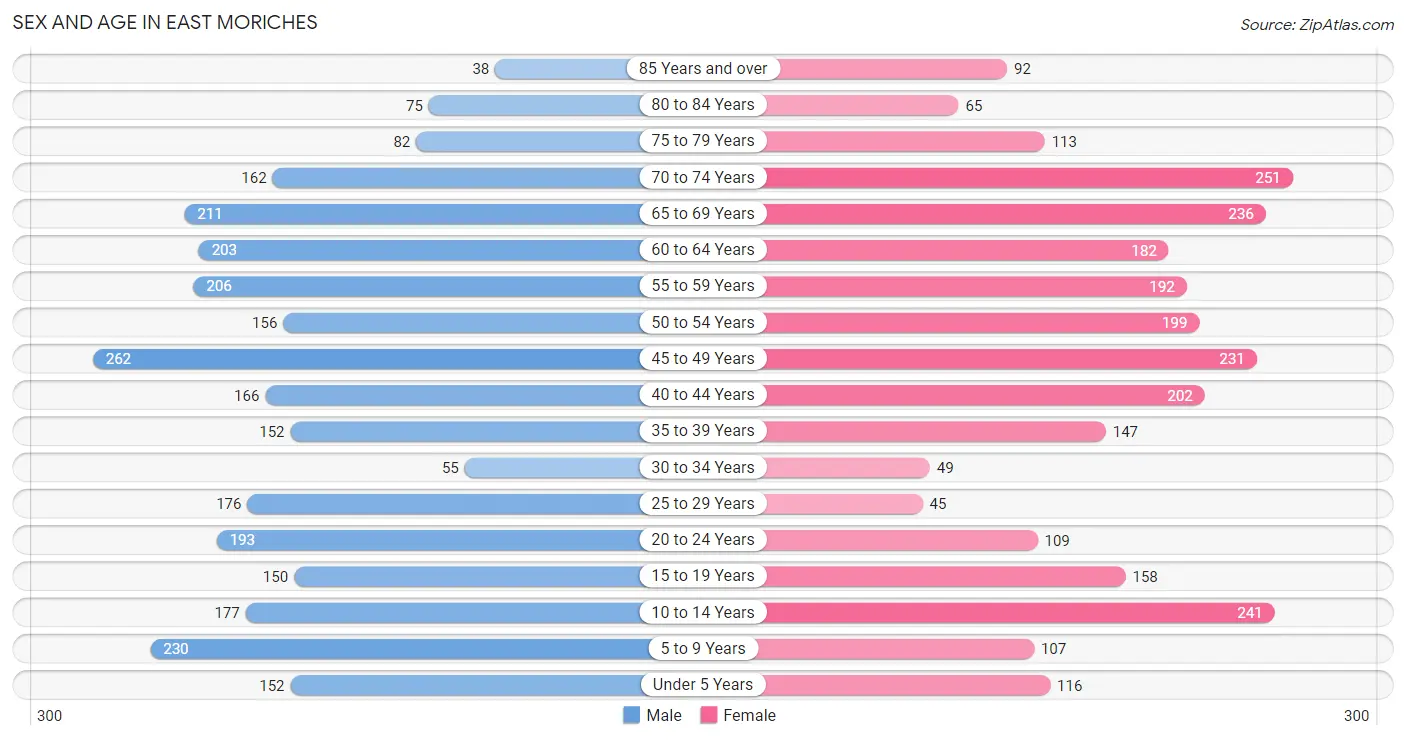
The most populous age groups in East Moriches are 45 to 49 Years (262 | 9.2%) for men and 70 to 74 Years (251 | 9.2%) for women.
| Age Bracket | Male | Female |
| Under 5 Years | 152 (5.3%) | 116 (4.2%) |
| 5 to 9 Years | 230 (8.1%) | 107 (3.9%) |
| 10 to 14 Years | 177 (6.2%) | 241 (8.8%) |
| 15 to 19 Years | 150 (5.3%) | 158 (5.8%) |
| 20 to 24 Years | 193 (6.8%) | 109 (4.0%) |
| 25 to 29 Years | 176 (6.2%) | 45 (1.7%) |
| 30 to 34 Years | 55 (1.9%) | 49 (1.8%) |
| 35 to 39 Years | 152 (5.3%) | 147 (5.4%) |
| 40 to 44 Years | 166 (5.8%) | 202 (7.4%) |
| 45 to 49 Years | 262 (9.2%) | 231 (8.5%) |
| 50 to 54 Years | 156 (5.5%) | 199 (7.3%) |
| 55 to 59 Years | 206 (7.2%) | 192 (7.0%) |
| 60 to 64 Years | 203 (7.1%) | 182 (6.7%) |
| 65 to 69 Years | 211 (7.4%) | 236 (8.6%) |
| 70 to 74 Years | 162 (5.7%) | 251 (9.2%) |
| 75 to 79 Years | 82 (2.9%) | 113 (4.1%) |
| 80 to 84 Years | 75 (2.6%) | 65 (2.4%) |
| 85 Years and over | 38 (1.3%) | 92 (3.4%) |
| Total | 2,846 (100.0%) | 2,735 (100.0%) |
Families and Households in East Moriches
Median Family Size in East Moriches
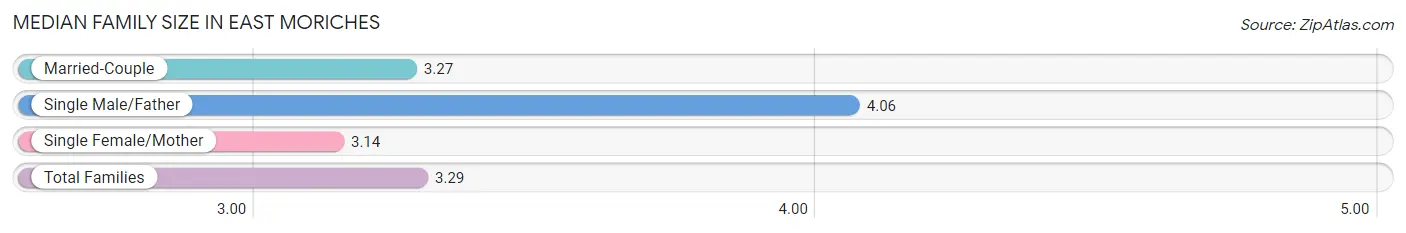
The median family size in East Moriches is 3.29 persons per family, with single male/father families (50 | 3.5%) accounting for the largest median family size of 4.06 persons per family. On the other hand, single female/mother families (70 | 4.9%) represent the smallest median family size with 3.14 persons per family.
| Family Type | # Families | Family Size |
| Married-Couple | 1,320 (91.7%) | 3.27 |
| Single Male/Father | 50 (3.5%) | 4.06 |
| Single Female/Mother | 70 (4.9%) | 3.14 |
| Total Families | 1,440 (100.0%) | 3.29 |
Median Household Size in East Moriches
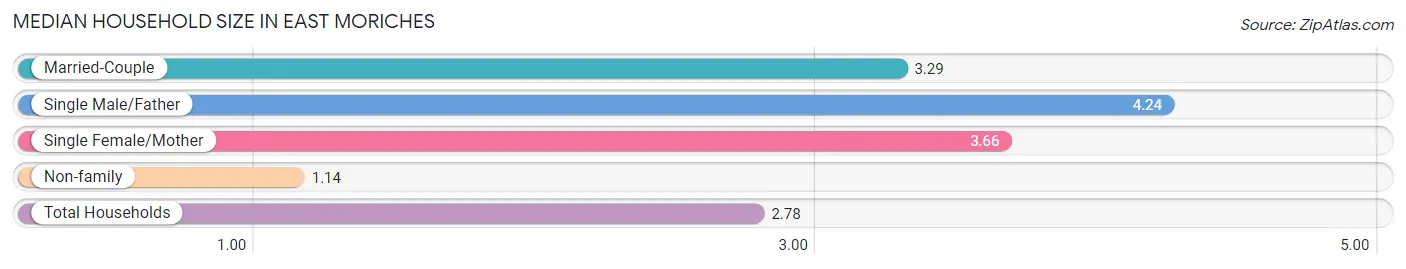
The median household size in East Moriches is 2.78 persons per household, with single male/father households (50 | 2.6%) accounting for the largest median household size of 4.24 persons per household. non-family households (494 | 25.5%) represent the smallest median household size with 1.14 persons per household.
| Household Type | # Households | Household Size |
| Married-Couple | 1,320 (68.2%) | 3.29 |
| Single Male/Father | 50 (2.6%) | 4.24 |
| Single Female/Mother | 70 (3.6%) | 3.66 |
| Non-family | 494 (25.5%) | 1.14 |
| Total Households | 1,934 (100.0%) | 2.78 |
Household Size by Marriage Status in East Moriches
Out of a total of 1,934 households in East Moriches, 1,440 (74.5%) are family households, while 494 (25.5%) are nonfamily households. The most numerous type of family households are 2-person households, comprising 689, and the most common type of nonfamily households are 1-person households, comprising 423.
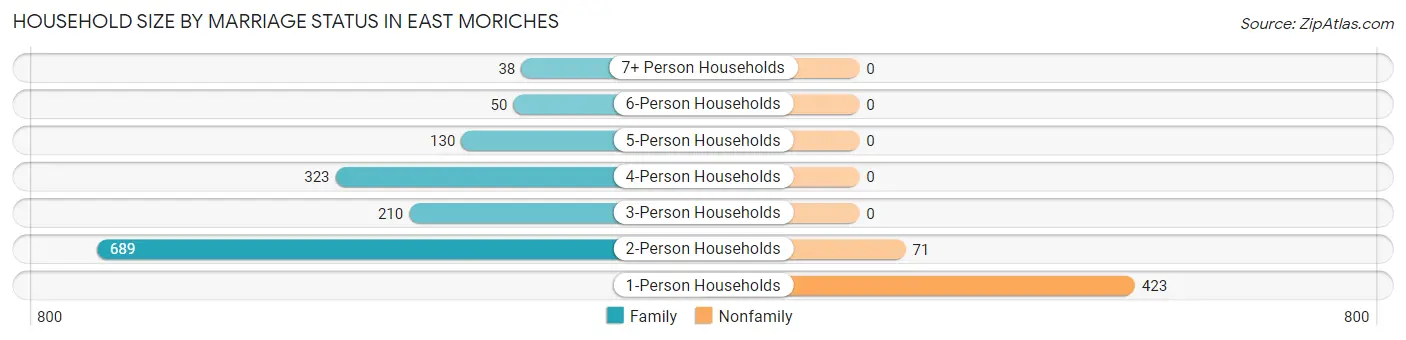
| Household Size | Family Households | Nonfamily Households |
| 1-Person Households | - | 423 (21.9%) |
| 2-Person Households | 689 (35.6%) | 71 (3.7%) |
| 3-Person Households | 210 (10.9%) | 0 (0.0%) |
| 4-Person Households | 323 (16.7%) | 0 (0.0%) |
| 5-Person Households | 130 (6.7%) | 0 (0.0%) |
| 6-Person Households | 50 (2.6%) | 0 (0.0%) |
| 7+ Person Households | 38 (2.0%) | 0 (0.0%) |
| Total | 1,440 (74.5%) | 494 (25.5%) |
Female Fertility in East Moriches
Fertility by Age in East Moriches
Average fertility rate in East Moriches is 50.0 births per 1,000 women. Women in the age bracket of 20 to 34 years have the highest fertility rate with 158.0 births per 1,000 women. Women in the age bracket of 20 to 34 years acount for 65.3% of all women with births.
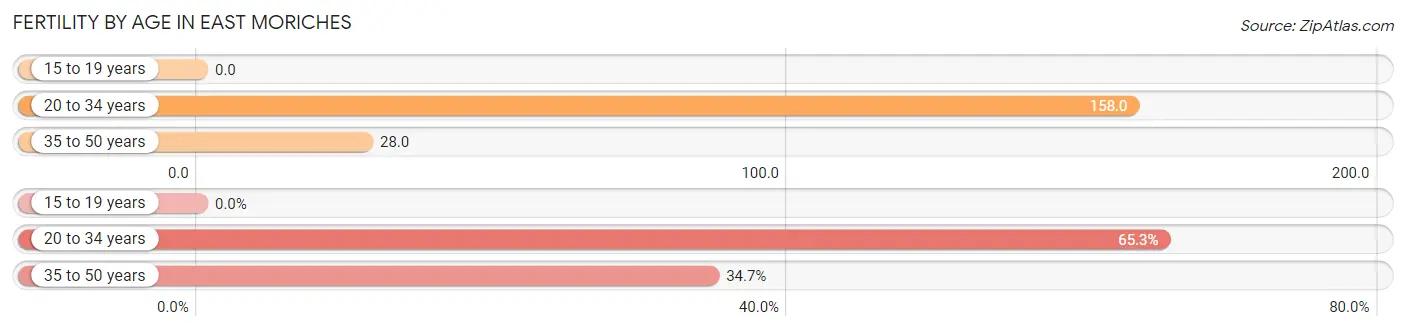
| Age Bracket | Women with Births | Births / 1,000 Women |
| 15 to 19 years | 0 (0.0%) | 0.0 |
| 20 to 34 years | 32 (65.3%) | 158.0 |
| 35 to 50 years | 17 (34.7%) | 28.0 |
| Total | 49 (100.0%) | 50.0 |
Fertility by Age by Marriage Status in East Moriches
81.6% of women with births (49) in East Moriches are married. The highest percentage of unmarried women with births falls into 20 to 34 years age bracket with 28.1% of them unmarried at the time of birth, while the lowest percentage of unmarried women with births belong to 35 to 50 years age bracket with 0.0% of them unmarried.
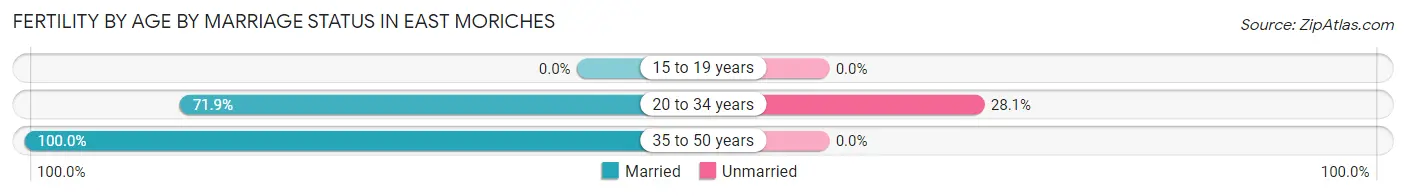
| Age Bracket | Married | Unmarried |
| 15 to 19 years | 0 (0.0%) | 0 (0.0%) |
| 20 to 34 years | 23 (71.9%) | 9 (28.1%) |
| 35 to 50 years | 17 (100.0%) | 0 (0.0%) |
| Total | 40 (81.6%) | 9 (18.4%) |
Fertility by Education in East Moriches
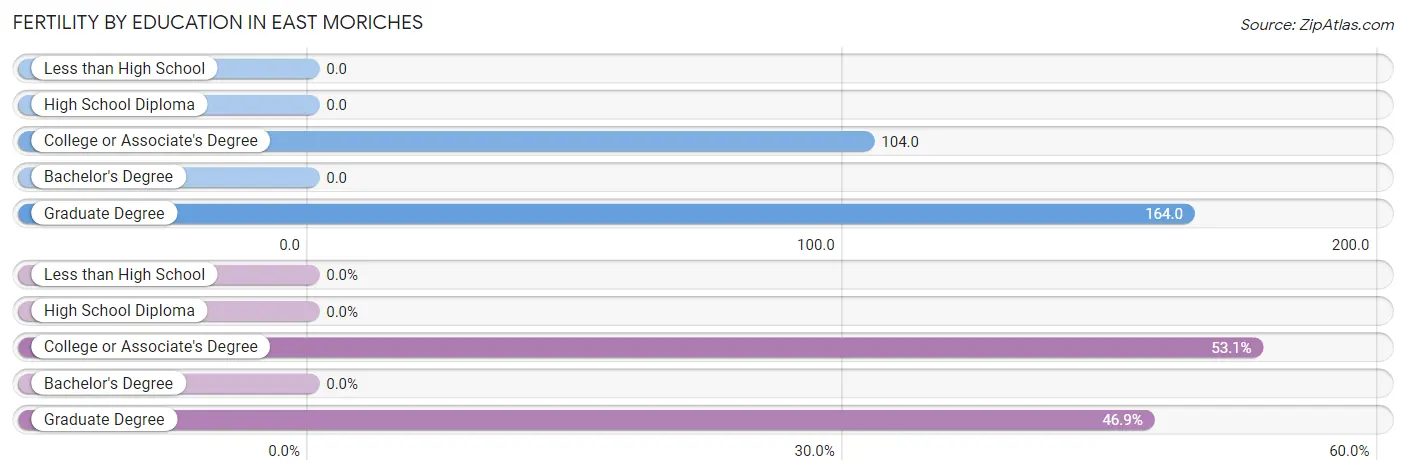
| Educational Attainment | Women with Births | Births / 1,000 Women |
| Less than High School | 0 (0.0%) | 0.0 |
| High School Diploma | 0 (0.0%) | 0.0 |
| College or Associate's Degree | 26 (53.1%) | 104.0 |
| Bachelor's Degree | 0 (0.0%) | 0.0 |
| Graduate Degree | 23 (46.9%) | 164.0 |
| Total | 49 (100.0%) | 50.0 |
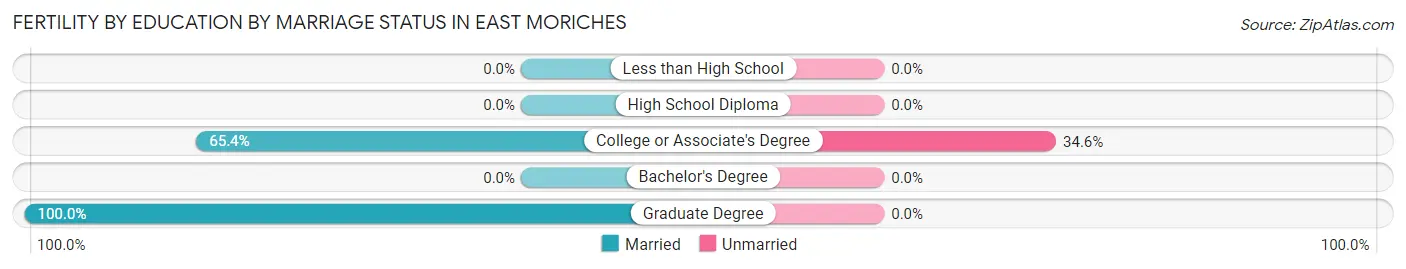
Fertility by Education by Marriage Status in East Moriches
18.4% of women with births in East Moriches are unmarried. Women with the educational attainment of graduate degree are most likely to be married with 100.0% of them married at childbirth, while women with the educational attainment of college or associate's degree are least likely to be married with 34.6% of them unmarried at childbirth.
| Educational Attainment | Married | Unmarried |
| Less than High School | 0 (0.0%) | 0 (0.0%) |
| High School Diploma | 0 (0.0%) | 0 (0.0%) |
| College or Associate's Degree | 17 (65.4%) | 9 (34.6%) |
| Bachelor's Degree | 0 (0.0%) | 0 (0.0%) |
| Graduate Degree | 23 (100.0%) | 0 (0.0%) |
| Total | 40 (81.6%) | 9 (18.4%) |
Employment Characteristics in East Moriches
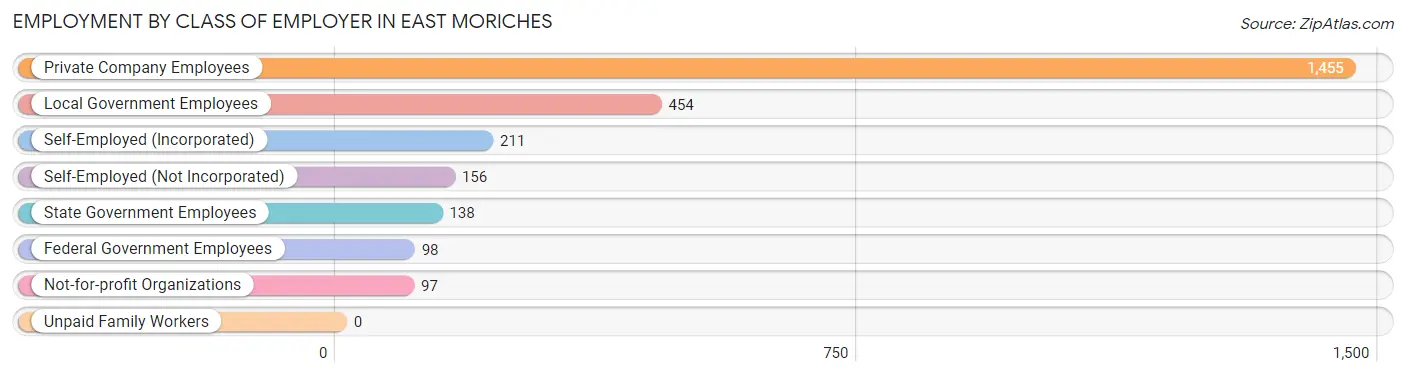
Employment by Class of Employer in East Moriches
Among the 2,609 employed individuals in East Moriches, private company employees (1,455 | 55.8%), local government employees (454 | 17.4%), and self-employed (incorporated) (211 | 8.1%) make up the most common classes of employment.
| Employer Class | # Employees | % Employees |
| Private Company Employees | 1,455 | 55.8% |
| Self-Employed (Incorporated) | 211 | 8.1% |
| Self-Employed (Not Incorporated) | 156 | 6.0% |
| Not-for-profit Organizations | 97 | 3.7% |
| Local Government Employees | 454 | 17.4% |
| State Government Employees | 138 | 5.3% |
| Federal Government Employees | 98 | 3.8% |
| Unpaid Family Workers | 0 | 0.0% |
| Total | 2,609 | 100.0% |
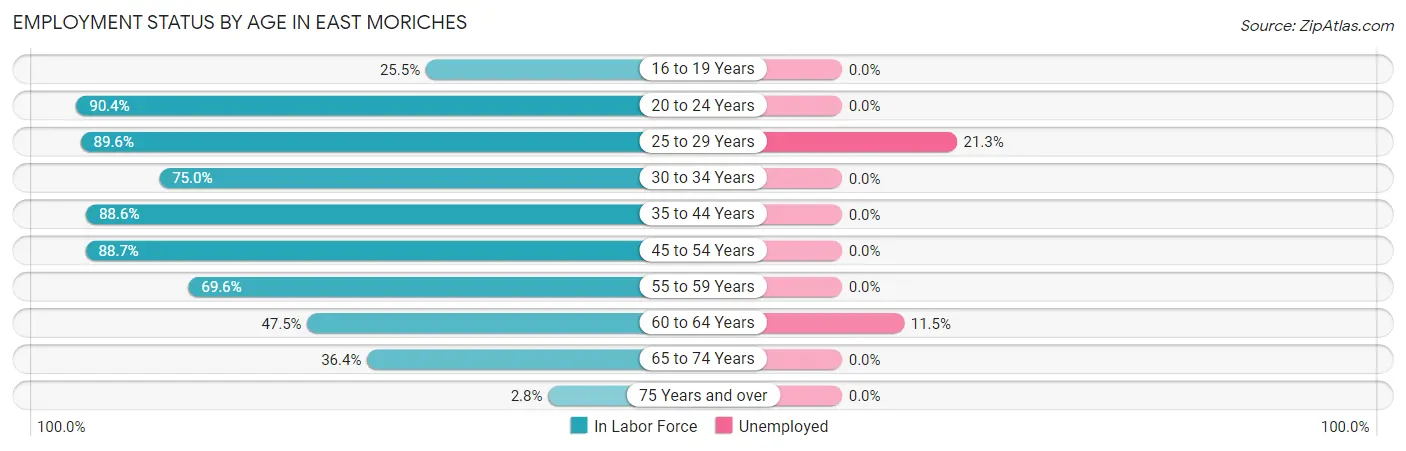
Employment Status by Age in East Moriches
According to the labor force statistics for East Moriches, out of the total population over 16 years of age (4,458), 61.3% or 2,733 individuals are in the labor force, with 2.2% or 60 of them unemployed. The age group with the highest labor force participation rate is 20 to 24 years, with 90.4% or 273 individuals in the labor force. Within the labor force, the 25 to 29 years age range has the highest percentage of unemployed individuals, with 21.3% or 42 of them being unemployed.
| Age Bracket | In Labor Force | Unemployed |
| 16 to 19 Years | 53 (25.5%) | 0 (0.0%) |
| 20 to 24 Years | 273 (90.4%) | 0 (0.0%) |
| 25 to 29 Years | 198 (89.6%) | 42 (21.3%) |
| 30 to 34 Years | 78 (75.0%) | 0 (0.0%) |
| 35 to 44 Years | 591 (88.6%) | 0 (0.0%) |
| 45 to 54 Years | 752 (88.7%) | 0 (0.0%) |
| 55 to 59 Years | 277 (69.6%) | 0 (0.0%) |
| 60 to 64 Years | 183 (47.5%) | 21 (11.5%) |
| 65 to 74 Years | 313 (36.4%) | 0 (0.0%) |
| 75 Years and over | 13 (2.8%) | 0 (0.0%) |
| Total | 2,733 (61.3%) | 60 (2.2%) |
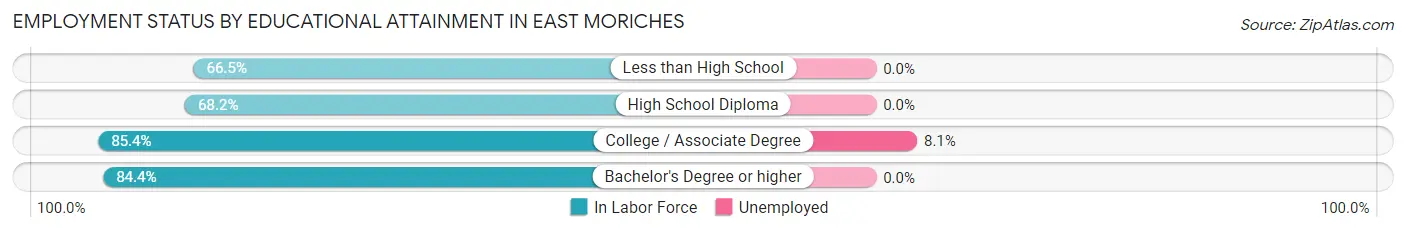
Employment Status by Educational Attainment in East Moriches
According to labor force statistics for East Moriches, 79.3% of individuals (2,080) out of the total population between 25 and 64 years of age (2,623) are in the labor force, with 2.9% or 60 of them being unemployed. The group with the highest labor force participation rate are those with the educational attainment of college / associate degree, with 85.4% or 760 individuals in the labor force. Within the labor force, individuals with college / associate degree education have the highest percentage of unemployment, with 8.1% or 62 of them being unemployed.
| Educational Attainment | In Labor Force | Unemployed |
| Less than High School | 105 (66.5%) | 0 (0.0%) |
| High School Diploma | 487 (68.2%) | 0 (0.0%) |
| College / Associate Degree | 760 (85.4%) | 72 (8.1%) |
| Bachelor's Degree or higher | 727 (84.4%) | 0 (0.0%) |
| Total | 2,080 (79.3%) | 76 (2.9%) |
Employment Occupations by Sex in East Moriches
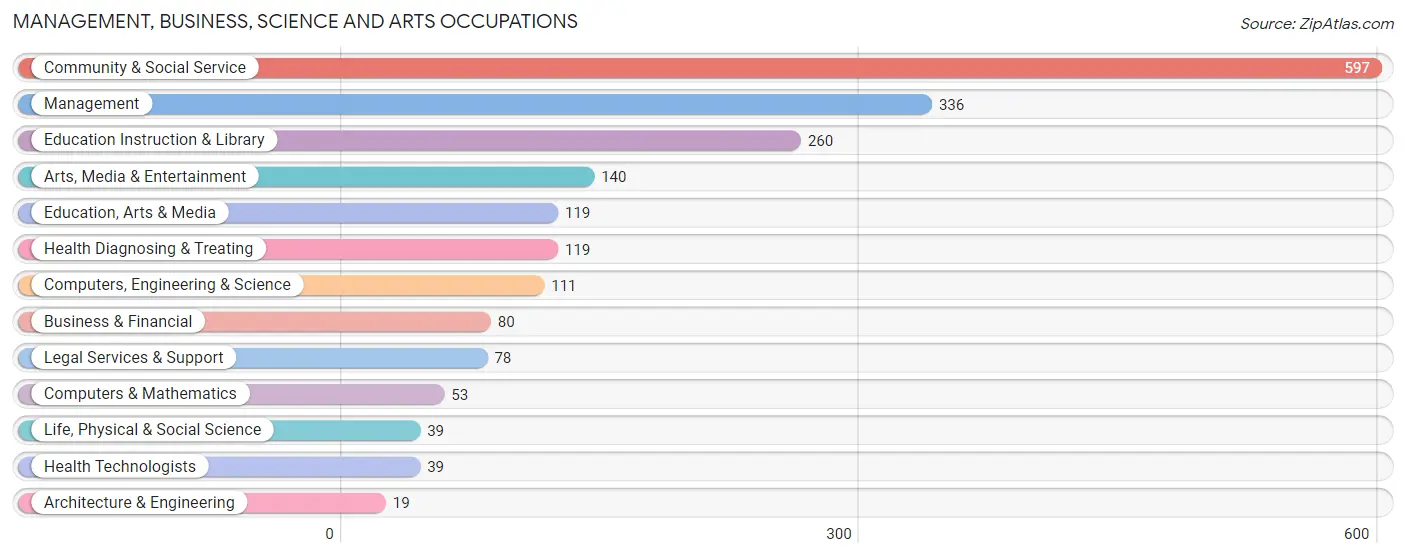
Management, Business, Science and Arts Occupations
The most common Management, Business, Science and Arts occupations in East Moriches are Community & Social Service (597 | 22.5%), Management (336 | 12.7%), Education Instruction & Library (260 | 9.8%), Arts, Media & Entertainment (140 | 5.3%), and Education, Arts & Media (119 | 4.5%).
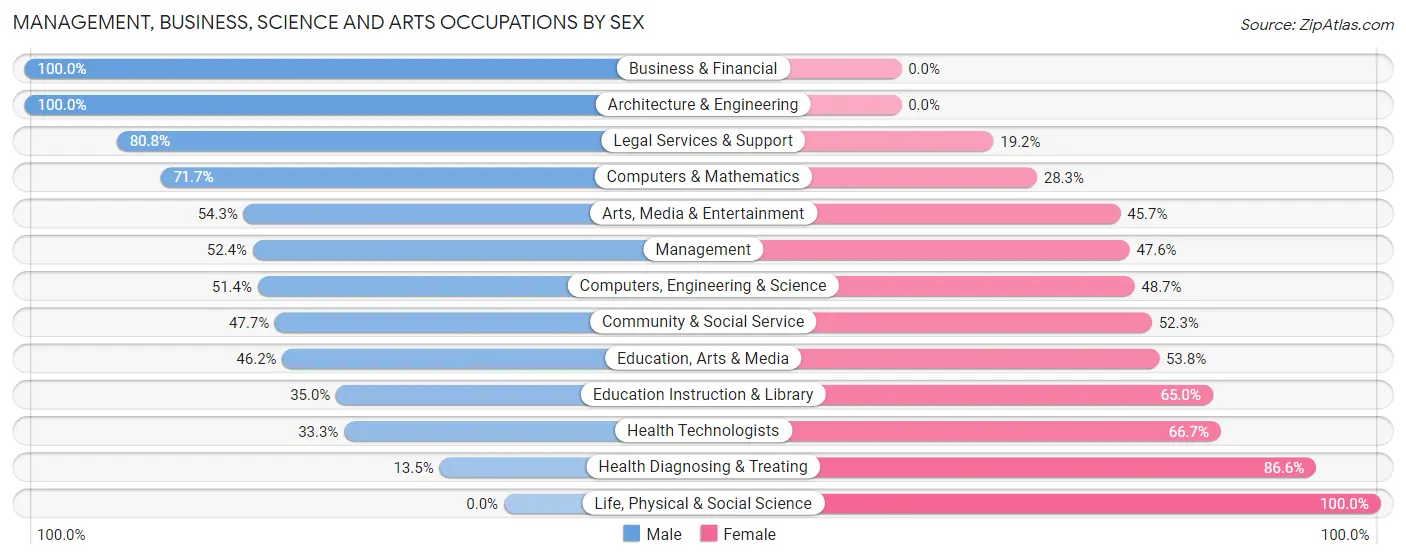
Management, Business, Science and Arts Occupations by Sex
Within the Management, Business, Science and Arts occupations in East Moriches, the most male-oriented occupations are Business & Financial (100.0%), Architecture & Engineering (100.0%), and Legal Services & Support (80.8%), while the most female-oriented occupations are Life, Physical & Social Science (100.0%), Health Diagnosing & Treating (86.6%), and Health Technologists (66.7%).
| Occupation | Male | Female |
| Management | 176 (52.4%) | 160 (47.6%) |
| Business & Financial | 80 (100.0%) | 0 (0.0%) |
| Computers, Engineering & Science | 57 (51.3%) | 54 (48.6%) |
| Computers & Mathematics | 38 (71.7%) | 15 (28.3%) |
| Architecture & Engineering | 19 (100.0%) | 0 (0.0%) |
| Life, Physical & Social Science | 0 (0.0%) | 39 (100.0%) |
| Community & Social Service | 285 (47.7%) | 312 (52.3%) |
| Education, Arts & Media | 55 (46.2%) | 64 (53.8%) |
| Legal Services & Support | 63 (80.8%) | 15 (19.2%) |
| Education Instruction & Library | 91 (35.0%) | 169 (65.0%) |
| Arts, Media & Entertainment | 76 (54.3%) | 64 (45.7%) |
| Health Diagnosing & Treating | 16 (13.5%) | 103 (86.6%) |
| Health Technologists | 13 (33.3%) | 26 (66.7%) |
| Total (Category) | 614 (49.4%) | 629 (50.6%) |
| Total (Overall) | 1,502 (56.6%) | 1,151 (43.4%) |
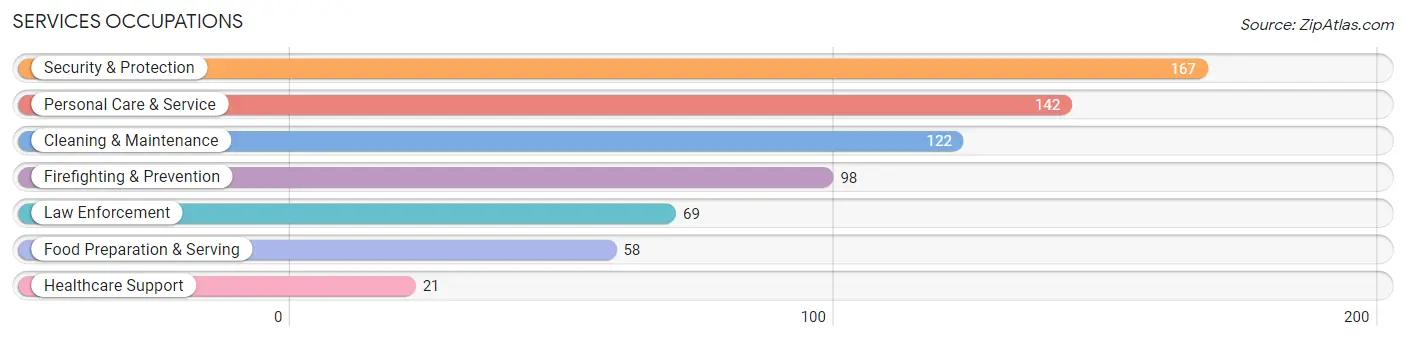
Services Occupations
The most common Services occupations in East Moriches are Security & Protection (167 | 6.3%), Personal Care & Service (142 | 5.3%), Cleaning & Maintenance (122 | 4.6%), Firefighting & Prevention (98 | 3.7%), and Law Enforcement (69 | 2.6%).
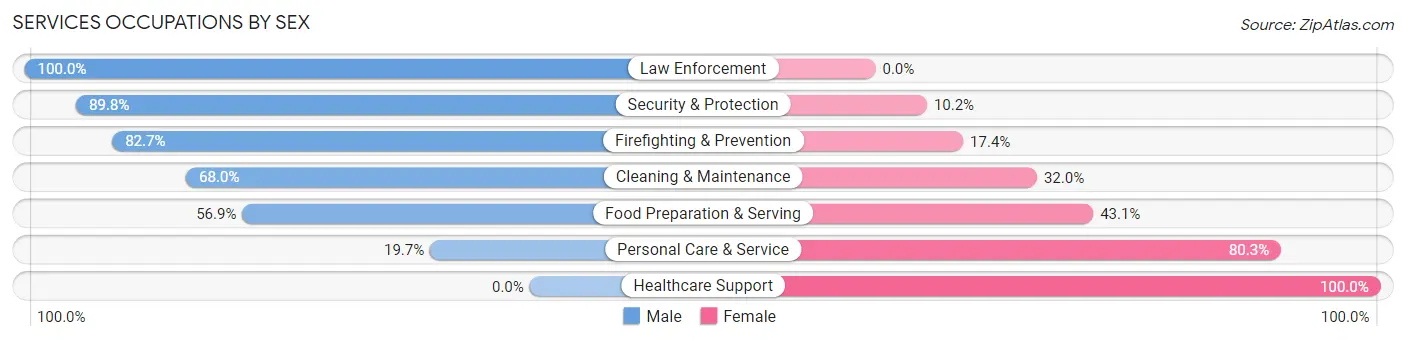
Services Occupations by Sex
Within the Services occupations in East Moriches, the most male-oriented occupations are Law Enforcement (100.0%), Security & Protection (89.8%), and Firefighting & Prevention (82.7%), while the most female-oriented occupations are Healthcare Support (100.0%), Personal Care & Service (80.3%), and Food Preparation & Serving (43.1%).
| Occupation | Male | Female |
| Healthcare Support | 0 (0.0%) | 21 (100.0%) |
| Security & Protection | 150 (89.8%) | 17 (10.2%) |
| Firefighting & Prevention | 81 (82.7%) | 17 (17.3%) |
| Law Enforcement | 69 (100.0%) | 0 (0.0%) |
| Food Preparation & Serving | 33 (56.9%) | 25 (43.1%) |
| Cleaning & Maintenance | 83 (68.0%) | 39 (32.0%) |
| Personal Care & Service | 28 (19.7%) | 114 (80.3%) |
| Total (Category) | 294 (57.7%) | 216 (42.3%) |
| Total (Overall) | 1,502 (56.6%) | 1,151 (43.4%) |
Sales and Office Occupations
The most common Sales and Office occupations in East Moriches are Sales & Related (265 | 10.0%), and Office & Administration (166 | 6.3%).
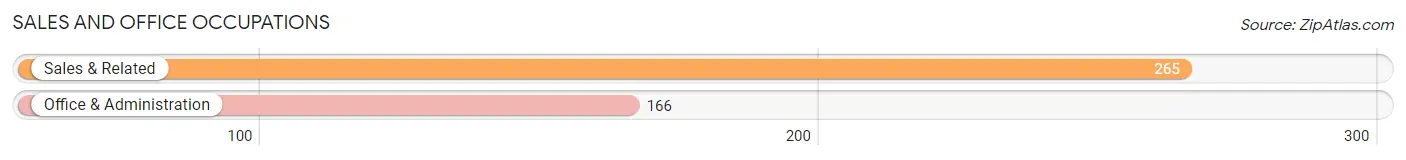
Sales and Office Occupations by Sex
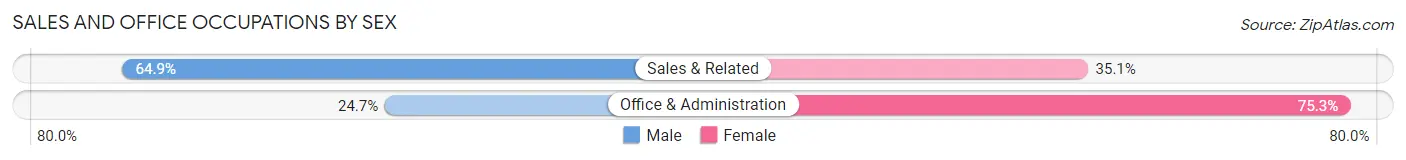
| Occupation | Male | Female |
| Sales & Related | 172 (64.9%) | 93 (35.1%) |
| Office & Administration | 41 (24.7%) | 125 (75.3%) |
| Total (Category) | 213 (49.4%) | 218 (50.6%) |
| Total (Overall) | 1,502 (56.6%) | 1,151 (43.4%) |
Natural Resources, Construction and Maintenance Occupations
The most common Natural Resources, Construction and Maintenance occupations in East Moriches are Installation, Maintenance & Repair (95 | 3.6%), and Construction & Extraction (79 | 3.0%).
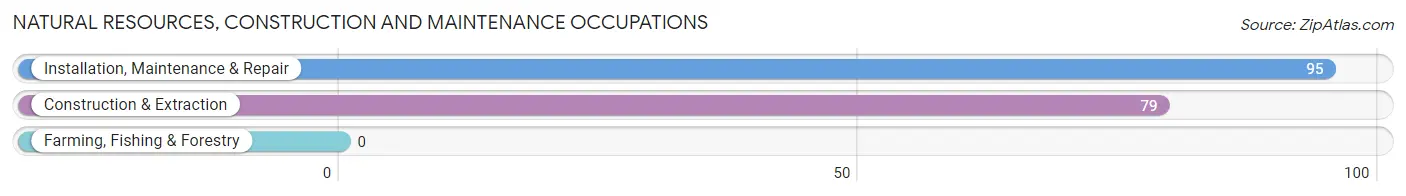
Natural Resources, Construction and Maintenance Occupations by Sex
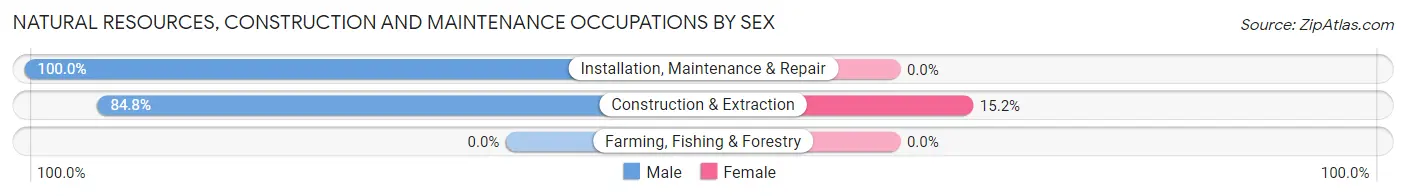
| Occupation | Male | Female |
| Farming, Fishing & Forestry | 0 (0.0%) | 0 (0.0%) |
| Construction & Extraction | 67 (84.8%) | 12 (15.2%) |
| Installation, Maintenance & Repair | 95 (100.0%) | 0 (0.0%) |
| Total (Category) | 162 (93.1%) | 12 (6.9%) |
| Total (Overall) | 1,502 (56.6%) | 1,151 (43.4%) |
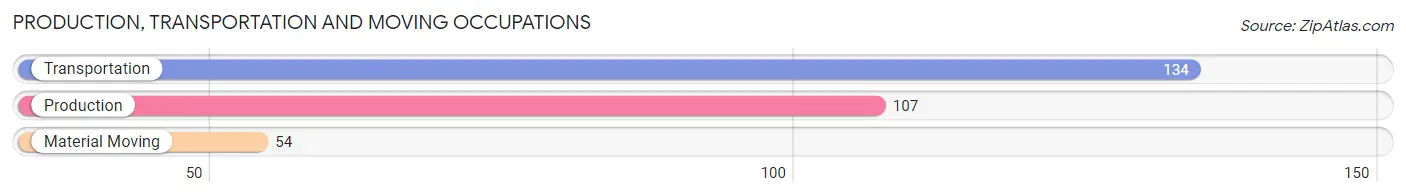
Production, Transportation and Moving Occupations
The most common Production, Transportation and Moving occupations in East Moriches are Transportation (134 | 5.1%), Production (107 | 4.0%), and Material Moving (54 | 2.0%).
Production, Transportation and Moving Occupations by Sex
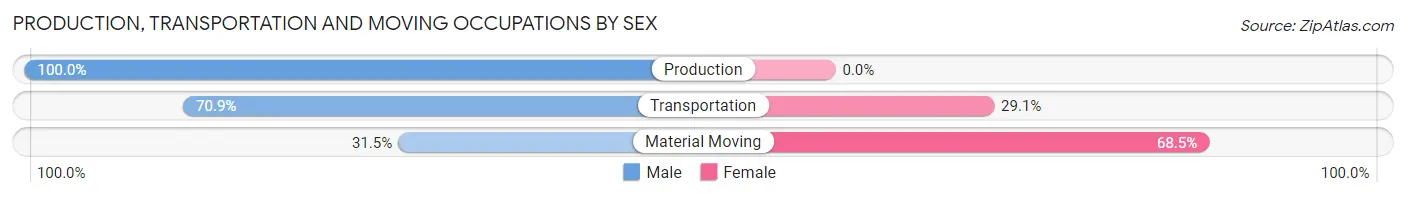
| Occupation | Male | Female |
| Production | 107 (100.0%) | 0 (0.0%) |
| Transportation | 95 (70.9%) | 39 (29.1%) |
| Material Moving | 17 (31.5%) | 37 (68.5%) |
| Total (Category) | 219 (74.2%) | 76 (25.8%) |
| Total (Overall) | 1,502 (56.6%) | 1,151 (43.4%) |
Employment Industries by Sex in East Moriches
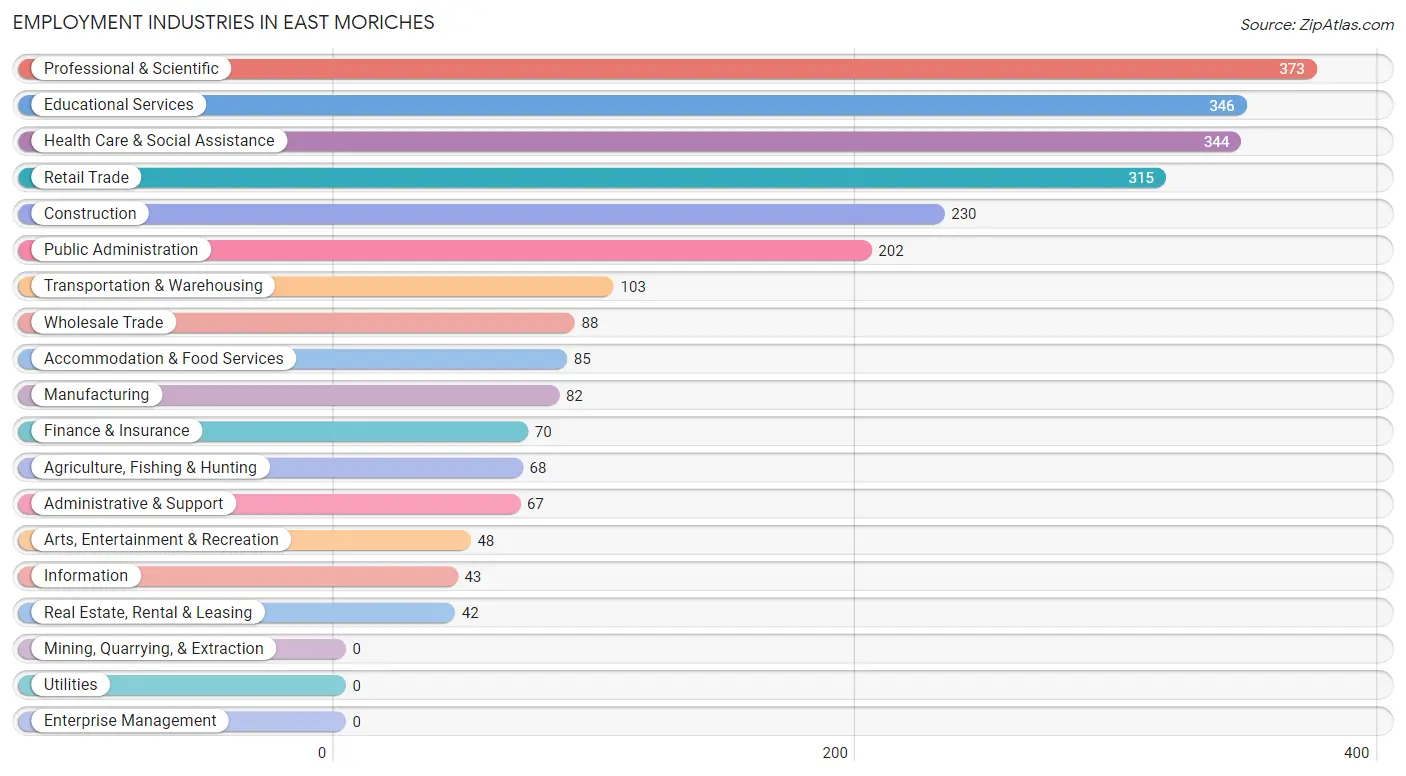
Employment Industries in East Moriches
The major employment industries in East Moriches include Professional & Scientific (373 | 14.1%), Educational Services (346 | 13.0%), Health Care & Social Assistance (344 | 13.0%), Retail Trade (315 | 11.9%), and Construction (230 | 8.7%).
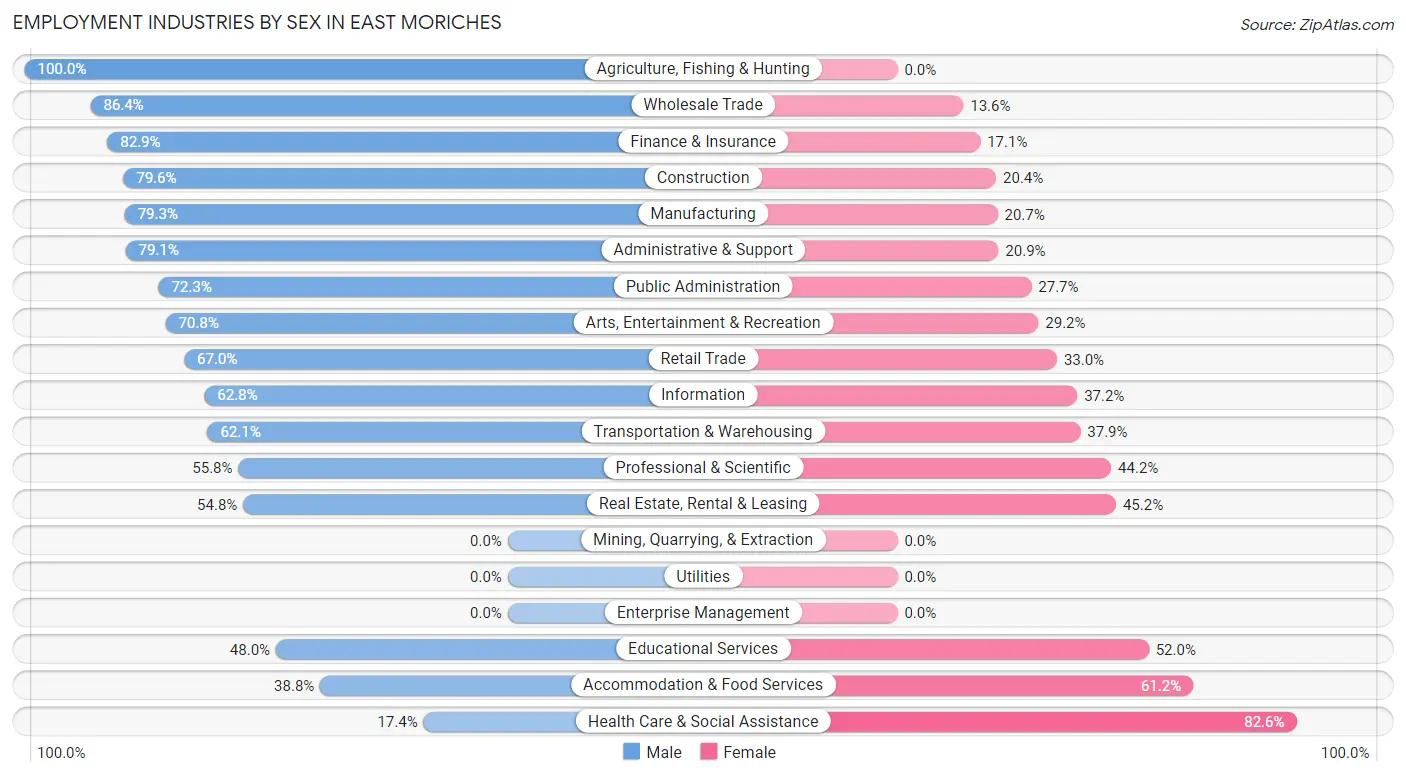
Employment Industries by Sex in East Moriches
The East Moriches industries that see more men than women are Agriculture, Fishing & Hunting (100.0%), Wholesale Trade (86.4%), and Finance & Insurance (82.9%), whereas the industries that tend to have a higher number of women are Health Care & Social Assistance (82.6%), Accommodation & Food Services (61.2%), and Educational Services (52.0%).
| Industry | Male | Female |
| Agriculture, Fishing & Hunting | 68 (100.0%) | 0 (0.0%) |
| Mining, Quarrying, & Extraction | 0 (0.0%) | 0 (0.0%) |
| Construction | 183 (79.6%) | 47 (20.4%) |
| Manufacturing | 65 (79.3%) | 17 (20.7%) |
| Wholesale Trade | 76 (86.4%) | 12 (13.6%) |
| Retail Trade | 211 (67.0%) | 104 (33.0%) |
| Transportation & Warehousing | 64 (62.1%) | 39 (37.9%) |
| Utilities | 0 (0.0%) | 0 (0.0%) |
| Information | 27 (62.8%) | 16 (37.2%) |
| Finance & Insurance | 58 (82.9%) | 12 (17.1%) |
| Real Estate, Rental & Leasing | 23 (54.8%) | 19 (45.2%) |
| Professional & Scientific | 208 (55.8%) | 165 (44.2%) |
| Enterprise Management | 0 (0.0%) | 0 (0.0%) |
| Administrative & Support | 53 (79.1%) | 14 (20.9%) |
| Educational Services | 166 (48.0%) | 180 (52.0%) |
| Health Care & Social Assistance | 60 (17.4%) | 284 (82.6%) |
| Arts, Entertainment & Recreation | 34 (70.8%) | 14 (29.2%) |
| Accommodation & Food Services | 33 (38.8%) | 52 (61.2%) |
| Public Administration | 146 (72.3%) | 56 (27.7%) |
| Total | 1,502 (56.6%) | 1,151 (43.4%) |
Education in East Moriches
School Enrollment in East Moriches
The most common levels of schooling among the 1,265 students in East Moriches are high school (311 | 24.6%), elementary school (306 | 24.2%), and middle school (288 | 22.8%).
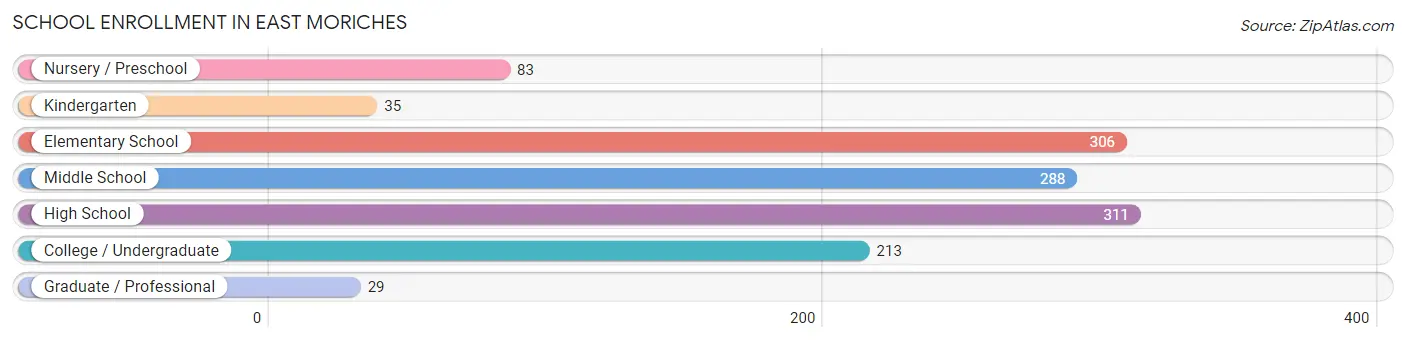
| School Level | # Students | % Students |
| Nursery / Preschool | 83 | 6.6% |
| Kindergarten | 35 | 2.8% |
| Elementary School | 306 | 24.2% |
| Middle School | 288 | 22.8% |
| High School | 311 | 24.6% |
| College / Undergraduate | 213 | 16.8% |
| Graduate / Professional | 29 | 2.3% |
| Total | 1,265 | 100.0% |
School Enrollment by Age by Funding Source in East Moriches
Out of a total of 1,265 students who are enrolled in schools in East Moriches, 163 (12.9%) attend a private institution, while the remaining 1,102 (87.1%) are enrolled in public schools. The age group of 20 to 24 year olds has the highest likelihood of being enrolled in private schools, with 47 (57.3% in the age bracket) enrolled. Conversely, the age group of 25 to 34 year olds has the lowest likelihood of being enrolled in a private school, with 45 (100.0% in the age bracket) attending a public institution.
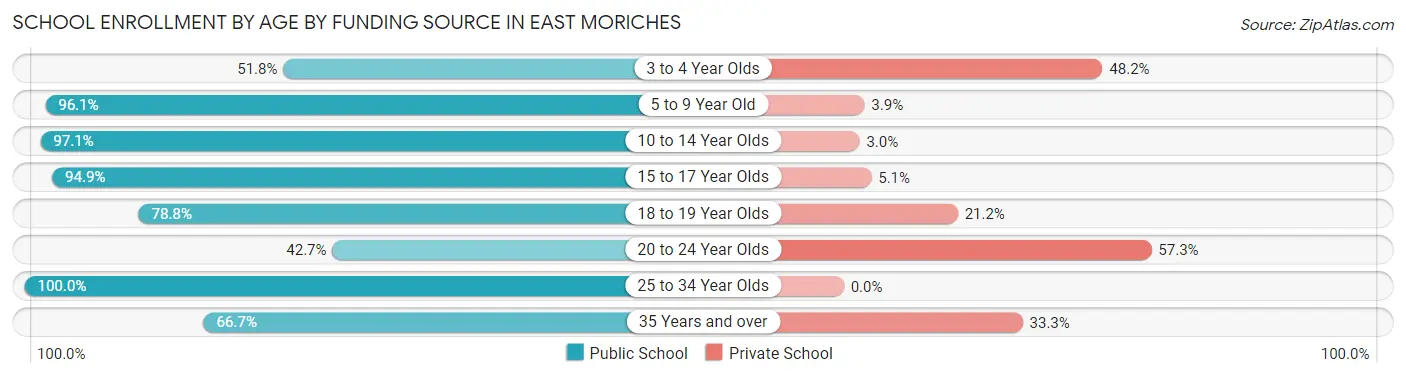
| Age Bracket | Public School | Private School |
| 3 to 4 Year Olds | 43 (51.8%) | 40 (48.2%) |
| 5 to 9 Year Old | 324 (96.1%) | 13 (3.9%) |
| 10 to 14 Year Olds | 362 (97.1%) | 11 (2.9%) |
| 15 to 17 Year Olds | 166 (94.9%) | 9 (5.1%) |
| 18 to 19 Year Olds | 89 (78.8%) | 24 (21.2%) |
| 20 to 24 Year Olds | 35 (42.7%) | 47 (57.3%) |
| 25 to 34 Year Olds | 45 (100.0%) | 0 (0.0%) |
| 35 Years and over | 38 (66.7%) | 19 (33.3%) |
| Total | 1,102 (87.1%) | 163 (12.9%) |
Educational Attainment by Field of Study in East Moriches
Education (350 | 26.5%), business (169 | 12.8%), social sciences (127 | 9.6%), bio, nature & agricultural (108 | 8.2%), and psychology (79 | 6.0%) are the most common fields of study among 1,323 individuals in East Moriches who have obtained a bachelor's degree or higher.
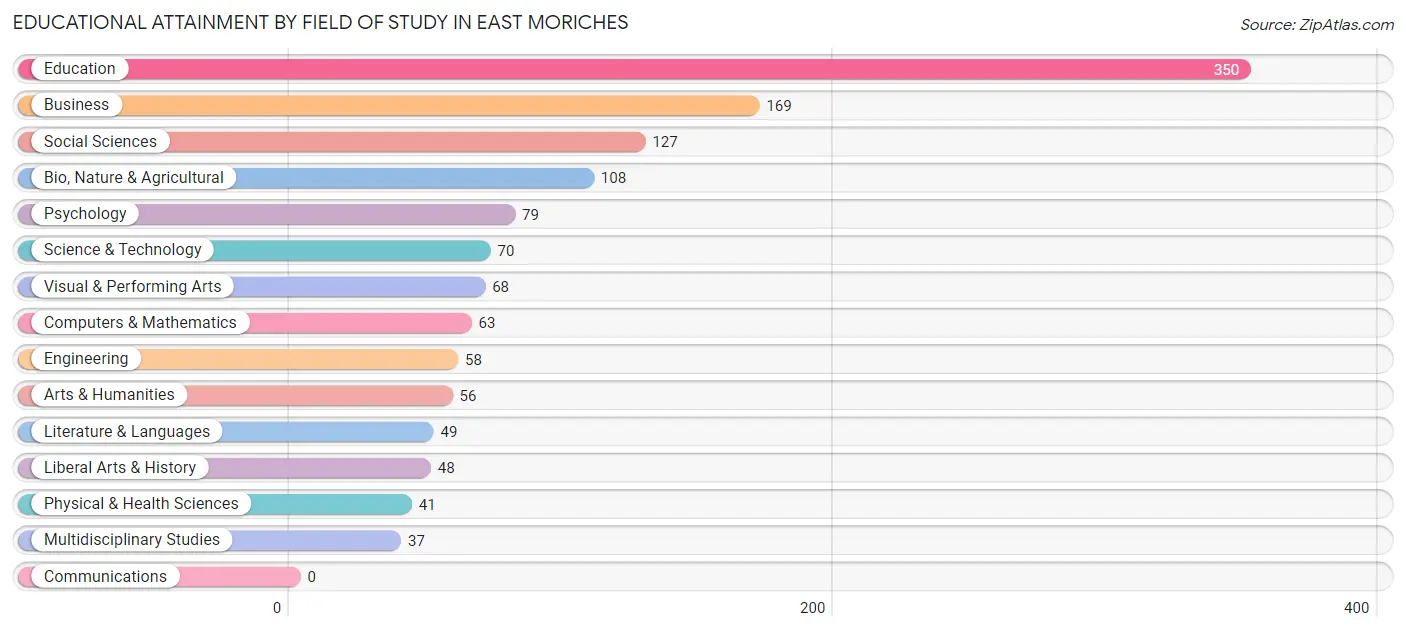
| Field of Study | # Graduates | % Graduates |
| Computers & Mathematics | 63 | 4.8% |
| Bio, Nature & Agricultural | 108 | 8.2% |
| Physical & Health Sciences | 41 | 3.1% |
| Psychology | 79 | 6.0% |
| Social Sciences | 127 | 9.6% |
| Engineering | 58 | 4.4% |
| Multidisciplinary Studies | 37 | 2.8% |
| Science & Technology | 70 | 5.3% |
| Business | 169 | 12.8% |
| Education | 350 | 26.5% |
| Literature & Languages | 49 | 3.7% |
| Liberal Arts & History | 48 | 3.6% |
| Visual & Performing Arts | 68 | 5.1% |
| Communications | 0 | 0.0% |
| Arts & Humanities | 56 | 4.2% |
| Total | 1,323 | 100.0% |
Transportation & Commute in East Moriches
Vehicle Availability by Sex in East Moriches
The most prevalent vehicle ownership categories in East Moriches are males with 2 vehicles (578, accounting for 39.7%) and females with 2 vehicles (412, making up 53.0%).
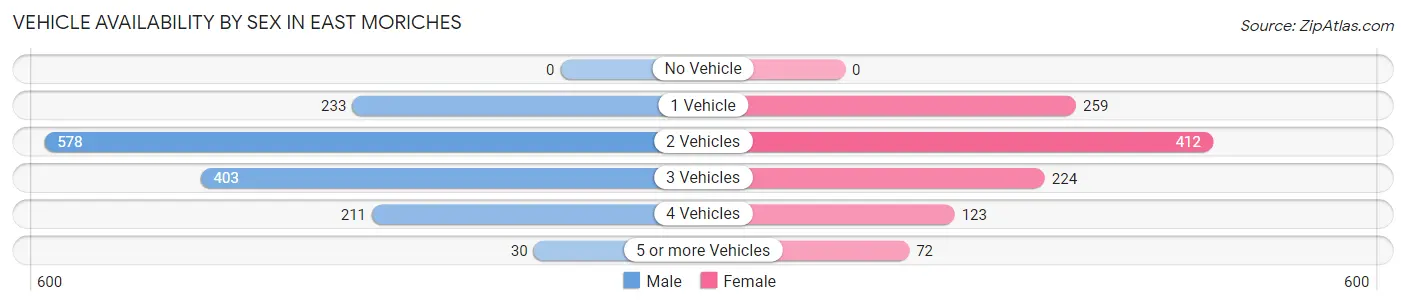
| Vehicles Available | Male | Female |
| No Vehicle | 0 (0.0%) | 0 (0.0%) |
| 1 Vehicle | 233 (16.0%) | 259 (23.8%) |
| 2 Vehicles | 578 (39.7%) | 412 (37.8%) |
| 3 Vehicles | 403 (27.7%) | 224 (20.5%) |
| 4 Vehicles | 211 (14.5%) | 123 (11.3%) |
| 5 or more Vehicles | 30 (2.1%) | 72 (6.6%) |
| Total | 1,455 (100.0%) | 1,090 (100.0%) |
Commute Time in East Moriches
The most frequently occuring commute durations in East Moriches are 60 to 89 minutes (313 commuters, 14.0%), 20 to 24 minutes (303 commuters, 13.6%), and 10 to 14 minutes (300 commuters, 13.4%).
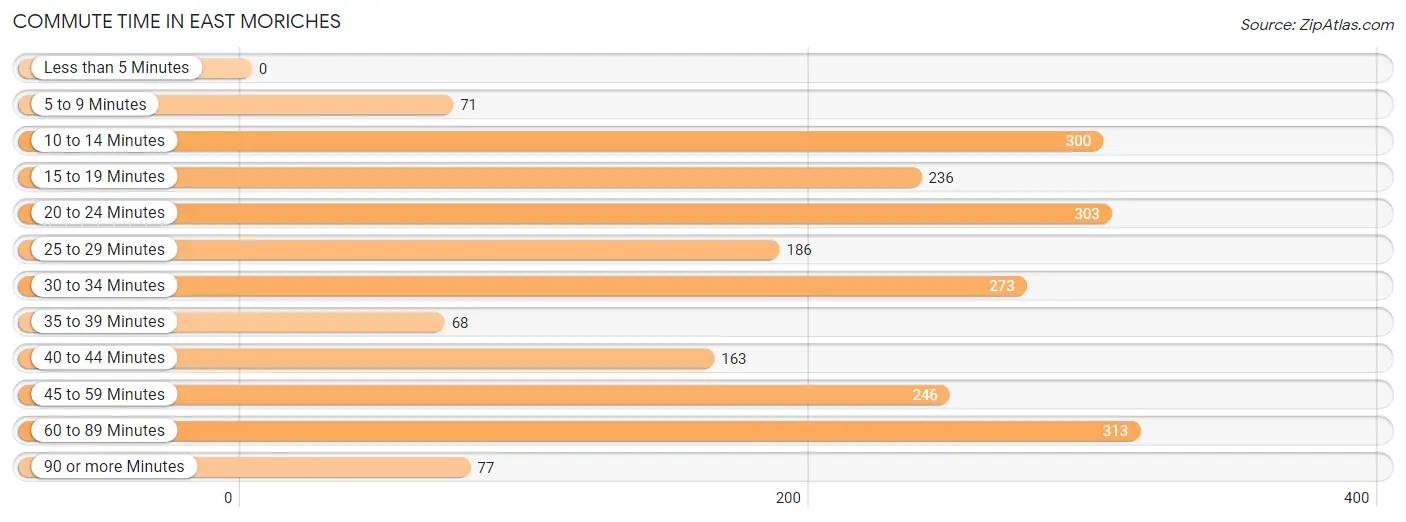
| Commute Time | # Commuters | % Commuters |
| Less than 5 Minutes | 0 | 0.0% |
| 5 to 9 Minutes | 71 | 3.2% |
| 10 to 14 Minutes | 300 | 13.4% |
| 15 to 19 Minutes | 236 | 10.5% |
| 20 to 24 Minutes | 303 | 13.6% |
| 25 to 29 Minutes | 186 | 8.3% |
| 30 to 34 Minutes | 273 | 12.2% |
| 35 to 39 Minutes | 68 | 3.0% |
| 40 to 44 Minutes | 163 | 7.3% |
| 45 to 59 Minutes | 246 | 11.0% |
| 60 to 89 Minutes | 313 | 14.0% |
| 90 or more Minutes | 77 | 3.4% |
Commute Time by Sex in East Moriches
The most common commute times in East Moriches are 60 to 89 minutes (220 commuters, 16.5%) for males and 20 to 24 minutes (147 commuters, 16.3%) for females.
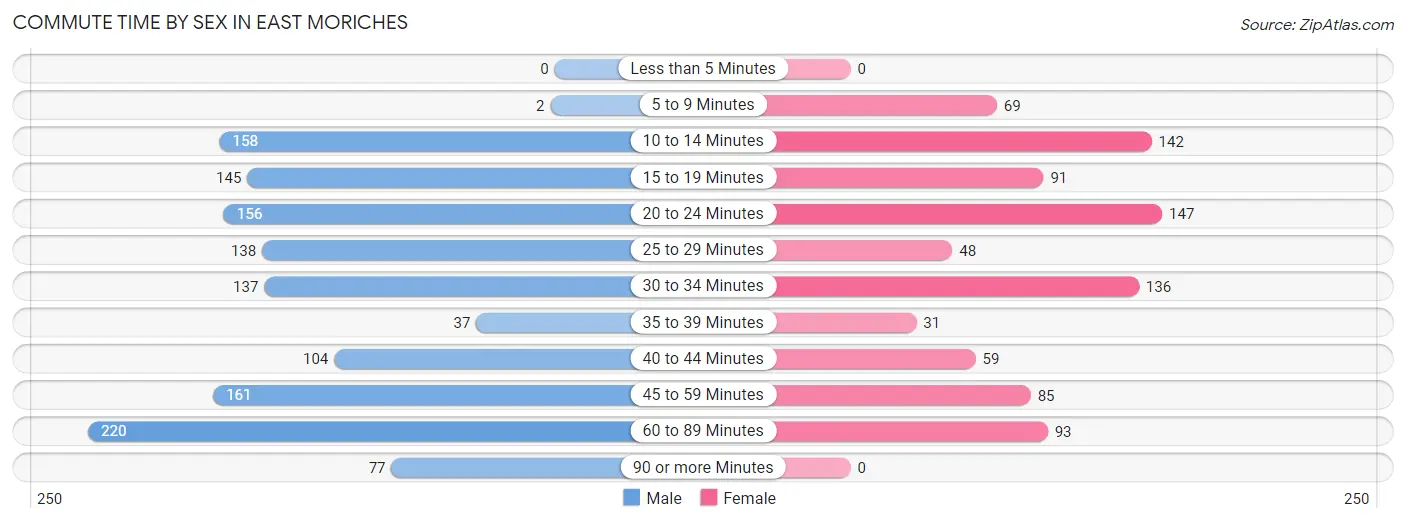
| Commute Time | Male | Female |
| Less than 5 Minutes | 0 (0.0%) | 0 (0.0%) |
| 5 to 9 Minutes | 2 (0.2%) | 69 (7.7%) |
| 10 to 14 Minutes | 158 (11.8%) | 142 (15.8%) |
| 15 to 19 Minutes | 145 (10.9%) | 91 (10.1%) |
| 20 to 24 Minutes | 156 (11.7%) | 147 (16.3%) |
| 25 to 29 Minutes | 138 (10.3%) | 48 (5.3%) |
| 30 to 34 Minutes | 137 (10.3%) | 136 (15.1%) |
| 35 to 39 Minutes | 37 (2.8%) | 31 (3.4%) |
| 40 to 44 Minutes | 104 (7.8%) | 59 (6.6%) |
| 45 to 59 Minutes | 161 (12.1%) | 85 (9.4%) |
| 60 to 89 Minutes | 220 (16.5%) | 93 (10.3%) |
| 90 or more Minutes | 77 (5.8%) | 0 (0.0%) |
Time of Departure to Work by Sex in East Moriches
The most frequent times of departure to work in East Moriches are 7:00 AM to 7:29 AM (258, 19.3%) for males and 7:00 AM to 7:29 AM (157, 17.4%) for females.
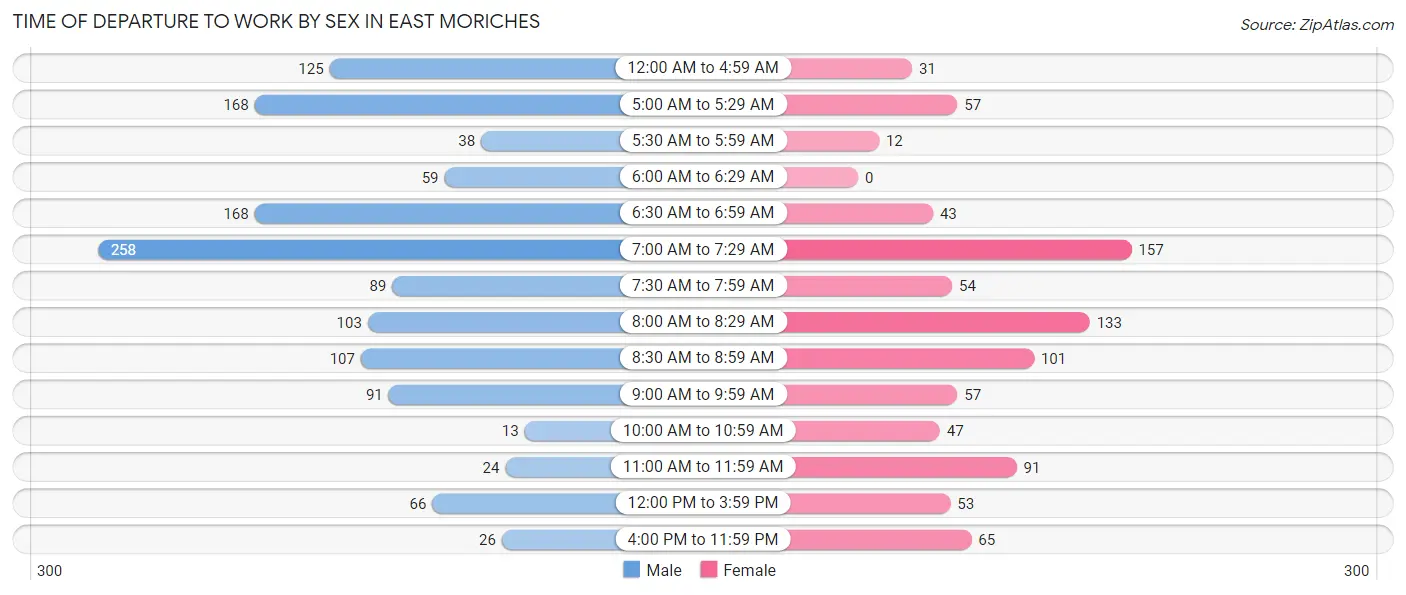
| Time of Departure | Male | Female |
| 12:00 AM to 4:59 AM | 125 (9.4%) | 31 (3.4%) |
| 5:00 AM to 5:29 AM | 168 (12.6%) | 57 (6.3%) |
| 5:30 AM to 5:59 AM | 38 (2.9%) | 12 (1.3%) |
| 6:00 AM to 6:29 AM | 59 (4.4%) | 0 (0.0%) |
| 6:30 AM to 6:59 AM | 168 (12.6%) | 43 (4.8%) |
| 7:00 AM to 7:29 AM | 258 (19.3%) | 157 (17.4%) |
| 7:30 AM to 7:59 AM | 89 (6.7%) | 54 (6.0%) |
| 8:00 AM to 8:29 AM | 103 (7.7%) | 133 (14.8%) |
| 8:30 AM to 8:59 AM | 107 (8.0%) | 101 (11.2%) |
| 9:00 AM to 9:59 AM | 91 (6.8%) | 57 (6.3%) |
| 10:00 AM to 10:59 AM | 13 (1.0%) | 47 (5.2%) |
| 11:00 AM to 11:59 AM | 24 (1.8%) | 91 (10.1%) |
| 12:00 PM to 3:59 PM | 66 (4.9%) | 53 (5.9%) |
| 4:00 PM to 11:59 PM | 26 (1.9%) | 65 (7.2%) |
| Total | 1,335 (100.0%) | 901 (100.0%) |
Housing Occupancy in East Moriches
Occupancy by Ownership in East Moriches
Of the total 1,934 dwellings in East Moriches, owner-occupied units account for 1,461 (75.5%), while renter-occupied units make up 473 (24.5%).
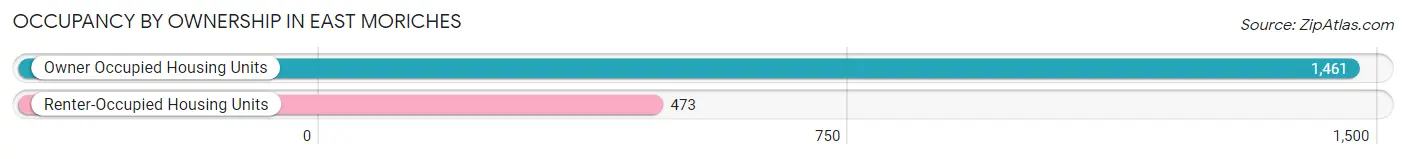
| Occupancy | # Housing Units | % Housing Units |
| Owner Occupied Housing Units | 1,461 | 75.5% |
| Renter-Occupied Housing Units | 473 | 24.5% |
| Total Occupied Housing Units | 1,934 | 100.0% |
Occupancy by Household Size in East Moriches
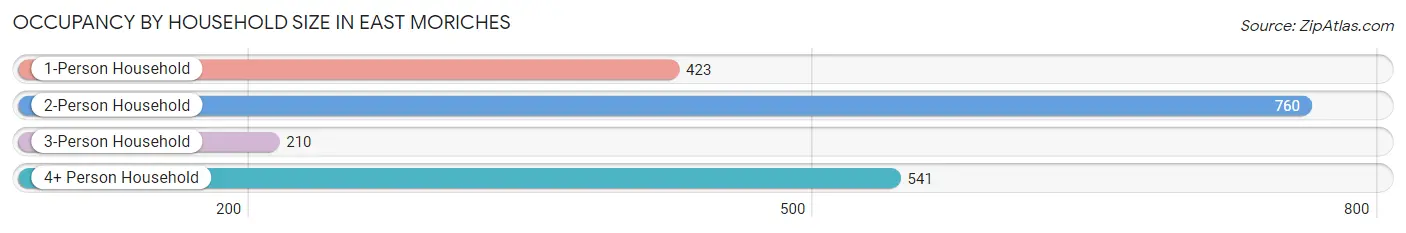
| Household Size | # Housing Units | % Housing Units |
| 1-Person Household | 423 | 21.9% |
| 2-Person Household | 760 | 39.3% |
| 3-Person Household | 210 | 10.9% |
| 4+ Person Household | 541 | 28.0% |
| Total Housing Units | 1,934 | 100.0% |
Occupancy by Ownership by Household Size in East Moriches
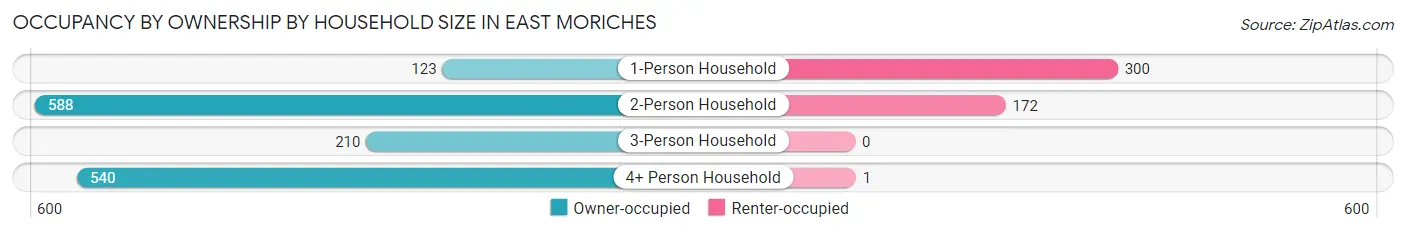
| Household Size | Owner-occupied | Renter-occupied |
| 1-Person Household | 123 (29.1%) | 300 (70.9%) |
| 2-Person Household | 588 (77.4%) | 172 (22.6%) |
| 3-Person Household | 210 (100.0%) | 0 (0.0%) |
| 4+ Person Household | 540 (99.8%) | 1 (0.2%) |
| Total Housing Units | 1,461 (75.5%) | 473 (24.5%) |
Occupancy by Educational Attainment in East Moriches
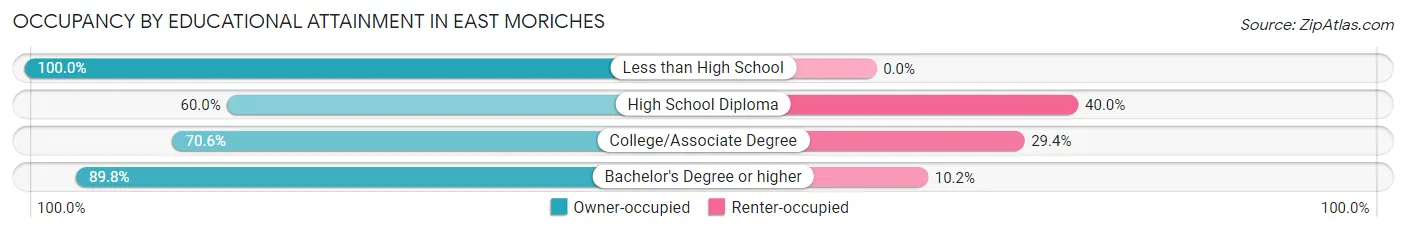
| Household Size | Owner-occupied | Renter-occupied |
| Less than High School | 54 (100.0%) | 0 (0.0%) |
| High School Diploma | 313 (60.0%) | 209 (40.0%) |
| College/Associate Degree | 462 (70.6%) | 192 (29.4%) |
| Bachelor's Degree or higher | 632 (89.8%) | 72 (10.2%) |
Occupancy by Age of Householder in East Moriches
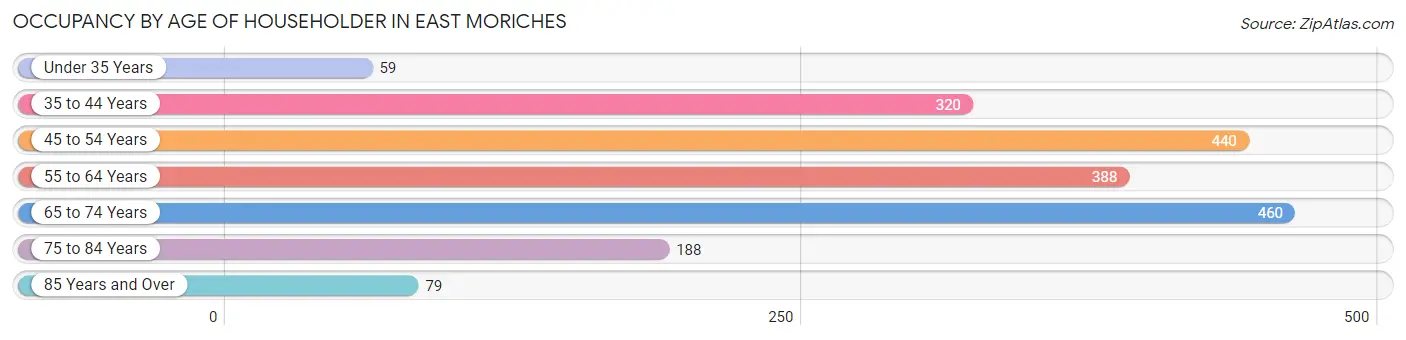
| Age Bracket | # Households | % Households |
| Under 35 Years | 59 | 3.0% |
| 35 to 44 Years | 320 | 16.6% |
| 45 to 54 Years | 440 | 22.8% |
| 55 to 64 Years | 388 | 20.1% |
| 65 to 74 Years | 460 | 23.8% |
| 75 to 84 Years | 188 | 9.7% |
| 85 Years and Over | 79 | 4.1% |
| Total | 1,934 | 100.0% |
Housing Finances in East Moriches
Median Income by Occupancy in East Moriches
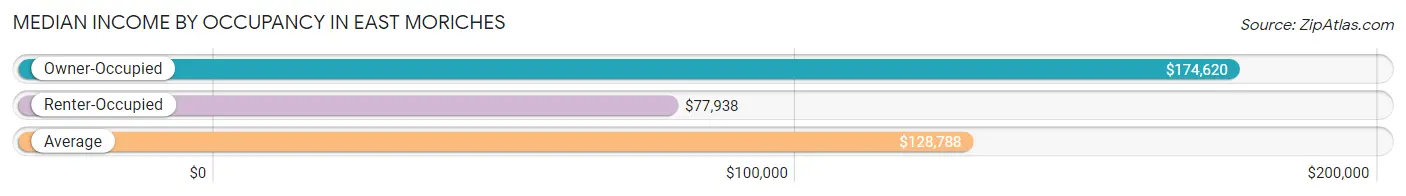
| Occupancy Type | # Households | Median Income |
| Owner-Occupied | 1,461 (75.5%) | $174,620 |
| Renter-Occupied | 473 (24.5%) | $77,938 |
| Average | 1,934 (100.0%) | $128,788 |
Occupancy by Householder Income Bracket in East Moriches
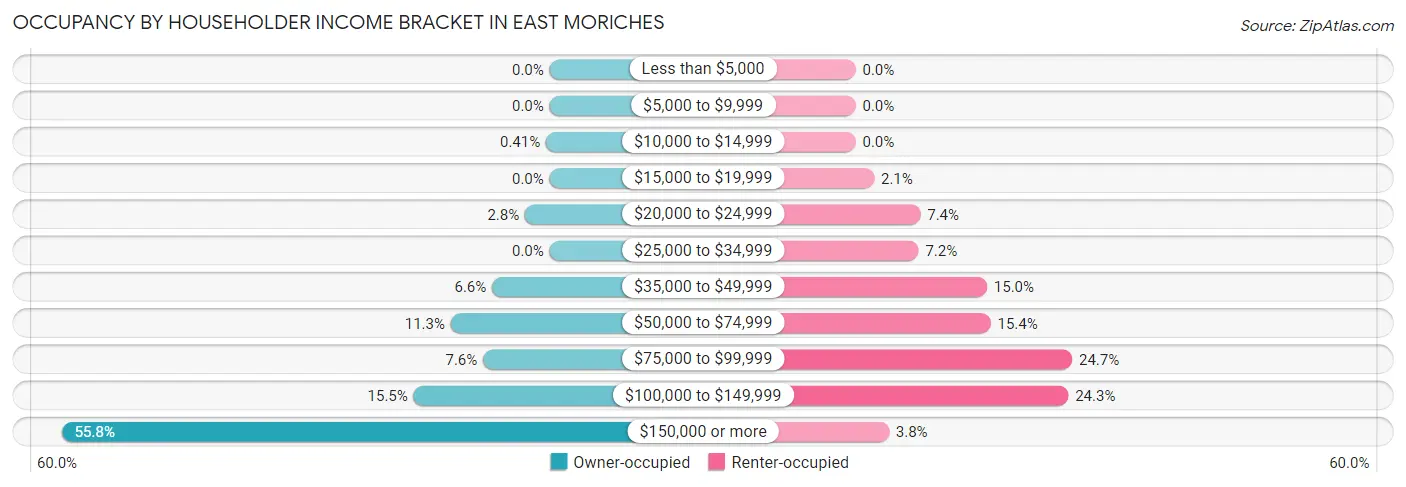
| Income Bracket | Owner-occupied | Renter-occupied |
| Less than $5,000 | 0 (0.0%) | 0 (0.0%) |
| $5,000 to $9,999 | 0 (0.0%) | 0 (0.0%) |
| $10,000 to $14,999 | 6 (0.4%) | 0 (0.0%) |
| $15,000 to $19,999 | 0 (0.0%) | 10 (2.1%) |
| $20,000 to $24,999 | 41 (2.8%) | 35 (7.4%) |
| $25,000 to $34,999 | 0 (0.0%) | 34 (7.2%) |
| $35,000 to $49,999 | 96 (6.6%) | 71 (15.0%) |
| $50,000 to $74,999 | 165 (11.3%) | 73 (15.4%) |
| $75,000 to $99,999 | 111 (7.6%) | 117 (24.7%) |
| $100,000 to $149,999 | 227 (15.5%) | 115 (24.3%) |
| $150,000 or more | 815 (55.8%) | 18 (3.8%) |
| Total | 1,461 (100.0%) | 473 (100.0%) |
Monthly Housing Cost Tiers in East Moriches
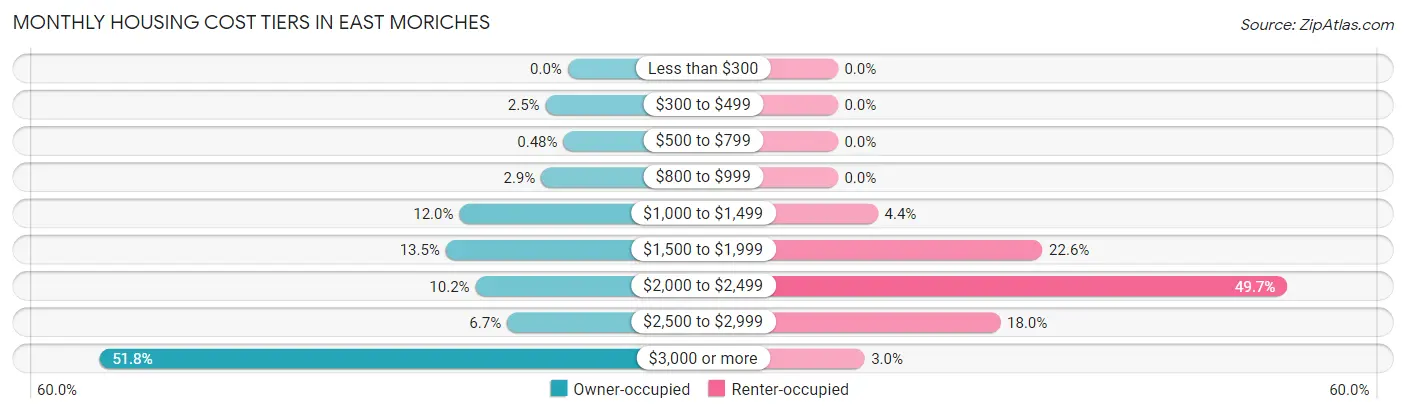
| Monthly Cost | Owner-occupied | Renter-occupied |
| Less than $300 | 0 (0.0%) | 0 (0.0%) |
| $300 to $499 | 36 (2.5%) | 0 (0.0%) |
| $500 to $799 | 7 (0.5%) | 0 (0.0%) |
| $800 to $999 | 43 (2.9%) | 0 (0.0%) |
| $1,000 to $1,499 | 175 (12.0%) | 21 (4.4%) |
| $1,500 to $1,999 | 197 (13.5%) | 107 (22.6%) |
| $2,000 to $2,499 | 149 (10.2%) | 235 (49.7%) |
| $2,500 to $2,999 | 98 (6.7%) | 85 (18.0%) |
| $3,000 or more | 756 (51.7%) | 14 (3.0%) |
| Total | 1,461 (100.0%) | 473 (100.0%) |
Physical Housing Characteristics in East Moriches
Housing Structures in East Moriches
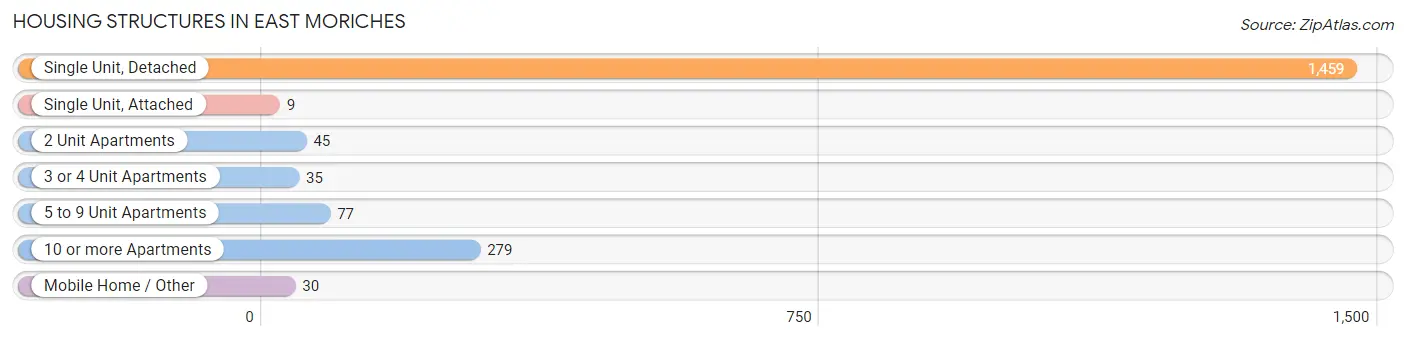
| Structure Type | # Housing Units | % Housing Units |
| Single Unit, Detached | 1,459 | 75.4% |
| Single Unit, Attached | 9 | 0.5% |
| 2 Unit Apartments | 45 | 2.3% |
| 3 or 4 Unit Apartments | 35 | 1.8% |
| 5 to 9 Unit Apartments | 77 | 4.0% |
| 10 or more Apartments | 279 | 14.4% |
| Mobile Home / Other | 30 | 1.5% |
| Total | 1,934 | 100.0% |
Housing Structures by Occupancy in East Moriches
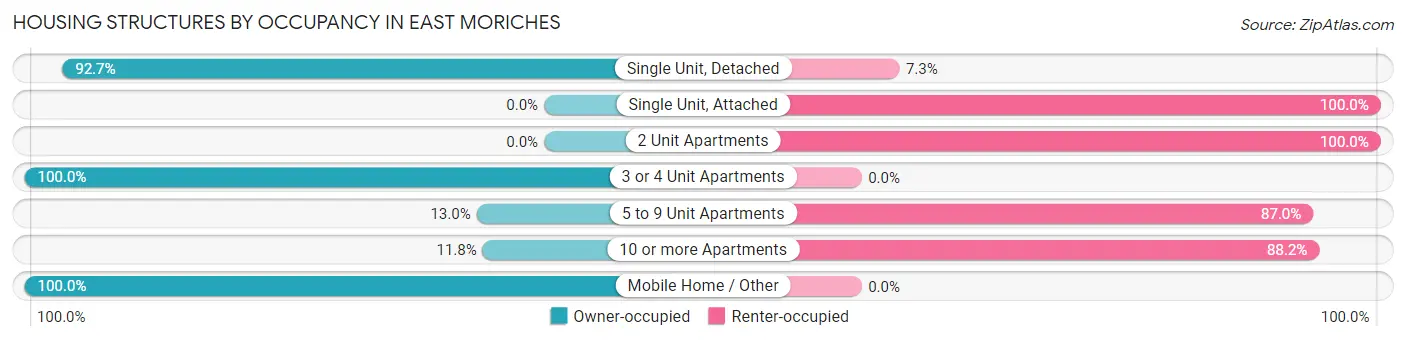
| Structure Type | Owner-occupied | Renter-occupied |
| Single Unit, Detached | 1,353 (92.7%) | 106 (7.3%) |
| Single Unit, Attached | 0 (0.0%) | 9 (100.0%) |
| 2 Unit Apartments | 0 (0.0%) | 45 (100.0%) |
| 3 or 4 Unit Apartments | 35 (100.0%) | 0 (0.0%) |
| 5 to 9 Unit Apartments | 10 (13.0%) | 67 (87.0%) |
| 10 or more Apartments | 33 (11.8%) | 246 (88.2%) |
| Mobile Home / Other | 30 (100.0%) | 0 (0.0%) |
| Total | 1,461 (75.5%) | 473 (24.5%) |
Housing Structures by Number of Rooms in East Moriches
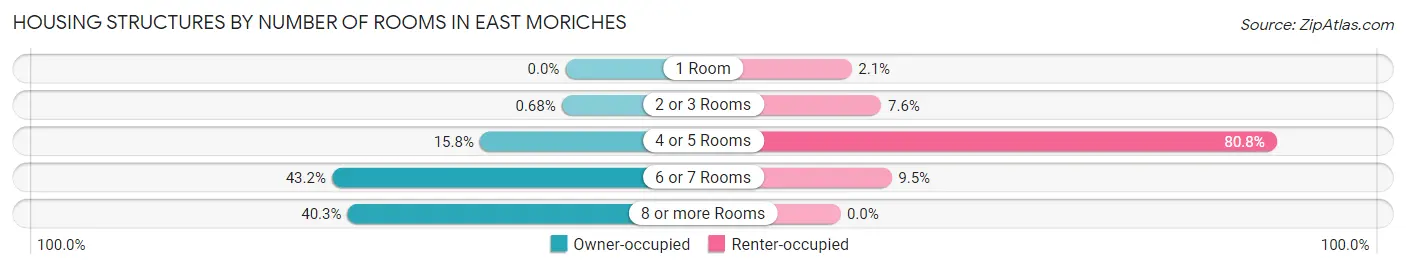
| Number of Rooms | Owner-occupied | Renter-occupied |
| 1 Room | 0 (0.0%) | 10 (2.1%) |
| 2 or 3 Rooms | 10 (0.7%) | 36 (7.6%) |
| 4 or 5 Rooms | 231 (15.8%) | 382 (80.8%) |
| 6 or 7 Rooms | 631 (43.2%) | 45 (9.5%) |
| 8 or more Rooms | 589 (40.3%) | 0 (0.0%) |
| Total | 1,461 (100.0%) | 473 (100.0%) |
Housing Structure by Heating Type in East Moriches
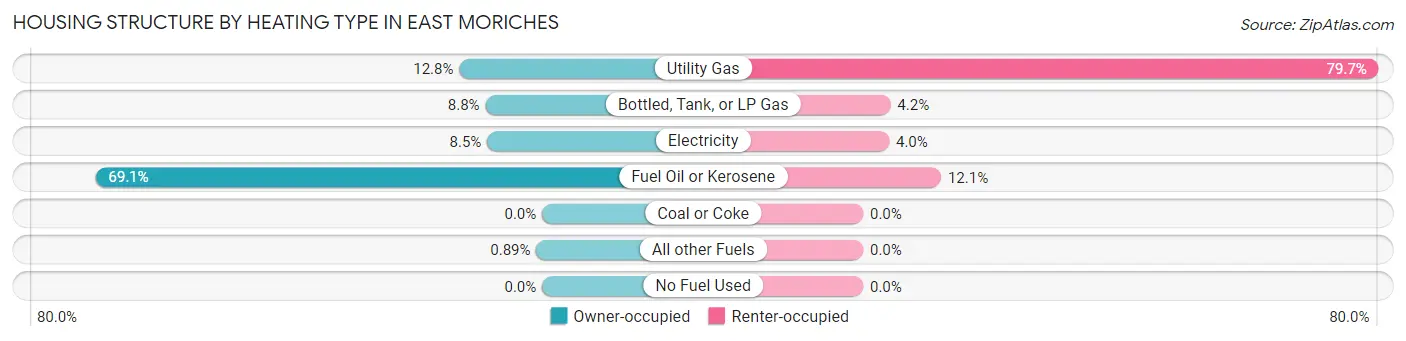
| Heating Type | Owner-occupied | Renter-occupied |
| Utility Gas | 187 (12.8%) | 377 (79.7%) |
| Bottled, Tank, or LP Gas | 128 (8.8%) | 20 (4.2%) |
| Electricity | 124 (8.5%) | 19 (4.0%) |
| Fuel Oil or Kerosene | 1,009 (69.1%) | 57 (12.0%) |
| Coal or Coke | 0 (0.0%) | 0 (0.0%) |
| All other Fuels | 13 (0.9%) | 0 (0.0%) |
| No Fuel Used | 0 (0.0%) | 0 (0.0%) |
| Total | 1,461 (100.0%) | 473 (100.0%) |
Household Vehicle Usage in East Moriches
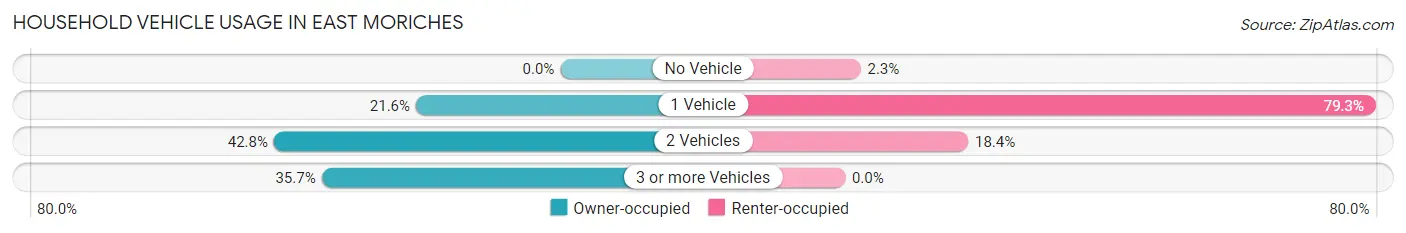
| Vehicles per Household | Owner-occupied | Renter-occupied |
| No Vehicle | 0 (0.0%) | 11 (2.3%) |
| 1 Vehicle | 315 (21.6%) | 375 (79.3%) |
| 2 Vehicles | 625 (42.8%) | 87 (18.4%) |
| 3 or more Vehicles | 521 (35.7%) | 0 (0.0%) |
| Total | 1,461 (100.0%) | 473 (100.0%) |
Real Estate & Mortgages in East Moriches
Real Estate and Mortgage Overview in East Moriches
| Characteristic | Without Mortgage | With Mortgage |
| Housing Units | 413 | 1,048 |
| Median Property Value | $538,700 | $578,400 |
| Median Household Income | $92,917 | $684 |
| Monthly Housing Costs | $1,481 | $727 |
| Real Estate Taxes | $10,001 | $13 |
Property Value by Mortgage Status in East Moriches
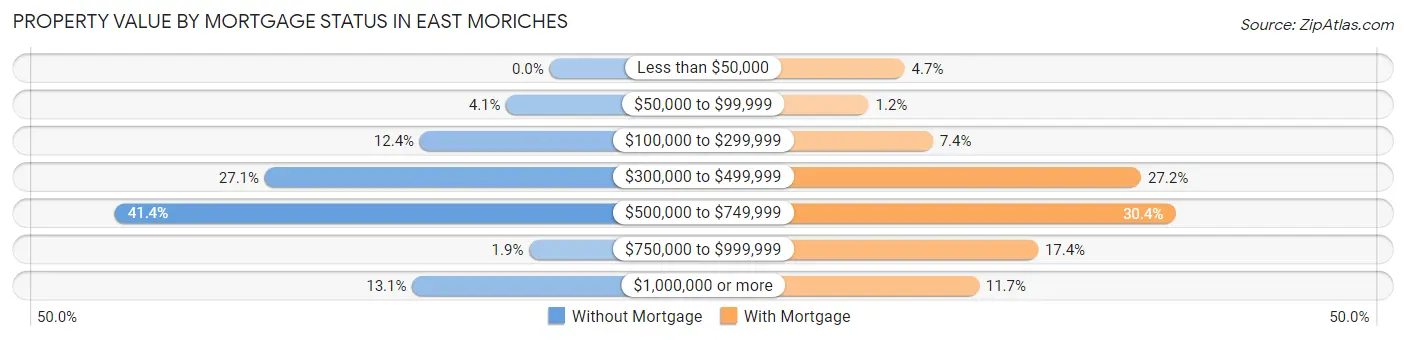
| Property Value | Without Mortgage | With Mortgage |
| Less than $50,000 | 0 (0.0%) | 49 (4.7%) |
| $50,000 to $99,999 | 17 (4.1%) | 13 (1.2%) |
| $100,000 to $299,999 | 51 (12.3%) | 77 (7.3%) |
| $300,000 to $499,999 | 112 (27.1%) | 285 (27.2%) |
| $500,000 to $749,999 | 171 (41.4%) | 319 (30.4%) |
| $750,000 to $999,999 | 8 (1.9%) | 182 (17.4%) |
| $1,000,000 or more | 54 (13.1%) | 123 (11.7%) |
| Total | 413 (100.0%) | 1,048 (100.0%) |
Household Income by Mortgage Status in East Moriches
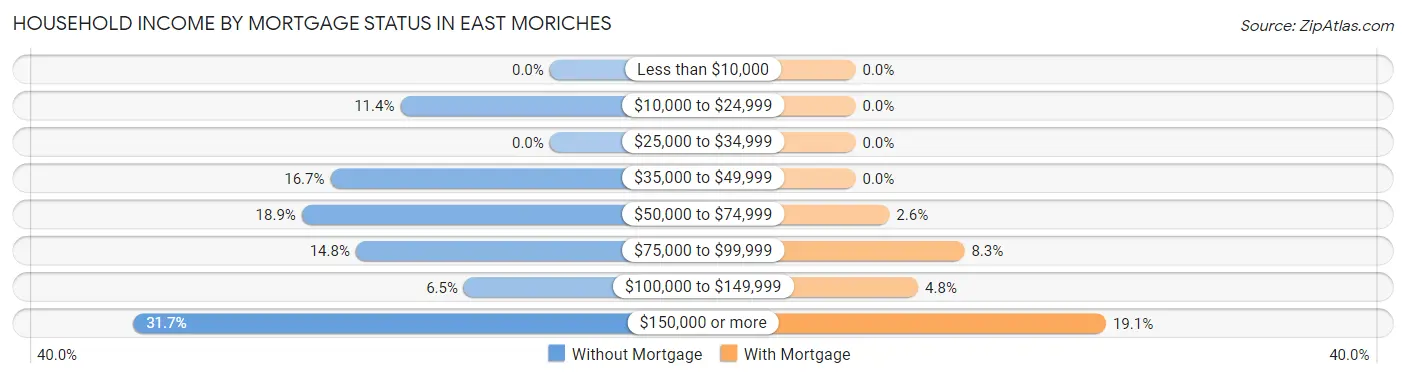
| Household Income | Without Mortgage | With Mortgage |
| Less than $10,000 | 0 (0.0%) | 0 (0.0%) |
| $10,000 to $24,999 | 47 (11.4%) | 0 (0.0%) |
| $25,000 to $34,999 | 0 (0.0%) | 0 (0.0%) |
| $35,000 to $49,999 | 69 (16.7%) | 0 (0.0%) |
| $50,000 to $74,999 | 78 (18.9%) | 27 (2.6%) |
| $75,000 to $99,999 | 61 (14.8%) | 87 (8.3%) |
| $100,000 to $149,999 | 27 (6.5%) | 50 (4.8%) |
| $150,000 or more | 131 (31.7%) | 200 (19.1%) |
| Total | 413 (100.0%) | 1,048 (100.0%) |
Property Value to Household Income Ratio in East Moriches
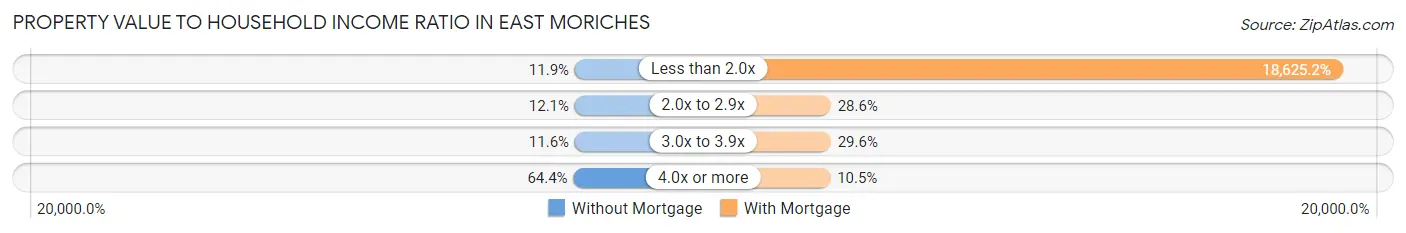
| Value-to-Income Ratio | Without Mortgage | With Mortgage |
| Less than 2.0x | 49 (11.9%) | 195,192 (18,625.2%) |
| 2.0x to 2.9x | 50 (12.1%) | 300 (28.6%) |
| 3.0x to 3.9x | 48 (11.6%) | 310 (29.6%) |
| 4.0x or more | 266 (64.4%) | 110 (10.5%) |
| Total | 413 (100.0%) | 1,048 (100.0%) |
Real Estate Taxes by Mortgage Status in East Moriches
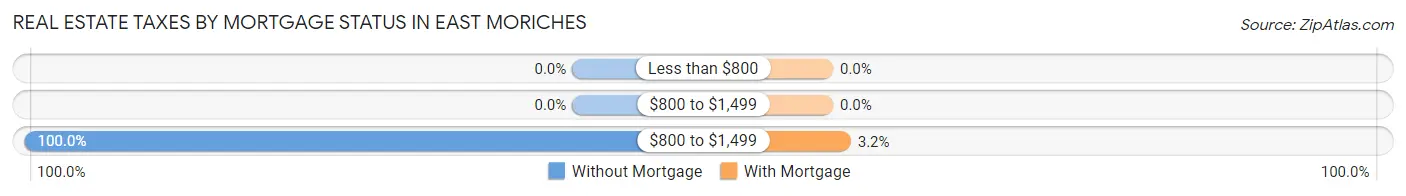
| Property Taxes | Without Mortgage | With Mortgage |
| Less than $800 | 0 (0.0%) | 0 (0.0%) |
| $800 to $1,499 | 0 (0.0%) | 0 (0.0%) |
| $800 to $1,499 | 413 (100.0%) | 34 (3.2%) |
| Total | 413 (100.0%) | 1,048 (100.0%) |
Health & Disability in East Moriches
Health Insurance Coverage by Age in East Moriches
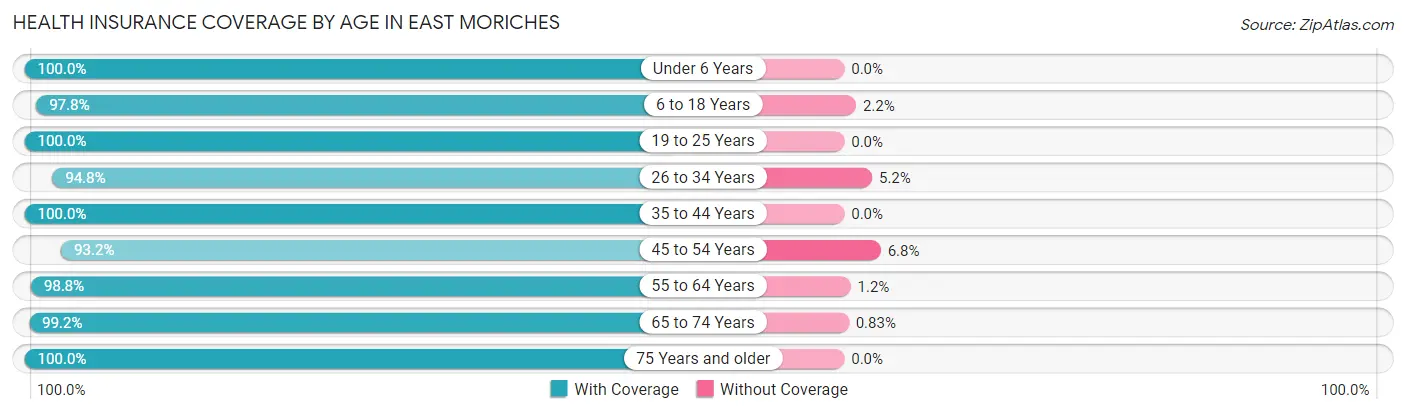
| Age Bracket | With Coverage | Without Coverage |
| Under 6 Years | 282 (100.0%) | 0 (0.0%) |
| 6 to 18 Years | 986 (97.8%) | 22 (2.2%) |
| 19 to 25 Years | 351 (100.0%) | 0 (0.0%) |
| 26 to 34 Years | 275 (94.8%) | 15 (5.2%) |
| 35 to 44 Years | 659 (100.0%) | 0 (0.0%) |
| 45 to 54 Years | 783 (93.2%) | 57 (6.8%) |
| 55 to 64 Years | 757 (98.8%) | 9 (1.2%) |
| 65 to 74 Years | 836 (99.2%) | 7 (0.8%) |
| 75 Years and older | 431 (100.0%) | 0 (0.0%) |
| Total | 5,360 (98.0%) | 110 (2.0%) |
Health Insurance Coverage by Citizenship Status in East Moriches
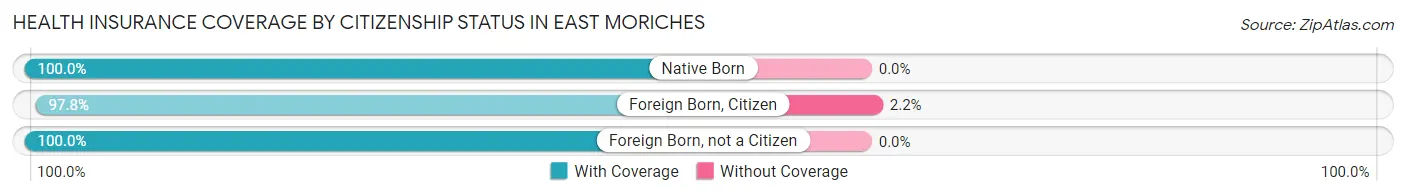
| Citizenship Status | With Coverage | Without Coverage |
| Native Born | 282 (100.0%) | 0 (0.0%) |
| Foreign Born, Citizen | 986 (97.8%) | 22 (2.2%) |
| Foreign Born, not a Citizen | 351 (100.0%) | 0 (0.0%) |
Health Insurance Coverage by Household Income in East Moriches
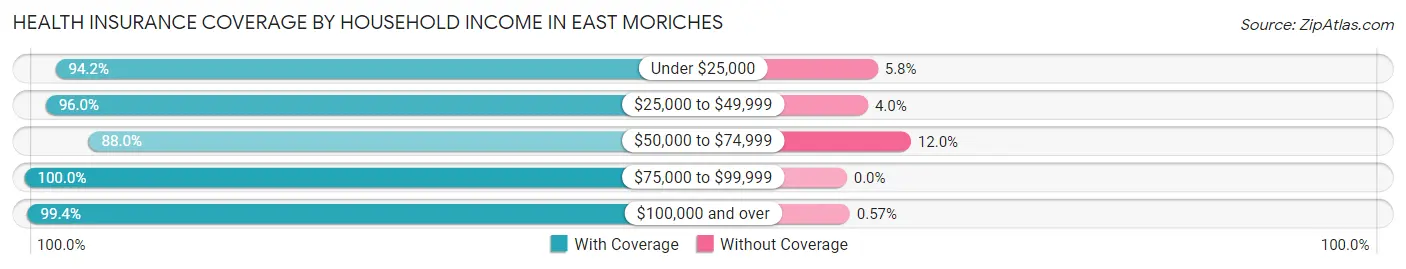
| Household Income | With Coverage | Without Coverage |
| Under $25,000 | 146 (94.2%) | 9 (5.8%) |
| $25,000 to $49,999 | 364 (96.0%) | 15 (4.0%) |
| $50,000 to $74,999 | 469 (88.0%) | 64 (12.0%) |
| $75,000 to $99,999 | 436 (100.0%) | 0 (0.0%) |
| $100,000 and over | 3,833 (99.4%) | 22 (0.6%) |
Public vs Private Health Insurance Coverage by Age in East Moriches
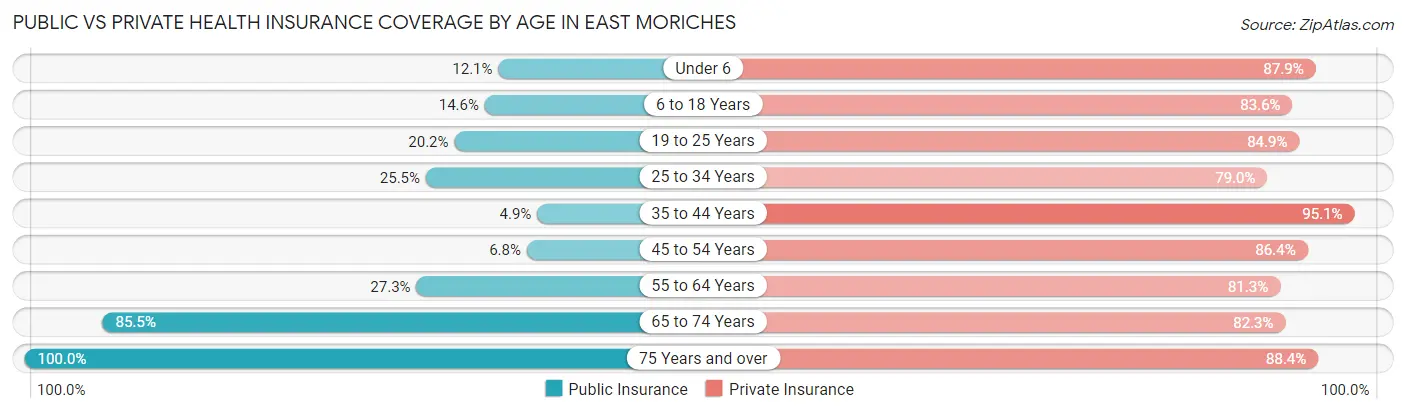
| Age Bracket | Public Insurance | Private Insurance |
| Under 6 | 34 (12.1%) | 248 (87.9%) |
| 6 to 18 Years | 147 (14.6%) | 843 (83.6%) |
| 19 to 25 Years | 71 (20.2%) | 298 (84.9%) |
| 25 to 34 Years | 74 (25.5%) | 229 (79.0%) |
| 35 to 44 Years | 32 (4.9%) | 627 (95.1%) |
| 45 to 54 Years | 57 (6.8%) | 726 (86.4%) |
| 55 to 64 Years | 209 (27.3%) | 623 (81.3%) |
| 65 to 74 Years | 721 (85.5%) | 694 (82.3%) |
| 75 Years and over | 431 (100.0%) | 381 (88.4%) |
| Total | 1,776 (32.5%) | 4,669 (85.4%) |
Disability Status by Sex by Age in East Moriches
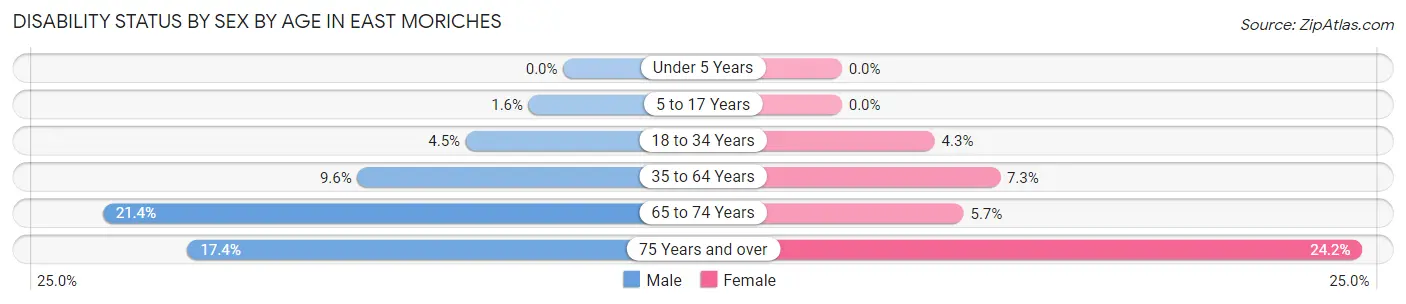
| Age Bracket | Male | Female |
| Under 5 Years | 0 (0.0%) | 0 (0.0%) |
| 5 to 17 Years | 8 (1.6%) | 0 (0.0%) |
| 18 to 34 Years | 21 (4.5%) | 11 (4.3%) |
| 35 to 64 Years | 107 (9.6%) | 84 (7.3%) |
| 65 to 74 Years | 78 (21.4%) | 27 (5.7%) |
| 75 Years and over | 34 (17.4%) | 57 (24.1%) |
Disability Class by Sex by Age in East Moriches
Disability Class: Hearing Difficulty
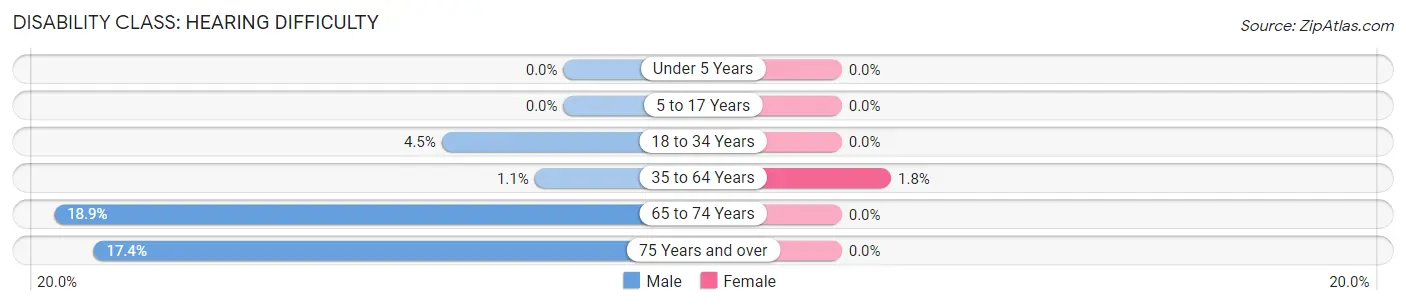
| Age Bracket | Male | Female |
| Under 5 Years | 0 (0.0%) | 0 (0.0%) |
| 5 to 17 Years | 0 (0.0%) | 0 (0.0%) |
| 18 to 34 Years | 21 (4.5%) | 0 (0.0%) |
| 35 to 64 Years | 12 (1.1%) | 21 (1.8%) |
| 65 to 74 Years | 69 (18.9%) | 0 (0.0%) |
| 75 Years and over | 34 (17.4%) | 0 (0.0%) |
Disability Class: Vision Difficulty
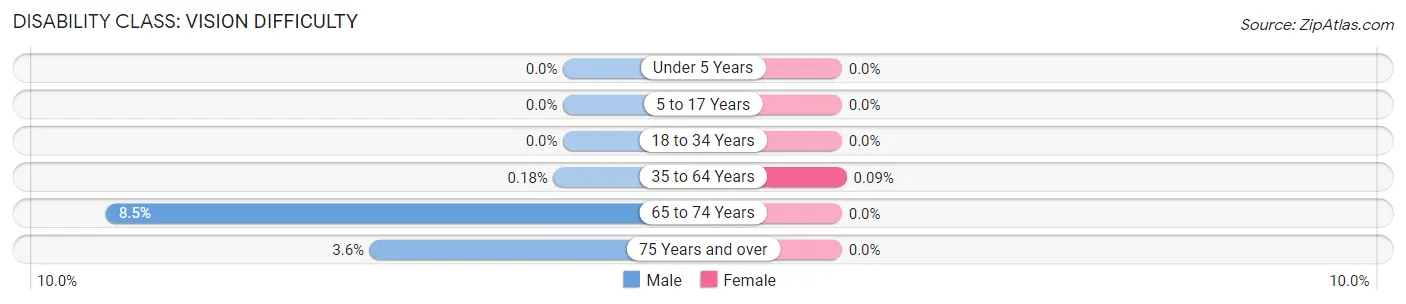
| Age Bracket | Male | Female |
| Under 5 Years | 0 (0.0%) | 0 (0.0%) |
| 5 to 17 Years | 0 (0.0%) | 0 (0.0%) |
| 18 to 34 Years | 0 (0.0%) | 0 (0.0%) |
| 35 to 64 Years | 2 (0.2%) | 1 (0.1%) |
| 65 to 74 Years | 31 (8.5%) | 0 (0.0%) |
| 75 Years and over | 7 (3.6%) | 0 (0.0%) |
Disability Class: Cognitive Difficulty
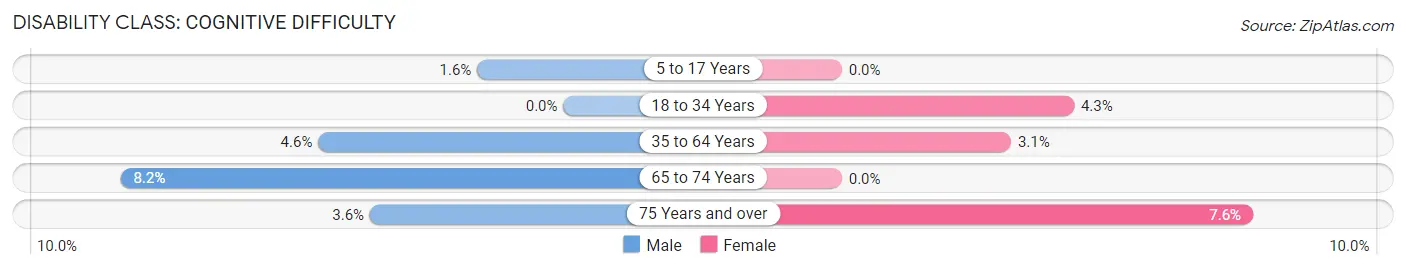
| Age Bracket | Male | Female |
| 5 to 17 Years | 8 (1.6%) | 0 (0.0%) |
| 18 to 34 Years | 0 (0.0%) | 11 (4.3%) |
| 35 to 64 Years | 51 (4.5%) | 36 (3.1%) |
| 65 to 74 Years | 30 (8.2%) | 0 (0.0%) |
| 75 Years and over | 7 (3.6%) | 18 (7.6%) |
Disability Class: Ambulatory Difficulty
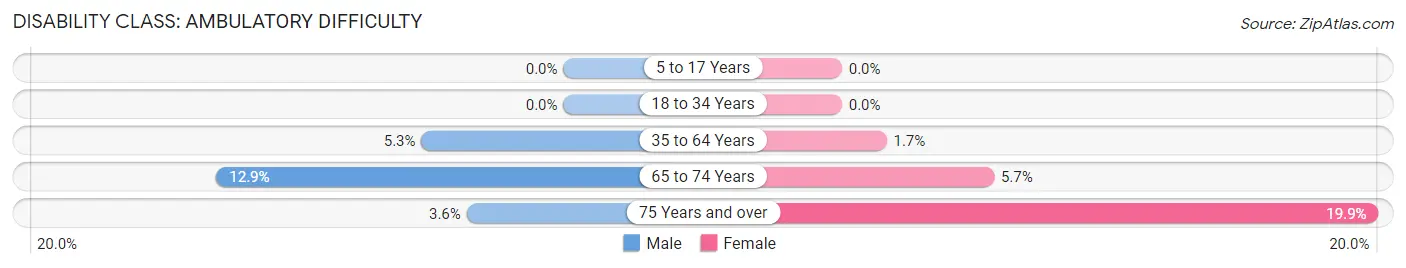
| Age Bracket | Male | Female |
| 5 to 17 Years | 0 (0.0%) | 0 (0.0%) |
| 18 to 34 Years | 0 (0.0%) | 0 (0.0%) |
| 35 to 64 Years | 59 (5.3%) | 19 (1.7%) |
| 65 to 74 Years | 47 (12.9%) | 27 (5.7%) |
| 75 Years and over | 7 (3.6%) | 47 (19.9%) |
Disability Class: Self-Care Difficulty
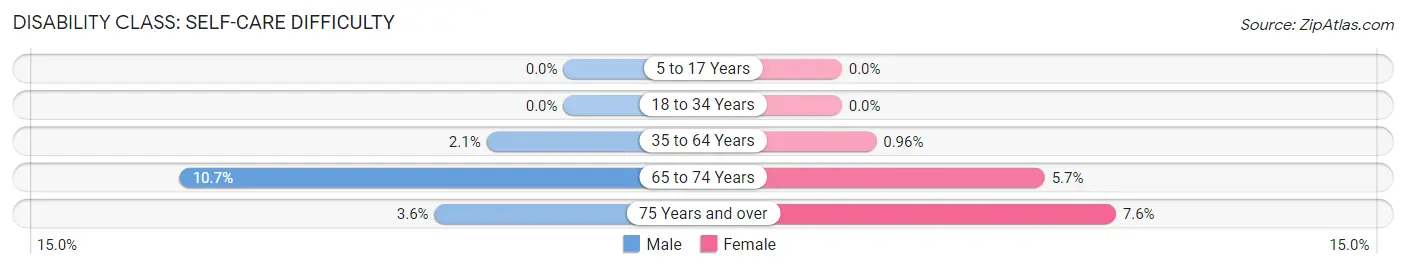
| Age Bracket | Male | Female |
| 5 to 17 Years | 0 (0.0%) | 0 (0.0%) |
| 18 to 34 Years | 0 (0.0%) | 0 (0.0%) |
| 35 to 64 Years | 24 (2.1%) | 11 (1.0%) |
| 65 to 74 Years | 39 (10.7%) | 27 (5.7%) |
| 75 Years and over | 7 (3.6%) | 18 (7.6%) |
Technology Access in East Moriches
Computing Device Access in East Moriches
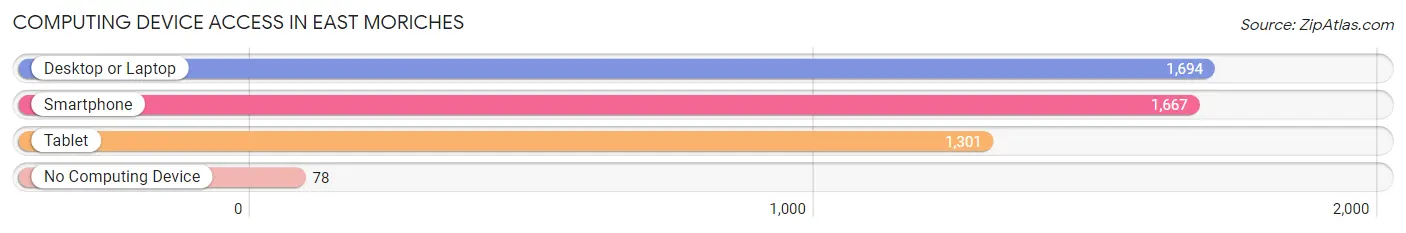
| Device Type | # Households | % Households |
| Desktop or Laptop | 1,694 | 87.6% |
| Smartphone | 1,667 | 86.2% |
| Tablet | 1,301 | 67.3% |
| No Computing Device | 78 | 4.0% |
| Total | 1,934 | 100.0% |
Internet Access in East Moriches
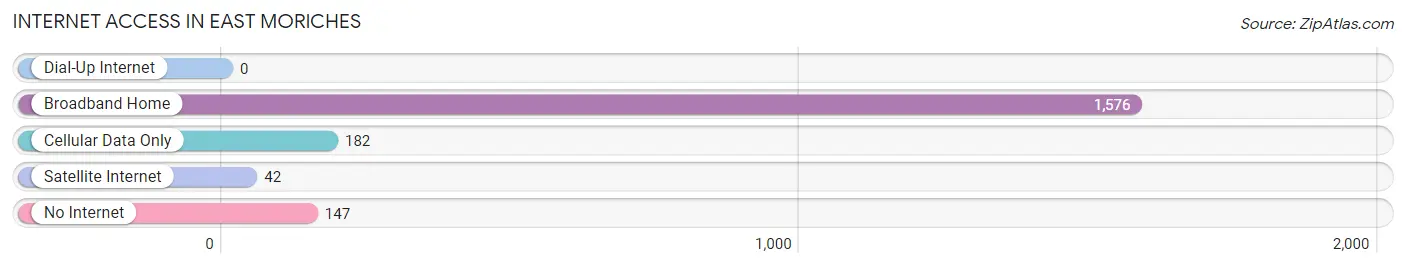
| Internet Type | # Households | % Households |
| Dial-Up Internet | 0 | 0.0% |
| Broadband Home | 1,576 | 81.5% |
| Cellular Data Only | 182 | 9.4% |
| Satellite Internet | 42 | 2.2% |
| No Internet | 147 | 7.6% |
| Total | 1,934 | 100.0% |
East Moriches Summary
East Moriches is a hamlet located in the Town of Brookhaven in Suffolk County, New York. It is situated on the south shore of Long Island, approximately 70 miles east of New York City. The hamlet is bordered by the hamlets of Center Moriches to the west, Manorville to the east, and Mastic Beach to the south.
History
The area now known as East Moriches was originally inhabited by the Secatogue Indians, a sub-tribe of the Montaukett Indians. The Secatogue Indians were a peaceful tribe who lived off the land, fishing, hunting, and gathering shellfish. The first European settlers arrived in the area in the late 1600s, and the hamlet was officially established in 1712.
The hamlet was originally known as “Moriches”, and was named after the Moriches Bay, which was named after the Secatogue Indians. The name “East Moriches” was adopted in the late 1800s to distinguish it from the nearby hamlet of Center Moriches.
In the late 1800s, East Moriches was a popular summer resort destination for wealthy New Yorkers. The area was known for its beautiful beaches, and many of the original summer homes still stand today.
In the early 1900s, East Moriches became a popular spot for duck hunting. The area was home to several duck hunting clubs, and the sport remains popular to this day.
Geography
East Moriches is located on the south shore of Long Island, approximately 70 miles east of New York City. The hamlet is bordered by the hamlets of Center Moriches to the west, Manorville to the east, and Mastic Beach to the south.
The hamlet is situated on Moriches Bay, which is part of the Great South Bay. The bay is a popular spot for fishing, boating, and other water activities.
The area is mostly flat, with some low hills in the northern part of the hamlet. The highest point in East Moriches is approximately 50 feet above sea level.
Economy
The economy of East Moriches is largely based on tourism and recreation. The area is home to several marinas, boatyards, and other businesses related to the boating and fishing industries.
The hamlet is also home to several small businesses, including restaurants, retail stores, and professional services.
Demographics
As of the 2010 census, the population of East Moriches was 5,717. The population is predominantly white (90.3%), with small percentages of African American (3.2%), Asian (2.2%), and Hispanic (2.2%) residents.
The median household income in East Moriches is $87,917, and the median home value is $521,400. The unemployment rate is 3.7%.
Conclusion
East Moriches is a hamlet located in the Town of Brookhaven in Suffolk County, New York. It is situated on the south shore of Long Island, approximately 70 miles east of New York City. The hamlet was originally inhabited by the Secatogue Indians, and was officially established in 1712. The economy of East Moriches is largely based on tourism and recreation, and the population is predominantly white. The median household income in East Moriches is $87,917, and the median home value is $521,400.
Common Questions
What is Per Capita Income in East Moriches?
Per Capita income in East Moriches is $63,153.
What is the Median Family Income in East Moriches?
Median Family Income in East Moriches is $173,152.
What is the Median Household income in East Moriches?
Median Household Income in East Moriches is $128,788.
What is Income or Wage Gap in East Moriches?
Income or Wage Gap in East Moriches is 52.9%.
Women in East Moriches earn 47.1 cents for every dollar earned by a man.
What is Inequality or Gini Index in East Moriches?
Inequality or Gini Index in East Moriches is 0.45.
What is the Total Population of East Moriches?
Total Population of East Moriches is 5,581.
What is the Total Male Population of East Moriches?
Total Male Population of East Moriches is 2,846.
What is the Total Female Population of East Moriches?
Total Female Population of East Moriches is 2,735.
What is the Ratio of Males per 100 Females in East Moriches?
There are 104.06 Males per 100 Females in East Moriches.
What is the Ratio of Females per 100 Males in East Moriches?
There are 96.10 Females per 100 Males in East Moriches.
What is the Median Population Age in East Moriches?
Median Population Age in East Moriches is 47.2 Years.
What is the Average Family Size in East Moriches
Average Family Size in East Moriches is 3.3 People.
What is the Average Household Size in East Moriches
Average Household Size in East Moriches is 2.8 People.
How Large is the Labor Force in East Moriches?
There are 2,733 People in the Labor Forcein in East Moriches.
What is the Percentage of People in the Labor Force in East Moriches?
61.3% of People are in the Labor Force in East Moriches.
What is the Unemployment Rate in East Moriches?
Unemployment Rate in East Moriches is 2.2%.