Spring Lake, UT Map & Demographics
Spring Lake Map
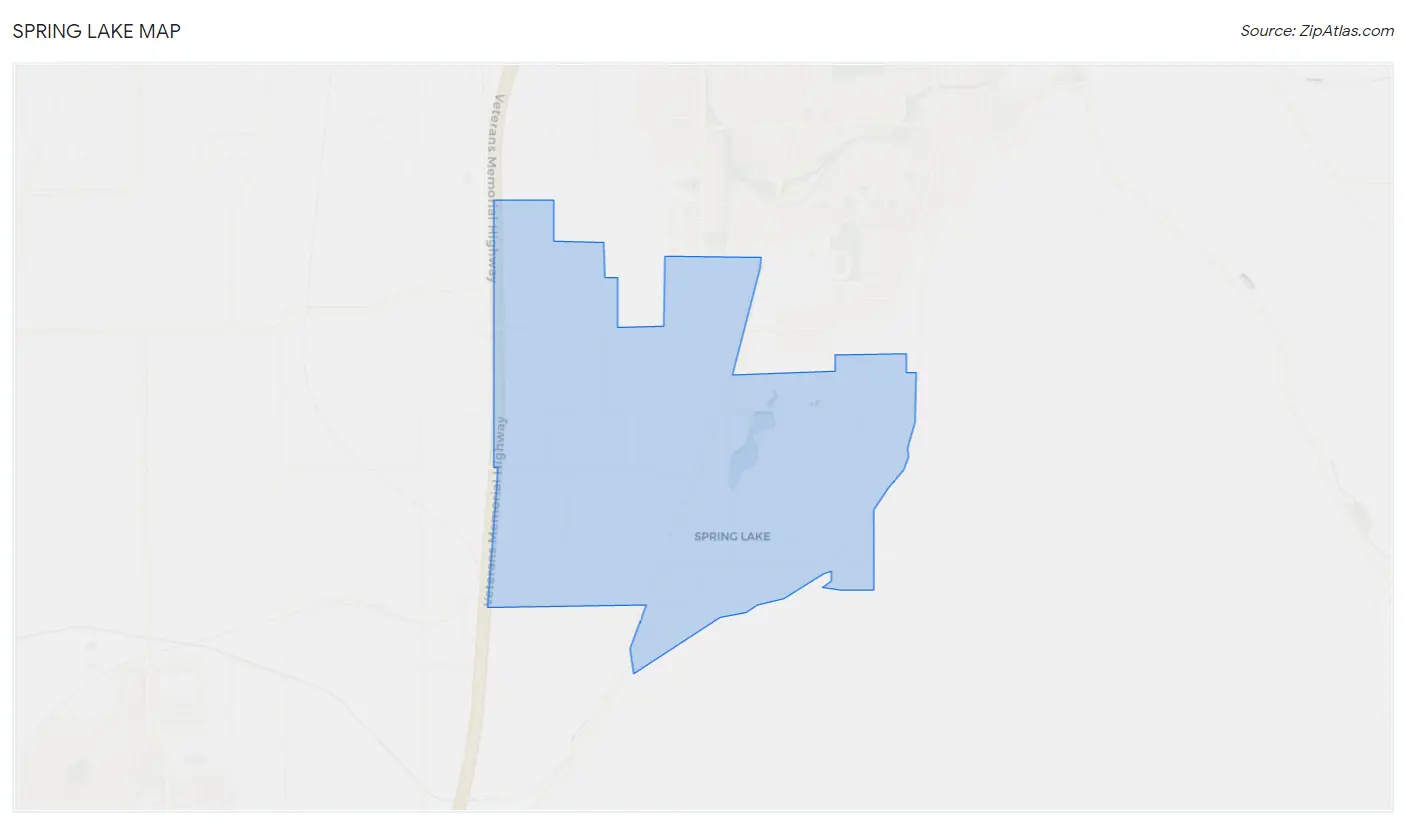
Spring Lake Overview
$32,063
PER CAPITA INCOME
$155,833
AVG FAMILY INCOME
$155,139
AVG HOUSEHOLD INCOME
18.2%
WAGE / INCOME GAP [ % ]
81.8¢/ $1
WAGE / INCOME GAP [ $ ]
0.29
INEQUALITY / GINI INDEX
517
TOTAL POPULATION
306
MALE POPULATION
211
FEMALE POPULATION
145.02
MALES / 100 FEMALES
68.95
FEMALES / 100 MALES
28.8
MEDIAN AGE
4.2
AVG FAMILY SIZE
3.9
AVG HOUSEHOLD SIZE
247
LABOR FORCE [ PEOPLE ]
72.6%
PERCENT IN LABOR FORCE
Income in Spring Lake
Income Overview in Spring Lake
Per Capita Income in Spring Lake is $32,063, while median incomes of families and households are $155,833 and $155,139 respectively.
| Characteristic | Number | Measure |
| Per Capita Income | 517 | $32,063 |
| Median Family Income | 122 | $155,833 |
| Mean Family Income | 122 | $130,929 |
| Median Household Income | 132 | $155,139 |
| Mean Household Income | 132 | $124,950 |
| Income Deficit | 122 | $0 |
| Wage / Income Gap (%) | 517 | 18.23% |
| Wage / Income Gap ($) | 517 | 81.77¢ per $1 |
| Gini / Inequality Index | 517 | 0.29 |
Earnings by Sex in Spring Lake
Average Earnings in Spring Lake are $57,500, $57,708 for men and $47,188 for women, a difference of 18.2%.
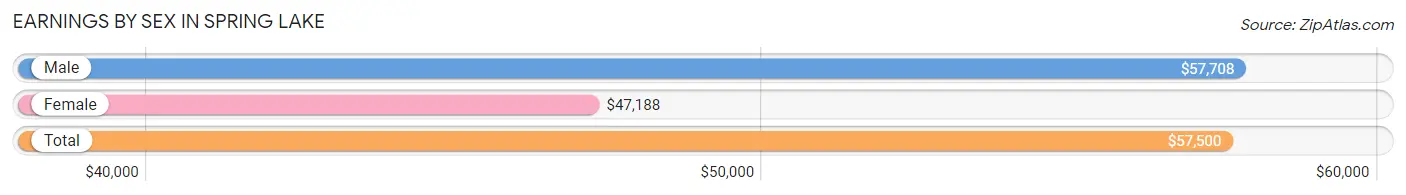
| Sex | Number | Average Earnings |
| Male | 151 (59.9%) | $57,708 |
| Female | 101 (40.1%) | $47,188 |
| Total | 252 (100.0%) | $57,500 |
Earnings by Sex by Income Bracket in Spring Lake
The most common earnings brackets in Spring Lake are $65,000 to $74,999 for men (33 | 21.8%) and $55,000 to $64,999 for women (20 | 19.8%).
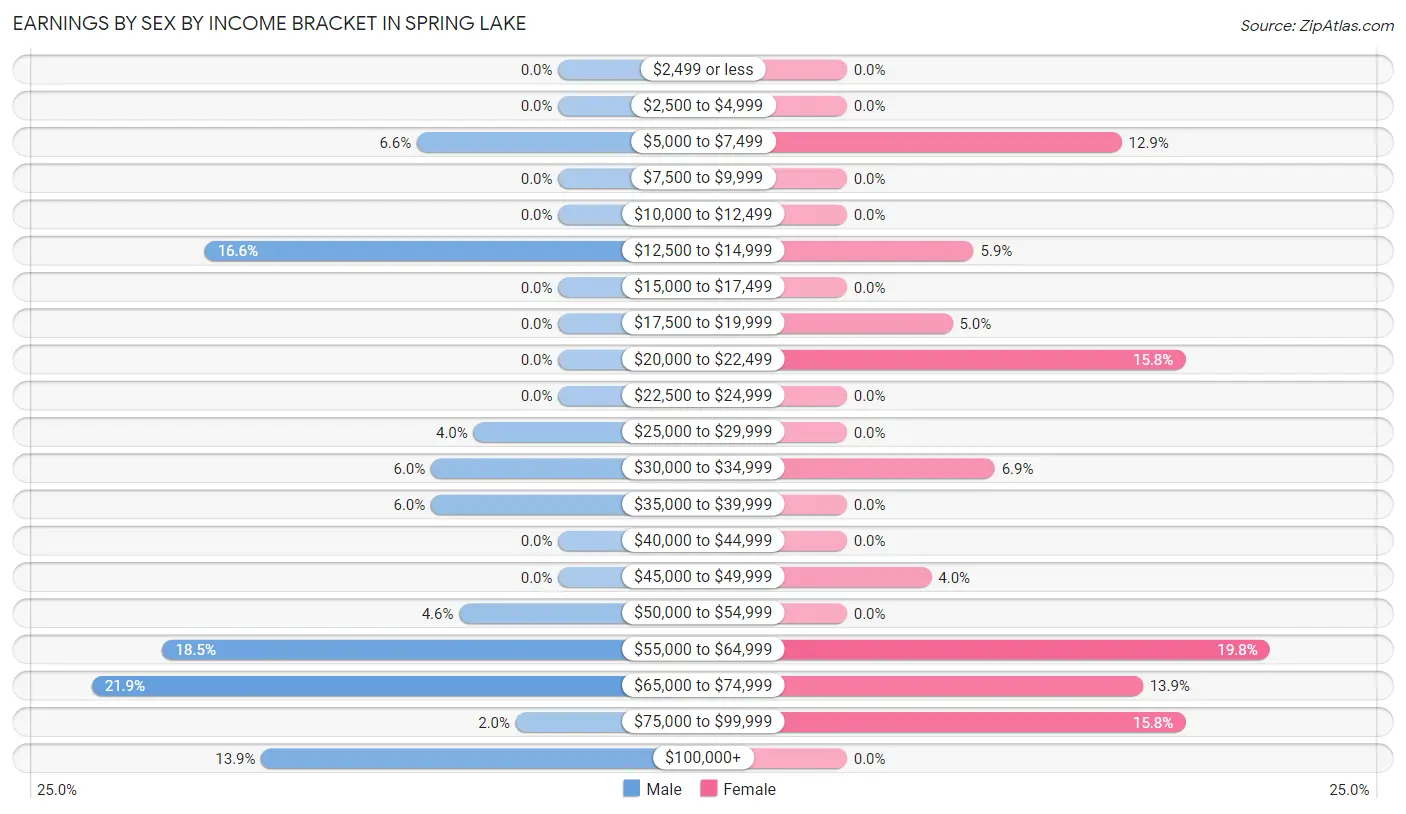
| Income | Male | Female |
| $2,499 or less | 0 (0.0%) | 0 (0.0%) |
| $2,500 to $4,999 | 0 (0.0%) | 0 (0.0%) |
| $5,000 to $7,499 | 10 (6.6%) | 13 (12.9%) |
| $7,500 to $9,999 | 0 (0.0%) | 0 (0.0%) |
| $10,000 to $12,499 | 0 (0.0%) | 0 (0.0%) |
| $12,500 to $14,999 | 25 (16.6%) | 6 (5.9%) |
| $15,000 to $17,499 | 0 (0.0%) | 0 (0.0%) |
| $17,500 to $19,999 | 0 (0.0%) | 5 (5.0%) |
| $20,000 to $22,499 | 0 (0.0%) | 16 (15.8%) |
| $22,500 to $24,999 | 0 (0.0%) | 0 (0.0%) |
| $25,000 to $29,999 | 6 (4.0%) | 0 (0.0%) |
| $30,000 to $34,999 | 9 (6.0%) | 7 (6.9%) |
| $35,000 to $39,999 | 9 (6.0%) | 0 (0.0%) |
| $40,000 to $44,999 | 0 (0.0%) | 0 (0.0%) |
| $45,000 to $49,999 | 0 (0.0%) | 4 (4.0%) |
| $50,000 to $54,999 | 7 (4.6%) | 0 (0.0%) |
| $55,000 to $64,999 | 28 (18.5%) | 20 (19.8%) |
| $65,000 to $74,999 | 33 (21.8%) | 14 (13.9%) |
| $75,000 to $99,999 | 3 (2.0%) | 16 (15.8%) |
| $100,000+ | 21 (13.9%) | 0 (0.0%) |
| Total | 151 (100.0%) | 101 (100.0%) |
Earnings by Sex by Educational Attainment in Spring Lake
Average earnings in Spring Lake are $64,519 for men and $59,125 for women, a difference of 8.4%. Men with an educational attainment of high school diploma enjoy the highest average annual earnings of $65,625, while those with college or associate's degree education earn the least with $64,712. Women with an educational attainment of college or associate's degree earn the most with the average annual earnings of $59,688, while those with college or associate's degree education have the smallest earnings of $59,688.
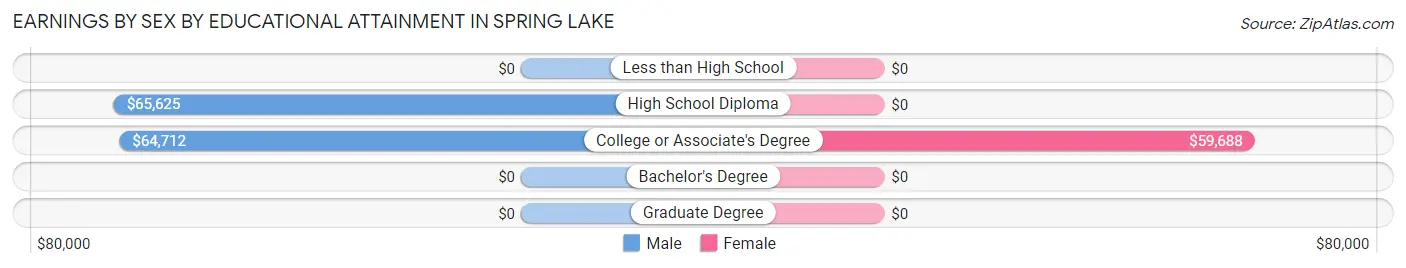
| Educational Attainment | Male Income | Female Income |
| Less than High School | - | - |
| High School Diploma | $65,625 | $0 |
| College or Associate's Degree | $64,712 | $59,688 |
| Bachelor's Degree | - | - |
| Graduate Degree | - | - |
| Total | $64,519 | $59,125 |
Family Income in Spring Lake
Family Income Brackets in Spring Lake
According to the Spring Lake family income data, there are 53 families falling into the $150,000 to $199,999 income range, which is the most common income bracket and makes up 43.4% of all families.
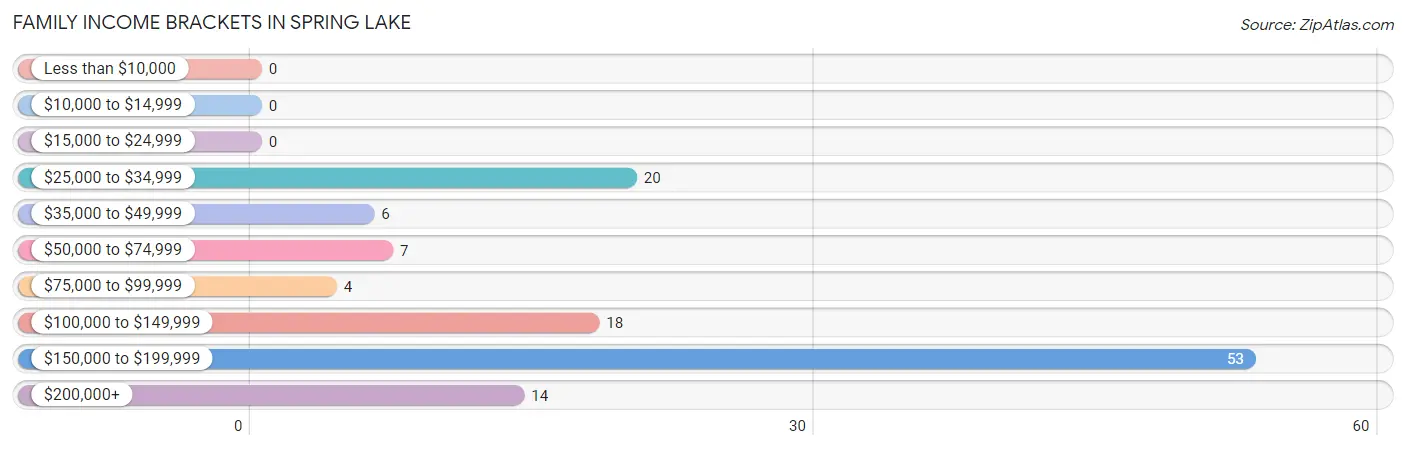
| Income Bracket | # Families | % Families |
| Less than $10,000 | 0 | 0.0% |
| $10,000 to $14,999 | 0 | 0.0% |
| $15,000 to $24,999 | 0 | 0.0% |
| $25,000 to $34,999 | 20 | 16.4% |
| $35,000 to $49,999 | 6 | 4.9% |
| $50,000 to $74,999 | 7 | 5.7% |
| $75,000 to $99,999 | 4 | 3.3% |
| $100,000 to $149,999 | 18 | 14.8% |
| $150,000 to $199,999 | 53 | 43.4% |
| $200,000+ | 14 | 11.5% |
Family Income by Famaliy Size in Spring Lake
3-person families (42 | 34.4%) account for the highest median family income in Spring Lake with $156,389 per family, while 2-person families (24 | 19.7%) have the highest median income of $63,750 per family member.
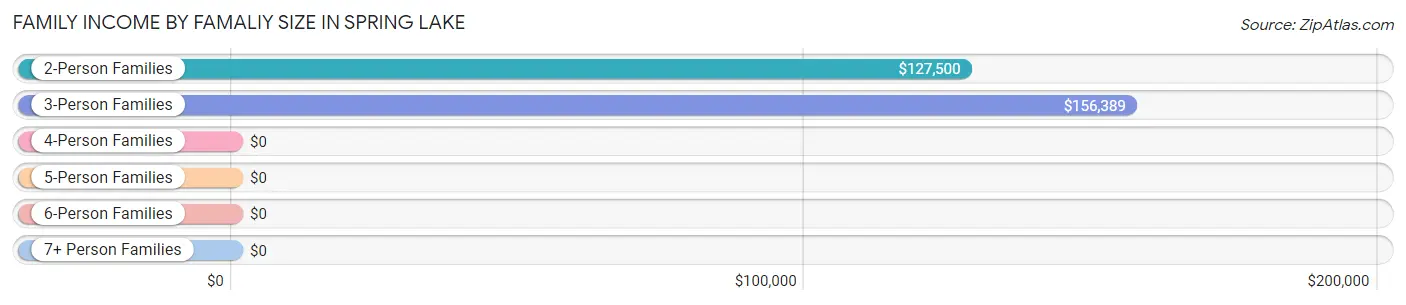
| Income Bracket | # Families | Median Income |
| 2-Person Families | 24 (19.7%) | $127,500 |
| 3-Person Families | 42 (34.4%) | $156,389 |
| 4-Person Families | 12 (9.8%) | $0 |
| 5-Person Families | 8 (6.6%) | $0 |
| 6-Person Families | 30 (24.6%) | $0 |
| 7+ Person Families | 6 (4.9%) | $0 |
| Total | 122 (100.0%) | $155,833 |
Family Income by Number of Earners in Spring Lake
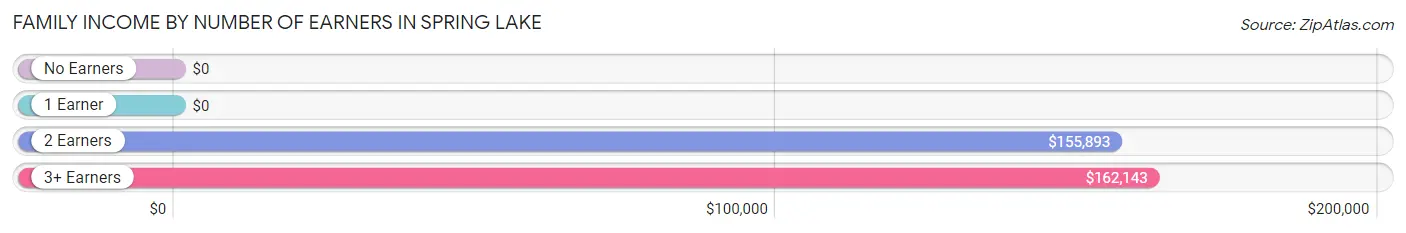
| Number of Earners | # Families | Median Income |
| No Earners | 4 (3.3%) | $0 |
| 1 Earner | 34 (27.9%) | $0 |
| 2 Earners | 60 (49.2%) | $155,893 |
| 3+ Earners | 24 (19.7%) | $162,143 |
| Total | 122 (100.0%) | $155,833 |
Household Income in Spring Lake
Household Income Brackets in Spring Lake
With 53 households falling in the category, the $150,000 to $199,999 income range is the most frequent in Spring Lake, accounting for 40.2% of all households.
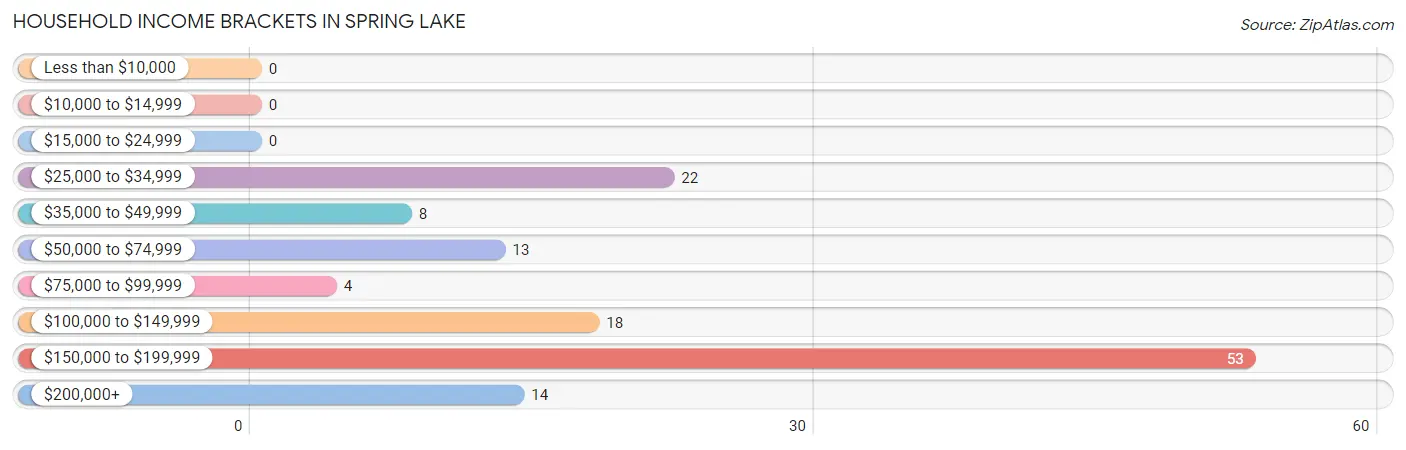
| Income Bracket | # Households | % Households |
| Less than $10,000 | 0 | 0.0% |
| $10,000 to $14,999 | 0 | 0.0% |
| $15,000 to $24,999 | 0 | 0.0% |
| $25,000 to $34,999 | 22 | 16.7% |
| $35,000 to $49,999 | 8 | 6.1% |
| $50,000 to $74,999 | 13 | 9.8% |
| $75,000 to $99,999 | 4 | 3.0% |
| $100,000 to $149,999 | 18 | 13.6% |
| $150,000 to $199,999 | 53 | 40.2% |
| $200,000+ | 14 | 10.6% |
Household Income by Householder Age in Spring Lake
The median household income in Spring Lake is $155,139, with the highest median household income of $160,893 found in the 45 to 64 years age bracket for the primary householder. A total of 82 households (62.1%) fall into this category.
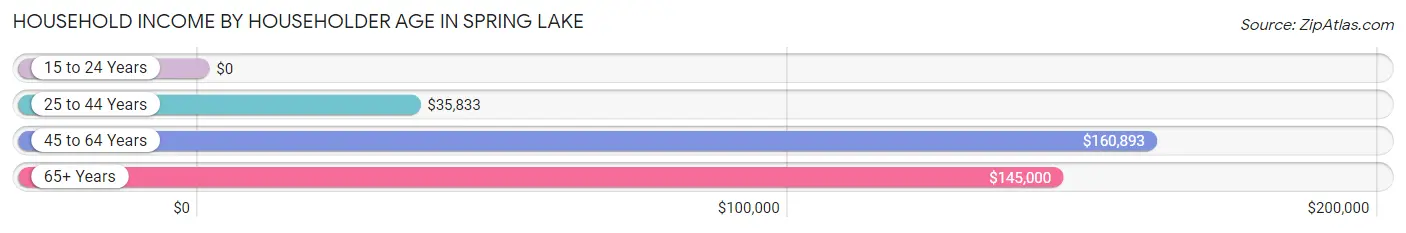
| Income Bracket | # Households | Median Income |
| 15 to 24 Years | 0 (0.0%) | $0 |
| 25 to 44 Years | 36 (27.3%) | $35,833 |
| 45 to 64 Years | 82 (62.1%) | $160,893 |
| 65+ Years | 14 (10.6%) | $145,000 |
| Total | 132 (100.0%) | $155,139 |
Poverty in Spring Lake
Income Below Poverty by Sex and Age in Spring Lake
With 20.3% poverty level for males and 18.0% for females among the residents of Spring Lake, 25 to 34 year old males and 16 and 17 year old females are the most vulnerable to poverty, with 9 males (56.2%) and 6 females (100.0%) in their respective age groups living below the poverty level.
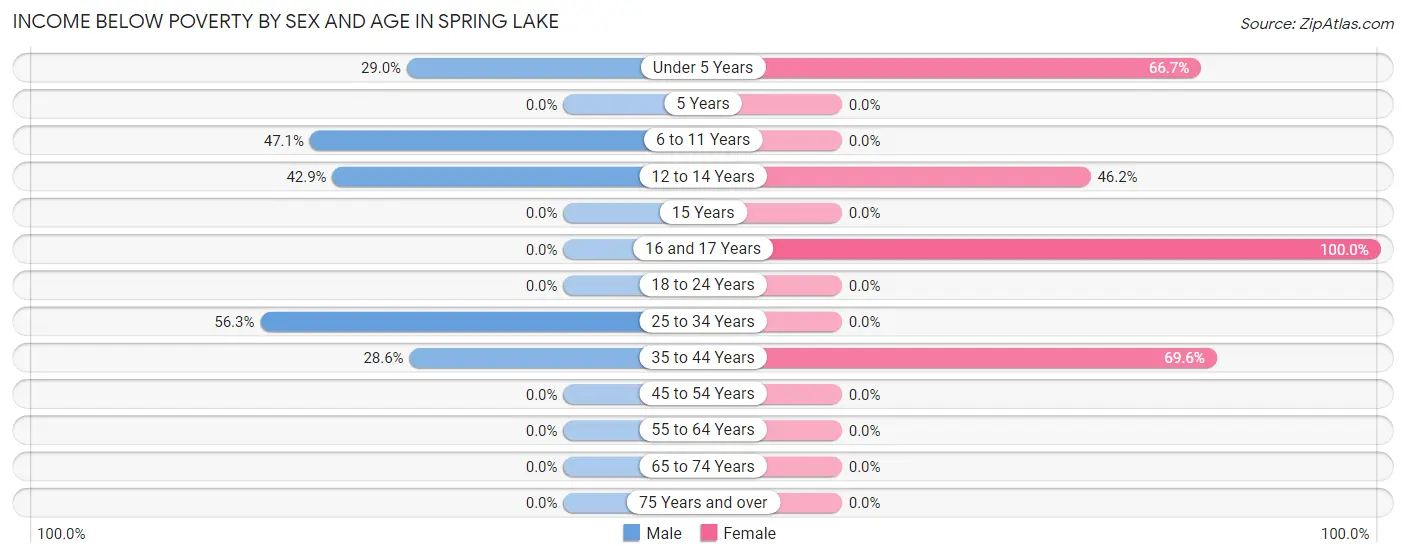
| Age Bracket | Male | Female |
| Under 5 Years | 9 (29.0%) | 10 (66.7%) |
| 5 Years | 0 (0.0%) | 0 (0.0%) |
| 6 to 11 Years | 32 (47.1%) | 0 (0.0%) |
| 12 to 14 Years | 6 (42.9%) | 6 (46.2%) |
| 15 Years | 0 (0.0%) | 0 (0.0%) |
| 16 and 17 Years | 0 (0.0%) | 6 (100.0%) |
| 18 to 24 Years | 0 (0.0%) | 0 (0.0%) |
| 25 to 34 Years | 9 (56.2%) | 0 (0.0%) |
| 35 to 44 Years | 6 (28.6%) | 16 (69.6%) |
| 45 to 54 Years | 0 (0.0%) | 0 (0.0%) |
| 55 to 64 Years | 0 (0.0%) | 0 (0.0%) |
| 65 to 74 Years | 0 (0.0%) | 0 (0.0%) |
| 75 Years and over | 0 (0.0%) | 0 (0.0%) |
| Total | 62 (20.3%) | 38 (18.0%) |
Income Above Poverty by Sex and Age in Spring Lake
According to the poverty statistics in Spring Lake, males aged 5 years and females aged 6 to 11 years are the age groups that are most secure financially, with 100.0% of males and 100.0% of females in these age groups living above the poverty line.
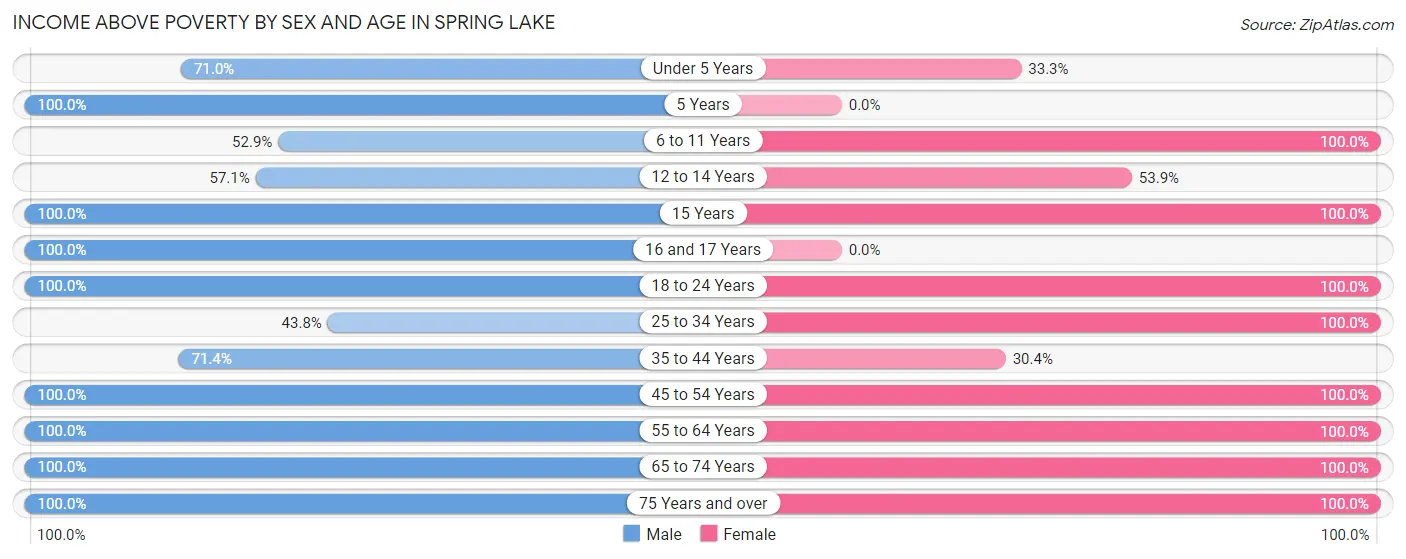
| Age Bracket | Male | Female |
| Under 5 Years | 22 (71.0%) | 5 (33.3%) |
| 5 Years | 7 (100.0%) | 0 (0.0%) |
| 6 to 11 Years | 36 (52.9%) | 7 (100.0%) |
| 12 to 14 Years | 8 (57.1%) | 7 (53.8%) |
| 15 Years | 15 (100.0%) | 7 (100.0%) |
| 16 and 17 Years | 5 (100.0%) | 0 (0.0%) |
| 18 to 24 Years | 33 (100.0%) | 27 (100.0%) |
| 25 to 34 Years | 7 (43.8%) | 17 (100.0%) |
| 35 to 44 Years | 15 (71.4%) | 7 (30.4%) |
| 45 to 54 Years | 52 (100.0%) | 57 (100.0%) |
| 55 to 64 Years | 31 (100.0%) | 16 (100.0%) |
| 65 to 74 Years | 11 (100.0%) | 10 (100.0%) |
| 75 Years and over | 2 (100.0%) | 13 (100.0%) |
| Total | 244 (79.7%) | 173 (82.0%) |
Income Below Poverty Among Married-Couple Families in Spring Lake
The poverty statistics for married-couple families in Spring Lake show that 13.0% or 15 of the total 115 families live below the poverty line. Families with 5 or more children have the highest poverty rate of 100.0%, comprising of 6 families. On the other hand, families with no children have the lowest poverty rate of 0.0%, which includes 0 families.
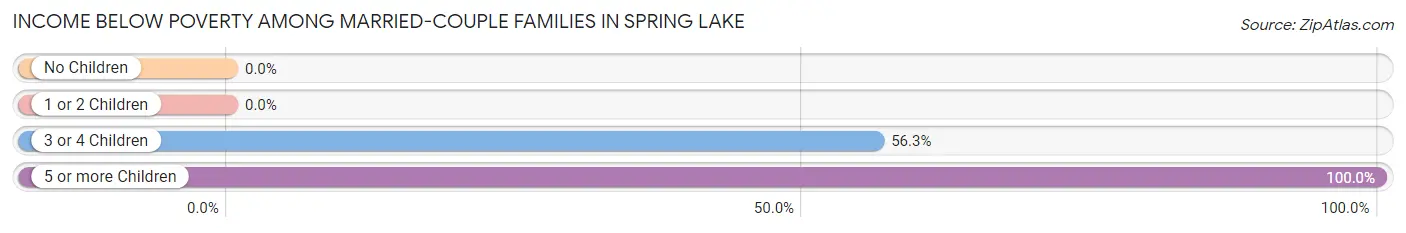
| Children | Above Poverty | Below Poverty |
| No Children | 47 (100.0%) | 0 (0.0%) |
| 1 or 2 Children | 46 (100.0%) | 0 (0.0%) |
| 3 or 4 Children | 7 (43.8%) | 9 (56.2%) |
| 5 or more Children | 0 (0.0%) | 6 (100.0%) |
| Total | 100 (87.0%) | 15 (13.0%) |
Income Below Poverty Among Single-Parent Households in Spring Lake
| Children | Single Father | Single Mother |
| No Children | 0 (0.0%) | 0 (0.0%) |
| 1 or 2 Children | 0 (0.0%) | 0 (0.0%) |
| 3 or 4 Children | 0 (0.0%) | 0 (0.0%) |
| 5 or more Children | 0 (0.0%) | 0 (0.0%) |
| Total | 0 (0.0%) | 0 (0.0%) |
Income Below Poverty Among Married-Couple vs Single-Parent Households in Spring Lake
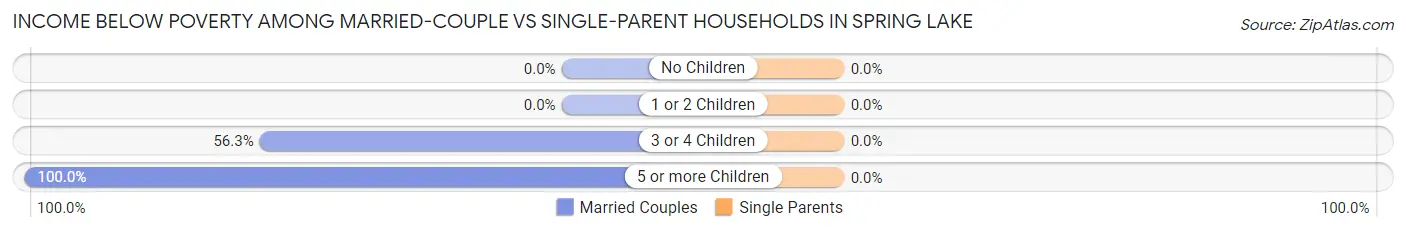
| Children | Married-Couple Families | Single-Parent Households |
| No Children | 0 (0.0%) | 0 (0.0%) |
| 1 or 2 Children | 0 (0.0%) | 0 (0.0%) |
| 3 or 4 Children | 9 (56.2%) | 0 (0.0%) |
| 5 or more Children | 6 (100.0%) | 0 (0.0%) |
| Total | 15 (13.0%) | 0 (0.0%) |
Race in Spring Lake
The most populous races in Spring Lake are White / Caucasian (492 | 95.2%), Two or more Races (25 | 4.8%), and Hispanic or Latino (22 | 4.3%).
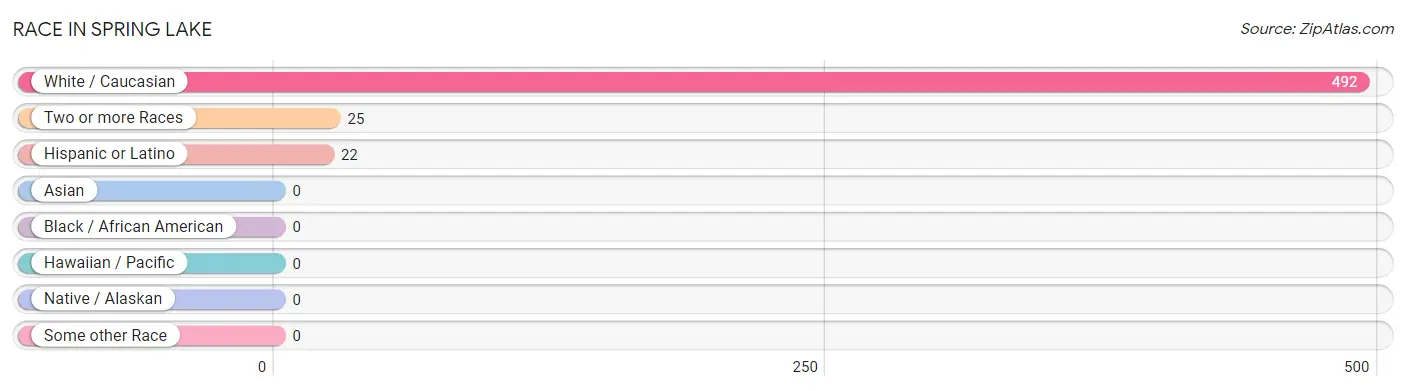
| Race | # Population | % Population |
| Asian | 0 | 0.0% |
| Black / African American | 0 | 0.0% |
| Hawaiian / Pacific | 0 | 0.0% |
| Hispanic or Latino | 22 | 4.3% |
| Native / Alaskan | 0 | 0.0% |
| White / Caucasian | 492 | 95.2% |
| Two or more Races | 25 | 4.8% |
| Some other Race | 0 | 0.0% |
| Total | 517 | 100.0% |
Ancestry in Spring Lake
The most populous ancestries reported in Spring Lake are English (123 | 23.8%), German (68 | 13.2%), Irish (51 | 9.9%), Swedish (33 | 6.4%), and Native Hawaiian (25 | 4.8%), together accounting for 58.0% of all Spring Lake residents.
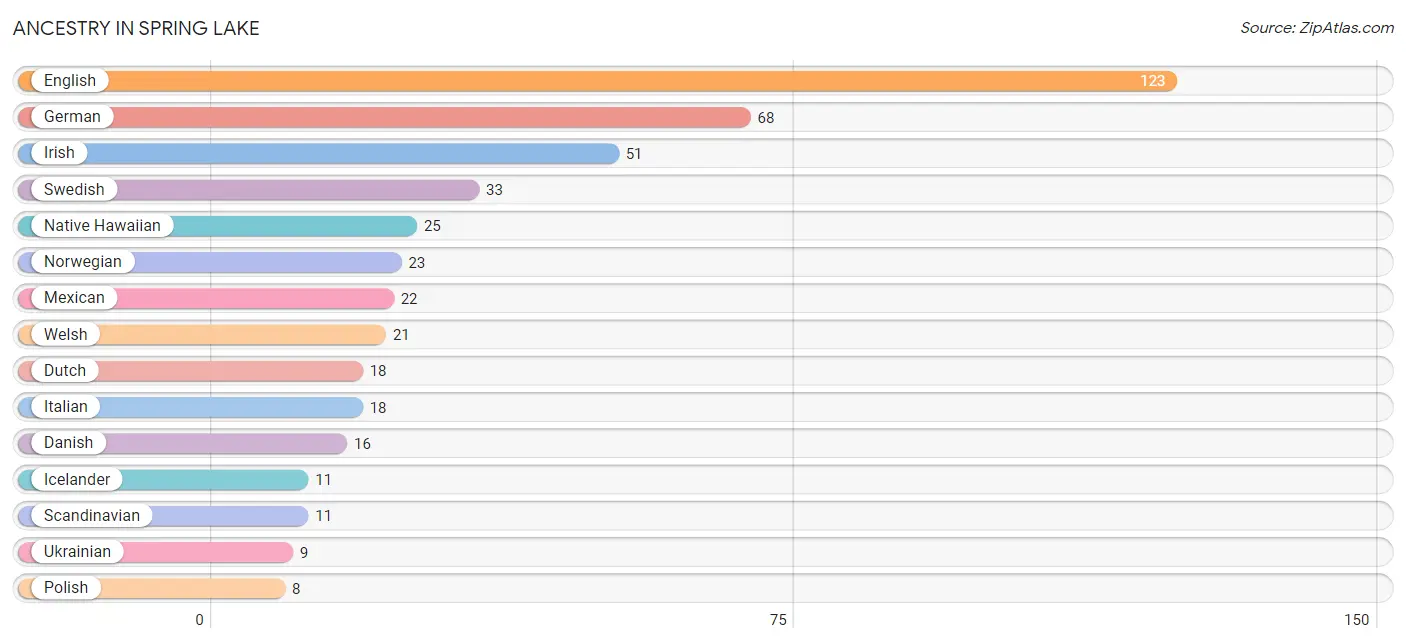
| Ancestry | # Population | % Population |
| American | 7 | 1.3% |
| Danish | 16 | 3.1% |
| Dutch | 18 | 3.5% |
| English | 123 | 23.8% |
| European | 7 | 1.3% |
| German | 68 | 13.2% |
| Icelander | 11 | 2.1% |
| Irish | 51 | 9.9% |
| Italian | 18 | 3.5% |
| Mexican | 22 | 4.3% |
| Native Hawaiian | 25 | 4.8% |
| Norwegian | 23 | 4.4% |
| Polish | 8 | 1.5% |
| Scandinavian | 11 | 2.1% |
| Swedish | 33 | 6.4% |
| Ukrainian | 9 | 1.7% |
| Welsh | 21 | 4.1% | View All 17 Rows |
Immigrants in Spring Lake
The most numerous immigrant groups reported in Spring Lake came from Eastern Europe (7 | 1.3%), Europe (7 | 1.3%), and Russia (7 | 1.3%), together accounting for 4.1% of all Spring Lake residents.
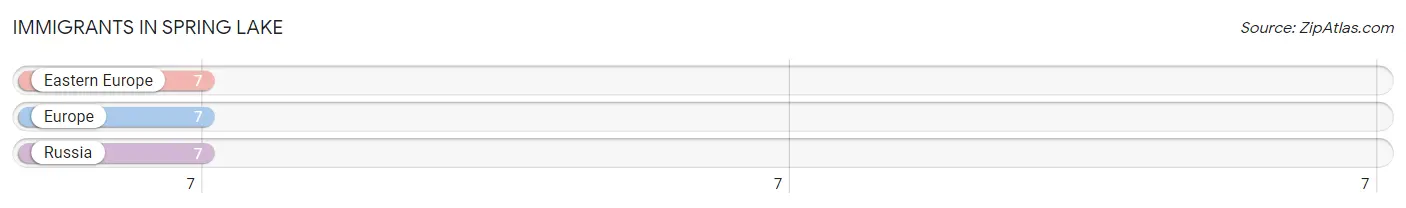
| Immigration Origin | # Population | % Population |
| Eastern Europe | 7 | 1.3% |
| Europe | 7 | 1.3% |
| Russia | 7 | 1.3% | View All 3 Rows |
Sex and Age in Spring Lake
Sex and Age in Spring Lake
The most populous age groups in Spring Lake are 5 to 9 Years (50 | 16.3%) for men and 45 to 49 Years (49 | 23.2%) for women.
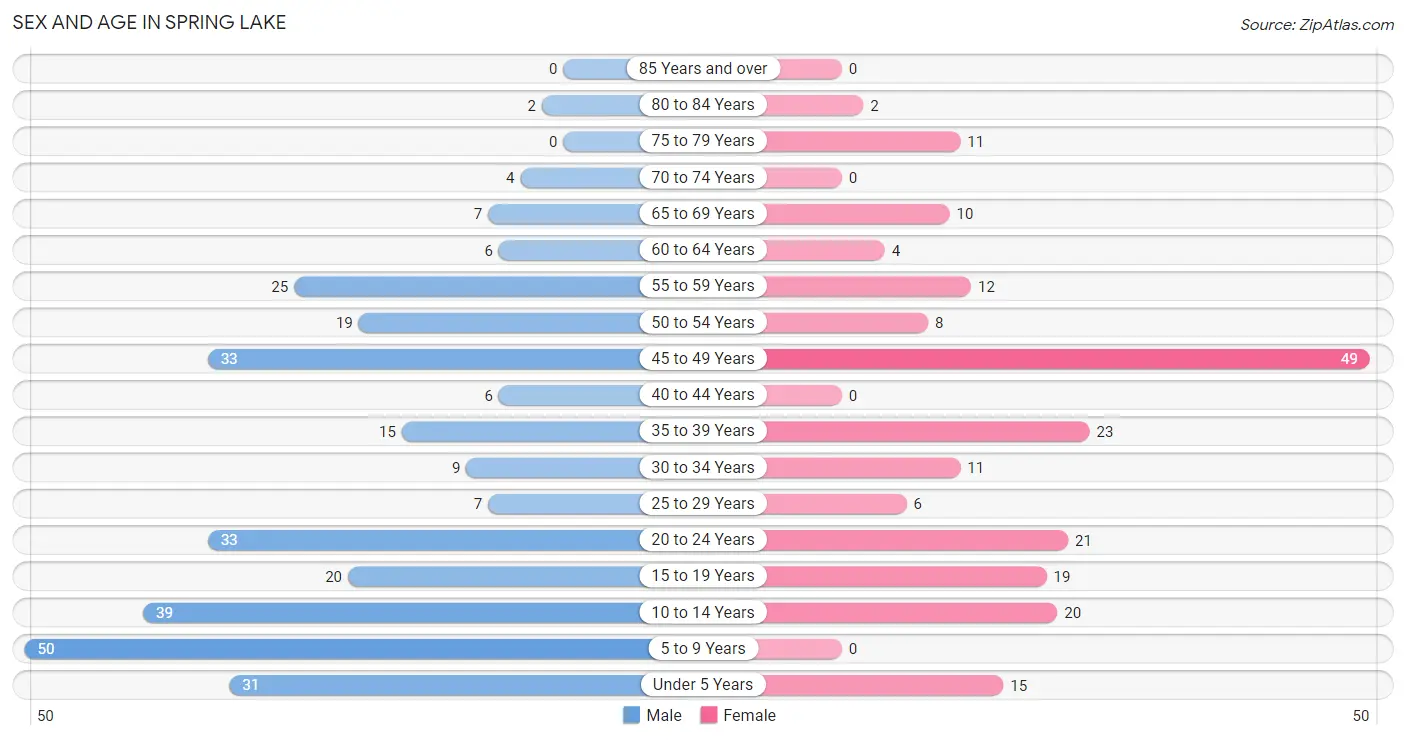
| Age Bracket | Male | Female |
| Under 5 Years | 31 (10.1%) | 15 (7.1%) |
| 5 to 9 Years | 50 (16.3%) | 0 (0.0%) |
| 10 to 14 Years | 39 (12.8%) | 20 (9.5%) |
| 15 to 19 Years | 20 (6.5%) | 19 (9.0%) |
| 20 to 24 Years | 33 (10.8%) | 21 (10.0%) |
| 25 to 29 Years | 7 (2.3%) | 6 (2.8%) |
| 30 to 34 Years | 9 (2.9%) | 11 (5.2%) |
| 35 to 39 Years | 15 (4.9%) | 23 (10.9%) |
| 40 to 44 Years | 6 (2.0%) | 0 (0.0%) |
| 45 to 49 Years | 33 (10.8%) | 49 (23.2%) |
| 50 to 54 Years | 19 (6.2%) | 8 (3.8%) |
| 55 to 59 Years | 25 (8.2%) | 12 (5.7%) |
| 60 to 64 Years | 6 (2.0%) | 4 (1.9%) |
| 65 to 69 Years | 7 (2.3%) | 10 (4.7%) |
| 70 to 74 Years | 4 (1.3%) | 0 (0.0%) |
| 75 to 79 Years | 0 (0.0%) | 11 (5.2%) |
| 80 to 84 Years | 2 (0.6%) | 2 (0.9%) |
| 85 Years and over | 0 (0.0%) | 0 (0.0%) |
| Total | 306 (100.0%) | 211 (100.0%) |
Families and Households in Spring Lake
Median Family Size in Spring Lake
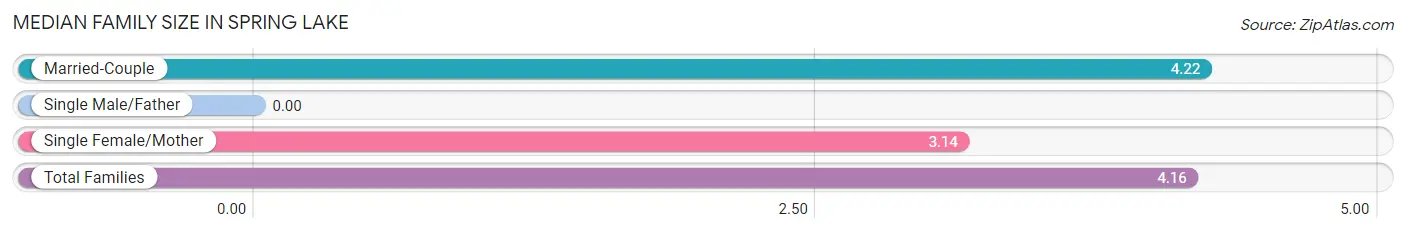
| Family Type | # Families | Family Size |
| Married-Couple | 115 (94.3%) | 4.22 |
| Single Male/Father | 0 (0.0%) | - |
| Single Female/Mother | 7 (5.7%) | 3.14 |
| Total Families | 122 (100.0%) | 4.16 |
Median Household Size in Spring Lake
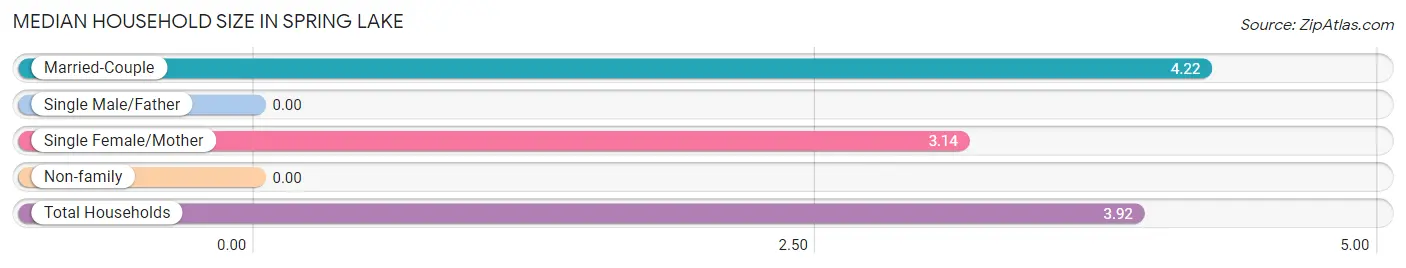
| Household Type | # Households | Household Size |
| Married-Couple | 115 (87.1%) | 4.22 |
| Single Male/Father | 0 (0.0%) | - |
| Single Female/Mother | 7 (5.3%) | 3.14 |
| Non-family | 10 (7.6%) | - |
| Total Households | 132 (100.0%) | 3.92 |
Household Size by Marriage Status in Spring Lake
Out of a total of 132 households in Spring Lake, 122 (92.4%) are family households, while 10 (7.6%) are nonfamily households. The most numerous type of family households are 3-person households, comprising 42, and the most common type of nonfamily households are 1-person households, comprising 10.
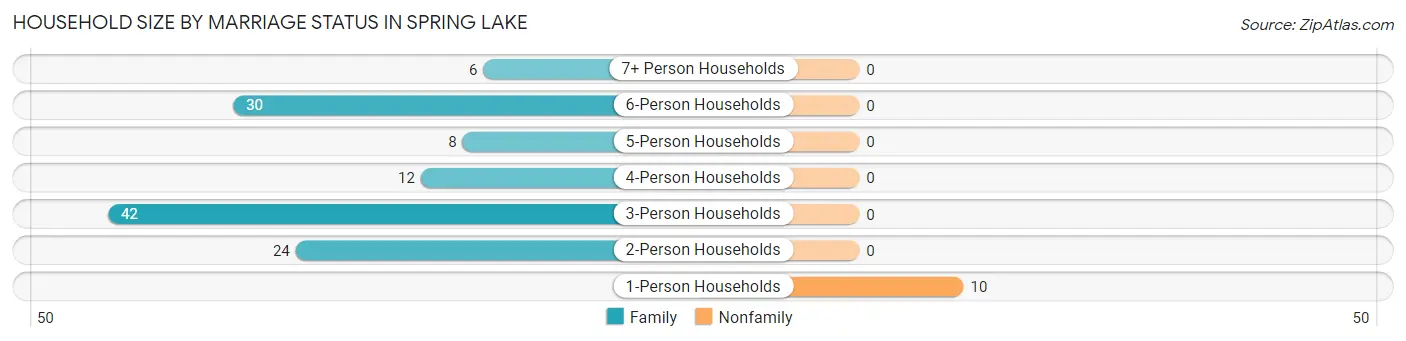
| Household Size | Family Households | Nonfamily Households |
| 1-Person Households | - | 10 (7.6%) |
| 2-Person Households | 24 (18.2%) | 0 (0.0%) |
| 3-Person Households | 42 (31.8%) | 0 (0.0%) |
| 4-Person Households | 12 (9.1%) | 0 (0.0%) |
| 5-Person Households | 8 (6.1%) | 0 (0.0%) |
| 6-Person Households | 30 (22.7%) | 0 (0.0%) |
| 7+ Person Households | 6 (4.5%) | 0 (0.0%) |
| Total | 122 (92.4%) | 10 (7.6%) |
Female Fertility in Spring Lake
Fertility by Age in Spring Lake
Average fertility rate in Spring Lake is 78.0 births per 1,000 women. Women in the age bracket of 20 to 34 years have the highest fertility rate with 263.0 births per 1,000 women. Women in the age bracket of 20 to 34 years acount for 100.0% of all women with births.
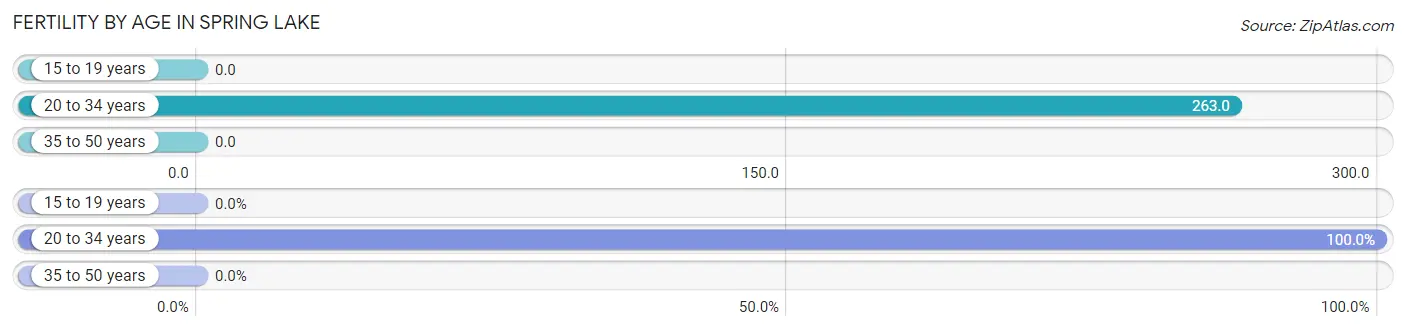
| Age Bracket | Women with Births | Births / 1,000 Women |
| 15 to 19 years | 0 (0.0%) | 0.0 |
| 20 to 34 years | 10 (100.0%) | 263.0 |
| 35 to 50 years | 0 (0.0%) | 0.0 |
| Total | 10 (100.0%) | 78.0 |
Fertility by Age by Marriage Status in Spring Lake
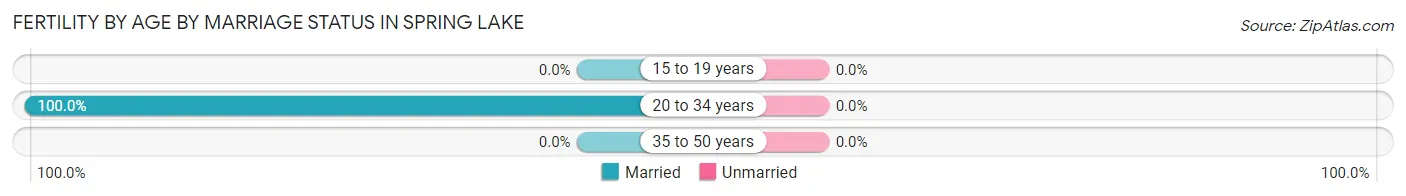
| Age Bracket | Married | Unmarried |
| 15 to 19 years | 0 (0.0%) | 0 (0.0%) |
| 20 to 34 years | 10 (100.0%) | 0 (0.0%) |
| 35 to 50 years | 0 (0.0%) | 0 (0.0%) |
| Total | 10 (100.0%) | 0 (0.0%) |
Fertility by Education in Spring Lake
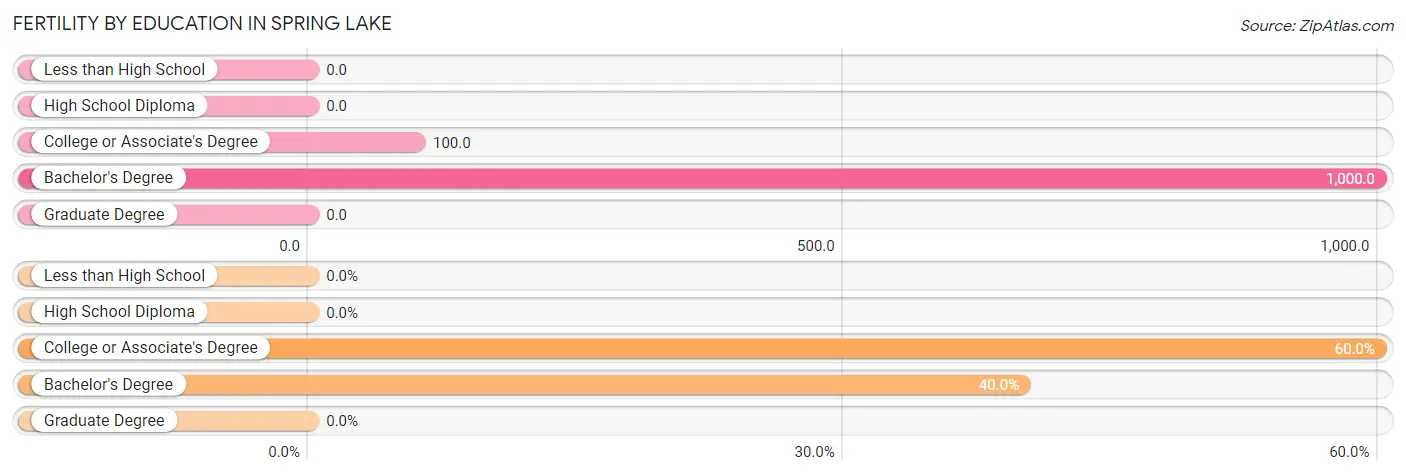
| Educational Attainment | Women with Births | Births / 1,000 Women |
| Less than High School | 0 (0.0%) | 0.0 |
| High School Diploma | 0 (0.0%) | 0.0 |
| College or Associate's Degree | 6 (60.0%) | 100.0 |
| Bachelor's Degree | 4 (40.0%) | 1,000.0 |
| Graduate Degree | 0 (0.0%) | 0.0 |
| Total | 10 (100.0%) | 78.0 |
Fertility by Education by Marriage Status in Spring Lake
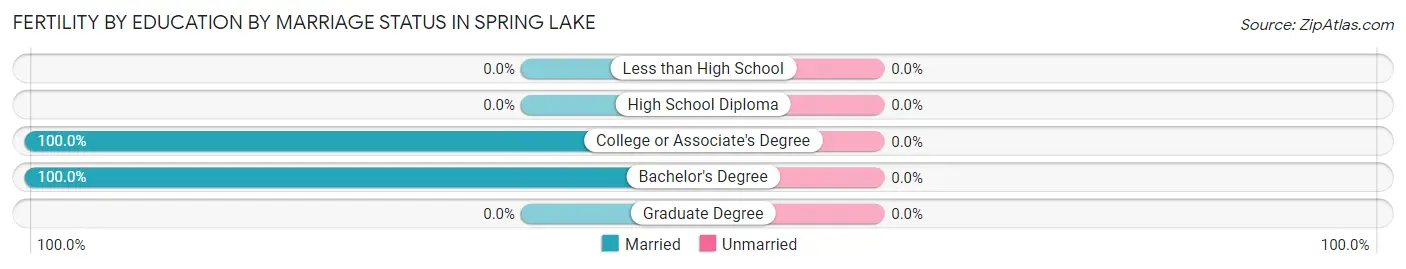
| Educational Attainment | Married | Unmarried |
| Less than High School | 0 (0.0%) | 0 (0.0%) |
| High School Diploma | 0 (0.0%) | 0 (0.0%) |
| College or Associate's Degree | 6 (100.0%) | 0 (0.0%) |
| Bachelor's Degree | 4 (100.0%) | 0 (0.0%) |
| Graduate Degree | 0 (0.0%) | 0 (0.0%) |
| Total | 10 (100.0%) | 0 (0.0%) |
Employment Characteristics in Spring Lake
Employment by Class of Employer in Spring Lake
Among the 240 employed individuals in Spring Lake, private company employees (162 | 67.5%), state government employees (33 | 13.8%), and local government employees (31 | 12.9%) make up the most common classes of employment.
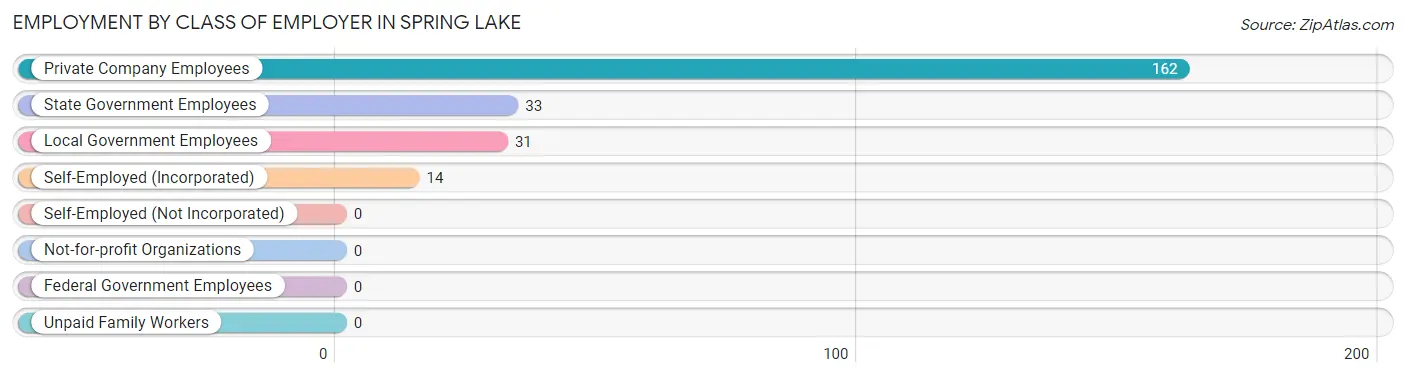
| Employer Class | # Employees | % Employees |
| Private Company Employees | 162 | 67.5% |
| Self-Employed (Incorporated) | 14 | 5.8% |
| Self-Employed (Not Incorporated) | 0 | 0.0% |
| Not-for-profit Organizations | 0 | 0.0% |
| Local Government Employees | 31 | 12.9% |
| State Government Employees | 33 | 13.8% |
| Federal Government Employees | 0 | 0.0% |
| Unpaid Family Workers | 0 | 0.0% |
| Total | 240 | 100.0% |
Employment Status by Age in Spring Lake
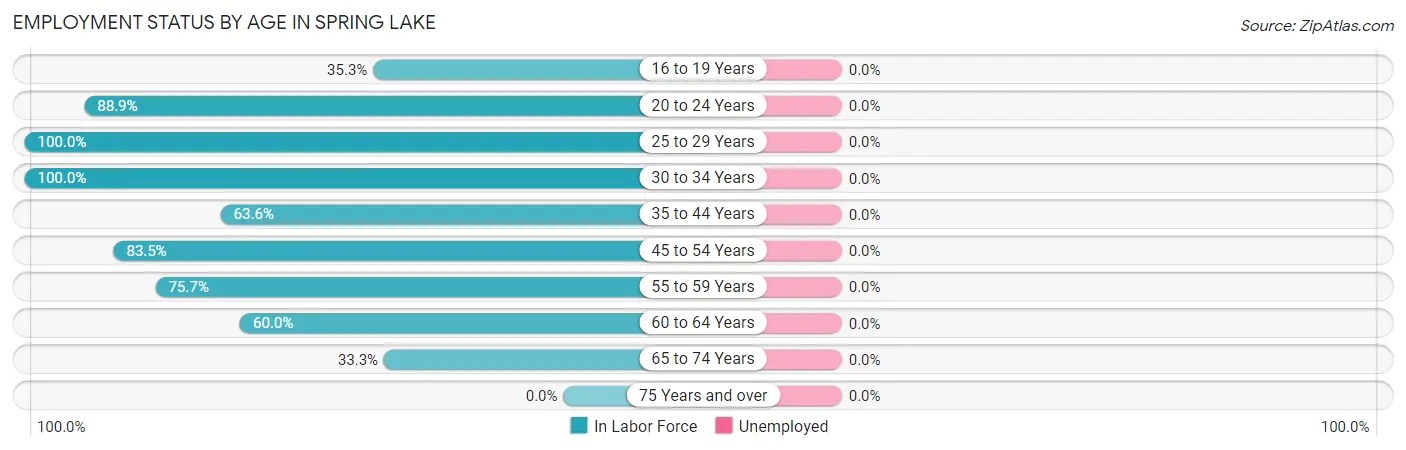
| Age Bracket | In Labor Force | Unemployed |
| 16 to 19 Years | 6 (35.3%) | 0 (0.0%) |
| 20 to 24 Years | 48 (88.9%) | 0 (0.0%) |
| 25 to 29 Years | 13 (100.0%) | 0 (0.0%) |
| 30 to 34 Years | 20 (100.0%) | 0 (0.0%) |
| 35 to 44 Years | 28 (63.6%) | 0 (0.0%) |
| 45 to 54 Years | 91 (83.5%) | 0 (0.0%) |
| 55 to 59 Years | 28 (75.7%) | 0 (0.0%) |
| 60 to 64 Years | 6 (60.0%) | 0 (0.0%) |
| 65 to 74 Years | 7 (33.3%) | 0 (0.0%) |
| 75 Years and over | 0 (0.0%) | 0 (0.0%) |
| Total | 247 (72.6%) | 0 (0.0%) |
Employment Status by Educational Attainment in Spring Lake
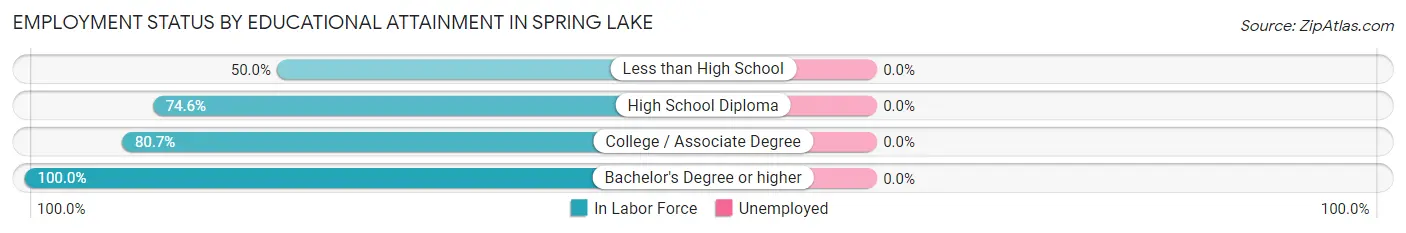
| Educational Attainment | In Labor Force | Unemployed |
| Less than High School | 7 (50.0%) | 0 (0.0%) |
| High School Diploma | 53 (74.6%) | 0 (0.0%) |
| College / Associate Degree | 92 (80.7%) | 0 (0.0%) |
| Bachelor's Degree or higher | 34 (100.0%) | 0 (0.0%) |
| Total | 186 (79.8%) | 0 (0.0%) |
Employment Occupations by Sex in Spring Lake
Management, Business, Science and Arts Occupations
The most common Management, Business, Science and Arts occupations in Spring Lake are Community & Social Service (31 | 12.6%), Education Instruction & Library (27 | 10.9%), Health Diagnosing & Treating (22 | 8.9%), Health Technologists (22 | 8.9%), and Management (12 | 4.9%).
Management, Business, Science and Arts Occupations by Sex
Within the Management, Business, Science and Arts occupations in Spring Lake, the most male-oriented occupations are Management (100.0%), Business & Financial (100.0%), and Health Diagnosing & Treating (36.4%), while the most female-oriented occupations are Computers, Engineering & Science (100.0%), Life, Physical & Social Science (100.0%), and Legal Services & Support (100.0%).
| Occupation | Male | Female |
| Management | 12 (100.0%) | 0 (0.0%) |
| Business & Financial | 9 (100.0%) | 0 (0.0%) |
| Computers, Engineering & Science | 0 (0.0%) | 4 (100.0%) |
| Computers & Mathematics | 0 (0.0%) | 0 (0.0%) |
| Architecture & Engineering | 0 (0.0%) | 0 (0.0%) |
| Life, Physical & Social Science | 0 (0.0%) | 4 (100.0%) |
| Community & Social Service | 5 (16.1%) | 26 (83.9%) |
| Education, Arts & Media | 0 (0.0%) | 0 (0.0%) |
| Legal Services & Support | 0 (0.0%) | 4 (100.0%) |
| Education Instruction & Library | 5 (18.5%) | 22 (81.5%) |
| Arts, Media & Entertainment | 0 (0.0%) | 0 (0.0%) |
| Health Diagnosing & Treating | 8 (36.4%) | 14 (63.6%) |
| Health Technologists | 8 (36.4%) | 14 (63.6%) |
| Total (Category) | 34 (43.6%) | 44 (56.4%) |
| Total (Overall) | 146 (59.1%) | 101 (40.9%) |
Services Occupations
The most common Services occupations in Spring Lake are Food Preparation & Serving (12 | 4.9%), and Cleaning & Maintenance (3 | 1.2%).
Services Occupations by Sex
| Occupation | Male | Female |
| Healthcare Support | 0 (0.0%) | 0 (0.0%) |
| Security & Protection | 0 (0.0%) | 0 (0.0%) |
| Firefighting & Prevention | 0 (0.0%) | 0 (0.0%) |
| Law Enforcement | 0 (0.0%) | 0 (0.0%) |
| Food Preparation & Serving | 5 (41.7%) | 7 (58.3%) |
| Cleaning & Maintenance | 3 (100.0%) | 0 (0.0%) |
| Personal Care & Service | 0 (0.0%) | 0 (0.0%) |
| Total (Category) | 8 (53.3%) | 7 (46.7%) |
| Total (Overall) | 146 (59.1%) | 101 (40.9%) |
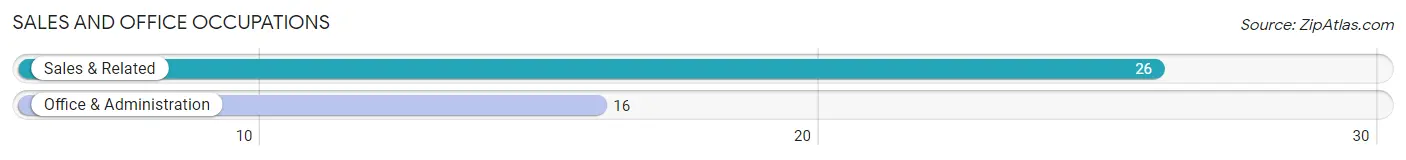
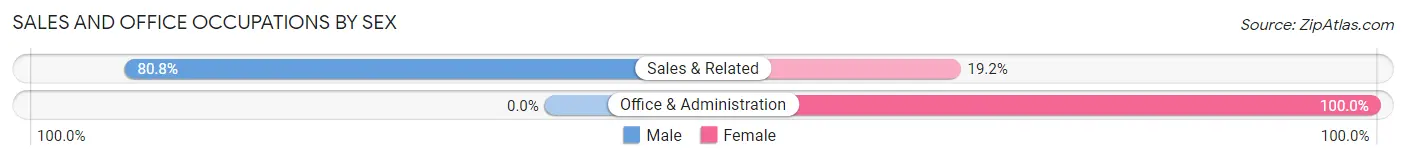
Sales and Office Occupations
The most common Sales and Office occupations in Spring Lake are Sales & Related (26 | 10.5%), and Office & Administration (16 | 6.5%).
Sales and Office Occupations by Sex
| Occupation | Male | Female |
| Sales & Related | 21 (80.8%) | 5 (19.2%) |
| Office & Administration | 0 (0.0%) | 16 (100.0%) |
| Total (Category) | 21 (50.0%) | 21 (50.0%) |
| Total (Overall) | 146 (59.1%) | 101 (40.9%) |
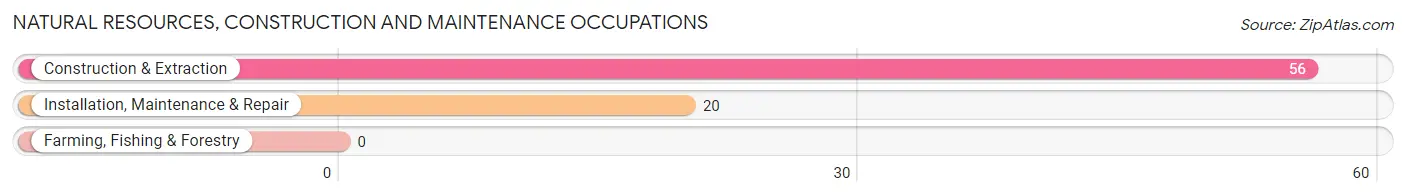
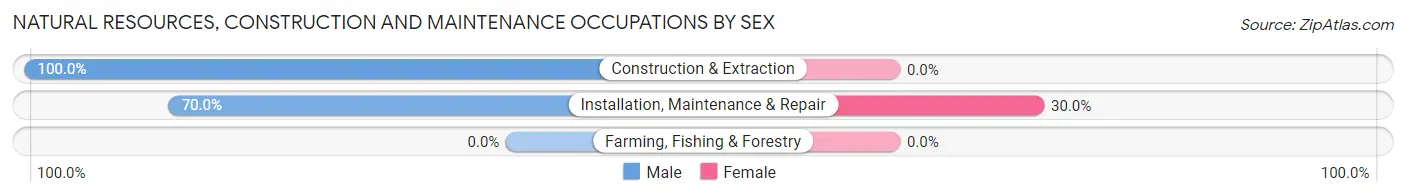
Natural Resources, Construction and Maintenance Occupations
The most common Natural Resources, Construction and Maintenance occupations in Spring Lake are Construction & Extraction (56 | 22.7%), and Installation, Maintenance & Repair (20 | 8.1%).
Natural Resources, Construction and Maintenance Occupations by Sex
| Occupation | Male | Female |
| Farming, Fishing & Forestry | 0 (0.0%) | 0 (0.0%) |
| Construction & Extraction | 56 (100.0%) | 0 (0.0%) |
| Installation, Maintenance & Repair | 14 (70.0%) | 6 (30.0%) |
| Total (Category) | 70 (92.1%) | 6 (7.9%) |
| Total (Overall) | 146 (59.1%) | 101 (40.9%) |
Production, Transportation and Moving Occupations
The most common Production, Transportation and Moving occupations in Spring Lake are Material Moving (16 | 6.5%), Production (14 | 5.7%), and Transportation (6 | 2.4%).
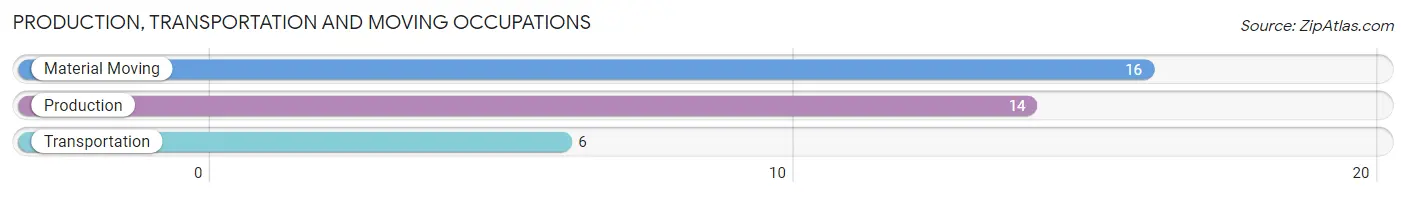
Production, Transportation and Moving Occupations by Sex
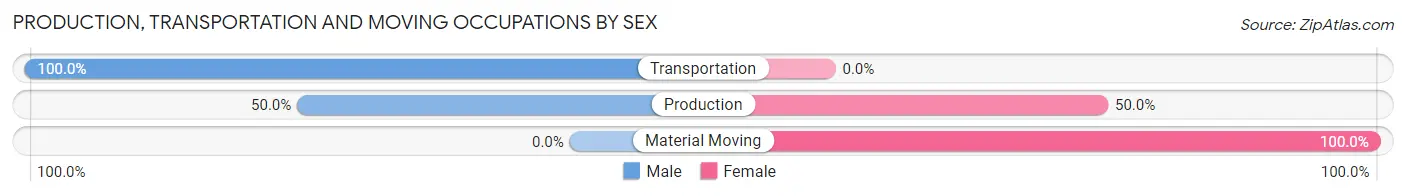
| Occupation | Male | Female |
| Production | 7 (50.0%) | 7 (50.0%) |
| Transportation | 6 (100.0%) | 0 (0.0%) |
| Material Moving | 0 (0.0%) | 16 (100.0%) |
| Total (Category) | 13 (36.1%) | 23 (63.9%) |
| Total (Overall) | 146 (59.1%) | 101 (40.9%) |
Employment Industries by Sex in Spring Lake
Employment Industries in Spring Lake
The major employment industries in Spring Lake include Construction (45 | 18.2%), Retail Trade (35 | 14.2%), Educational Services (31 | 12.6%), Public Administration (28 | 11.3%), and Administrative & Support (20 | 8.1%).
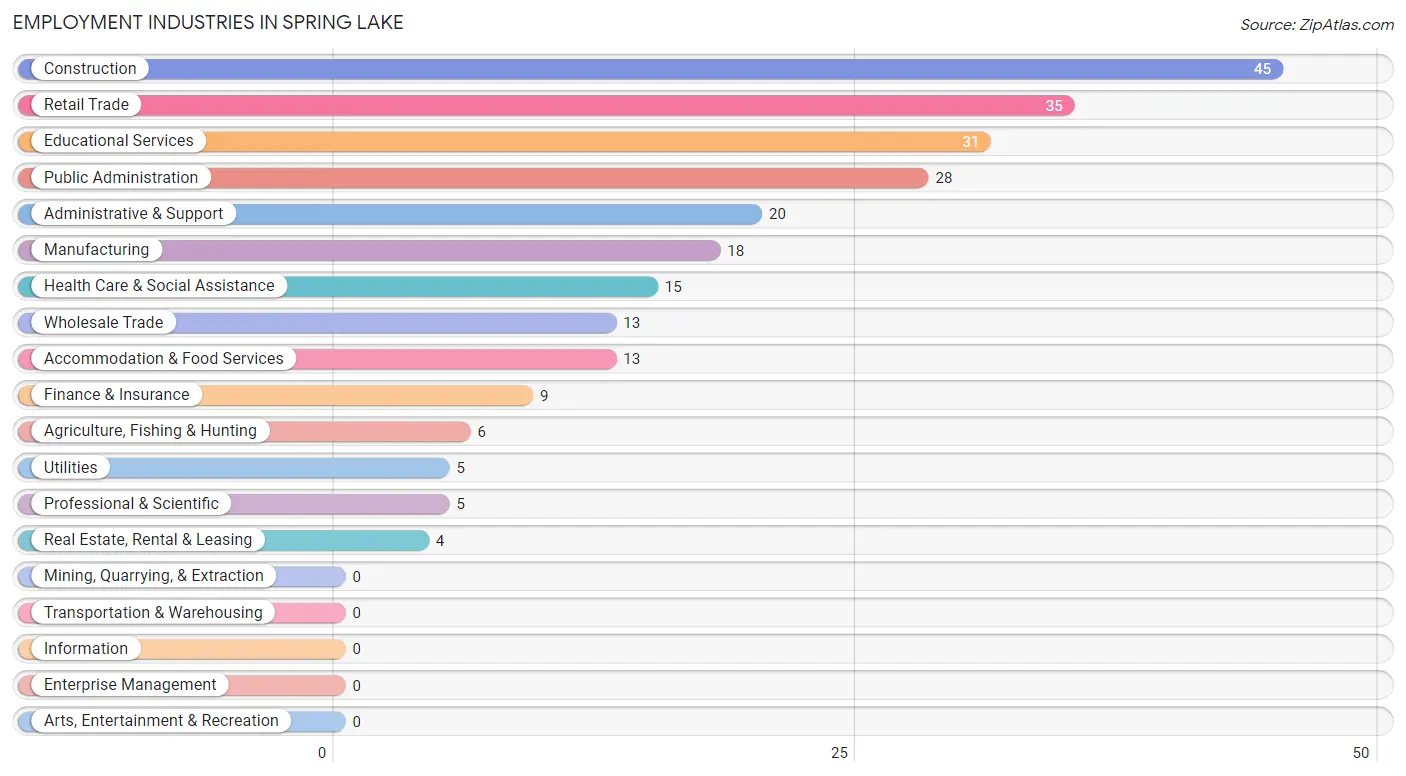
Employment Industries by Sex in Spring Lake
The Spring Lake industries that see more men than women are Construction (100.0%), Wholesale Trade (100.0%), and Utilities (100.0%), whereas the industries that tend to have a higher number of women are Agriculture, Fishing & Hunting (100.0%), Real Estate, Rental & Leasing (100.0%), and Public Administration (78.6%).
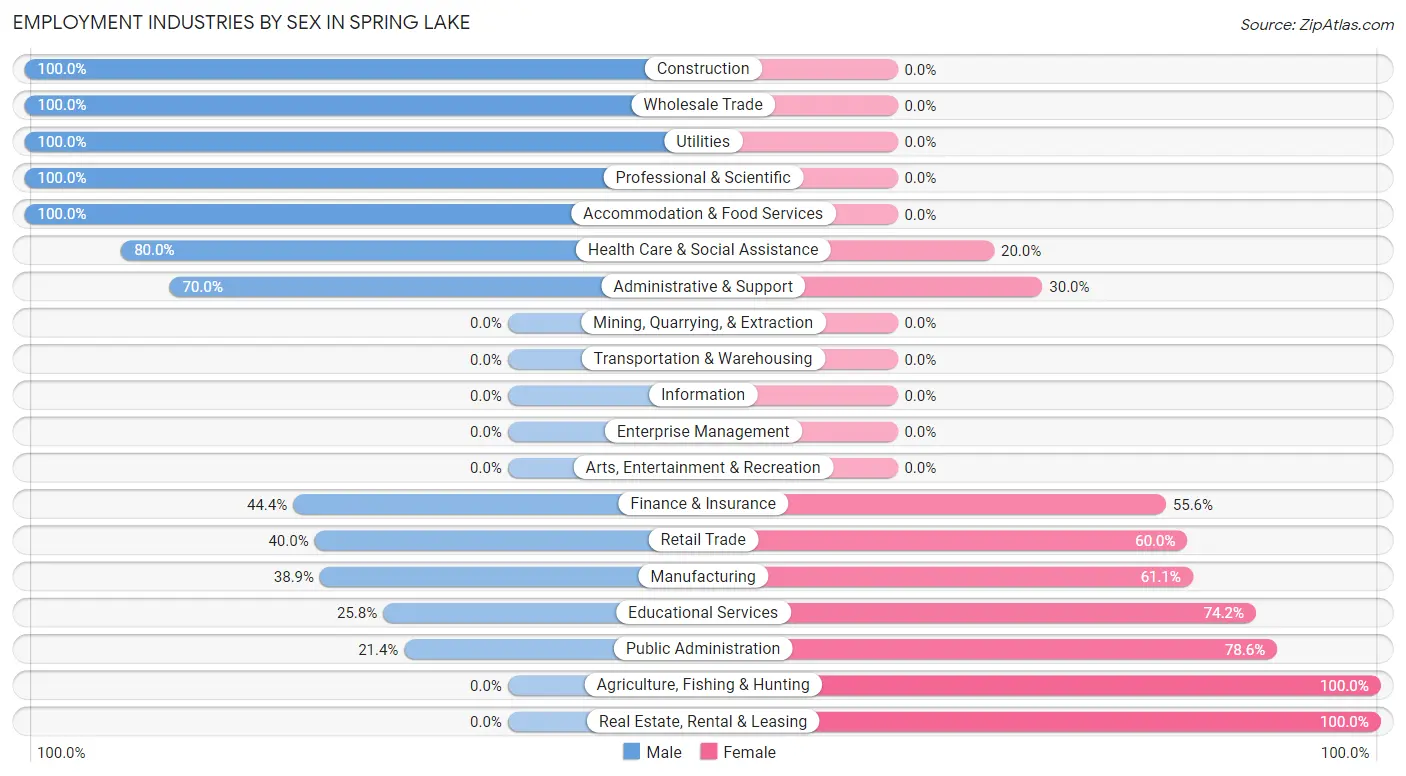
| Industry | Male | Female |
| Agriculture, Fishing & Hunting | 0 (0.0%) | 6 (100.0%) |
| Mining, Quarrying, & Extraction | 0 (0.0%) | 0 (0.0%) |
| Construction | 45 (100.0%) | 0 (0.0%) |
| Manufacturing | 7 (38.9%) | 11 (61.1%) |
| Wholesale Trade | 13 (100.0%) | 0 (0.0%) |
| Retail Trade | 14 (40.0%) | 21 (60.0%) |
| Transportation & Warehousing | 0 (0.0%) | 0 (0.0%) |
| Utilities | 5 (100.0%) | 0 (0.0%) |
| Information | 0 (0.0%) | 0 (0.0%) |
| Finance & Insurance | 4 (44.4%) | 5 (55.6%) |
| Real Estate, Rental & Leasing | 0 (0.0%) | 4 (100.0%) |
| Professional & Scientific | 5 (100.0%) | 0 (0.0%) |
| Enterprise Management | 0 (0.0%) | 0 (0.0%) |
| Administrative & Support | 14 (70.0%) | 6 (30.0%) |
| Educational Services | 8 (25.8%) | 23 (74.2%) |
| Health Care & Social Assistance | 12 (80.0%) | 3 (20.0%) |
| Arts, Entertainment & Recreation | 0 (0.0%) | 0 (0.0%) |
| Accommodation & Food Services | 13 (100.0%) | 0 (0.0%) |
| Public Administration | 6 (21.4%) | 22 (78.6%) |
| Total | 146 (59.1%) | 101 (40.9%) |
Education in Spring Lake
School Enrollment in Spring Lake
The most common levels of schooling among the 191 students in Spring Lake are middle school (70 | 36.6%), college / undergraduate (44 | 23.0%), and elementary school (37 | 19.4%).
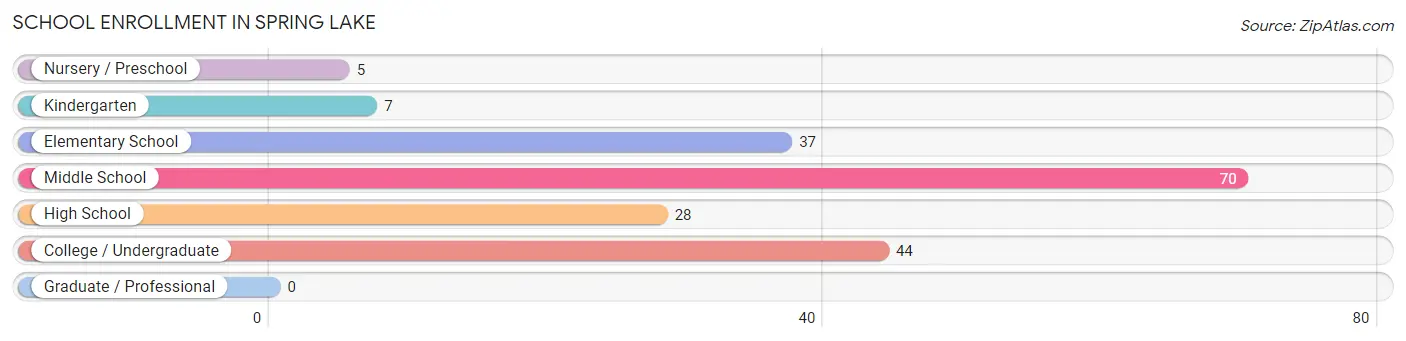
| School Level | # Students | % Students |
| Nursery / Preschool | 5 | 2.6% |
| Kindergarten | 7 | 3.7% |
| Elementary School | 37 | 19.4% |
| Middle School | 70 | 36.6% |
| High School | 28 | 14.7% |
| College / Undergraduate | 44 | 23.0% |
| Graduate / Professional | 0 | 0.0% |
| Total | 191 | 100.0% |
School Enrollment by Age by Funding Source in Spring Lake
Out of a total of 191 students who are enrolled in schools in Spring Lake, 22 (11.5%) attend a private institution, while the remaining 169 (88.5%) are enrolled in public schools. The age group of 35 years and over has the highest likelihood of being enrolled in private schools, with 17 (100.0% in the age bracket) enrolled. Conversely, the age group of 3 to 4 year olds has the lowest likelihood of being enrolled in a private school, with 5 (100.0% in the age bracket) attending a public institution.
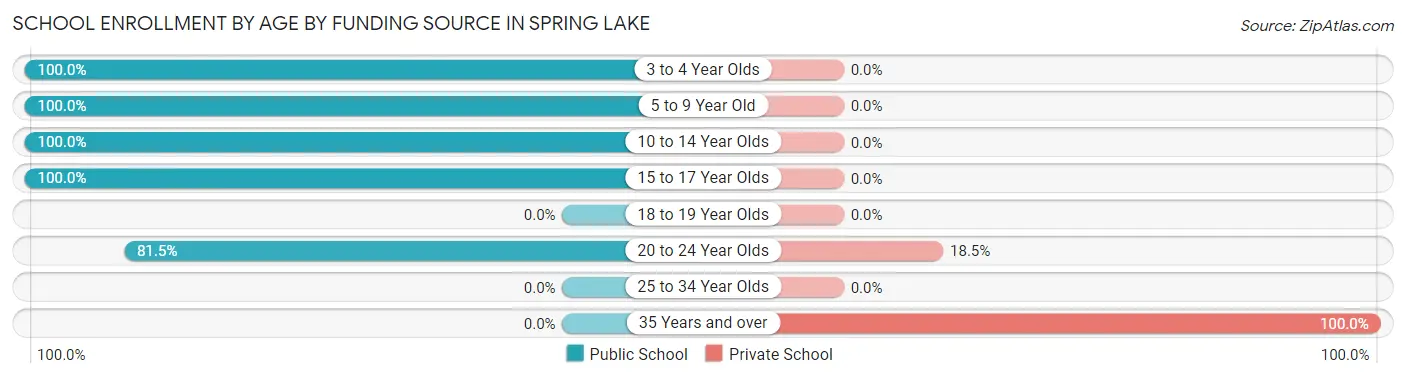
| Age Bracket | Public School | Private School |
| 3 to 4 Year Olds | 5 (100.0%) | 0 (0.0%) |
| 5 to 9 Year Old | 50 (100.0%) | 0 (0.0%) |
| 10 to 14 Year Olds | 59 (100.0%) | 0 (0.0%) |
| 15 to 17 Year Olds | 33 (100.0%) | 0 (0.0%) |
| 18 to 19 Year Olds | 0 (0.0%) | 0 (0.0%) |
| 20 to 24 Year Olds | 22 (81.5%) | 5 (18.5%) |
| 25 to 34 Year Olds | 0 (0.0%) | 0 (0.0%) |
| 35 Years and over | 0 (0.0%) | 17 (100.0%) |
| Total | 169 (88.5%) | 22 (11.5%) |
Educational Attainment by Field of Study in Spring Lake
Education (19 | 42.2%), science & technology (17 | 37.8%), literature & languages (5 | 11.1%), and bio, nature & agricultural (4 | 8.9%) are the most common fields of study among 45 individuals in Spring Lake who have obtained a bachelor's degree or higher.
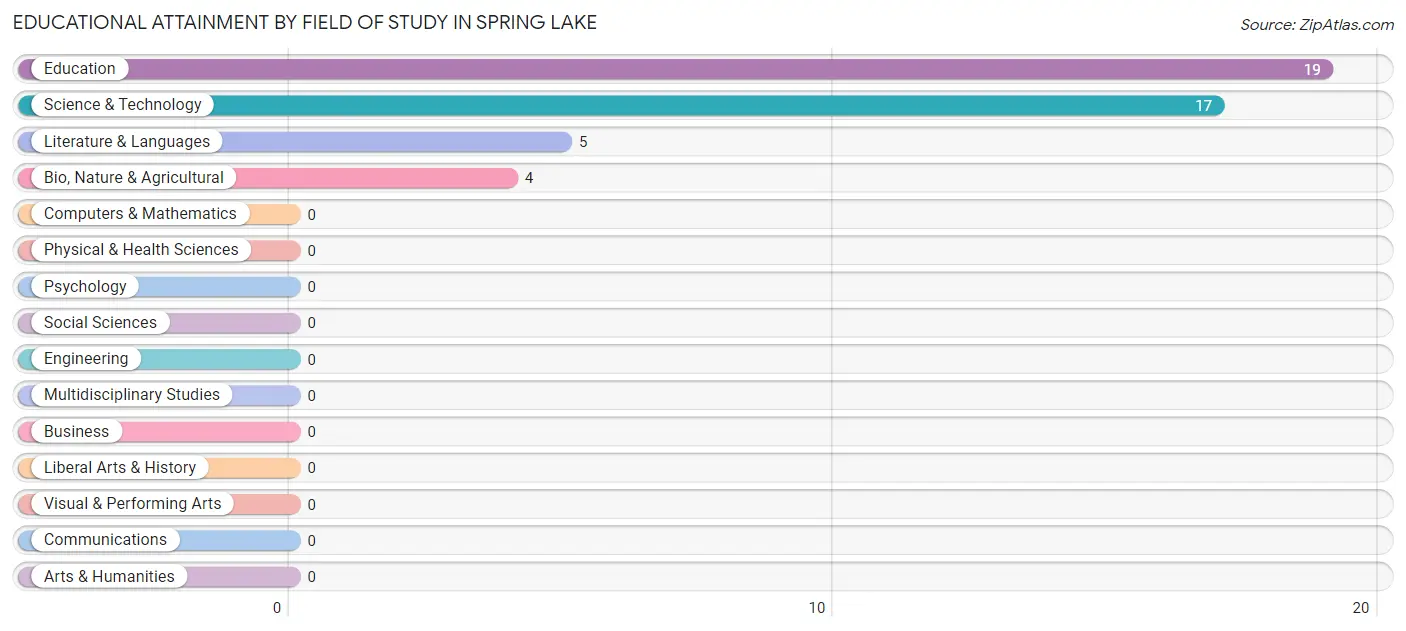
| Field of Study | # Graduates | % Graduates |
| Computers & Mathematics | 0 | 0.0% |
| Bio, Nature & Agricultural | 4 | 8.9% |
| Physical & Health Sciences | 0 | 0.0% |
| Psychology | 0 | 0.0% |
| Social Sciences | 0 | 0.0% |
| Engineering | 0 | 0.0% |
| Multidisciplinary Studies | 0 | 0.0% |
| Science & Technology | 17 | 37.8% |
| Business | 0 | 0.0% |
| Education | 19 | 42.2% |
| Literature & Languages | 5 | 11.1% |
| Liberal Arts & History | 0 | 0.0% |
| Visual & Performing Arts | 0 | 0.0% |
| Communications | 0 | 0.0% |
| Arts & Humanities | 0 | 0.0% |
| Total | 45 | 100.0% |
Transportation & Commute in Spring Lake
Vehicle Availability by Sex in Spring Lake
The most prevalent vehicle ownership categories in Spring Lake are males with 2 vehicles (63, accounting for 43.1%) and females with 2 vehicles (27, making up 67.0%).
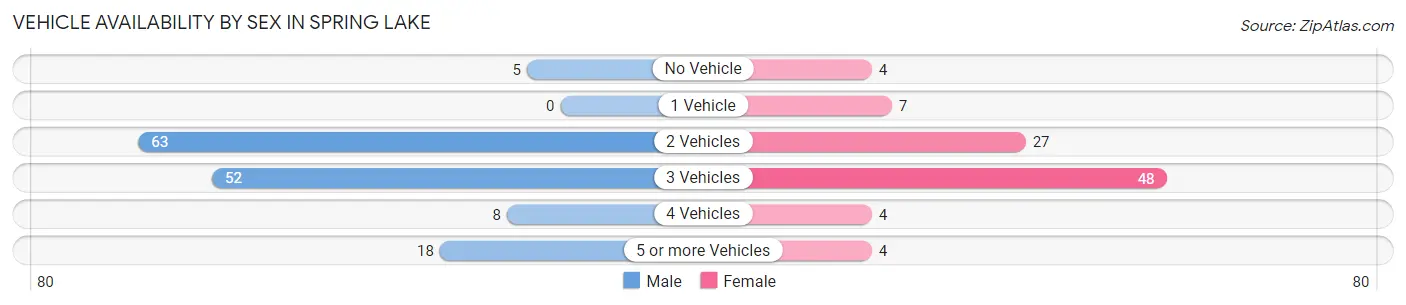
| Vehicles Available | Male | Female |
| No Vehicle | 5 (3.4%) | 4 (4.3%) |
| 1 Vehicle | 0 (0.0%) | 7 (7.4%) |
| 2 Vehicles | 63 (43.1%) | 27 (28.7%) |
| 3 Vehicles | 52 (35.6%) | 48 (51.1%) |
| 4 Vehicles | 8 (5.5%) | 4 (4.3%) |
| 5 or more Vehicles | 18 (12.3%) | 4 (4.3%) |
| Total | 146 (100.0%) | 94 (100.0%) |
Commute Time in Spring Lake
The most frequently occuring commute durations in Spring Lake are 20 to 24 minutes (61 commuters, 28.4%), 5 to 9 minutes (40 commuters, 18.6%), and 30 to 34 minutes (28 commuters, 13.0%).
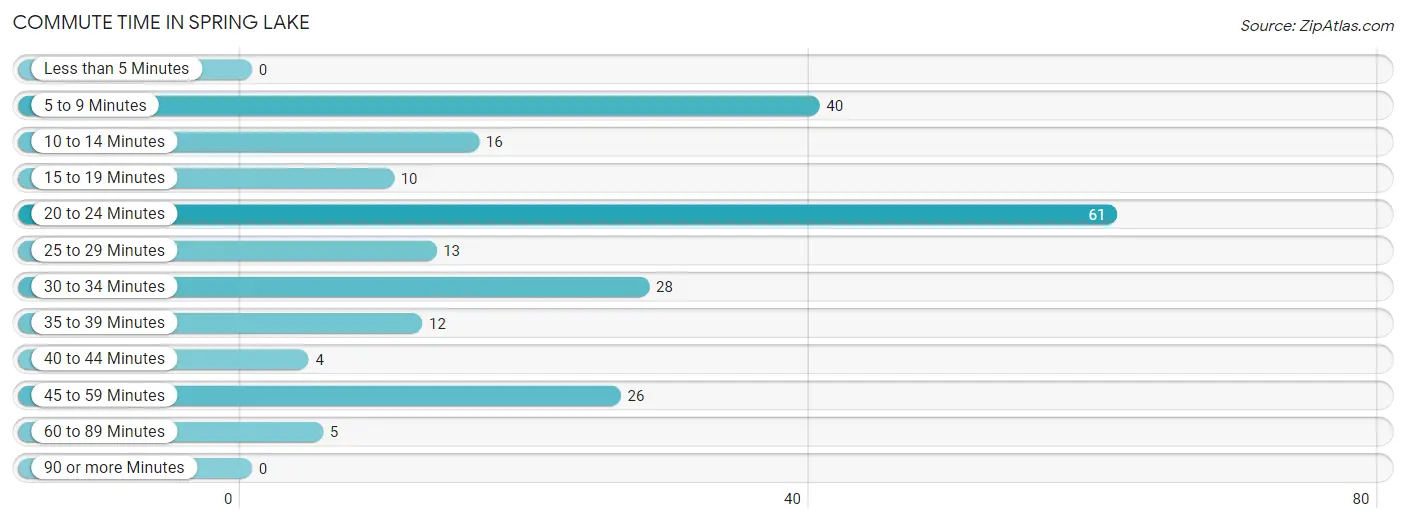
| Commute Time | # Commuters | % Commuters |
| Less than 5 Minutes | 0 | 0.0% |
| 5 to 9 Minutes | 40 | 18.6% |
| 10 to 14 Minutes | 16 | 7.4% |
| 15 to 19 Minutes | 10 | 4.6% |
| 20 to 24 Minutes | 61 | 28.4% |
| 25 to 29 Minutes | 13 | 6.0% |
| 30 to 34 Minutes | 28 | 13.0% |
| 35 to 39 Minutes | 12 | 5.6% |
| 40 to 44 Minutes | 4 | 1.9% |
| 45 to 59 Minutes | 26 | 12.1% |
| 60 to 89 Minutes | 5 | 2.3% |
| 90 or more Minutes | 0 | 0.0% |
Commute Time by Sex in Spring Lake
The most common commute times in Spring Lake are 20 to 24 minutes (54 commuters, 40.9%) for males and 5 to 9 minutes (28 commuters, 33.7%) for females.
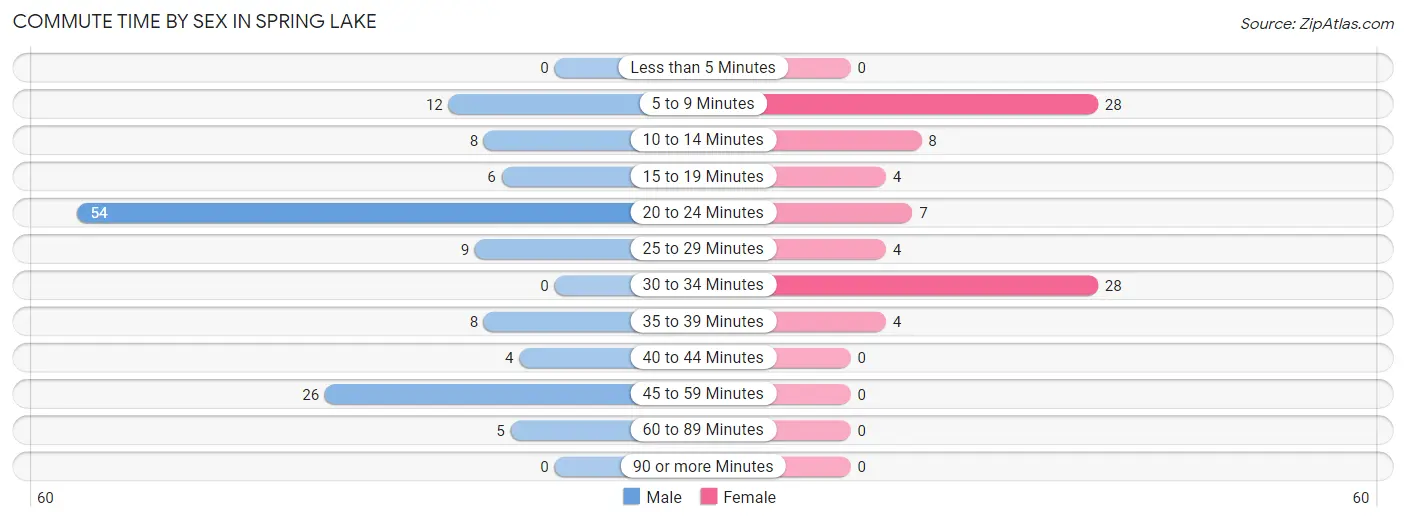
| Commute Time | Male | Female |
| Less than 5 Minutes | 0 (0.0%) | 0 (0.0%) |
| 5 to 9 Minutes | 12 (9.1%) | 28 (33.7%) |
| 10 to 14 Minutes | 8 (6.1%) | 8 (9.6%) |
| 15 to 19 Minutes | 6 (4.5%) | 4 (4.8%) |
| 20 to 24 Minutes | 54 (40.9%) | 7 (8.4%) |
| 25 to 29 Minutes | 9 (6.8%) | 4 (4.8%) |
| 30 to 34 Minutes | 0 (0.0%) | 28 (33.7%) |
| 35 to 39 Minutes | 8 (6.1%) | 4 (4.8%) |
| 40 to 44 Minutes | 4 (3.0%) | 0 (0.0%) |
| 45 to 59 Minutes | 26 (19.7%) | 0 (0.0%) |
| 60 to 89 Minutes | 5 (3.8%) | 0 (0.0%) |
| 90 or more Minutes | 0 (0.0%) | 0 (0.0%) |
Time of Departure to Work by Sex in Spring Lake
The most frequent times of departure to work in Spring Lake are 5:30 AM to 5:59 AM (42, 31.8%) for males and 5:00 AM to 5:29 AM (23, 27.7%) for females.
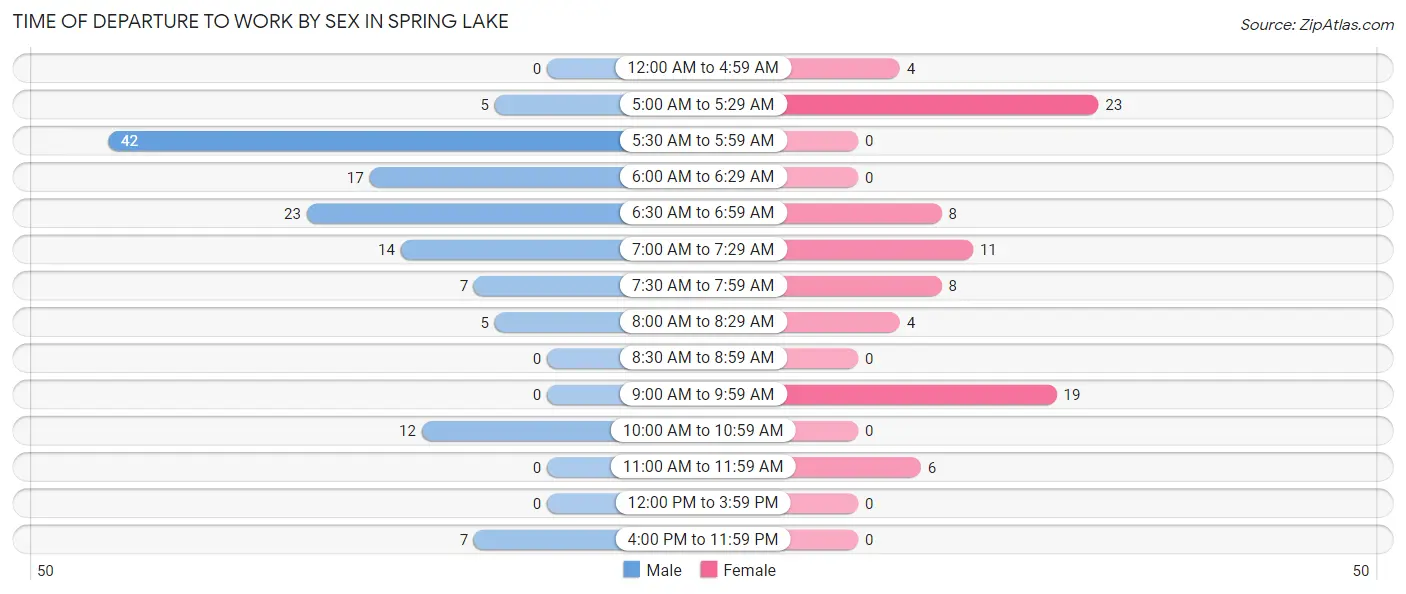
| Time of Departure | Male | Female |
| 12:00 AM to 4:59 AM | 0 (0.0%) | 4 (4.8%) |
| 5:00 AM to 5:29 AM | 5 (3.8%) | 23 (27.7%) |
| 5:30 AM to 5:59 AM | 42 (31.8%) | 0 (0.0%) |
| 6:00 AM to 6:29 AM | 17 (12.9%) | 0 (0.0%) |
| 6:30 AM to 6:59 AM | 23 (17.4%) | 8 (9.6%) |
| 7:00 AM to 7:29 AM | 14 (10.6%) | 11 (13.3%) |
| 7:30 AM to 7:59 AM | 7 (5.3%) | 8 (9.6%) |
| 8:00 AM to 8:29 AM | 5 (3.8%) | 4 (4.8%) |
| 8:30 AM to 8:59 AM | 0 (0.0%) | 0 (0.0%) |
| 9:00 AM to 9:59 AM | 0 (0.0%) | 19 (22.9%) |
| 10:00 AM to 10:59 AM | 12 (9.1%) | 0 (0.0%) |
| 11:00 AM to 11:59 AM | 0 (0.0%) | 6 (7.2%) |
| 12:00 PM to 3:59 PM | 0 (0.0%) | 0 (0.0%) |
| 4:00 PM to 11:59 PM | 7 (5.3%) | 0 (0.0%) |
| Total | 132 (100.0%) | 83 (100.0%) |
Housing Occupancy in Spring Lake
Occupancy by Ownership in Spring Lake
Of the total 132 dwellings in Spring Lake, owner-occupied units account for 110 (83.3%), while renter-occupied units make up 22 (16.7%).
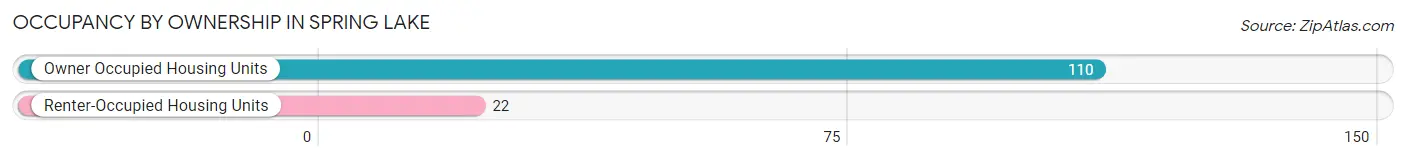
| Occupancy | # Housing Units | % Housing Units |
| Owner Occupied Housing Units | 110 | 83.3% |
| Renter-Occupied Housing Units | 22 | 16.7% |
| Total Occupied Housing Units | 132 | 100.0% |
Occupancy by Household Size in Spring Lake
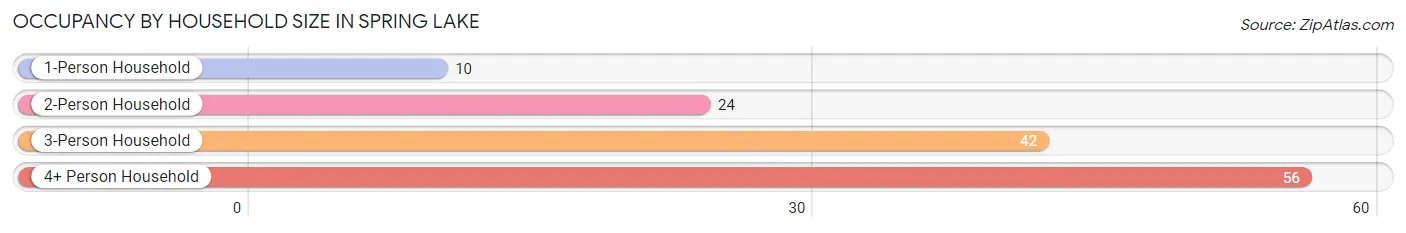
| Household Size | # Housing Units | % Housing Units |
| 1-Person Household | 10 | 7.6% |
| 2-Person Household | 24 | 18.2% |
| 3-Person Household | 42 | 31.8% |
| 4+ Person Household | 56 | 42.4% |
| Total Housing Units | 132 | 100.0% |
Occupancy by Ownership by Household Size in Spring Lake
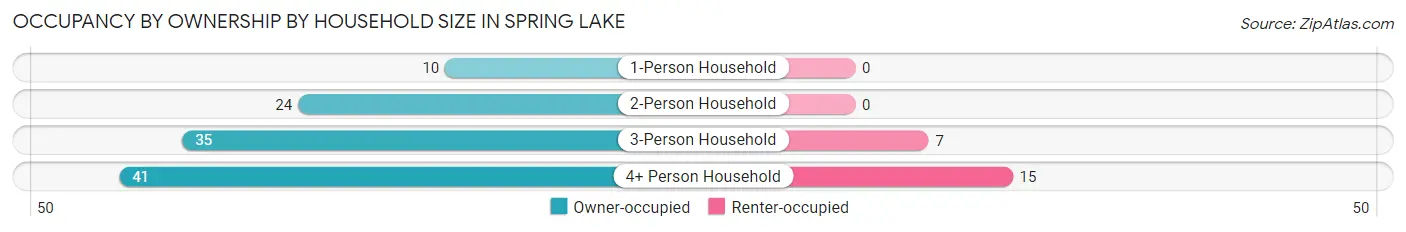
| Household Size | Owner-occupied | Renter-occupied |
| 1-Person Household | 10 (100.0%) | 0 (0.0%) |
| 2-Person Household | 24 (100.0%) | 0 (0.0%) |
| 3-Person Household | 35 (83.3%) | 7 (16.7%) |
| 4+ Person Household | 41 (73.2%) | 15 (26.8%) |
| Total Housing Units | 110 (83.3%) | 22 (16.7%) |
Occupancy by Educational Attainment in Spring Lake
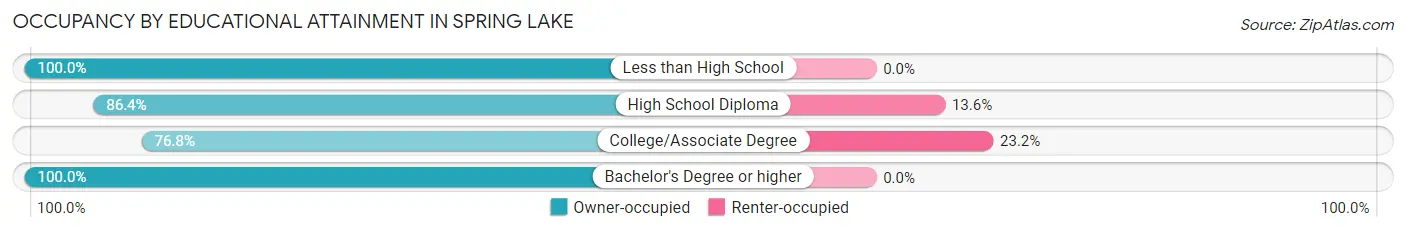
| Household Size | Owner-occupied | Renter-occupied |
| Less than High School | 7 (100.0%) | 0 (0.0%) |
| High School Diploma | 38 (86.4%) | 6 (13.6%) |
| College/Associate Degree | 53 (76.8%) | 16 (23.2%) |
| Bachelor's Degree or higher | 12 (100.0%) | 0 (0.0%) |
Occupancy by Age of Householder in Spring Lake
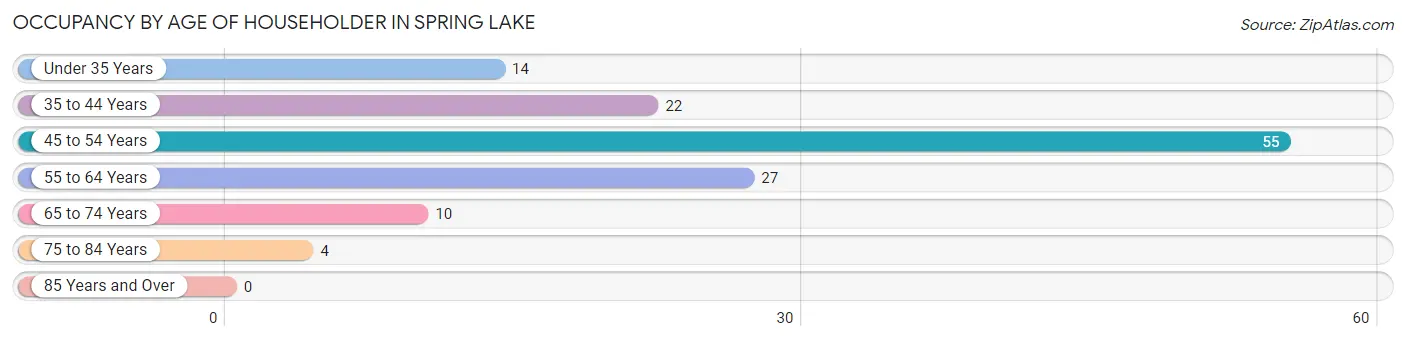
| Age Bracket | # Households | % Households |
| Under 35 Years | 14 | 10.6% |
| 35 to 44 Years | 22 | 16.7% |
| 45 to 54 Years | 55 | 41.7% |
| 55 to 64 Years | 27 | 20.4% |
| 65 to 74 Years | 10 | 7.6% |
| 75 to 84 Years | 4 | 3.0% |
| 85 Years and Over | 0 | 0.0% |
| Total | 132 | 100.0% |
Housing Finances in Spring Lake
Median Income by Occupancy in Spring Lake
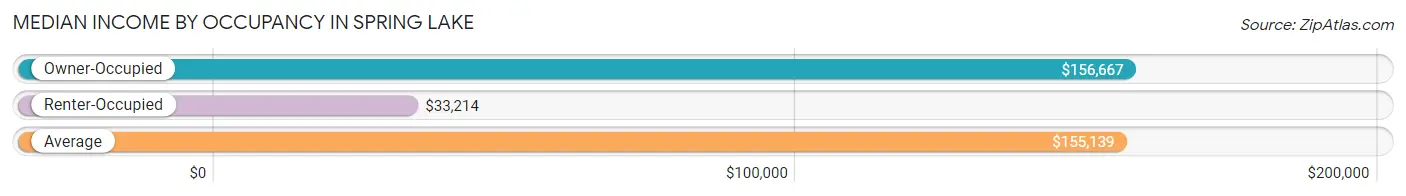
| Occupancy Type | # Households | Median Income |
| Owner-Occupied | 110 (83.3%) | $156,667 |
| Renter-Occupied | 22 (16.7%) | $33,214 |
| Average | 132 (100.0%) | $155,139 |
Occupancy by Householder Income Bracket in Spring Lake
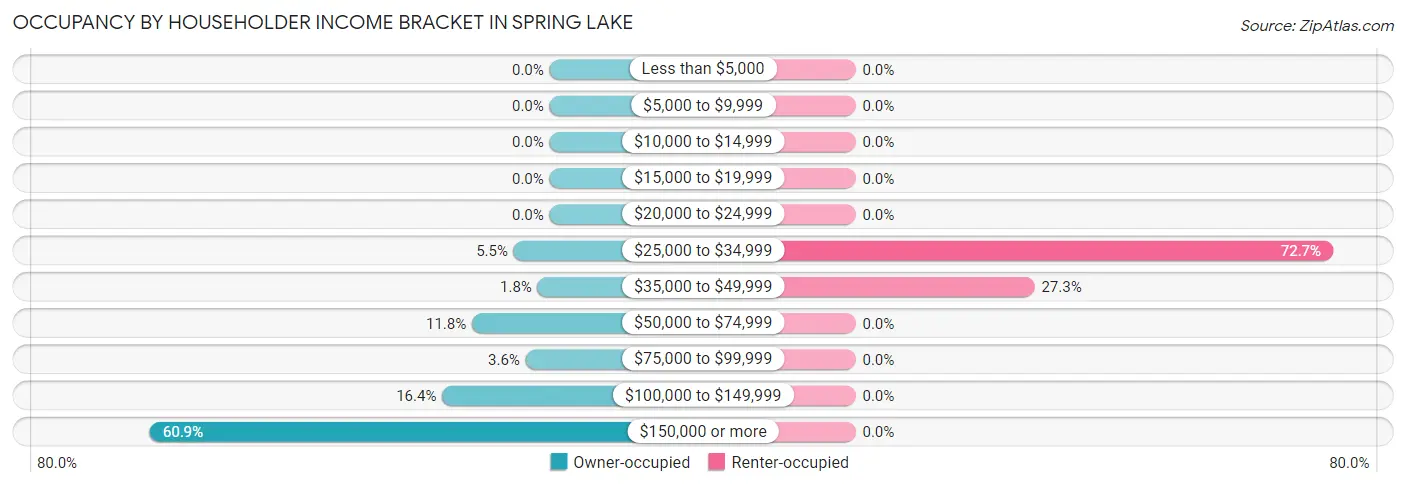
| Income Bracket | Owner-occupied | Renter-occupied |
| Less than $5,000 | 0 (0.0%) | 0 (0.0%) |
| $5,000 to $9,999 | 0 (0.0%) | 0 (0.0%) |
| $10,000 to $14,999 | 0 (0.0%) | 0 (0.0%) |
| $15,000 to $19,999 | 0 (0.0%) | 0 (0.0%) |
| $20,000 to $24,999 | 0 (0.0%) | 0 (0.0%) |
| $25,000 to $34,999 | 6 (5.4%) | 16 (72.7%) |
| $35,000 to $49,999 | 2 (1.8%) | 6 (27.3%) |
| $50,000 to $74,999 | 13 (11.8%) | 0 (0.0%) |
| $75,000 to $99,999 | 4 (3.6%) | 0 (0.0%) |
| $100,000 to $149,999 | 18 (16.4%) | 0 (0.0%) |
| $150,000 or more | 67 (60.9%) | 0 (0.0%) |
| Total | 110 (100.0%) | 22 (100.0%) |
Monthly Housing Cost Tiers in Spring Lake
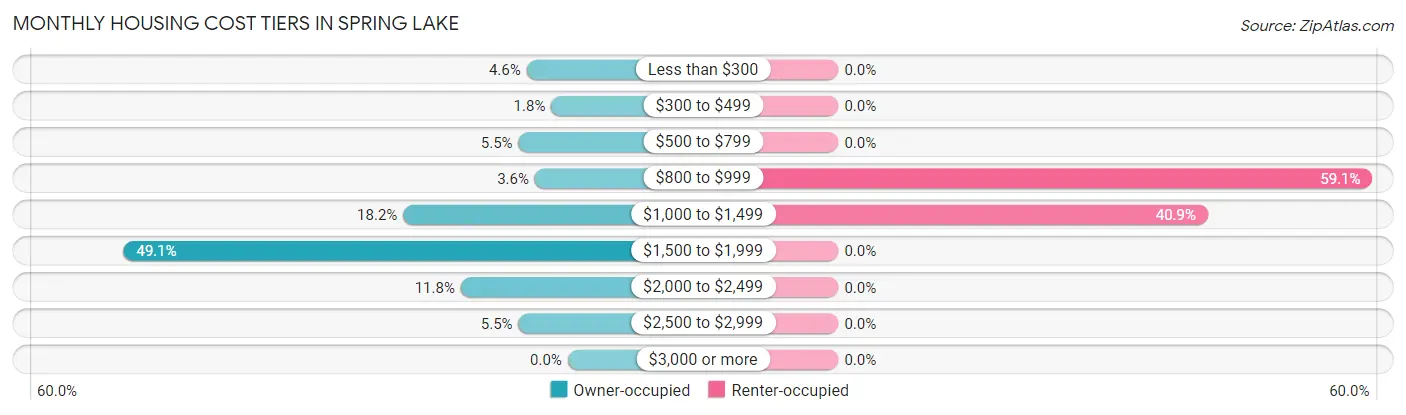
| Monthly Cost | Owner-occupied | Renter-occupied |
| Less than $300 | 5 (4.5%) | 0 (0.0%) |
| $300 to $499 | 2 (1.8%) | 0 (0.0%) |
| $500 to $799 | 6 (5.4%) | 0 (0.0%) |
| $800 to $999 | 4 (3.6%) | 13 (59.1%) |
| $1,000 to $1,499 | 20 (18.2%) | 9 (40.9%) |
| $1,500 to $1,999 | 54 (49.1%) | 0 (0.0%) |
| $2,000 to $2,499 | 13 (11.8%) | 0 (0.0%) |
| $2,500 to $2,999 | 6 (5.4%) | 0 (0.0%) |
| $3,000 or more | 0 (0.0%) | 0 (0.0%) |
| Total | 110 (100.0%) | 22 (100.0%) |
Physical Housing Characteristics in Spring Lake
Housing Structures in Spring Lake
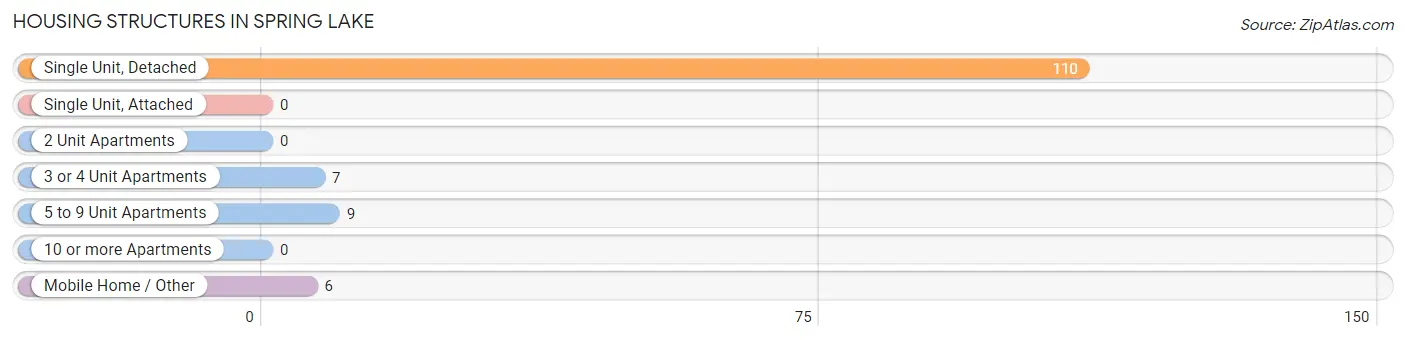
| Structure Type | # Housing Units | % Housing Units |
| Single Unit, Detached | 110 | 83.3% |
| Single Unit, Attached | 0 | 0.0% |
| 2 Unit Apartments | 0 | 0.0% |
| 3 or 4 Unit Apartments | 7 | 5.3% |
| 5 to 9 Unit Apartments | 9 | 6.8% |
| 10 or more Apartments | 0 | 0.0% |
| Mobile Home / Other | 6 | 4.5% |
| Total | 132 | 100.0% |
Housing Structures by Occupancy in Spring Lake
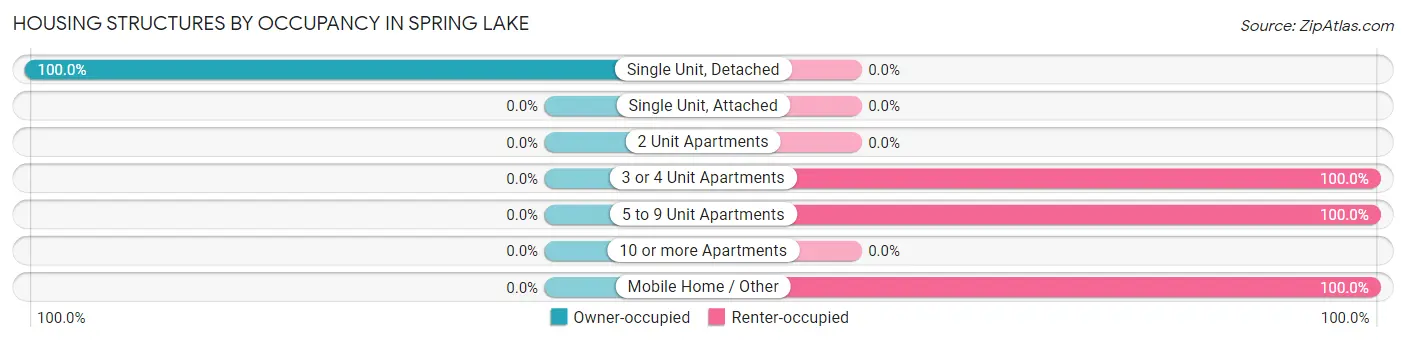
| Structure Type | Owner-occupied | Renter-occupied |
| Single Unit, Detached | 110 (100.0%) | 0 (0.0%) |
| Single Unit, Attached | 0 (0.0%) | 0 (0.0%) |
| 2 Unit Apartments | 0 (0.0%) | 0 (0.0%) |
| 3 or 4 Unit Apartments | 0 (0.0%) | 7 (100.0%) |
| 5 to 9 Unit Apartments | 0 (0.0%) | 9 (100.0%) |
| 10 or more Apartments | 0 (0.0%) | 0 (0.0%) |
| Mobile Home / Other | 0 (0.0%) | 6 (100.0%) |
| Total | 110 (83.3%) | 22 (16.7%) |
Housing Structures by Number of Rooms in Spring Lake
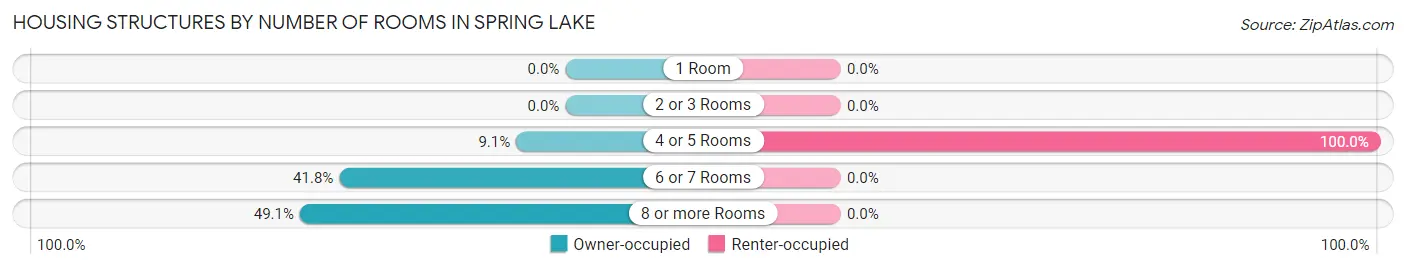
| Number of Rooms | Owner-occupied | Renter-occupied |
| 1 Room | 0 (0.0%) | 0 (0.0%) |
| 2 or 3 Rooms | 0 (0.0%) | 0 (0.0%) |
| 4 or 5 Rooms | 10 (9.1%) | 22 (100.0%) |
| 6 or 7 Rooms | 46 (41.8%) | 0 (0.0%) |
| 8 or more Rooms | 54 (49.1%) | 0 (0.0%) |
| Total | 110 (100.0%) | 22 (100.0%) |
Housing Structure by Heating Type in Spring Lake
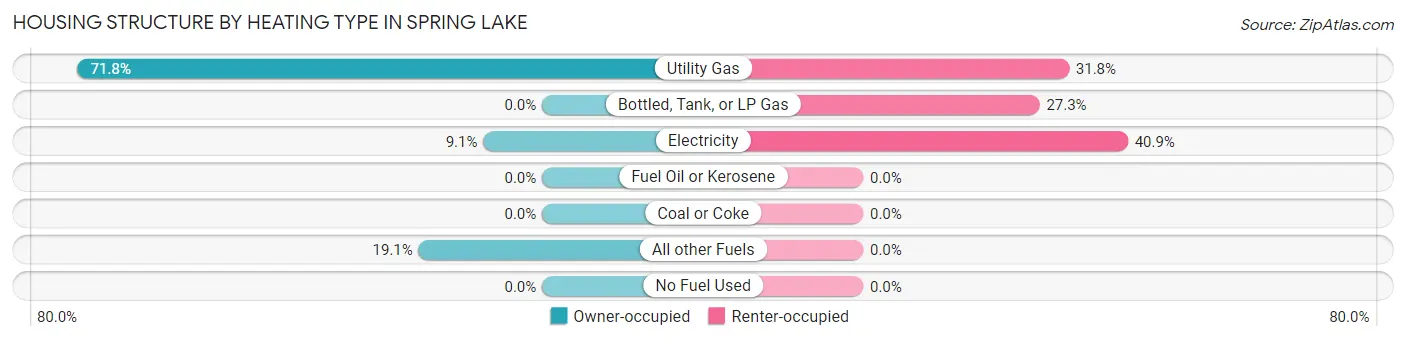
| Heating Type | Owner-occupied | Renter-occupied |
| Utility Gas | 79 (71.8%) | 7 (31.8%) |
| Bottled, Tank, or LP Gas | 0 (0.0%) | 6 (27.3%) |
| Electricity | 10 (9.1%) | 9 (40.9%) |
| Fuel Oil or Kerosene | 0 (0.0%) | 0 (0.0%) |
| Coal or Coke | 0 (0.0%) | 0 (0.0%) |
| All other Fuels | 21 (19.1%) | 0 (0.0%) |
| No Fuel Used | 0 (0.0%) | 0 (0.0%) |
| Total | 110 (100.0%) | 22 (100.0%) |
Household Vehicle Usage in Spring Lake
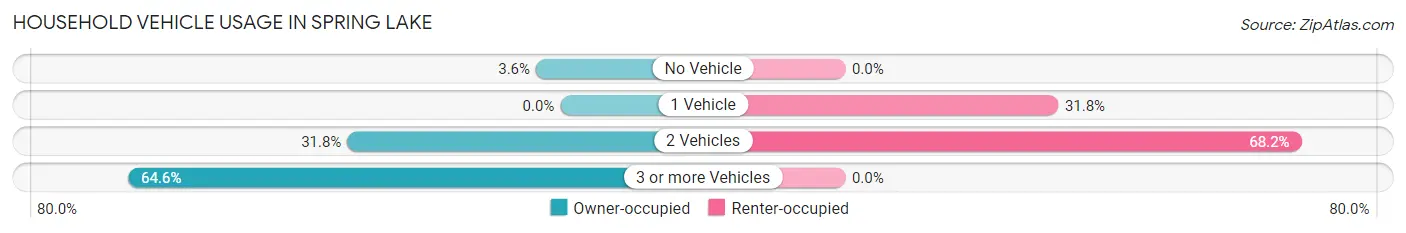
| Vehicles per Household | Owner-occupied | Renter-occupied |
| No Vehicle | 4 (3.6%) | 0 (0.0%) |
| 1 Vehicle | 0 (0.0%) | 7 (31.8%) |
| 2 Vehicles | 35 (31.8%) | 15 (68.2%) |
| 3 or more Vehicles | 71 (64.5%) | 0 (0.0%) |
| Total | 110 (100.0%) | 22 (100.0%) |
Real Estate & Mortgages in Spring Lake
Real Estate and Mortgage Overview in Spring Lake
| Characteristic | Without Mortgage | With Mortgage |
| Housing Units | 13 | 97 |
| Median Property Value | $392,900 | $458,500 |
| Median Household Income | $198,750 | $59 |
| Monthly Housing Costs | $388 | $0 |
| Real Estate Taxes | - | - |
Property Value by Mortgage Status in Spring Lake
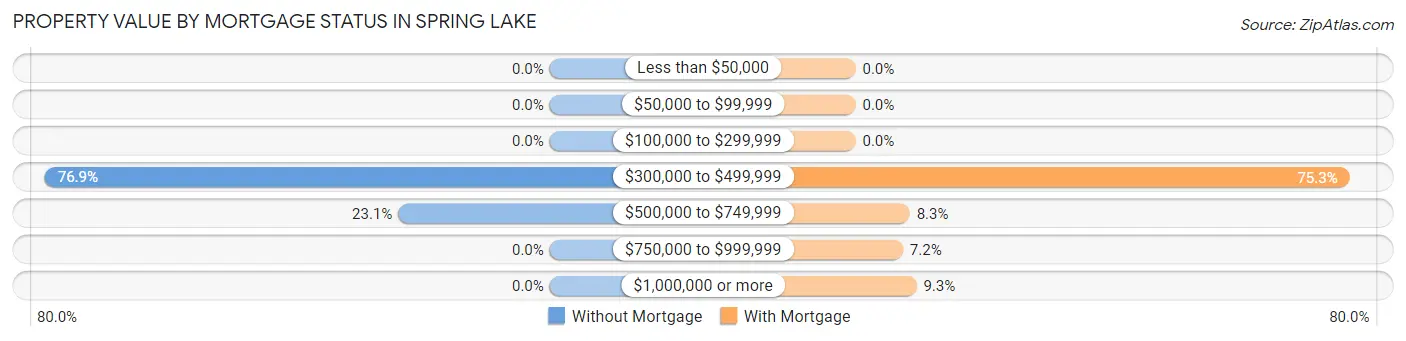
| Property Value | Without Mortgage | With Mortgage |
| Less than $50,000 | 0 (0.0%) | 0 (0.0%) |
| $50,000 to $99,999 | 0 (0.0%) | 0 (0.0%) |
| $100,000 to $299,999 | 0 (0.0%) | 0 (0.0%) |
| $300,000 to $499,999 | 10 (76.9%) | 73 (75.3%) |
| $500,000 to $749,999 | 3 (23.1%) | 8 (8.3%) |
| $750,000 to $999,999 | 0 (0.0%) | 7 (7.2%) |
| $1,000,000 or more | 0 (0.0%) | 9 (9.3%) |
| Total | 13 (100.0%) | 97 (100.0%) |
Household Income by Mortgage Status in Spring Lake
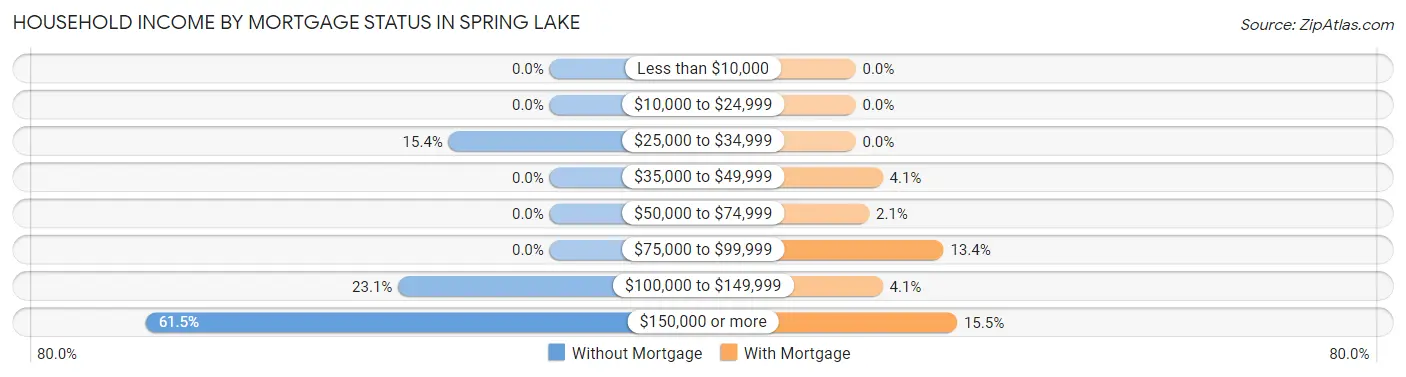
| Household Income | Without Mortgage | With Mortgage |
| Less than $10,000 | 0 (0.0%) | 0 (0.0%) |
| $10,000 to $24,999 | 0 (0.0%) | 0 (0.0%) |
| $25,000 to $34,999 | 2 (15.4%) | 0 (0.0%) |
| $35,000 to $49,999 | 0 (0.0%) | 4 (4.1%) |
| $50,000 to $74,999 | 0 (0.0%) | 2 (2.1%) |
| $75,000 to $99,999 | 0 (0.0%) | 13 (13.4%) |
| $100,000 to $149,999 | 3 (23.1%) | 4 (4.1%) |
| $150,000 or more | 8 (61.5%) | 15 (15.5%) |
| Total | 13 (100.0%) | 97 (100.0%) |
Property Value to Household Income Ratio in Spring Lake
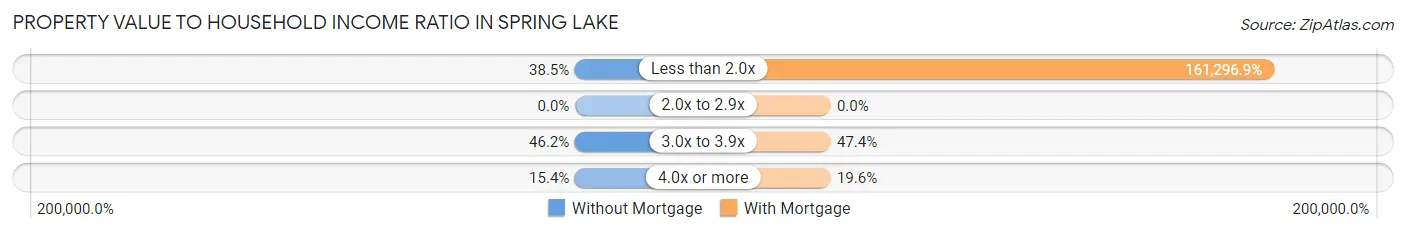
| Value-to-Income Ratio | Without Mortgage | With Mortgage |
| Less than 2.0x | 5 (38.5%) | 156,458 (161,296.9%) |
| 2.0x to 2.9x | 0 (0.0%) | 0 (0.0%) |
| 3.0x to 3.9x | 6 (46.2%) | 46 (47.4%) |
| 4.0x or more | 2 (15.4%) | 19 (19.6%) |
| Total | 13 (100.0%) | 97 (100.0%) |
Real Estate Taxes by Mortgage Status in Spring Lake
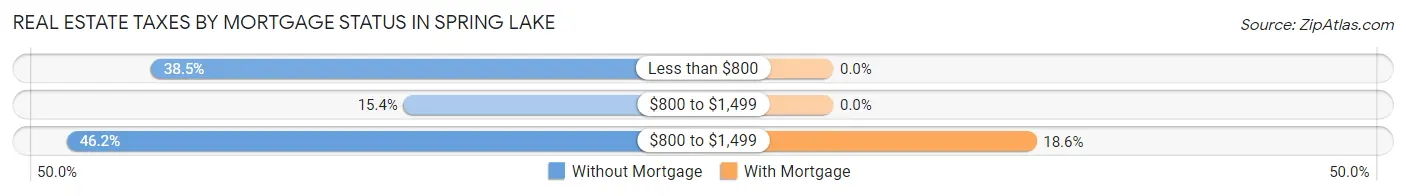
| Property Taxes | Without Mortgage | With Mortgage |
| Less than $800 | 5 (38.5%) | 0 (0.0%) |
| $800 to $1,499 | 2 (15.4%) | 0 (0.0%) |
| $800 to $1,499 | 6 (46.2%) | 18 (18.6%) |
| Total | 13 (100.0%) | 97 (100.0%) |
Health & Disability in Spring Lake
Health Insurance Coverage by Age in Spring Lake
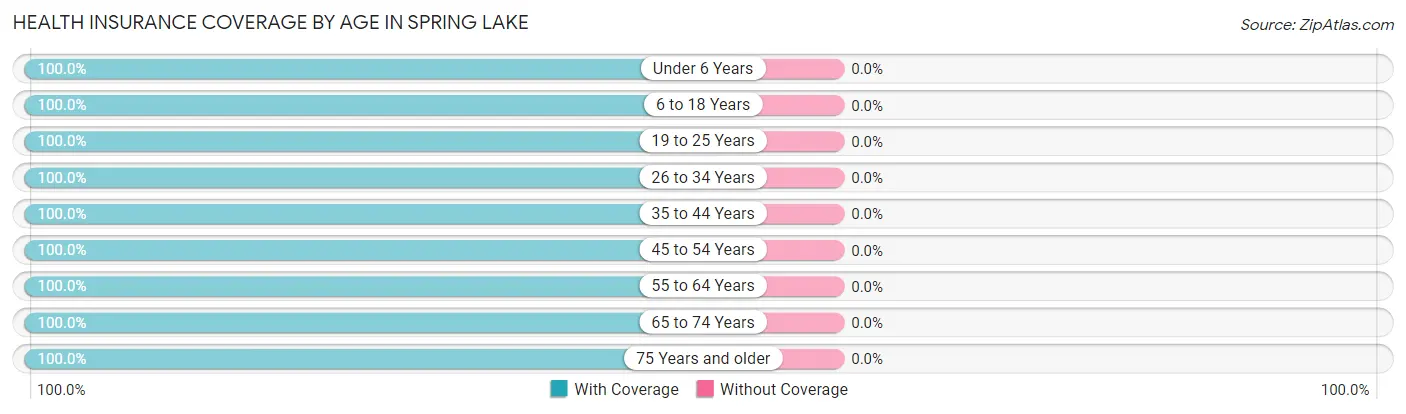
| Age Bracket | With Coverage | Without Coverage |
| Under 6 Years | 53 (100.0%) | 0 (0.0%) |
| 6 to 18 Years | 135 (100.0%) | 0 (0.0%) |
| 19 to 25 Years | 60 (100.0%) | 0 (0.0%) |
| 26 to 34 Years | 33 (100.0%) | 0 (0.0%) |
| 35 to 44 Years | 44 (100.0%) | 0 (0.0%) |
| 45 to 54 Years | 109 (100.0%) | 0 (0.0%) |
| 55 to 64 Years | 47 (100.0%) | 0 (0.0%) |
| 65 to 74 Years | 21 (100.0%) | 0 (0.0%) |
| 75 Years and older | 15 (100.0%) | 0 (0.0%) |
| Total | 517 (100.0%) | 0 (0.0%) |
Health Insurance Coverage by Citizenship Status in Spring Lake
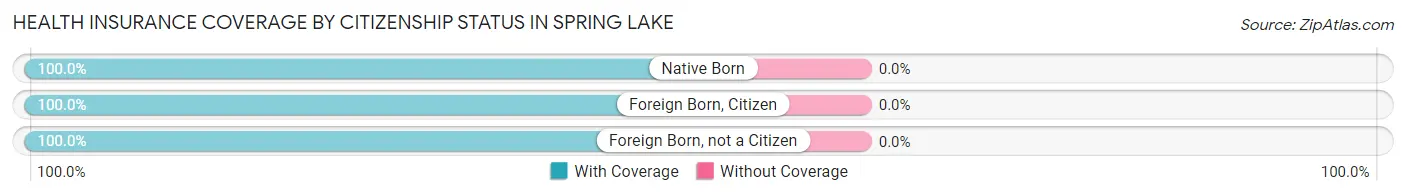
| Citizenship Status | With Coverage | Without Coverage |
| Native Born | 53 (100.0%) | 0 (0.0%) |
| Foreign Born, Citizen | 135 (100.0%) | 0 (0.0%) |
| Foreign Born, not a Citizen | 60 (100.0%) | 0 (0.0%) |
Health Insurance Coverage by Household Income in Spring Lake
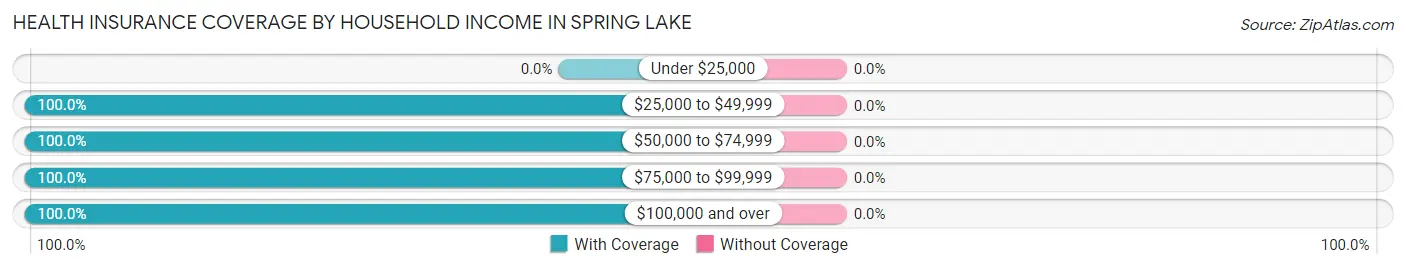
| Household Income | With Coverage | Without Coverage |
| Under $25,000 | 0 (0.0%) | 0 (0.0%) |
| $25,000 to $49,999 | 135 (100.0%) | 0 (0.0%) |
| $50,000 to $74,999 | 47 (100.0%) | 0 (0.0%) |
| $75,000 to $99,999 | 12 (100.0%) | 0 (0.0%) |
| $100,000 and over | 323 (100.0%) | 0 (0.0%) |
Public vs Private Health Insurance Coverage by Age in Spring Lake
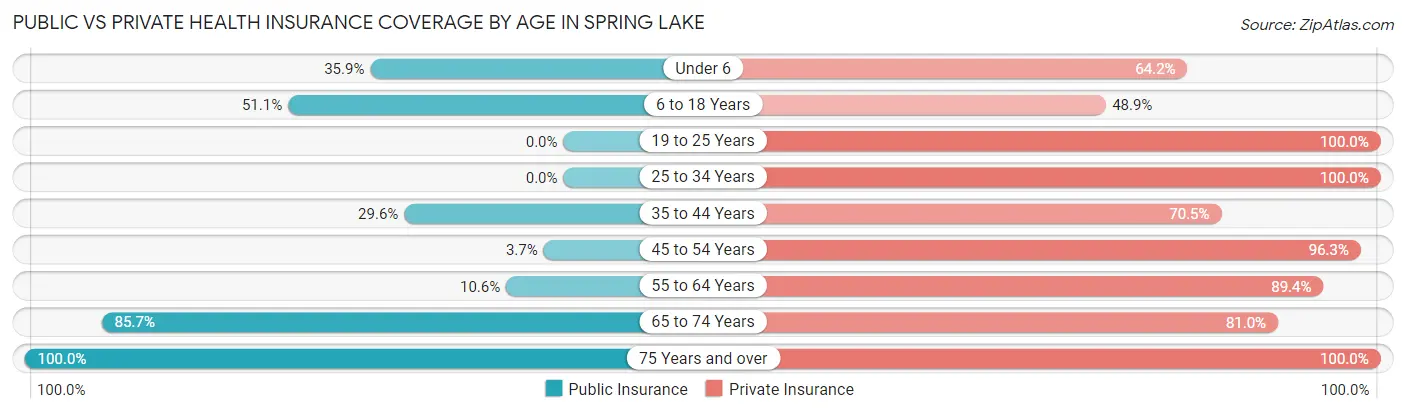
| Age Bracket | Public Insurance | Private Insurance |
| Under 6 | 19 (35.8%) | 34 (64.1%) |
| 6 to 18 Years | 69 (51.1%) | 66 (48.9%) |
| 19 to 25 Years | 0 (0.0%) | 60 (100.0%) |
| 25 to 34 Years | 0 (0.0%) | 33 (100.0%) |
| 35 to 44 Years | 13 (29.5%) | 31 (70.5%) |
| 45 to 54 Years | 4 (3.7%) | 105 (96.3%) |
| 55 to 64 Years | 5 (10.6%) | 42 (89.4%) |
| 65 to 74 Years | 18 (85.7%) | 17 (80.9%) |
| 75 Years and over | 15 (100.0%) | 15 (100.0%) |
| Total | 143 (27.7%) | 403 (77.9%) |
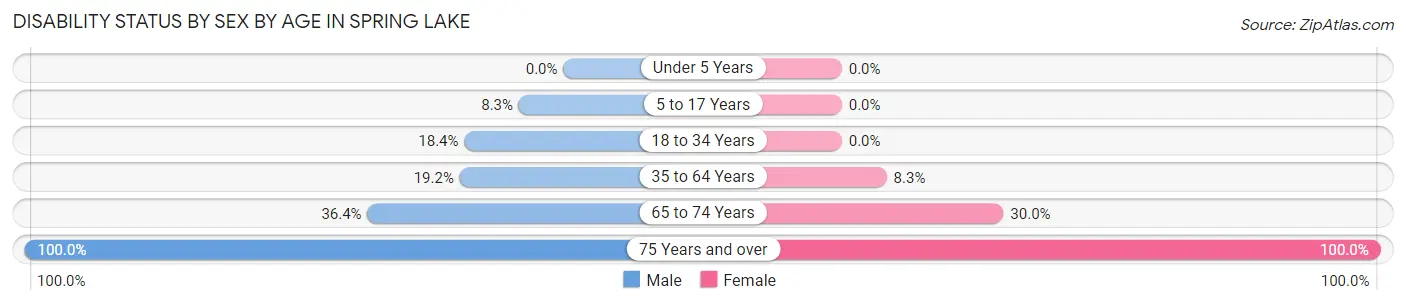
Disability Status by Sex by Age in Spring Lake
| Age Bracket | Male | Female |
| Under 5 Years | 0 (0.0%) | 0 (0.0%) |
| 5 to 17 Years | 9 (8.3%) | 0 (0.0%) |
| 18 to 34 Years | 9 (18.4%) | 0 (0.0%) |
| 35 to 64 Years | 20 (19.2%) | 8 (8.3%) |
| 65 to 74 Years | 4 (36.4%) | 3 (30.0%) |
| 75 Years and over | 2 (100.0%) | 13 (100.0%) |
Disability Class by Sex by Age in Spring Lake
Disability Class: Hearing Difficulty
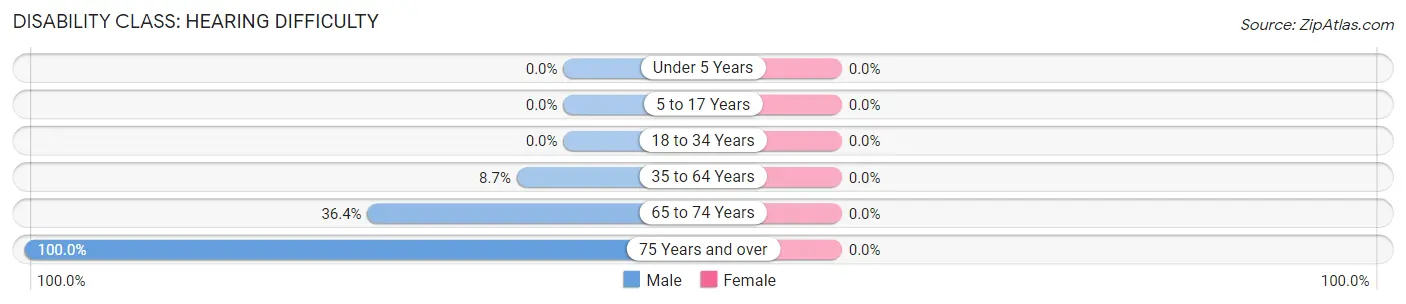
| Age Bracket | Male | Female |
| Under 5 Years | 0 (0.0%) | 0 (0.0%) |
| 5 to 17 Years | 0 (0.0%) | 0 (0.0%) |
| 18 to 34 Years | 0 (0.0%) | 0 (0.0%) |
| 35 to 64 Years | 9 (8.6%) | 0 (0.0%) |
| 65 to 74 Years | 4 (36.4%) | 0 (0.0%) |
| 75 Years and over | 2 (100.0%) | 0 (0.0%) |
Disability Class: Vision Difficulty
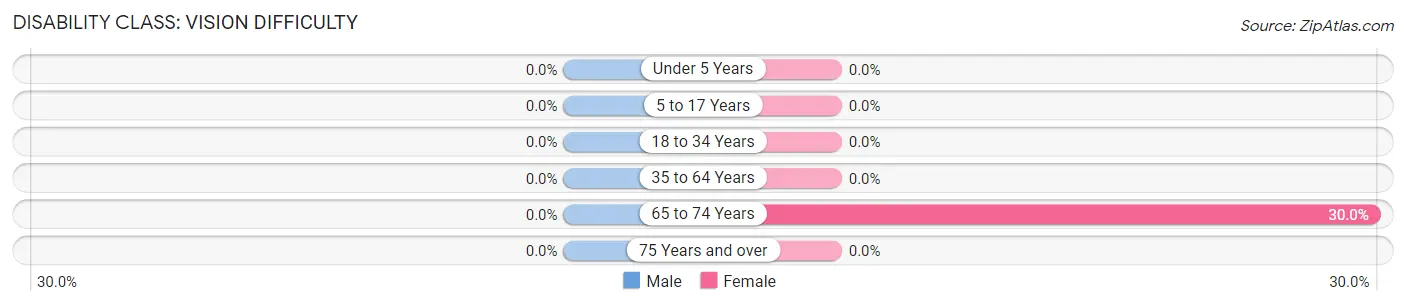
| Age Bracket | Male | Female |
| Under 5 Years | 0 (0.0%) | 0 (0.0%) |
| 5 to 17 Years | 0 (0.0%) | 0 (0.0%) |
| 18 to 34 Years | 0 (0.0%) | 0 (0.0%) |
| 35 to 64 Years | 0 (0.0%) | 0 (0.0%) |
| 65 to 74 Years | 0 (0.0%) | 3 (30.0%) |
| 75 Years and over | 0 (0.0%) | 0 (0.0%) |
Disability Class: Cognitive Difficulty
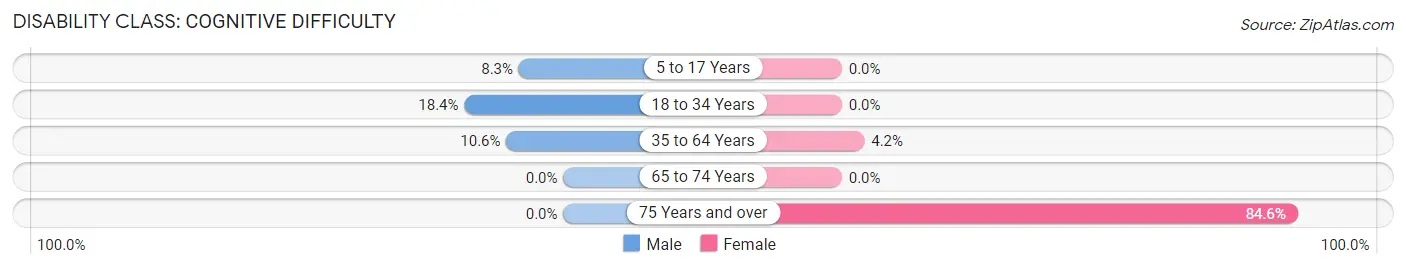
| Age Bracket | Male | Female |
| 5 to 17 Years | 9 (8.3%) | 0 (0.0%) |
| 18 to 34 Years | 9 (18.4%) | 0 (0.0%) |
| 35 to 64 Years | 11 (10.6%) | 4 (4.2%) |
| 65 to 74 Years | 0 (0.0%) | 0 (0.0%) |
| 75 Years and over | 0 (0.0%) | 11 (84.6%) |
Disability Class: Ambulatory Difficulty
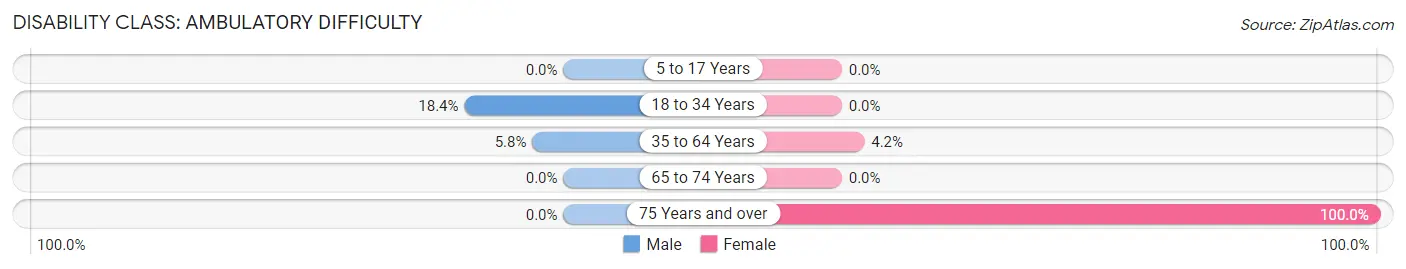
| Age Bracket | Male | Female |
| 5 to 17 Years | 0 (0.0%) | 0 (0.0%) |
| 18 to 34 Years | 9 (18.4%) | 0 (0.0%) |
| 35 to 64 Years | 6 (5.8%) | 4 (4.2%) |
| 65 to 74 Years | 0 (0.0%) | 0 (0.0%) |
| 75 Years and over | 0 (0.0%) | 13 (100.0%) |
Disability Class: Self-Care Difficulty
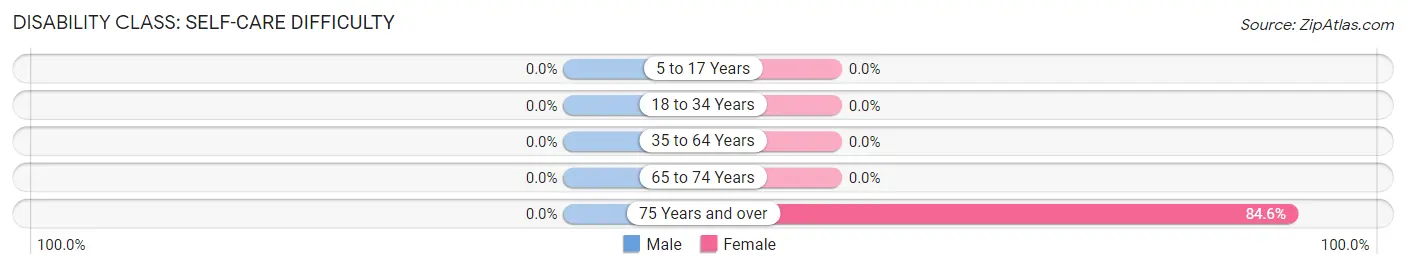
| Age Bracket | Male | Female |
| 5 to 17 Years | 0 (0.0%) | 0 (0.0%) |
| 18 to 34 Years | 0 (0.0%) | 0 (0.0%) |
| 35 to 64 Years | 0 (0.0%) | 0 (0.0%) |
| 65 to 74 Years | 0 (0.0%) | 0 (0.0%) |
| 75 Years and over | 0 (0.0%) | 11 (84.6%) |
Technology Access in Spring Lake
Computing Device Access in Spring Lake
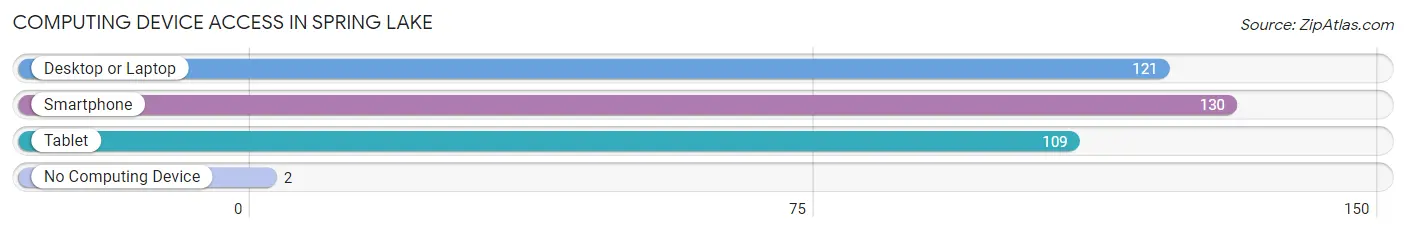
| Device Type | # Households | % Households |
| Desktop or Laptop | 121 | 91.7% |
| Smartphone | 130 | 98.5% |
| Tablet | 109 | 82.6% |
| No Computing Device | 2 | 1.5% |
| Total | 132 | 100.0% |
Internet Access in Spring Lake
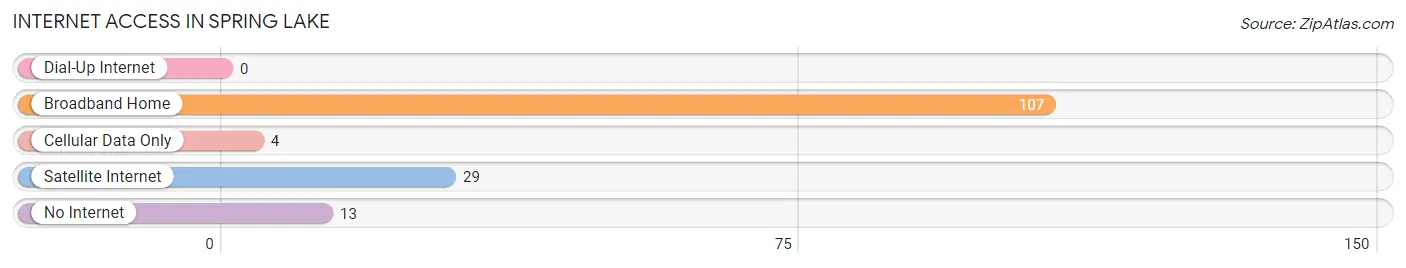
| Internet Type | # Households | % Households |
| Dial-Up Internet | 0 | 0.0% |
| Broadband Home | 107 | 81.1% |
| Cellular Data Only | 4 | 3.0% |
| Satellite Internet | 29 | 22.0% |
| No Internet | 13 | 9.9% |
| Total | 132 | 100.0% |
Spring Lake Summary
History
Spring Lake is a small unincorporated community located in Utah County, Utah. It is situated in the foothills of the Wasatch Mountains, approximately 10 miles south of Provo. The area was first settled in the late 1800s by Mormon pioneers, who named the area after the nearby freshwater lake. The lake was a popular destination for recreation and fishing, and the area was known for its abundant wildlife.
In the early 1900s, the area began to develop as a resort destination. The first hotel was built in 1910, and the area soon became a popular destination for fishing, camping, and other outdoor activities. The area was also known for its natural beauty, and it was a popular destination for photographers and artists.
In the 1950s, the area began to develop as a residential community. The population grew steadily over the next few decades, and by the 2000s, the area had become a popular bedroom community for commuters to Provo and Salt Lake City.
Geography
Spring Lake is located in Utah County, Utah, in the foothills of the Wasatch Mountains. The area is approximately 10 miles south of Provo and 40 miles south of Salt Lake City. The area is characterized by rolling hills, lush vegetation, and a variety of wildlife. The nearby lake is a popular destination for fishing, swimming, and other recreational activities.
The climate in Spring Lake is generally mild, with hot summers and cold winters. The average annual temperature is around 50 degrees Fahrenheit, and the average annual precipitation is around 18 inches.
Economy
The economy of Spring Lake is largely based on tourism and recreation. The area is a popular destination for fishing, camping, and other outdoor activities. The nearby lake is a popular destination for swimming, boating, and other water activities. The area is also known for its natural beauty, and it is a popular destination for photographers and artists.
In addition to tourism and recreation, the area is also home to a variety of small businesses. These include restaurants, retail stores, and other services. The area is also home to a number of small farms and ranches.
Demographics
As of the 2010 census, the population of Spring Lake was 1,845. The population is largely white (94.3%), with a small percentage of Hispanic (2.3%) and African American (1.2%) residents. The median household income is $50,000, and the median home value is $250,000. The area is largely rural, with most of the population living in single-family homes. The area is served by the Provo School District.
Common Questions
What is Per Capita Income in Spring Lake?
Per Capita income in Spring Lake is $32,063.
What is the Median Family Income in Spring Lake?
Median Family Income in Spring Lake is $155,833.
What is the Median Household income in Spring Lake?
Median Household Income in Spring Lake is $155,139.
What is Income or Wage Gap in Spring Lake?
Income or Wage Gap in Spring Lake is 18.2%.
Women in Spring Lake earn 81.8 cents for every dollar earned by a man.
What is Inequality or Gini Index in Spring Lake?
Inequality or Gini Index in Spring Lake is 0.29.
What is the Total Population of Spring Lake?
Total Population of Spring Lake is 517.
What is the Total Male Population of Spring Lake?
Total Male Population of Spring Lake is 306.
What is the Total Female Population of Spring Lake?
Total Female Population of Spring Lake is 211.
What is the Ratio of Males per 100 Females in Spring Lake?
There are 145.02 Males per 100 Females in Spring Lake.
What is the Ratio of Females per 100 Males in Spring Lake?
There are 68.95 Females per 100 Males in Spring Lake.
What is the Median Population Age in Spring Lake?
Median Population Age in Spring Lake is 28.8 Years.
What is the Average Family Size in Spring Lake
Average Family Size in Spring Lake is 4.2 People.
What is the Average Household Size in Spring Lake
Average Household Size in Spring Lake is 3.9 People.
How Large is the Labor Force in Spring Lake?
There are 247 People in the Labor Forcein in Spring Lake.
What is the Percentage of People in the Labor Force in Spring Lake?
72.6% of People are in the Labor Force in Spring Lake.