Elmo, UT Map & Demographics
Elmo Map
Elmo Overview
$25,713
PER CAPITA INCOME
$93,333
AVG FAMILY INCOME
$62,917
AVG HOUSEHOLD INCOME
0.39
INEQUALITY / GINI INDEX
487
TOTAL POPULATION
278
MALE POPULATION
209
FEMALE POPULATION
133.01
MALES / 100 FEMALES
75.18
FEMALES / 100 MALES
38.3
MEDIAN AGE
4.4
AVG FAMILY SIZE
3.2
AVG HOUSEHOLD SIZE
165
LABOR FORCE [ PEOPLE ]
47.3%
PERCENT IN LABOR FORCE
4.1%
UNEMPLOYMENT RATE
Elmo Zip Codes
Elmo Area Codes
Income in Elmo
Income Overview in Elmo
Per Capita Income in Elmo is $25,713, while median incomes of families and households are $93,333 and $62,917 respectively.
| Characteristic | Number | Measure |
| Per Capita Income | 487 | $25,713 |
| Median Family Income | 88 | $93,333 |
| Mean Family Income | 88 | $99,793 |
| Median Household Income | 149 | $62,917 |
| Mean Household Income | 149 | $73,846 |
| Income Deficit | 88 | $0 |
| Wage / Income Gap (%) | 487 | 0.00% |
| Wage / Income Gap ($) | 487 | 100.00¢ per $1 |
| Gini / Inequality Index | 487 | 0.39 |
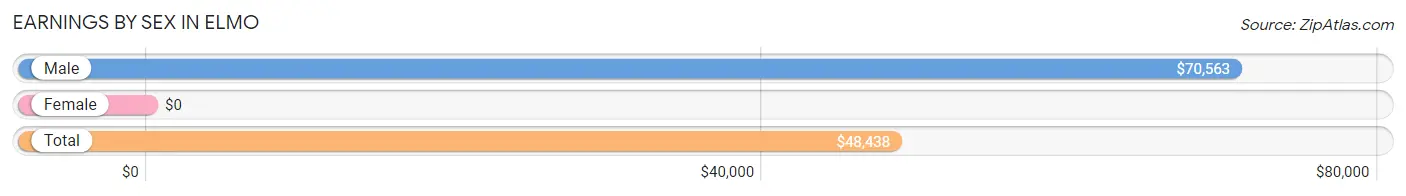
Earnings by Sex in Elmo
| Sex | Number | Average Earnings |
| Male | 115 (63.5%) | $70,563 |
| Female | 66 (36.5%) | $0 |
| Total | 181 (100.0%) | $48,438 |
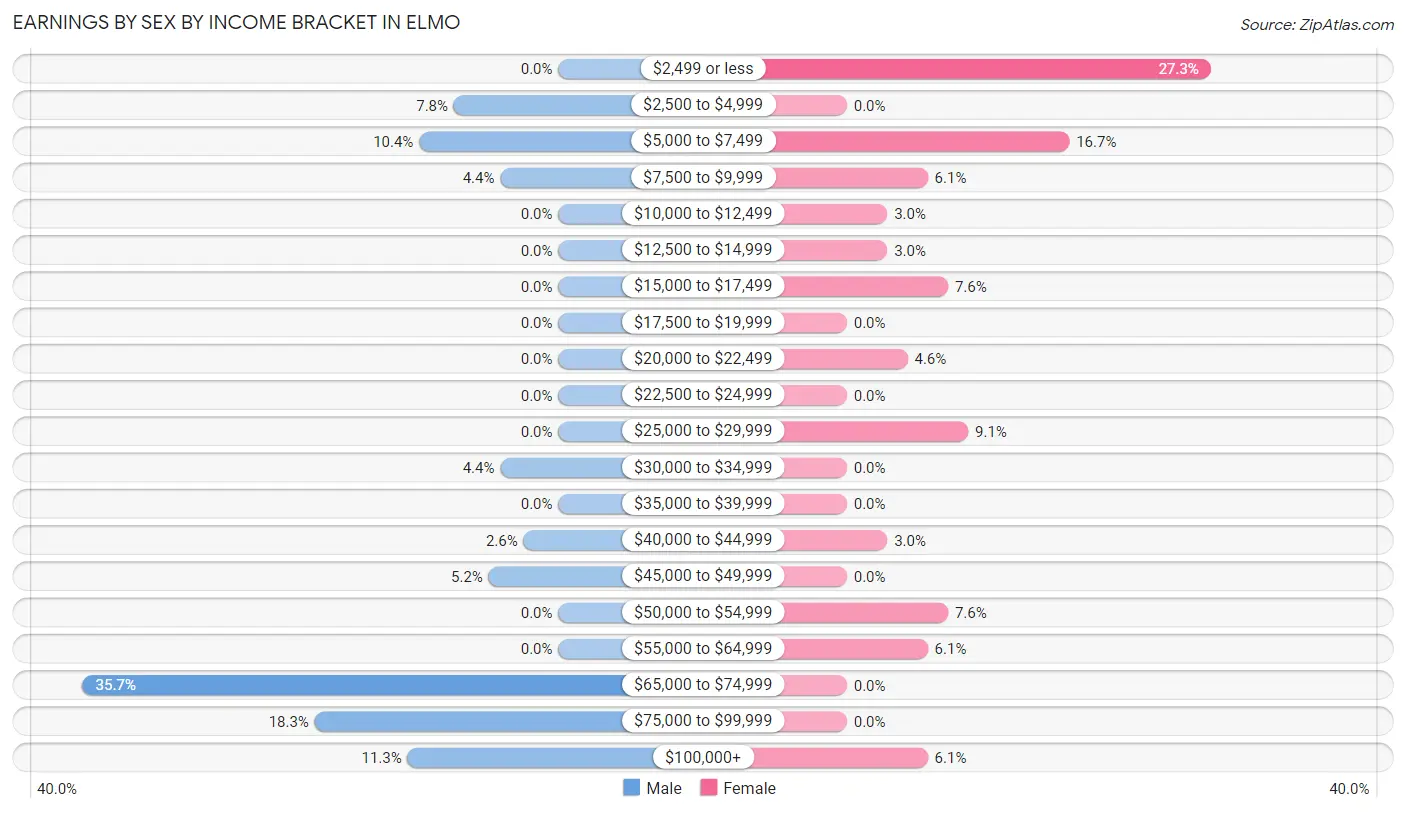
Earnings by Sex by Income Bracket in Elmo
The most common earnings brackets in Elmo are $65,000 to $74,999 for men (41 | 35.6%) and $2,499 or less for women (18 | 27.3%).
| Income | Male | Female |
| $2,499 or less | 0 (0.0%) | 18 (27.3%) |
| $2,500 to $4,999 | 9 (7.8%) | 0 (0.0%) |
| $5,000 to $7,499 | 12 (10.4%) | 11 (16.7%) |
| $7,500 to $9,999 | 5 (4.3%) | 4 (6.1%) |
| $10,000 to $12,499 | 0 (0.0%) | 2 (3.0%) |
| $12,500 to $14,999 | 0 (0.0%) | 2 (3.0%) |
| $15,000 to $17,499 | 0 (0.0%) | 5 (7.6%) |
| $17,500 to $19,999 | 0 (0.0%) | 0 (0.0%) |
| $20,000 to $22,499 | 0 (0.0%) | 3 (4.5%) |
| $22,500 to $24,999 | 0 (0.0%) | 0 (0.0%) |
| $25,000 to $29,999 | 0 (0.0%) | 6 (9.1%) |
| $30,000 to $34,999 | 5 (4.3%) | 0 (0.0%) |
| $35,000 to $39,999 | 0 (0.0%) | 0 (0.0%) |
| $40,000 to $44,999 | 3 (2.6%) | 2 (3.0%) |
| $45,000 to $49,999 | 6 (5.2%) | 0 (0.0%) |
| $50,000 to $54,999 | 0 (0.0%) | 5 (7.6%) |
| $55,000 to $64,999 | 0 (0.0%) | 4 (6.1%) |
| $65,000 to $74,999 | 41 (35.6%) | 0 (0.0%) |
| $75,000 to $99,999 | 21 (18.3%) | 0 (0.0%) |
| $100,000+ | 13 (11.3%) | 4 (6.1%) |
| Total | 115 (100.0%) | 66 (100.0%) |
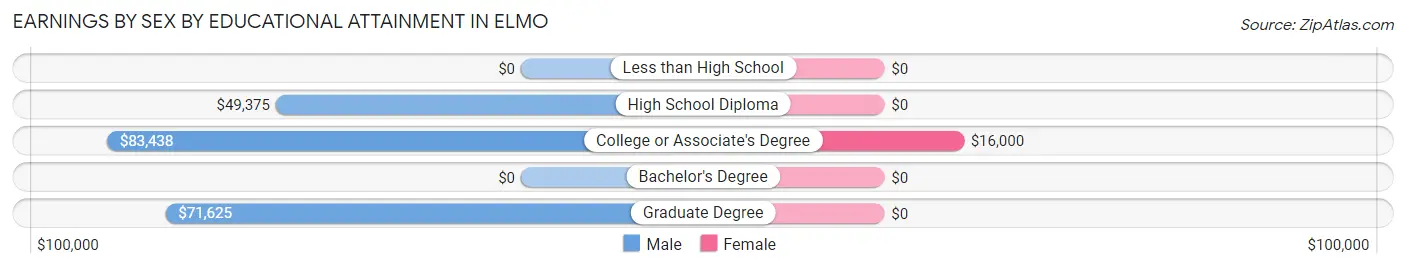
Earnings by Sex by Educational Attainment in Elmo
Average earnings in Elmo are $71,938 for men and $15,500 for women, a difference of 78.4%. Men with an educational attainment of college or associate's degree enjoy the highest average annual earnings of $83,438, while those with high school diploma education earn the least with $49,375. Women with an educational attainment of college or associate's degree earn the most with the average annual earnings of $16,000, while those with college or associate's degree education have the smallest earnings of $16,000.
| Educational Attainment | Male Income | Female Income |
| Less than High School | - | - |
| High School Diploma | $49,375 | $0 |
| College or Associate's Degree | $83,438 | $16,000 |
| Bachelor's Degree | - | - |
| Graduate Degree | $71,625 | $0 |
| Total | $71,938 | $15,500 |
Family Income in Elmo
Family Income Brackets in Elmo
According to the Elmo family income data, there are 27 families falling into the $100,000 to $149,999 income range, which is the most common income bracket and makes up 30.7% of all families.
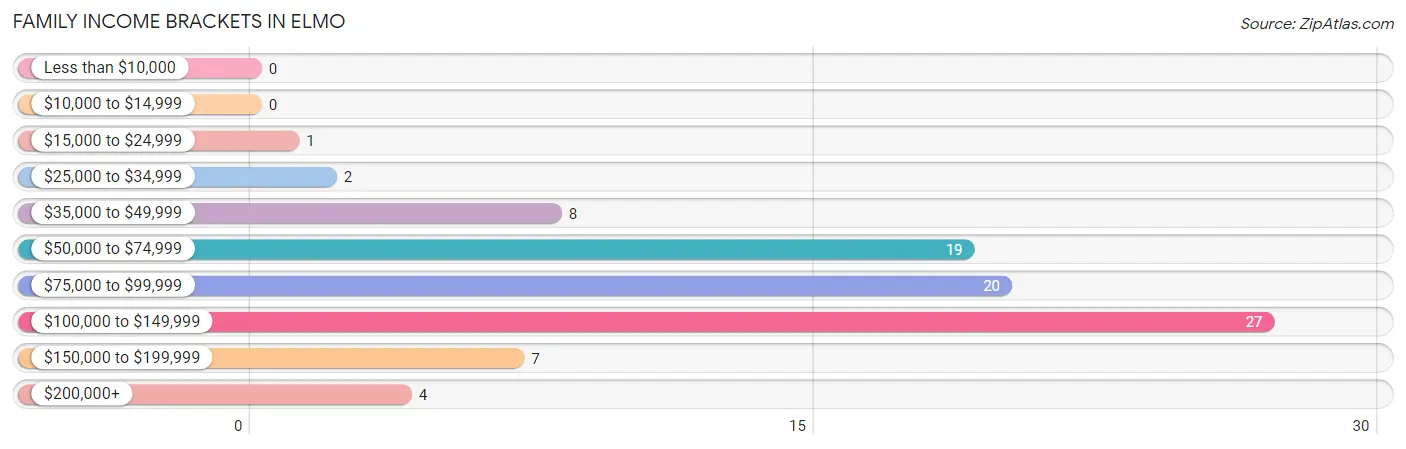
| Income Bracket | # Families | % Families |
| Less than $10,000 | 0 | 0.0% |
| $10,000 to $14,999 | 0 | 0.0% |
| $15,000 to $24,999 | 1 | 1.1% |
| $25,000 to $34,999 | 2 | 2.3% |
| $35,000 to $49,999 | 8 | 9.1% |
| $50,000 to $74,999 | 19 | 21.6% |
| $75,000 to $99,999 | 20 | 22.7% |
| $100,000 to $149,999 | 27 | 30.7% |
| $150,000 to $199,999 | 7 | 8.0% |
| $200,000+ | 4 | 4.5% |
Family Income by Famaliy Size in Elmo
5-person families (15 | 17.1%) account for the highest median family income in Elmo with $160,313 per family, while 5-person families (15 | 17.1%) have the highest median income of $32,063 per family member.
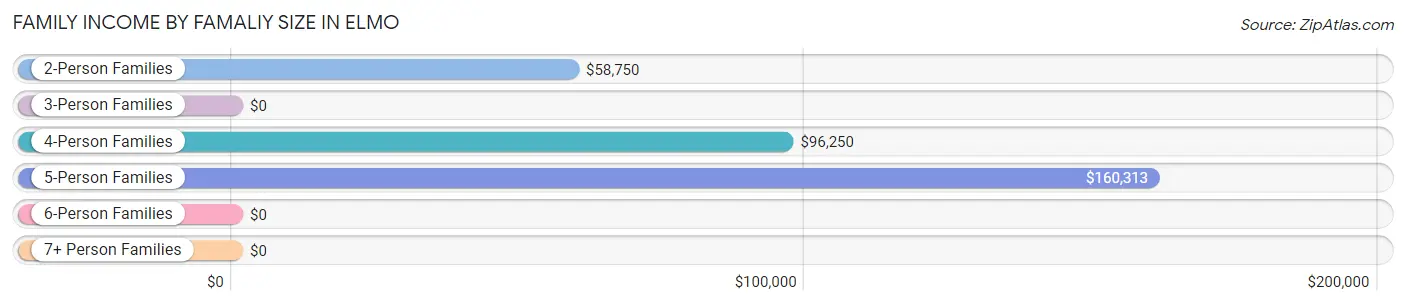
| Income Bracket | # Families | Median Income |
| 2-Person Families | 32 (36.4%) | $58,750 |
| 3-Person Families | 9 (10.2%) | $0 |
| 4-Person Families | 18 (20.4%) | $96,250 |
| 5-Person Families | 15 (17.1%) | $160,313 |
| 6-Person Families | 6 (6.8%) | $0 |
| 7+ Person Families | 8 (9.1%) | $0 |
| Total | 88 (100.0%) | $93,333 |
Family Income by Number of Earners in Elmo
The median family income in Elmo is $93,333, with families comprising 3+ earners (18) having the highest median family income of $144,107, while families with no earners (15) have the lowest median family income of $39,375, accounting for 20.4% and 17.1% of families, respectively.
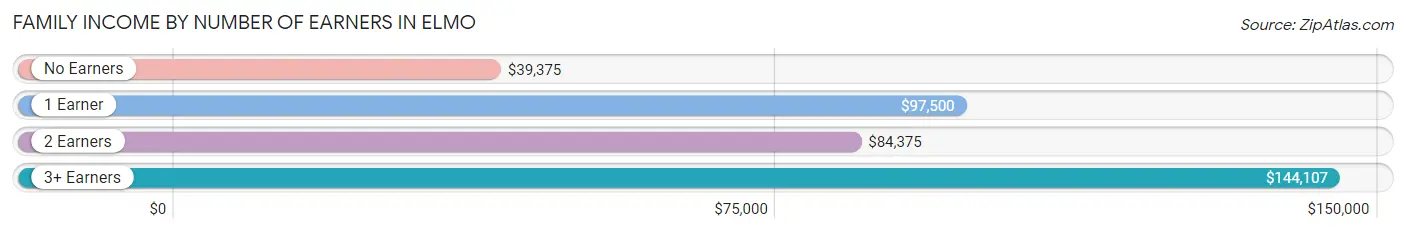
| Number of Earners | # Families | Median Income |
| No Earners | 15 (17.1%) | $39,375 |
| 1 Earner | 18 (20.4%) | $97,500 |
| 2 Earners | 37 (42.0%) | $84,375 |
| 3+ Earners | 18 (20.4%) | $144,107 |
| Total | 88 (100.0%) | $93,333 |
Household Income in Elmo
Household Income Brackets in Elmo
With 34 households falling in the category, the $100,000 to $149,999 income range is the most frequent in Elmo, accounting for 22.8% of all households.
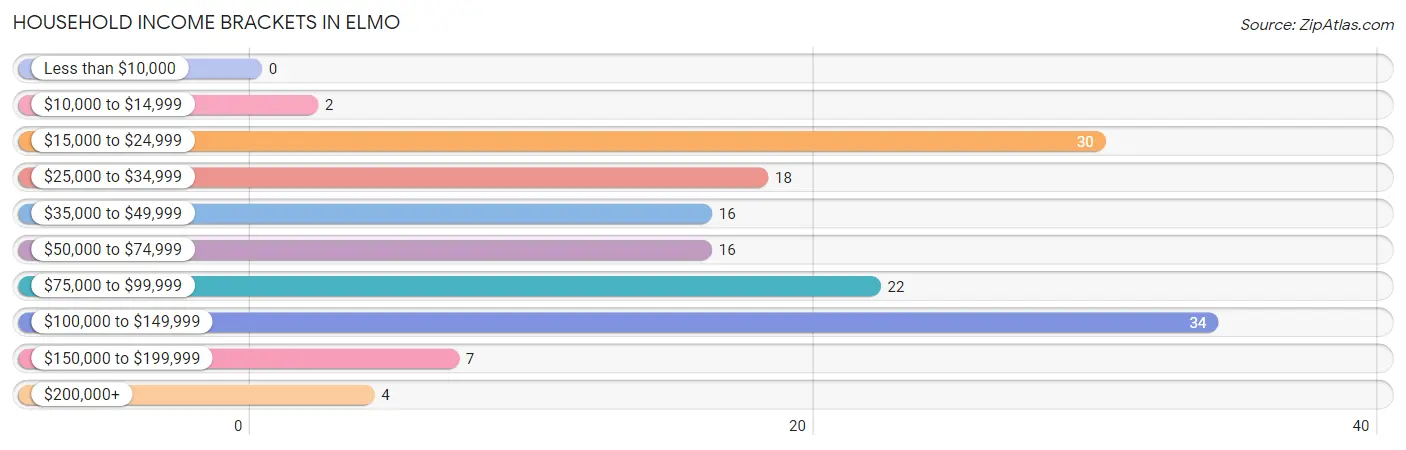
| Income Bracket | # Households | % Households |
| Less than $10,000 | 0 | 0.0% |
| $10,000 to $14,999 | 2 | 1.3% |
| $15,000 to $24,999 | 30 | 20.1% |
| $25,000 to $34,999 | 18 | 12.1% |
| $35,000 to $49,999 | 16 | 10.7% |
| $50,000 to $74,999 | 16 | 10.7% |
| $75,000 to $99,999 | 22 | 14.8% |
| $100,000 to $149,999 | 34 | 22.8% |
| $150,000 to $199,999 | 7 | 4.7% |
| $200,000+ | 4 | 2.7% |
Household Income by Householder Age in Elmo
The median household income in Elmo is $62,917, with the highest median household income of $102,500 found in the 25 to 44 years age bracket for the primary householder. A total of 42 households (28.2%) fall into this category.
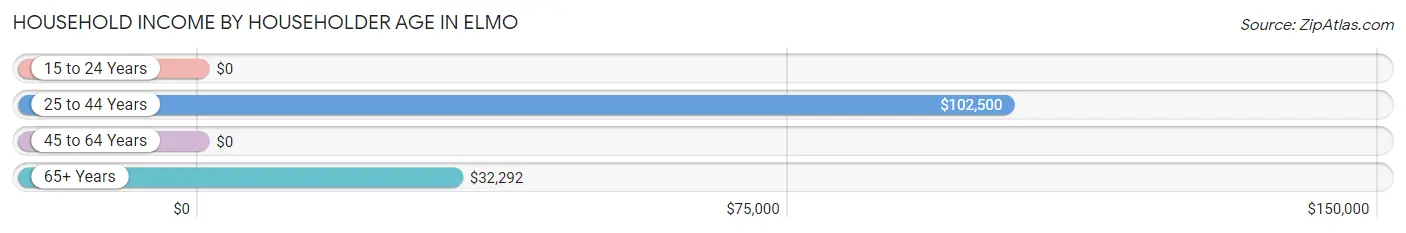
| Income Bracket | # Households | Median Income |
| 15 to 24 Years | 0 (0.0%) | $0 |
| 25 to 44 Years | 42 (28.2%) | $102,500 |
| 45 to 64 Years | 62 (41.6%) | $0 |
| 65+ Years | 45 (30.2%) | $32,292 |
| Total | 149 (100.0%) | $62,917 |
Poverty in Elmo
Income Below Poverty by Sex and Age in Elmo
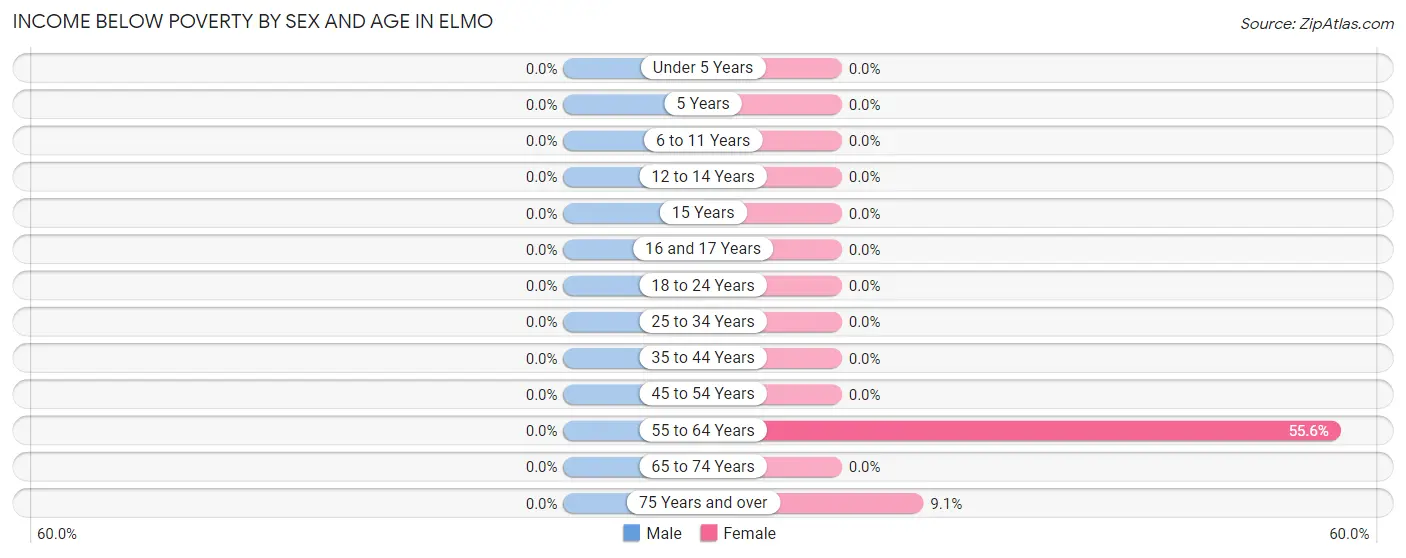
| Age Bracket | Male | Female |
| Under 5 Years | 0 (0.0%) | 0 (0.0%) |
| 5 Years | 0 (0.0%) | 0 (0.0%) |
| 6 to 11 Years | 0 (0.0%) | 0 (0.0%) |
| 12 to 14 Years | 0 (0.0%) | 0 (0.0%) |
| 15 Years | 0 (0.0%) | 0 (0.0%) |
| 16 and 17 Years | 0 (0.0%) | 0 (0.0%) |
| 18 to 24 Years | 0 (0.0%) | 0 (0.0%) |
| 25 to 34 Years | 0 (0.0%) | 0 (0.0%) |
| 35 to 44 Years | 0 (0.0%) | 0 (0.0%) |
| 45 to 54 Years | 0 (0.0%) | 0 (0.0%) |
| 55 to 64 Years | 0 (0.0%) | 15 (55.6%) |
| 65 to 74 Years | 0 (0.0%) | 0 (0.0%) |
| 75 Years and over | 0 (0.0%) | 2 (9.1%) |
| Total | 0 (0.0%) | 17 (8.8%) |
Income Above Poverty by Sex and Age in Elmo
According to the poverty statistics in Elmo, males aged under 5 years and females aged under 5 years are the age groups that are most secure financially, with 100.0% of males and 100.0% of females in these age groups living above the poverty line.
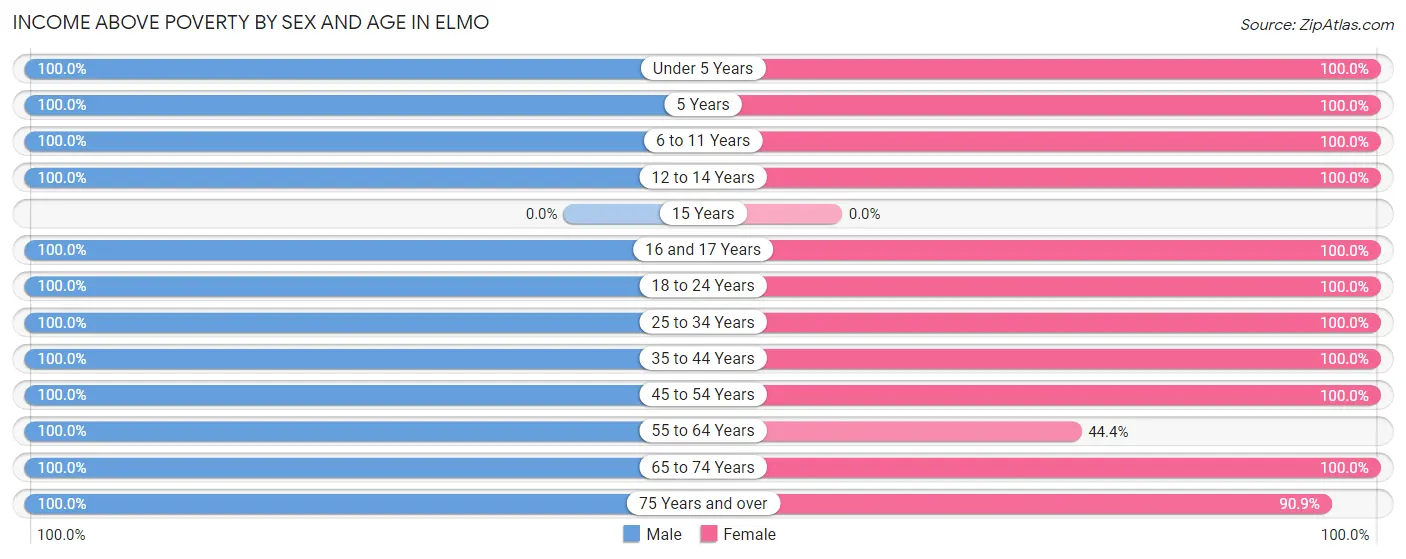
| Age Bracket | Male | Female |
| Under 5 Years | 11 (100.0%) | 8 (100.0%) |
| 5 Years | 2 (100.0%) | 3 (100.0%) |
| 6 to 11 Years | 53 (100.0%) | 34 (100.0%) |
| 12 to 14 Years | 26 (100.0%) | 1 (100.0%) |
| 15 Years | 0 (0.0%) | 0 (0.0%) |
| 16 and 17 Years | 34 (100.0%) | 2 (100.0%) |
| 18 to 24 Years | 11 (100.0%) | 13 (100.0%) |
| 25 to 34 Years | 17 (100.0%) | 17 (100.0%) |
| 35 to 44 Years | 22 (100.0%) | 27 (100.0%) |
| 45 to 54 Years | 39 (100.0%) | 19 (100.0%) |
| 55 to 64 Years | 30 (100.0%) | 12 (44.4%) |
| 65 to 74 Years | 22 (100.0%) | 21 (100.0%) |
| 75 Years and over | 11 (100.0%) | 20 (90.9%) |
| Total | 278 (100.0%) | 177 (91.2%) |
Income Below Poverty Among Married-Couple Families in Elmo
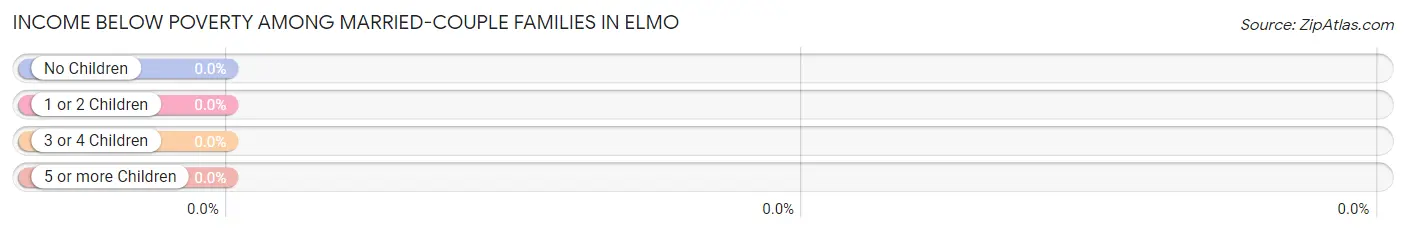
| Children | Above Poverty | Below Poverty |
| No Children | 33 (100.0%) | 0 (0.0%) |
| 1 or 2 Children | 20 (100.0%) | 0 (0.0%) |
| 3 or 4 Children | 23 (100.0%) | 0 (0.0%) |
| 5 or more Children | 0 (0.0%) | 0 (0.0%) |
| Total | 76 (100.0%) | 0 (0.0%) |
Income Below Poverty Among Single-Parent Households in Elmo
| Children | Single Father | Single Mother |
| No Children | 0 (0.0%) | 0 (0.0%) |
| 1 or 2 Children | 0 (0.0%) | 0 (0.0%) |
| 3 or 4 Children | 0 (0.0%) | 0 (0.0%) |
| 5 or more Children | 0 (0.0%) | 0 (0.0%) |
| Total | 0 (0.0%) | 0 (0.0%) |
Income Below Poverty Among Married-Couple vs Single-Parent Households in Elmo
| Children | Married-Couple Families | Single-Parent Households |
| No Children | 0 (0.0%) | 0 (0.0%) |
| 1 or 2 Children | 0 (0.0%) | 0 (0.0%) |
| 3 or 4 Children | 0 (0.0%) | 0 (0.0%) |
| 5 or more Children | 0 (0.0%) | 0 (0.0%) |
| Total | 0 (0.0%) | 0 (0.0%) |
Race in Elmo
The most populous races in Elmo are White / Caucasian (391 | 80.3%), Hawaiian / Pacific (96 | 19.7%), and Hispanic or Latino (17 | 3.5%).
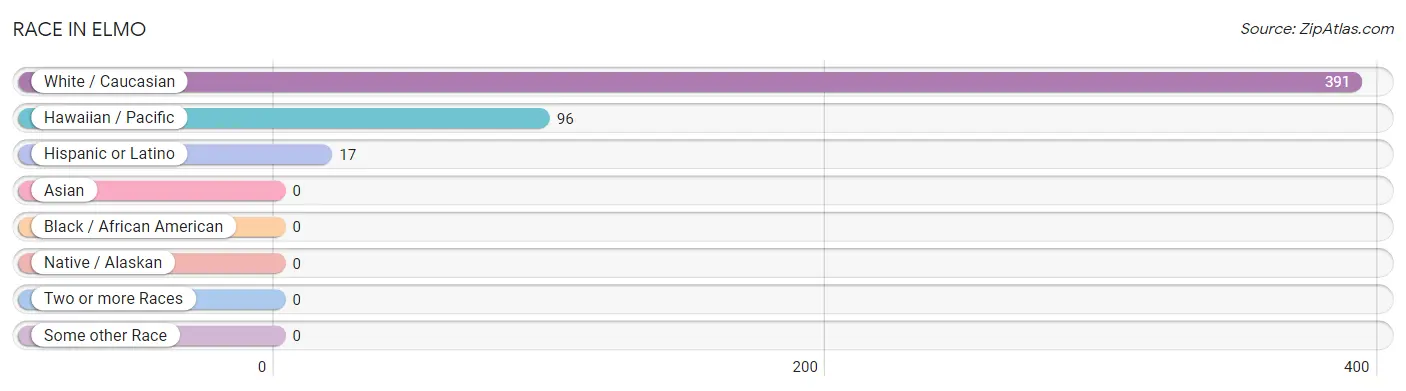
| Race | # Population | % Population |
| Asian | 0 | 0.0% |
| Black / African American | 0 | 0.0% |
| Hawaiian / Pacific | 96 | 19.7% |
| Hispanic or Latino | 17 | 3.5% |
| Native / Alaskan | 0 | 0.0% |
| White / Caucasian | 391 | 80.3% |
| Two or more Races | 0 | 0.0% |
| Some other Race | 0 | 0.0% |
| Total | 487 | 100.0% |
Ancestry in Elmo
The most populous ancestries reported in Elmo are Native Hawaiian (96 | 19.7%), Danish (88 | 18.1%), English (74 | 15.2%), European (49 | 10.1%), and Scottish (19 | 3.9%), together accounting for 66.9% of all Elmo residents.
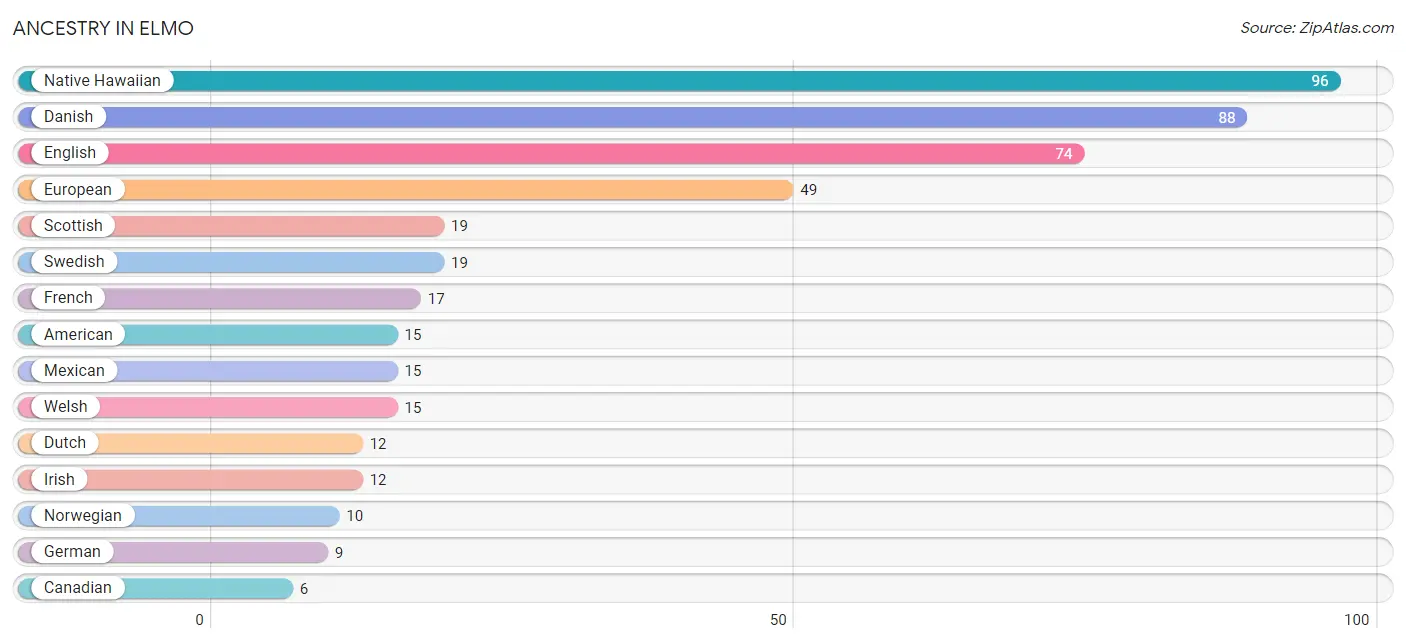
| Ancestry | # Population | % Population |
| American | 15 | 3.1% |
| Canadian | 6 | 1.2% |
| Danish | 88 | 18.1% |
| Dutch | 12 | 2.5% |
| English | 74 | 15.2% |
| European | 49 | 10.1% |
| French | 17 | 3.5% |
| German | 9 | 1.8% |
| Irish | 12 | 2.5% |
| Mexican | 15 | 3.1% |
| Native Hawaiian | 96 | 19.7% |
| Norwegian | 10 | 2.1% |
| Scandinavian | 2 | 0.4% |
| Scottish | 19 | 3.9% |
| Spaniard | 2 | 0.4% |
| Swedish | 19 | 3.9% |
| Welsh | 15 | 3.1% | View All 17 Rows |
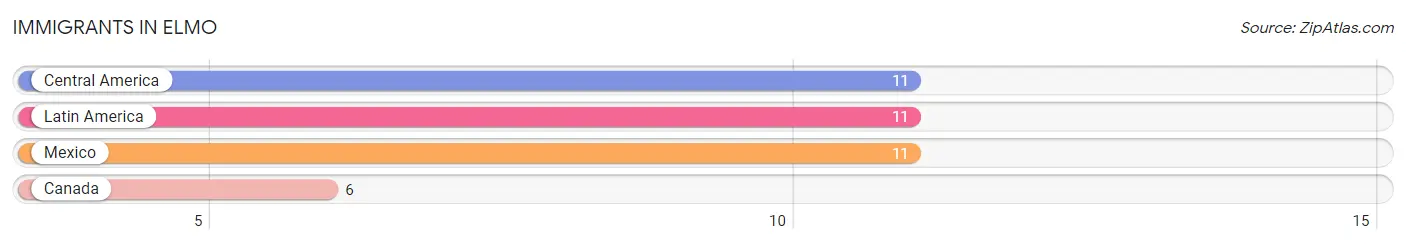
Immigrants in Elmo
The most numerous immigrant groups reported in Elmo came from Central America (11 | 2.3%), Latin America (11 | 2.3%), Mexico (11 | 2.3%), and Canada (6 | 1.2%), together accounting for 8.0% of all Elmo residents.
| Immigration Origin | # Population | % Population |
| Canada | 6 | 1.2% |
| Central America | 11 | 2.3% |
| Latin America | 11 | 2.3% |
| Mexico | 11 | 2.3% | View All 4 Rows |
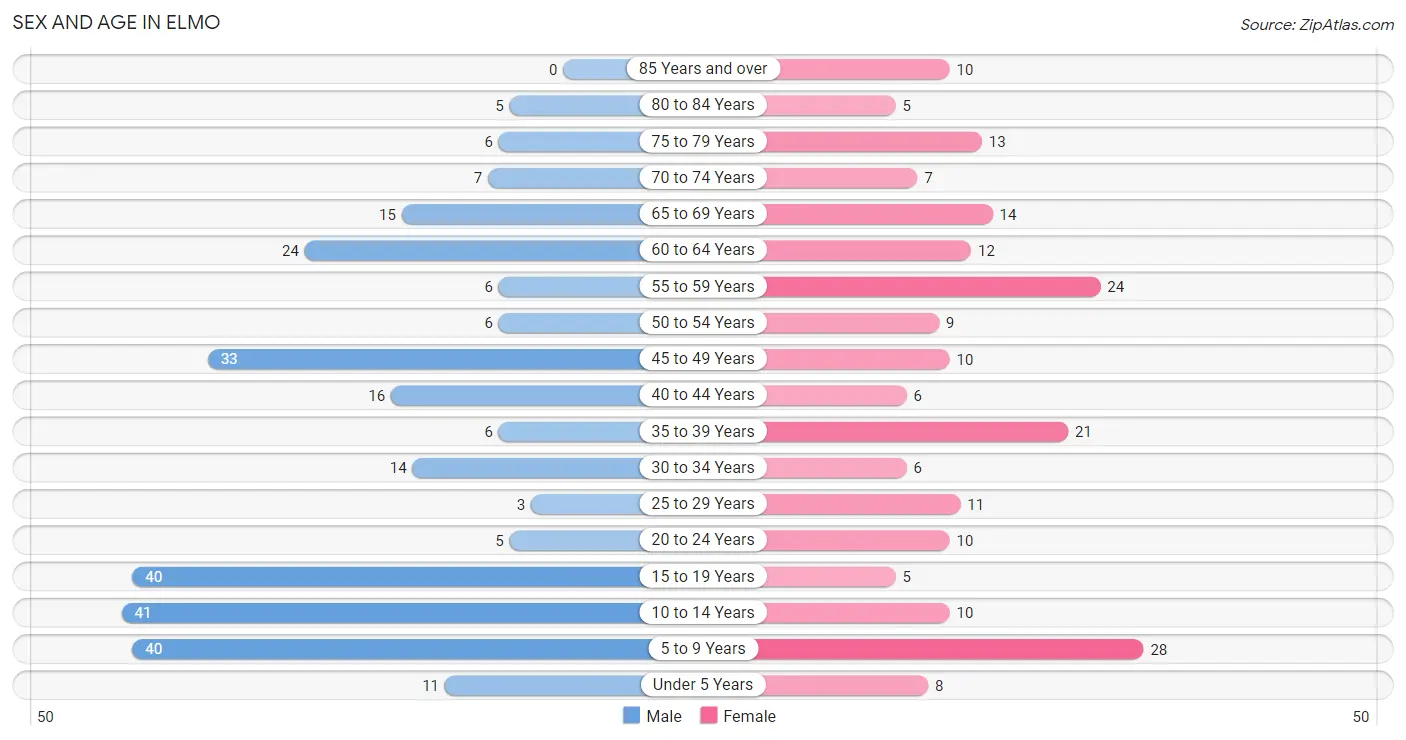
Sex and Age in Elmo
Sex and Age in Elmo
The most populous age groups in Elmo are 10 to 14 Years (41 | 14.7%) for men and 5 to 9 Years (28 | 13.4%) for women.
| Age Bracket | Male | Female |
| Under 5 Years | 11 (4.0%) | 8 (3.8%) |
| 5 to 9 Years | 40 (14.4%) | 28 (13.4%) |
| 10 to 14 Years | 41 (14.7%) | 10 (4.8%) |
| 15 to 19 Years | 40 (14.4%) | 5 (2.4%) |
| 20 to 24 Years | 5 (1.8%) | 10 (4.8%) |
| 25 to 29 Years | 3 (1.1%) | 11 (5.3%) |
| 30 to 34 Years | 14 (5.0%) | 6 (2.9%) |
| 35 to 39 Years | 6 (2.2%) | 21 (10.1%) |
| 40 to 44 Years | 16 (5.8%) | 6 (2.9%) |
| 45 to 49 Years | 33 (11.9%) | 10 (4.8%) |
| 50 to 54 Years | 6 (2.2%) | 9 (4.3%) |
| 55 to 59 Years | 6 (2.2%) | 24 (11.5%) |
| 60 to 64 Years | 24 (8.6%) | 12 (5.7%) |
| 65 to 69 Years | 15 (5.4%) | 14 (6.7%) |
| 70 to 74 Years | 7 (2.5%) | 7 (3.4%) |
| 75 to 79 Years | 6 (2.2%) | 13 (6.2%) |
| 80 to 84 Years | 5 (1.8%) | 5 (2.4%) |
| 85 Years and over | 0 (0.0%) | 10 (4.8%) |
| Total | 278 (100.0%) | 209 (100.0%) |
Families and Households in Elmo
Median Family Size in Elmo
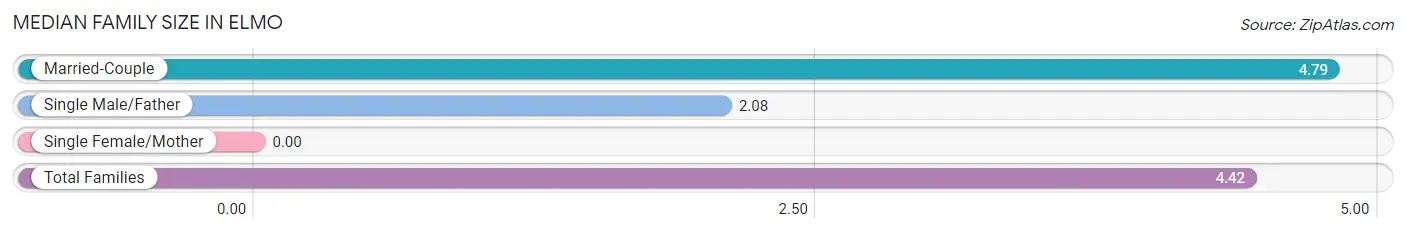
| Family Type | # Families | Family Size |
| Married-Couple | 76 (86.4%) | 4.79 |
| Single Male/Father | 12 (13.6%) | 2.08 |
| Single Female/Mother | 0 (0.0%) | - |
| Total Families | 88 (100.0%) | 4.42 |
Median Household Size in Elmo
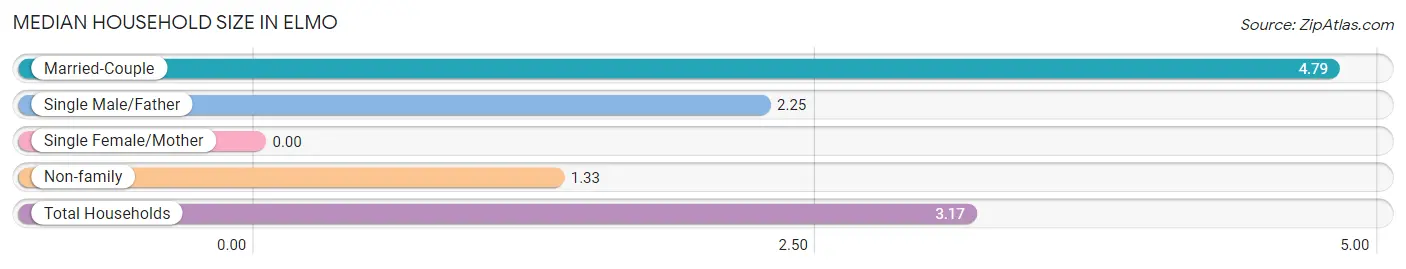
| Household Type | # Households | Household Size |
| Married-Couple | 76 (51.0%) | 4.79 |
| Single Male/Father | 12 (8.1%) | 2.25 |
| Single Female/Mother | 0 (0.0%) | - |
| Non-family | 61 (40.9%) | 1.33 |
| Total Households | 149 (100.0%) | 3.17 |
Household Size by Marriage Status in Elmo
Out of a total of 149 households in Elmo, 88 (59.1%) are family households, while 61 (40.9%) are nonfamily households. The most numerous type of family households are 2-person households, comprising 29, and the most common type of nonfamily households are 1-person households, comprising 46.
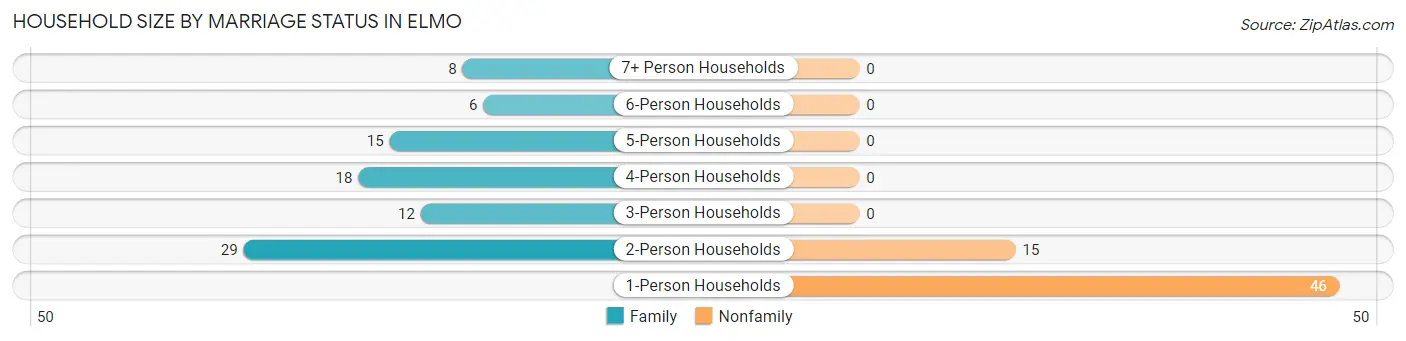
| Household Size | Family Households | Nonfamily Households |
| 1-Person Households | - | 46 (30.9%) |
| 2-Person Households | 29 (19.5%) | 15 (10.1%) |
| 3-Person Households | 12 (8.1%) | 0 (0.0%) |
| 4-Person Households | 18 (12.1%) | 0 (0.0%) |
| 5-Person Households | 15 (10.1%) | 0 (0.0%) |
| 6-Person Households | 6 (4.0%) | 0 (0.0%) |
| 7+ Person Households | 8 (5.4%) | 0 (0.0%) |
| Total | 88 (59.1%) | 61 (40.9%) |
Female Fertility in Elmo
Fertility by Age in Elmo
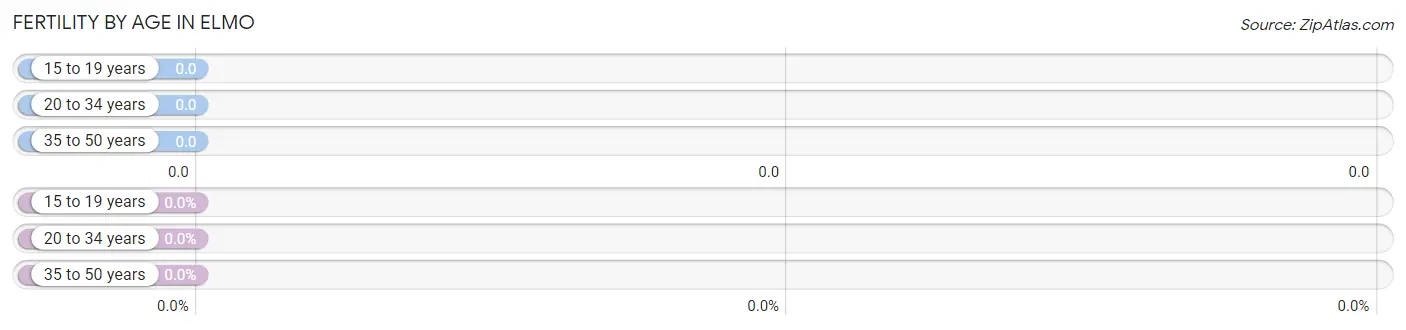
| Age Bracket | Women with Births | Births / 1,000 Women |
| 15 to 19 years | 0 (0.0%) | 0.0 |
| 20 to 34 years | 0 (0.0%) | 0.0 |
| 35 to 50 years | 0 (0.0%) | 0.0 |
| Total | 0 (0.0%) | 0.0 |
Fertility by Age by Marriage Status in Elmo
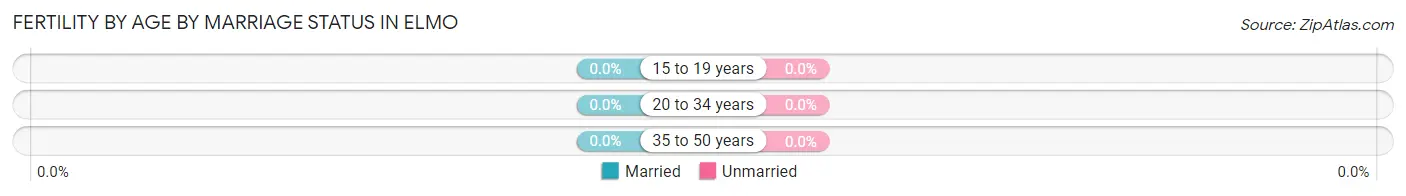
| Age Bracket | Married | Unmarried |
| 15 to 19 years | 0 (0.0%) | 0 (0.0%) |
| 20 to 34 years | 0 (0.0%) | 0 (0.0%) |
| 35 to 50 years | 0 (0.0%) | 0 (0.0%) |
| Total | 0 (0.0%) | 0 (0.0%) |
Fertility by Education in Elmo
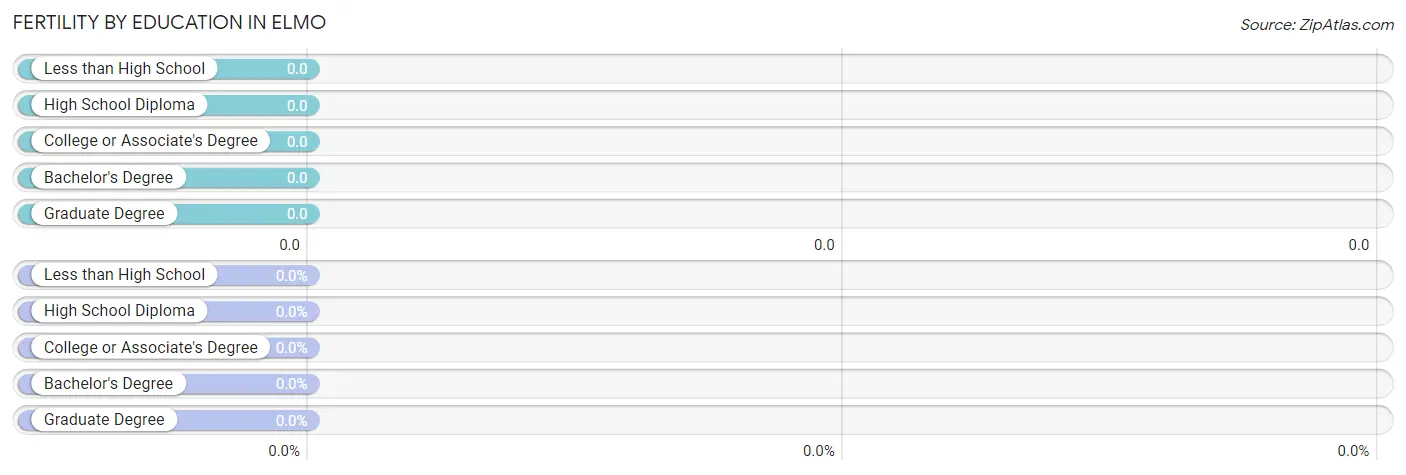
| Educational Attainment | Women with Births | Births / 1,000 Women |
| Less than High School | 0 (0.0%) | 0.0 |
| High School Diploma | 0 (0.0%) | 0.0 |
| College or Associate's Degree | 0 (0.0%) | 0.0 |
| Bachelor's Degree | 0 (0.0%) | 0.0 |
| Graduate Degree | 0 (0.0%) | 0.0 |
| Total | 0 (0.0%) | 0.0 |
Fertility by Education by Marriage Status in Elmo
| Educational Attainment | Married | Unmarried |
| Less than High School | 0 (0.0%) | 0 (0.0%) |
| High School Diploma | 0 (0.0%) | 0 (0.0%) |
| College or Associate's Degree | 0 (0.0%) | 0 (0.0%) |
| Bachelor's Degree | 0 (0.0%) | 0 (0.0%) |
| Graduate Degree | 0 (0.0%) | 0 (0.0%) |
| Total | 0 (0.0%) | 0 (0.0%) |
Employment Characteristics in Elmo
Employment by Class of Employer in Elmo
Among the 159 employed individuals in Elmo, private company employees (103 | 64.8%), federal government employees (20 | 12.6%), and state government employees (17 | 10.7%) make up the most common classes of employment.
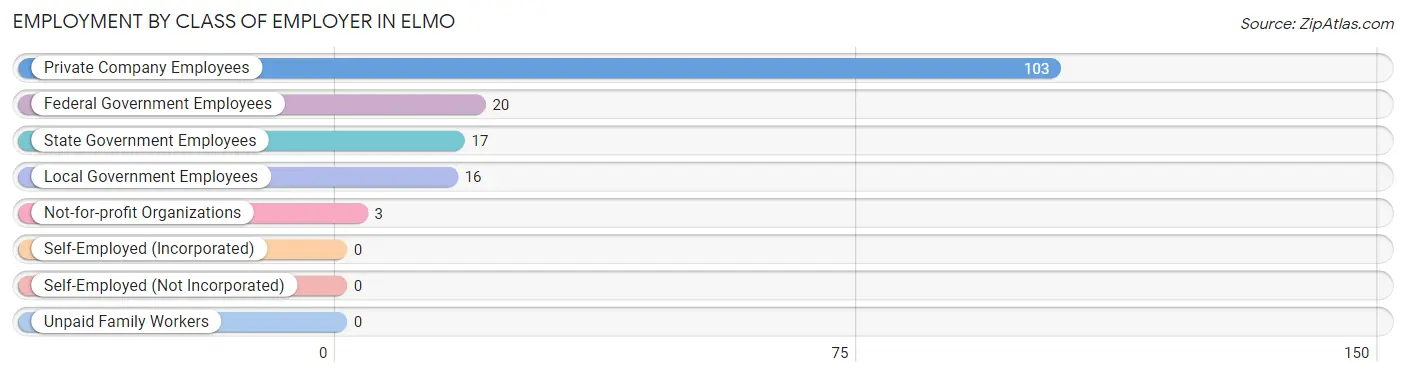
| Employer Class | # Employees | % Employees |
| Private Company Employees | 103 | 64.8% |
| Self-Employed (Incorporated) | 0 | 0.0% |
| Self-Employed (Not Incorporated) | 0 | 0.0% |
| Not-for-profit Organizations | 3 | 1.9% |
| Local Government Employees | 16 | 10.1% |
| State Government Employees | 17 | 10.7% |
| Federal Government Employees | 20 | 12.6% |
| Unpaid Family Workers | 0 | 0.0% |
| Total | 159 | 100.0% |
Employment Status by Age in Elmo
According to the labor force statistics for Elmo, out of the total population over 16 years of age (349), 47.3% or 165 individuals are in the labor force, with 4.1% or 7 of them unemployed. The age group with the highest labor force participation rate is 20 to 24 years, with 100.0% or 15 individuals in the labor force. Within the labor force, the 16 to 19 years age range has the highest percentage of unemployed individuals, with 21.4% or 3 of them being unemployed.
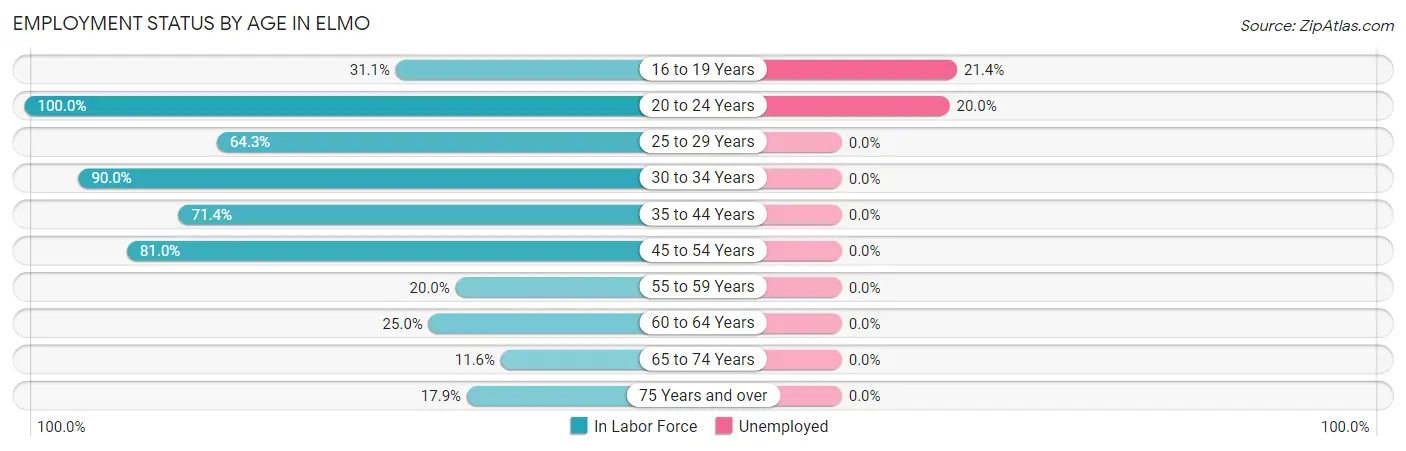
| Age Bracket | In Labor Force | Unemployed |
| 16 to 19 Years | 14 (31.1%) | 3 (21.4%) |
| 20 to 24 Years | 15 (100.0%) | 3 (20.0%) |
| 25 to 29 Years | 9 (64.3%) | 0 (0.0%) |
| 30 to 34 Years | 18 (90.0%) | 0 (0.0%) |
| 35 to 44 Years | 35 (71.4%) | 0 (0.0%) |
| 45 to 54 Years | 47 (81.0%) | 0 (0.0%) |
| 55 to 59 Years | 6 (20.0%) | 0 (0.0%) |
| 60 to 64 Years | 9 (25.0%) | 0 (0.0%) |
| 65 to 74 Years | 5 (11.6%) | 0 (0.0%) |
| 75 Years and over | 7 (17.9%) | 0 (0.0%) |
| Total | 165 (47.3%) | 7 (4.1%) |
Employment Status by Educational Attainment in Elmo
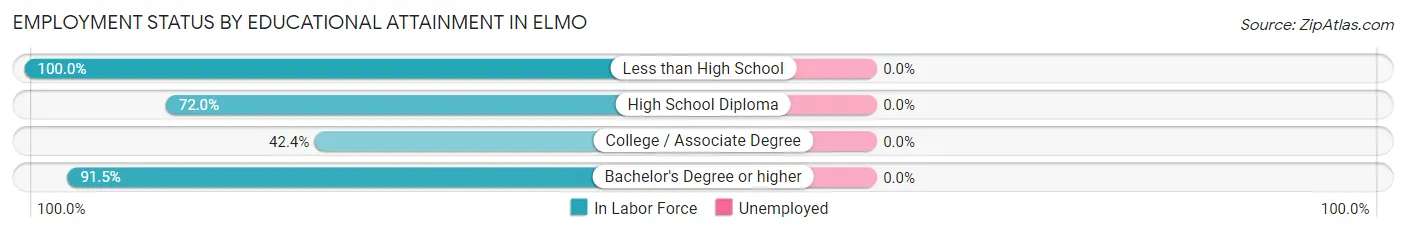
| Educational Attainment | In Labor Force | Unemployed |
| Less than High School | 10 (100.0%) | 0 (0.0%) |
| High School Diploma | 18 (72.0%) | 0 (0.0%) |
| College / Associate Degree | 53 (42.4%) | 0 (0.0%) |
| Bachelor's Degree or higher | 43 (91.5%) | 0 (0.0%) |
| Total | 124 (59.9%) | 0 (0.0%) |
Employment Occupations by Sex in Elmo
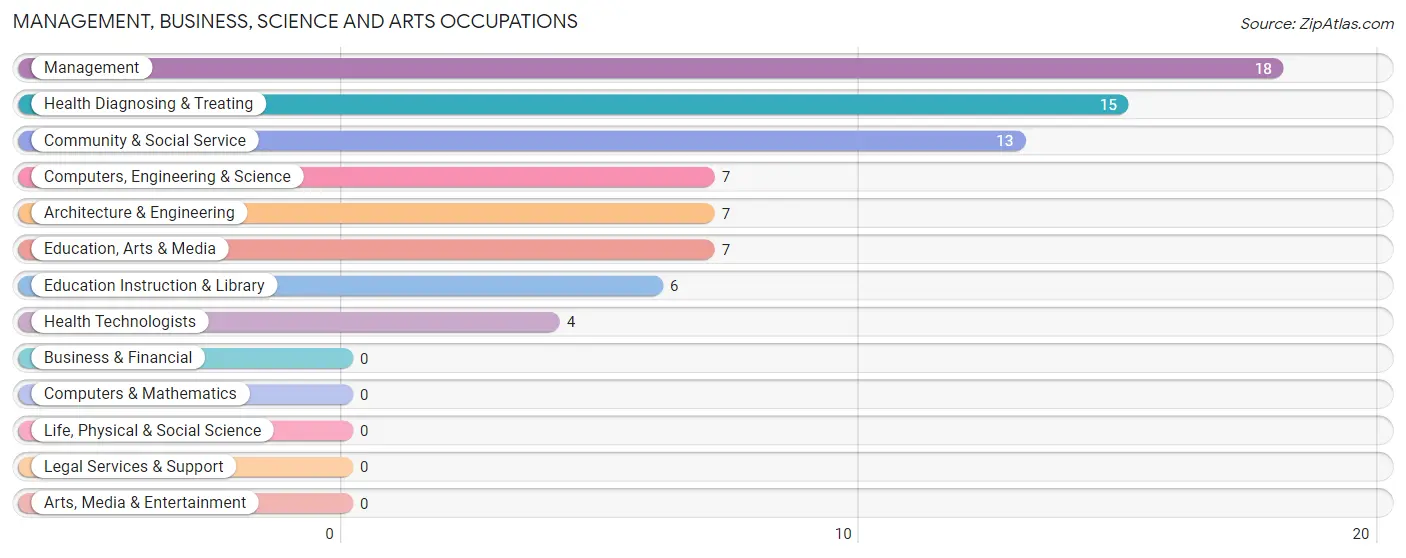
Management, Business, Science and Arts Occupations
The most common Management, Business, Science and Arts occupations in Elmo are Management (18 | 13.0%), Health Diagnosing & Treating (15 | 10.8%), Community & Social Service (13 | 9.3%), Computers, Engineering & Science (7 | 5.0%), and Architecture & Engineering (7 | 5.0%).
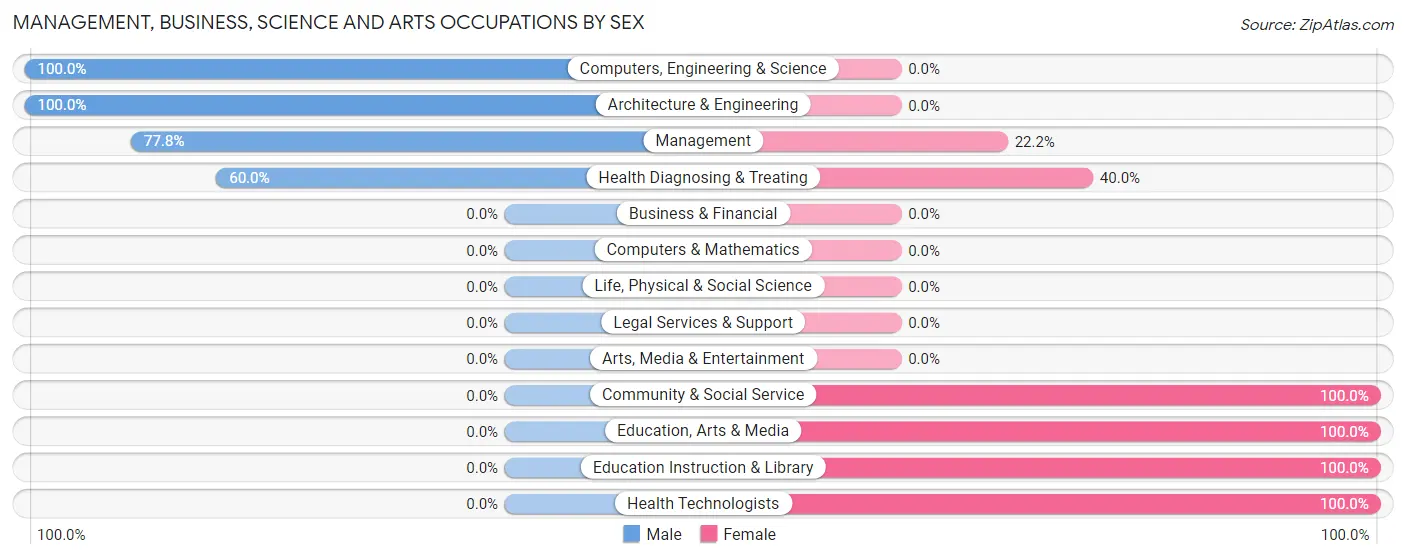
Management, Business, Science and Arts Occupations by Sex
Within the Management, Business, Science and Arts occupations in Elmo, the most male-oriented occupations are Computers, Engineering & Science (100.0%), Architecture & Engineering (100.0%), and Management (77.8%), while the most female-oriented occupations are Community & Social Service (100.0%), Education, Arts & Media (100.0%), and Education Instruction & Library (100.0%).
| Occupation | Male | Female |
| Management | 14 (77.8%) | 4 (22.2%) |
| Business & Financial | 0 (0.0%) | 0 (0.0%) |
| Computers, Engineering & Science | 7 (100.0%) | 0 (0.0%) |
| Computers & Mathematics | 0 (0.0%) | 0 (0.0%) |
| Architecture & Engineering | 7 (100.0%) | 0 (0.0%) |
| Life, Physical & Social Science | 0 (0.0%) | 0 (0.0%) |
| Community & Social Service | 0 (0.0%) | 13 (100.0%) |
| Education, Arts & Media | 0 (0.0%) | 7 (100.0%) |
| Legal Services & Support | 0 (0.0%) | 0 (0.0%) |
| Education Instruction & Library | 0 (0.0%) | 6 (100.0%) |
| Arts, Media & Entertainment | 0 (0.0%) | 0 (0.0%) |
| Health Diagnosing & Treating | 9 (60.0%) | 6 (40.0%) |
| Health Technologists | 0 (0.0%) | 4 (100.0%) |
| Total (Category) | 30 (56.6%) | 23 (43.4%) |
| Total (Overall) | 89 (64.0%) | 50 (36.0%) |
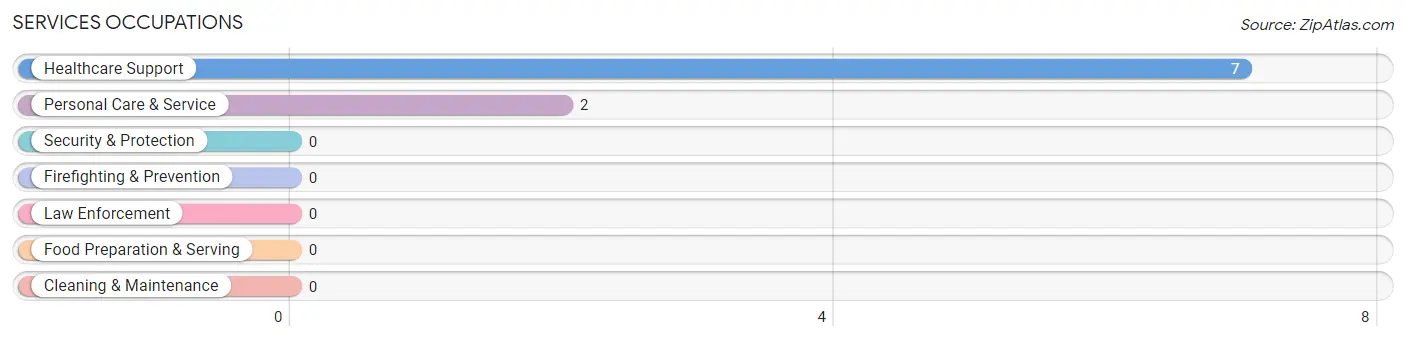
Services Occupations
The most common Services occupations in Elmo are Healthcare Support (7 | 5.0%), and Personal Care & Service (2 | 1.4%).
Services Occupations by Sex
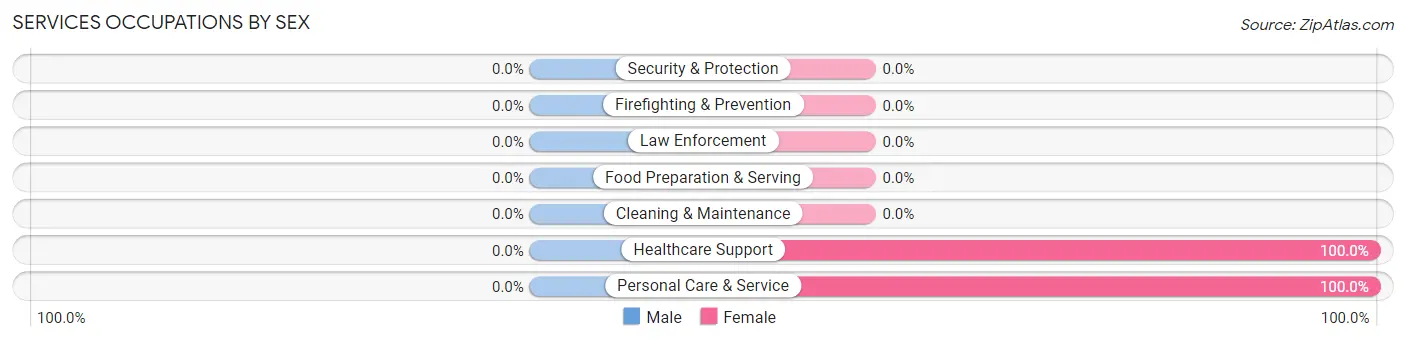
| Occupation | Male | Female |
| Healthcare Support | 0 (0.0%) | 7 (100.0%) |
| Security & Protection | 0 (0.0%) | 0 (0.0%) |
| Firefighting & Prevention | 0 (0.0%) | 0 (0.0%) |
| Law Enforcement | 0 (0.0%) | 0 (0.0%) |
| Food Preparation & Serving | 0 (0.0%) | 0 (0.0%) |
| Cleaning & Maintenance | 0 (0.0%) | 0 (0.0%) |
| Personal Care & Service | 0 (0.0%) | 2 (100.0%) |
| Total (Category) | 0 (0.0%) | 9 (100.0%) |
| Total (Overall) | 89 (64.0%) | 50 (36.0%) |
Sales and Office Occupations
The most common Sales and Office occupations in Elmo are Sales & Related (10 | 7.2%), and Office & Administration (7 | 5.0%).
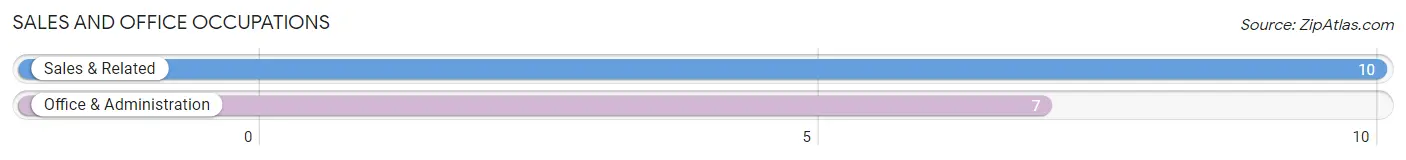
Sales and Office Occupations by Sex

| Occupation | Male | Female |
| Sales & Related | 6 (60.0%) | 4 (40.0%) |
| Office & Administration | 0 (0.0%) | 7 (100.0%) |
| Total (Category) | 6 (35.3%) | 11 (64.7%) |
| Total (Overall) | 89 (64.0%) | 50 (36.0%) |
Natural Resources, Construction and Maintenance Occupations
The most common Natural Resources, Construction and Maintenance occupations in Elmo are Construction & Extraction (25 | 18.0%), Installation, Maintenance & Repair (13 | 9.3%), and Farming, Fishing & Forestry (11 | 7.9%).
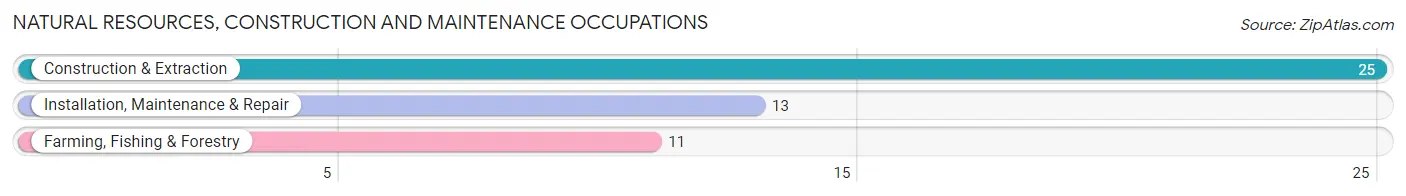
Natural Resources, Construction and Maintenance Occupations by Sex
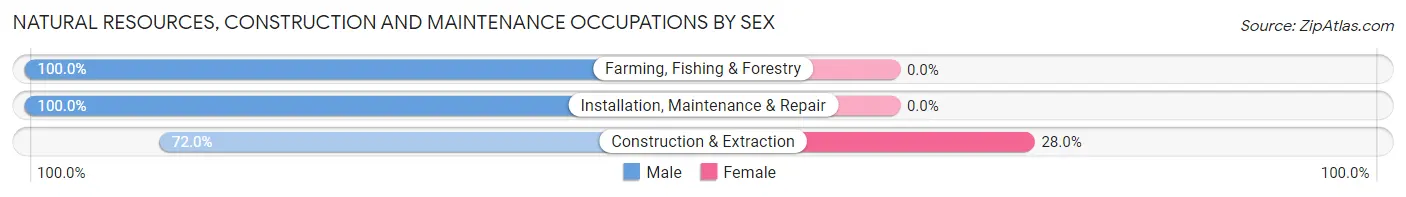
| Occupation | Male | Female |
| Farming, Fishing & Forestry | 11 (100.0%) | 0 (0.0%) |
| Construction & Extraction | 18 (72.0%) | 7 (28.0%) |
| Installation, Maintenance & Repair | 13 (100.0%) | 0 (0.0%) |
| Total (Category) | 42 (85.7%) | 7 (14.3%) |
| Total (Overall) | 89 (64.0%) | 50 (36.0%) |
Production, Transportation and Moving Occupations
The most common Production, Transportation and Moving occupations in Elmo are Production (7 | 5.0%), and Transportation (4 | 2.9%).
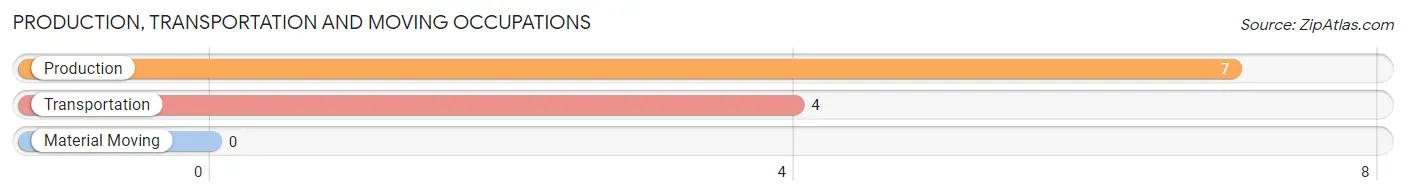
Production, Transportation and Moving Occupations by Sex
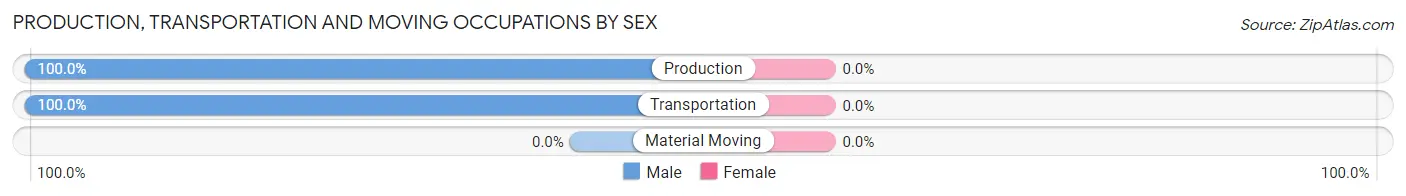
| Occupation | Male | Female |
| Production | 7 (100.0%) | 0 (0.0%) |
| Transportation | 4 (100.0%) | 0 (0.0%) |
| Material Moving | 0 (0.0%) | 0 (0.0%) |
| Total (Category) | 11 (100.0%) | 0 (0.0%) |
| Total (Overall) | 89 (64.0%) | 50 (36.0%) |
Employment Industries by Sex in Elmo
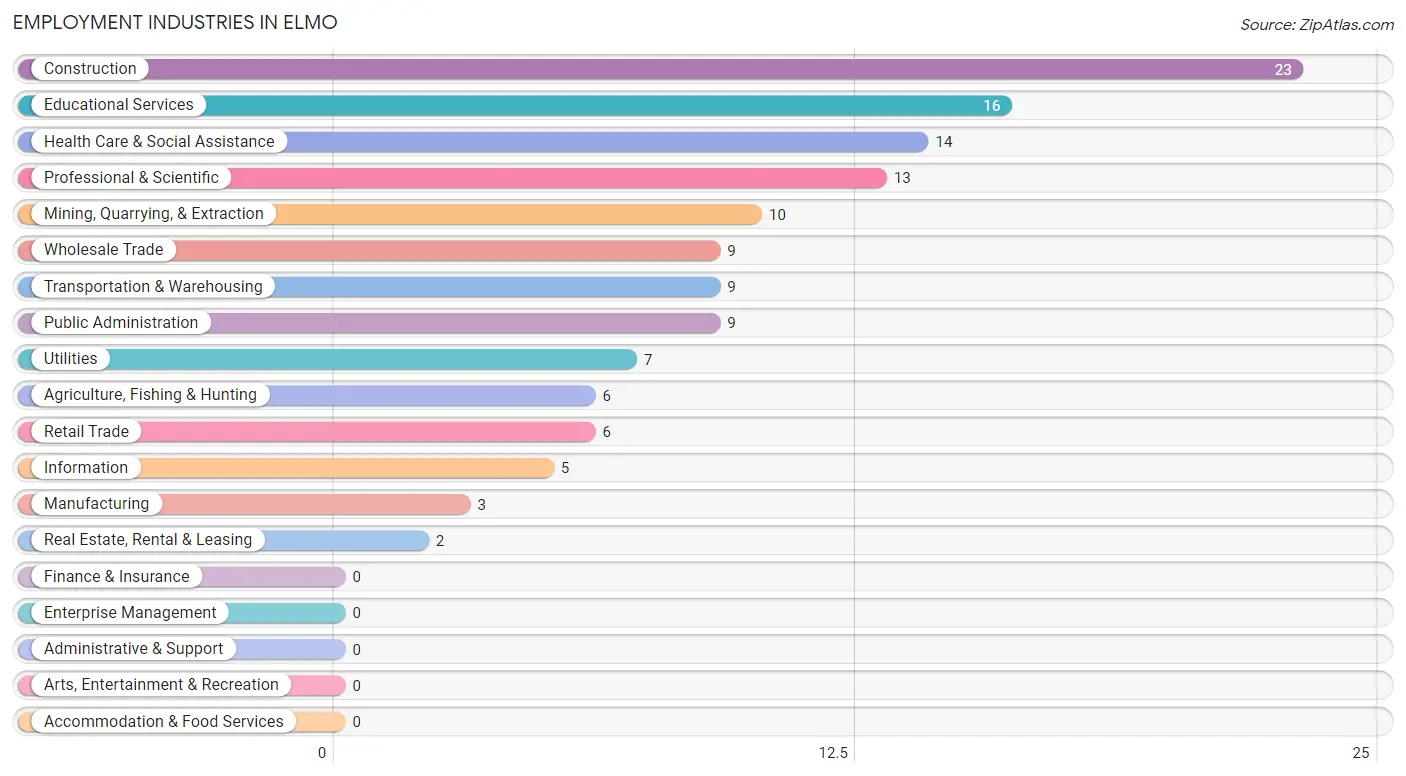
Employment Industries in Elmo
The major employment industries in Elmo include Construction (23 | 16.6%), Educational Services (16 | 11.5%), Health Care & Social Assistance (14 | 10.1%), Professional & Scientific (13 | 9.3%), and Mining, Quarrying, & Extraction (10 | 7.2%).
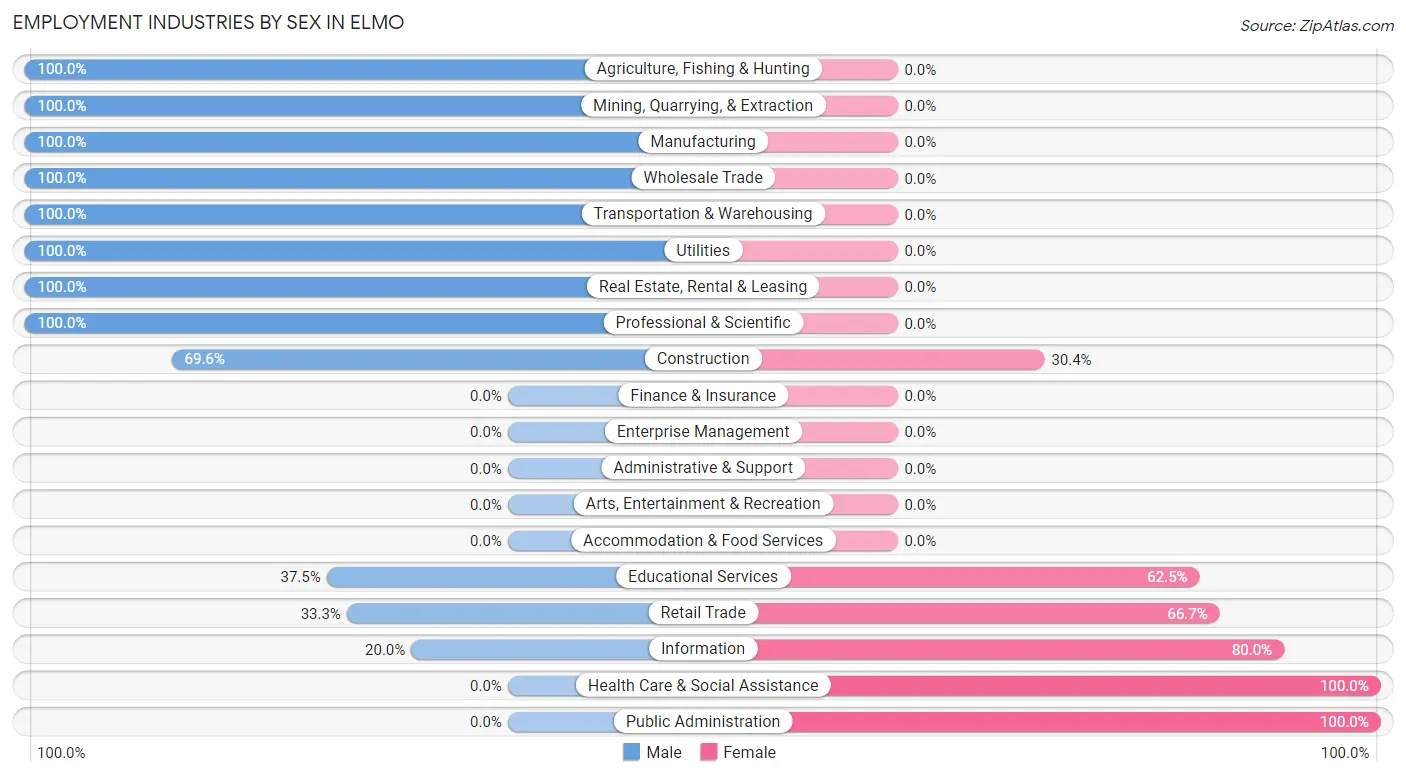
Employment Industries by Sex in Elmo
The Elmo industries that see more men than women are Agriculture, Fishing & Hunting (100.0%), Mining, Quarrying, & Extraction (100.0%), and Manufacturing (100.0%), whereas the industries that tend to have a higher number of women are Health Care & Social Assistance (100.0%), Public Administration (100.0%), and Information (80.0%).
| Industry | Male | Female |
| Agriculture, Fishing & Hunting | 6 (100.0%) | 0 (0.0%) |
| Mining, Quarrying, & Extraction | 10 (100.0%) | 0 (0.0%) |
| Construction | 16 (69.6%) | 7 (30.4%) |
| Manufacturing | 3 (100.0%) | 0 (0.0%) |
| Wholesale Trade | 9 (100.0%) | 0 (0.0%) |
| Retail Trade | 2 (33.3%) | 4 (66.7%) |
| Transportation & Warehousing | 9 (100.0%) | 0 (0.0%) |
| Utilities | 7 (100.0%) | 0 (0.0%) |
| Information | 1 (20.0%) | 4 (80.0%) |
| Finance & Insurance | 0 (0.0%) | 0 (0.0%) |
| Real Estate, Rental & Leasing | 2 (100.0%) | 0 (0.0%) |
| Professional & Scientific | 13 (100.0%) | 0 (0.0%) |
| Enterprise Management | 0 (0.0%) | 0 (0.0%) |
| Administrative & Support | 0 (0.0%) | 0 (0.0%) |
| Educational Services | 6 (37.5%) | 10 (62.5%) |
| Health Care & Social Assistance | 0 (0.0%) | 14 (100.0%) |
| Arts, Entertainment & Recreation | 0 (0.0%) | 0 (0.0%) |
| Accommodation & Food Services | 0 (0.0%) | 0 (0.0%) |
| Public Administration | 0 (0.0%) | 9 (100.0%) |
| Total | 89 (64.0%) | 50 (36.0%) |
Education in Elmo
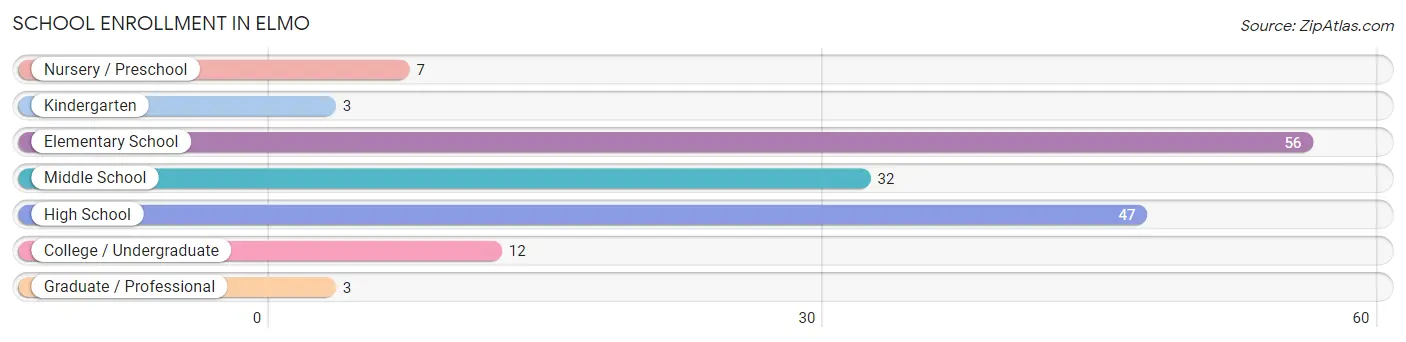
School Enrollment in Elmo
The most common levels of schooling among the 160 students in Elmo are elementary school (56 | 35.0%), high school (47 | 29.4%), and middle school (32 | 20.0%).
| School Level | # Students | % Students |
| Nursery / Preschool | 7 | 4.4% |
| Kindergarten | 3 | 1.9% |
| Elementary School | 56 | 35.0% |
| Middle School | 32 | 20.0% |
| High School | 47 | 29.4% |
| College / Undergraduate | 12 | 7.5% |
| Graduate / Professional | 3 | 1.9% |
| Total | 160 | 100.0% |
School Enrollment by Age by Funding Source in Elmo
Out of a total of 160 students who are enrolled in schools in Elmo, 7 (4.4%) attend a private institution, while the remaining 153 (95.6%) are enrolled in public schools. The age group of 3 to 4 year olds has the highest likelihood of being enrolled in private schools, with 2 (100.0% in the age bracket) enrolled. Conversely, the age group of 10 to 14 year olds has the lowest likelihood of being enrolled in a private school, with 51 (100.0% in the age bracket) attending a public institution.
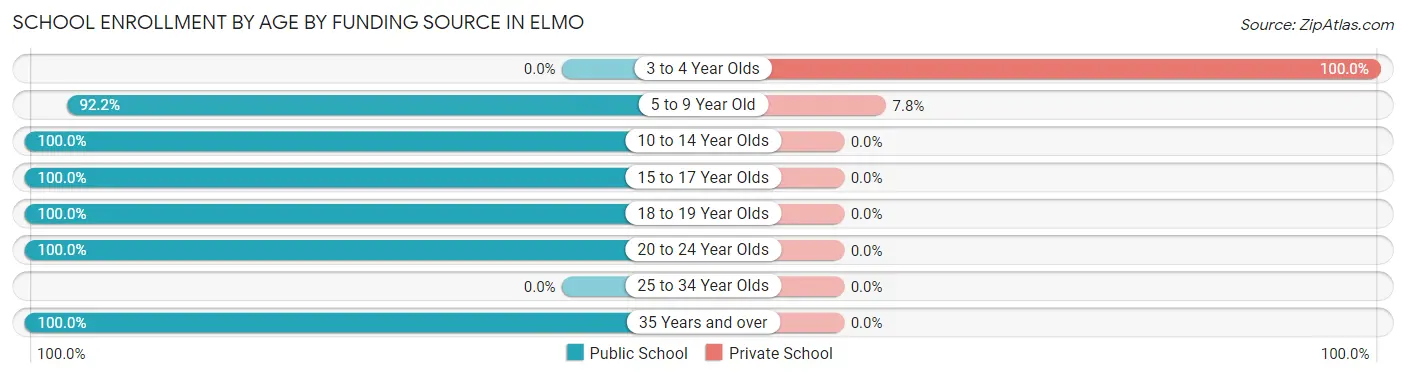
| Age Bracket | Public School | Private School |
| 3 to 4 Year Olds | 0 (0.0%) | 2 (100.0%) |
| 5 to 9 Year Old | 59 (92.2%) | 5 (7.8%) |
| 10 to 14 Year Olds | 51 (100.0%) | 0 (0.0%) |
| 15 to 17 Year Olds | 25 (100.0%) | 0 (0.0%) |
| 18 to 19 Year Olds | 3 (100.0%) | 0 (0.0%) |
| 20 to 24 Year Olds | 12 (100.0%) | 0 (0.0%) |
| 25 to 34 Year Olds | 0 (0.0%) | 0 (0.0%) |
| 35 Years and over | 3 (100.0%) | 0 (0.0%) |
| Total | 153 (95.6%) | 7 (4.4%) |
Educational Attainment by Field of Study in Elmo
Business (27 | 47.4%), psychology (11 | 19.3%), education (7 | 12.3%), bio, nature & agricultural (4 | 7.0%), and engineering (4 | 7.0%) are the most common fields of study among 57 individuals in Elmo who have obtained a bachelor's degree or higher.
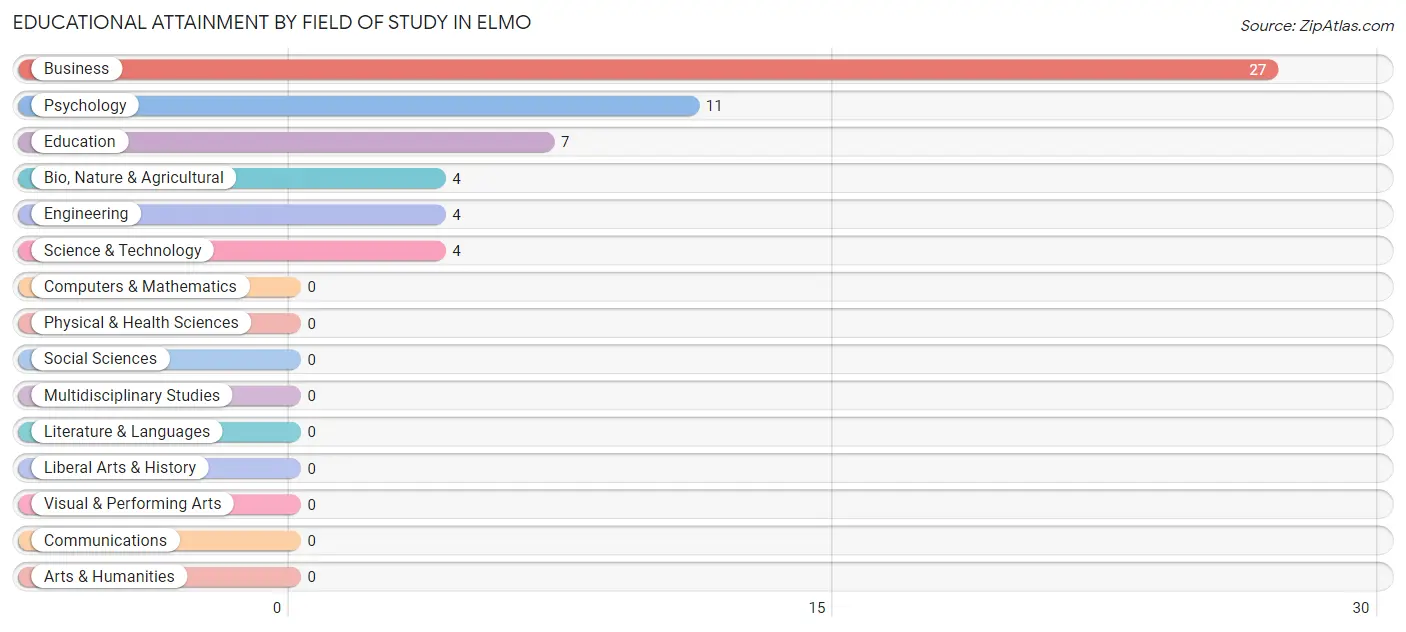
| Field of Study | # Graduates | % Graduates |
| Computers & Mathematics | 0 | 0.0% |
| Bio, Nature & Agricultural | 4 | 7.0% |
| Physical & Health Sciences | 0 | 0.0% |
| Psychology | 11 | 19.3% |
| Social Sciences | 0 | 0.0% |
| Engineering | 4 | 7.0% |
| Multidisciplinary Studies | 0 | 0.0% |
| Science & Technology | 4 | 7.0% |
| Business | 27 | 47.4% |
| Education | 7 | 12.3% |
| Literature & Languages | 0 | 0.0% |
| Liberal Arts & History | 0 | 0.0% |
| Visual & Performing Arts | 0 | 0.0% |
| Communications | 0 | 0.0% |
| Arts & Humanities | 0 | 0.0% |
| Total | 57 | 100.0% |
Transportation & Commute in Elmo
Vehicle Availability by Sex in Elmo
The most prevalent vehicle ownership categories in Elmo are males with 5 or more vehicles (37, accounting for 33.9%) and females with 5 or more vehicles (8, making up 74.0%).
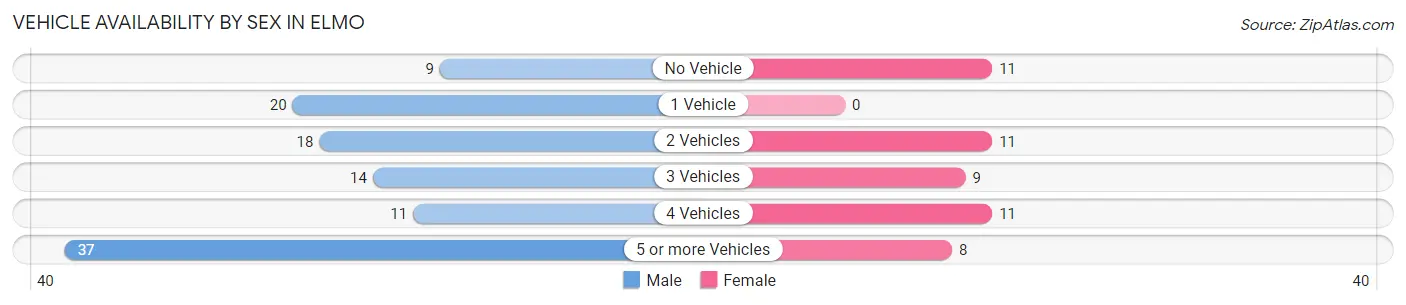
| Vehicles Available | Male | Female |
| No Vehicle | 9 (8.3%) | 11 (22.0%) |
| 1 Vehicle | 20 (18.3%) | 0 (0.0%) |
| 2 Vehicles | 18 (16.5%) | 11 (22.0%) |
| 3 Vehicles | 14 (12.8%) | 9 (18.0%) |
| 4 Vehicles | 11 (10.1%) | 11 (22.0%) |
| 5 or more Vehicles | 37 (33.9%) | 8 (16.0%) |
| Total | 109 (100.0%) | 50 (100.0%) |
Commute Time in Elmo
The most frequently occuring commute durations in Elmo are 20 to 24 minutes (48 commuters, 32.9%), 30 to 34 minutes (20 commuters, 13.7%), and 45 to 59 minutes (20 commuters, 13.7%).
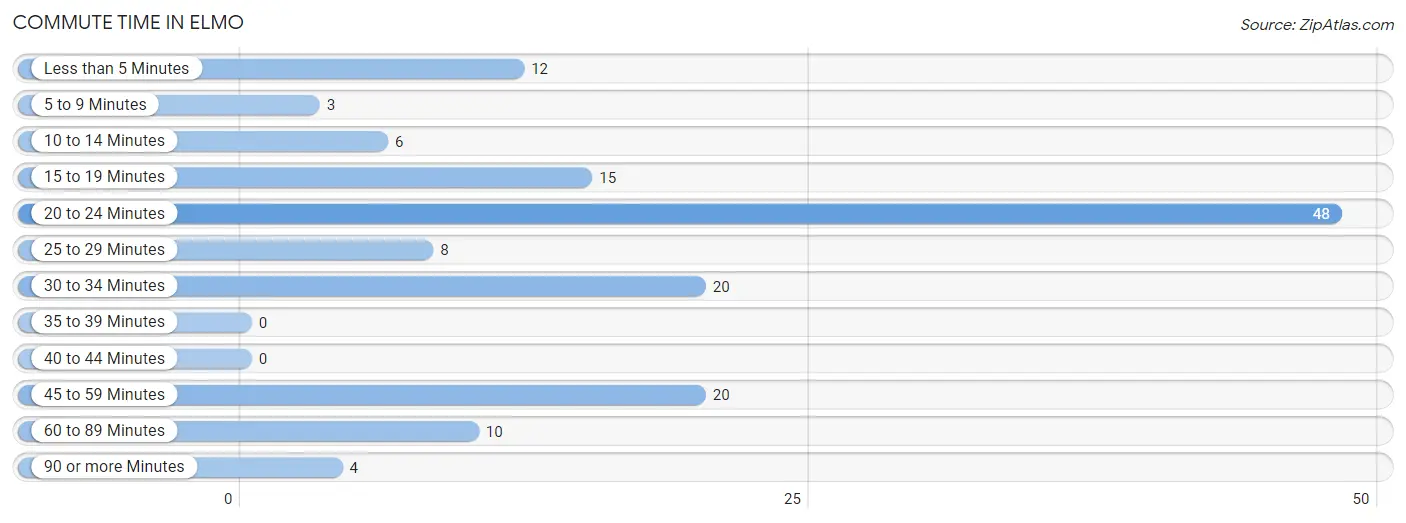
| Commute Time | # Commuters | % Commuters |
| Less than 5 Minutes | 12 | 8.2% |
| 5 to 9 Minutes | 3 | 2.1% |
| 10 to 14 Minutes | 6 | 4.1% |
| 15 to 19 Minutes | 15 | 10.3% |
| 20 to 24 Minutes | 48 | 32.9% |
| 25 to 29 Minutes | 8 | 5.5% |
| 30 to 34 Minutes | 20 | 13.7% |
| 35 to 39 Minutes | 0 | 0.0% |
| 40 to 44 Minutes | 0 | 0.0% |
| 45 to 59 Minutes | 20 | 13.7% |
| 60 to 89 Minutes | 10 | 6.9% |
| 90 or more Minutes | 4 | 2.7% |
Commute Time by Sex in Elmo
The most common commute times in Elmo are 45 to 59 minutes (20 commuters, 20.8%) for males and 20 to 24 minutes (31 commuters, 62.0%) for females.
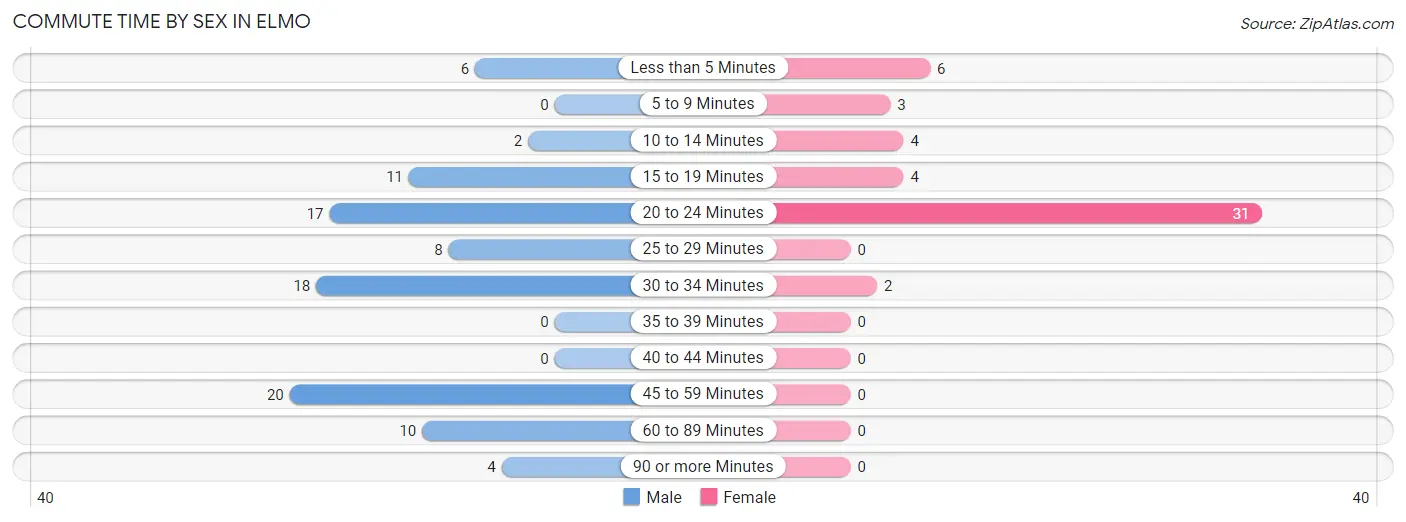
| Commute Time | Male | Female |
| Less than 5 Minutes | 6 (6.2%) | 6 (12.0%) |
| 5 to 9 Minutes | 0 (0.0%) | 3 (6.0%) |
| 10 to 14 Minutes | 2 (2.1%) | 4 (8.0%) |
| 15 to 19 Minutes | 11 (11.5%) | 4 (8.0%) |
| 20 to 24 Minutes | 17 (17.7%) | 31 (62.0%) |
| 25 to 29 Minutes | 8 (8.3%) | 0 (0.0%) |
| 30 to 34 Minutes | 18 (18.8%) | 2 (4.0%) |
| 35 to 39 Minutes | 0 (0.0%) | 0 (0.0%) |
| 40 to 44 Minutes | 0 (0.0%) | 0 (0.0%) |
| 45 to 59 Minutes | 20 (20.8%) | 0 (0.0%) |
| 60 to 89 Minutes | 10 (10.4%) | 0 (0.0%) |
| 90 or more Minutes | 4 (4.2%) | 0 (0.0%) |
Time of Departure to Work by Sex in Elmo
The most frequent times of departure to work in Elmo are 4:00 PM to 11:59 PM (20, 20.8%) for males and 9:00 AM to 9:59 AM (15, 30.0%) for females.
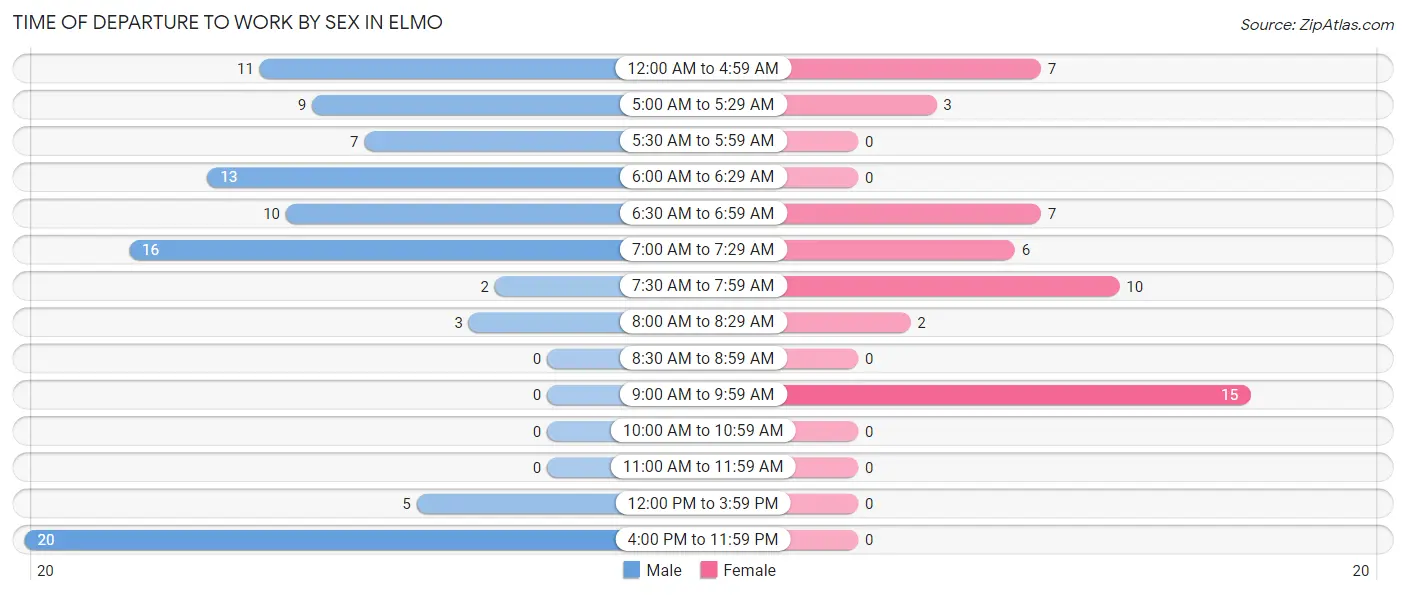
| Time of Departure | Male | Female |
| 12:00 AM to 4:59 AM | 11 (11.5%) | 7 (14.0%) |
| 5:00 AM to 5:29 AM | 9 (9.4%) | 3 (6.0%) |
| 5:30 AM to 5:59 AM | 7 (7.3%) | 0 (0.0%) |
| 6:00 AM to 6:29 AM | 13 (13.5%) | 0 (0.0%) |
| 6:30 AM to 6:59 AM | 10 (10.4%) | 7 (14.0%) |
| 7:00 AM to 7:29 AM | 16 (16.7%) | 6 (12.0%) |
| 7:30 AM to 7:59 AM | 2 (2.1%) | 10 (20.0%) |
| 8:00 AM to 8:29 AM | 3 (3.1%) | 2 (4.0%) |
| 8:30 AM to 8:59 AM | 0 (0.0%) | 0 (0.0%) |
| 9:00 AM to 9:59 AM | 0 (0.0%) | 15 (30.0%) |
| 10:00 AM to 10:59 AM | 0 (0.0%) | 0 (0.0%) |
| 11:00 AM to 11:59 AM | 0 (0.0%) | 0 (0.0%) |
| 12:00 PM to 3:59 PM | 5 (5.2%) | 0 (0.0%) |
| 4:00 PM to 11:59 PM | 20 (20.8%) | 0 (0.0%) |
| Total | 96 (100.0%) | 50 (100.0%) |
Housing Occupancy in Elmo
Occupancy by Ownership in Elmo
Of the total 149 dwellings in Elmo, owner-occupied units account for 115 (77.2%), while renter-occupied units make up 34 (22.8%).
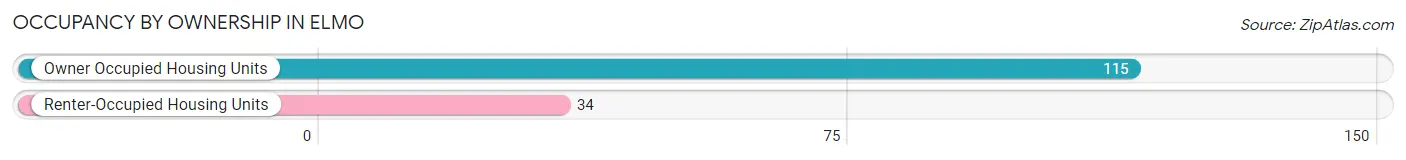
| Occupancy | # Housing Units | % Housing Units |
| Owner Occupied Housing Units | 115 | 77.2% |
| Renter-Occupied Housing Units | 34 | 22.8% |
| Total Occupied Housing Units | 149 | 100.0% |
Occupancy by Household Size in Elmo
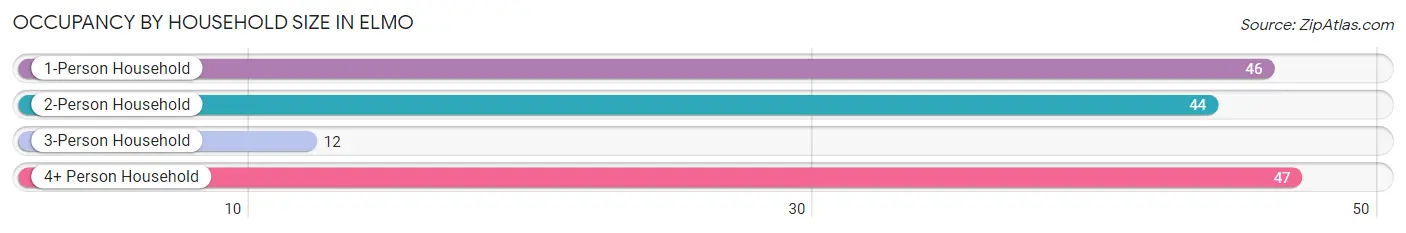
| Household Size | # Housing Units | % Housing Units |
| 1-Person Household | 46 | 30.9% |
| 2-Person Household | 44 | 29.5% |
| 3-Person Household | 12 | 8.1% |
| 4+ Person Household | 47 | 31.5% |
| Total Housing Units | 149 | 100.0% |
Occupancy by Ownership by Household Size in Elmo
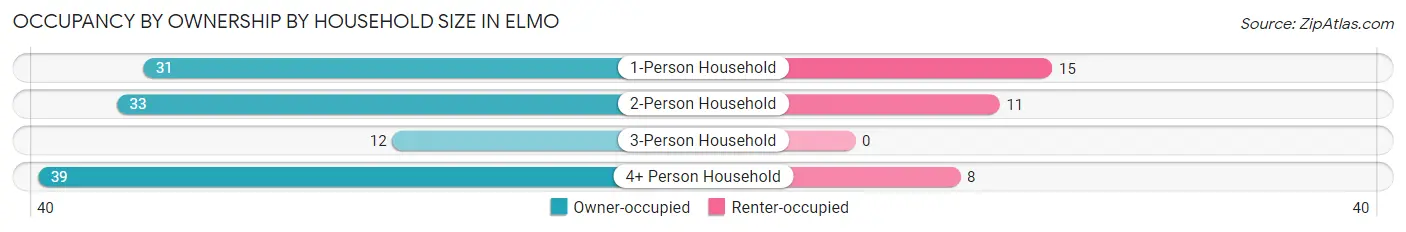
| Household Size | Owner-occupied | Renter-occupied |
| 1-Person Household | 31 (67.4%) | 15 (32.6%) |
| 2-Person Household | 33 (75.0%) | 11 (25.0%) |
| 3-Person Household | 12 (100.0%) | 0 (0.0%) |
| 4+ Person Household | 39 (83.0%) | 8 (17.0%) |
| Total Housing Units | 115 (77.2%) | 34 (22.8%) |
Occupancy by Educational Attainment in Elmo
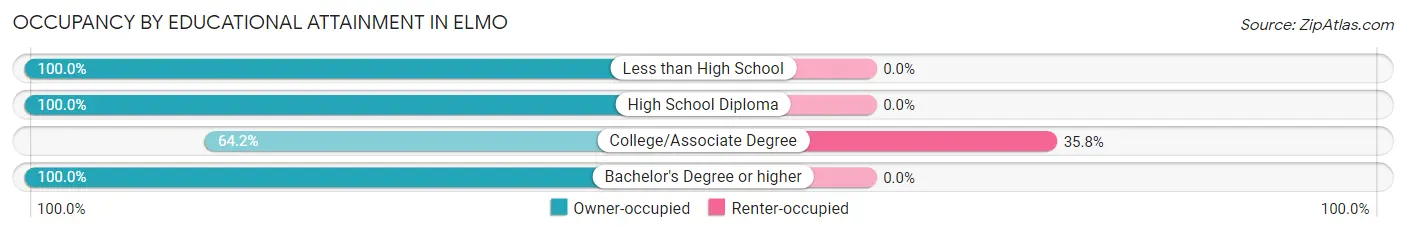
| Household Size | Owner-occupied | Renter-occupied |
| Less than High School | 7 (100.0%) | 0 (0.0%) |
| High School Diploma | 26 (100.0%) | 0 (0.0%) |
| College/Associate Degree | 61 (64.2%) | 34 (35.8%) |
| Bachelor's Degree or higher | 21 (100.0%) | 0 (0.0%) |
Occupancy by Age of Householder in Elmo
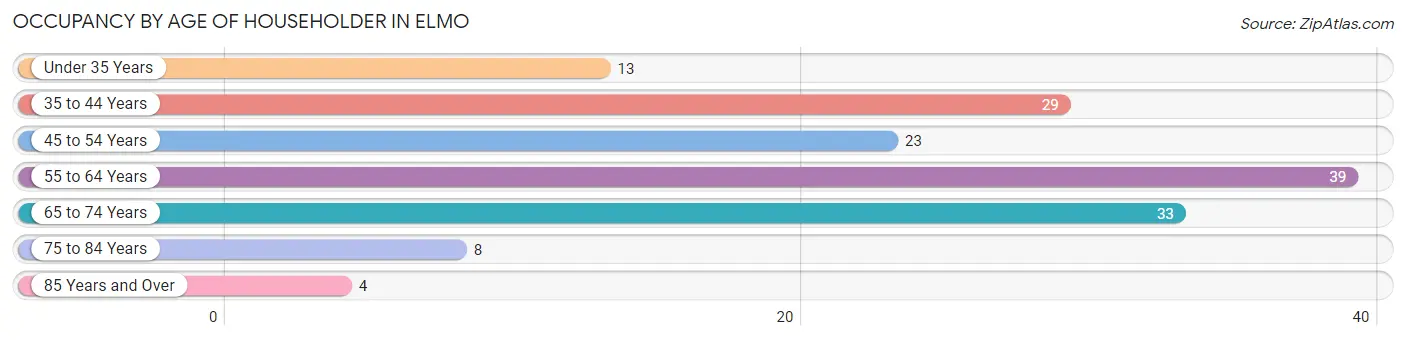
| Age Bracket | # Households | % Households |
| Under 35 Years | 13 | 8.7% |
| 35 to 44 Years | 29 | 19.5% |
| 45 to 54 Years | 23 | 15.4% |
| 55 to 64 Years | 39 | 26.2% |
| 65 to 74 Years | 33 | 22.2% |
| 75 to 84 Years | 8 | 5.4% |
| 85 Years and Over | 4 | 2.7% |
| Total | 149 | 100.0% |
Housing Finances in Elmo
Median Income by Occupancy in Elmo
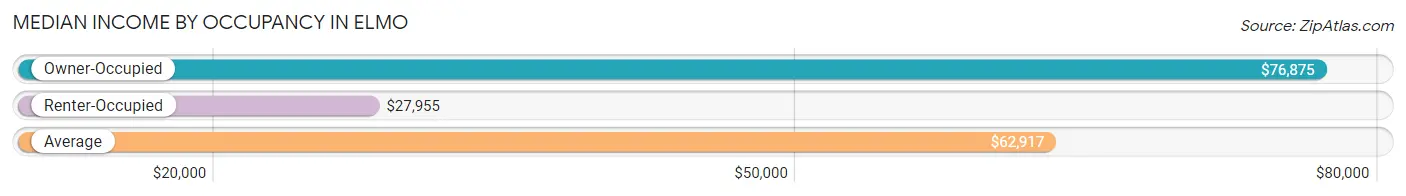
| Occupancy Type | # Households | Median Income |
| Owner-Occupied | 115 (77.2%) | $76,875 |
| Renter-Occupied | 34 (22.8%) | $27,955 |
| Average | 149 (100.0%) | $62,917 |
Occupancy by Householder Income Bracket in Elmo
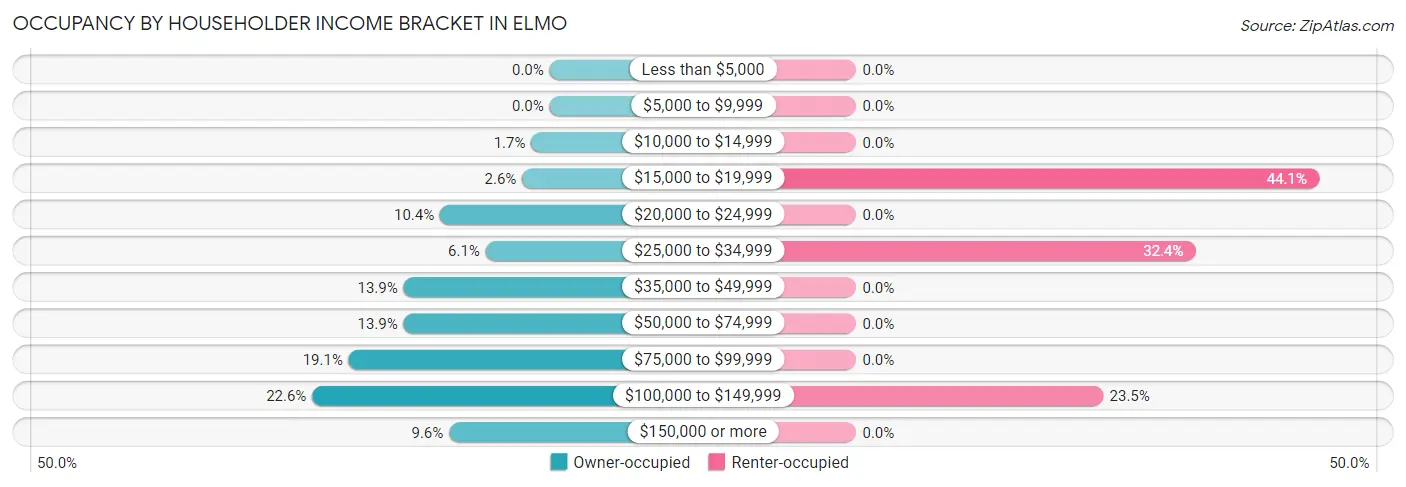
| Income Bracket | Owner-occupied | Renter-occupied |
| Less than $5,000 | 0 (0.0%) | 0 (0.0%) |
| $5,000 to $9,999 | 0 (0.0%) | 0 (0.0%) |
| $10,000 to $14,999 | 2 (1.7%) | 0 (0.0%) |
| $15,000 to $19,999 | 3 (2.6%) | 15 (44.1%) |
| $20,000 to $24,999 | 12 (10.4%) | 0 (0.0%) |
| $25,000 to $34,999 | 7 (6.1%) | 11 (32.4%) |
| $35,000 to $49,999 | 16 (13.9%) | 0 (0.0%) |
| $50,000 to $74,999 | 16 (13.9%) | 0 (0.0%) |
| $75,000 to $99,999 | 22 (19.1%) | 0 (0.0%) |
| $100,000 to $149,999 | 26 (22.6%) | 8 (23.5%) |
| $150,000 or more | 11 (9.6%) | 0 (0.0%) |
| Total | 115 (100.0%) | 34 (100.0%) |
Monthly Housing Cost Tiers in Elmo
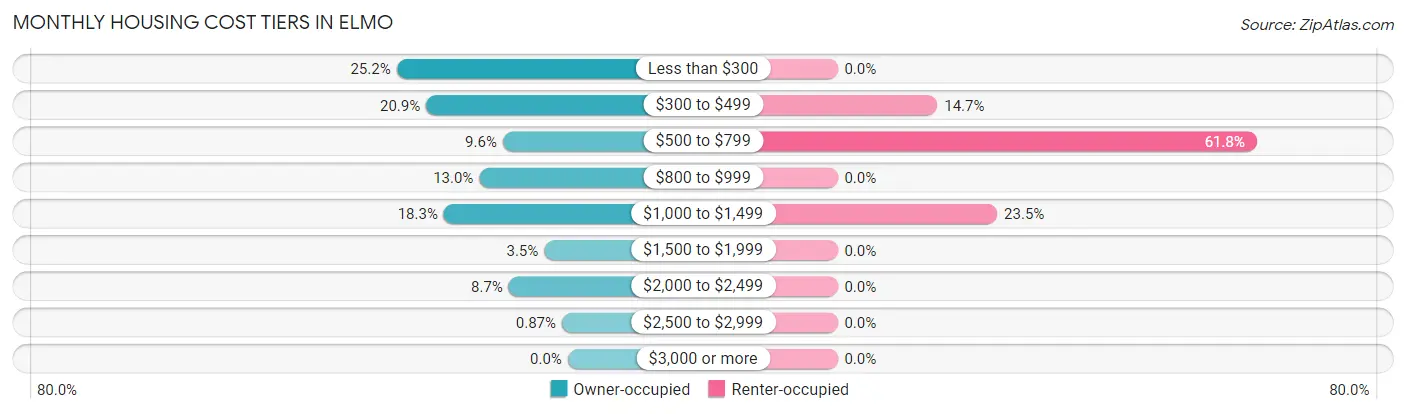
| Monthly Cost | Owner-occupied | Renter-occupied |
| Less than $300 | 29 (25.2%) | 0 (0.0%) |
| $300 to $499 | 24 (20.9%) | 5 (14.7%) |
| $500 to $799 | 11 (9.6%) | 21 (61.8%) |
| $800 to $999 | 15 (13.0%) | 0 (0.0%) |
| $1,000 to $1,499 | 21 (18.3%) | 8 (23.5%) |
| $1,500 to $1,999 | 4 (3.5%) | 0 (0.0%) |
| $2,000 to $2,499 | 10 (8.7%) | 0 (0.0%) |
| $2,500 to $2,999 | 1 (0.9%) | 0 (0.0%) |
| $3,000 or more | 0 (0.0%) | 0 (0.0%) |
| Total | 115 (100.0%) | 34 (100.0%) |
Physical Housing Characteristics in Elmo
Housing Structures in Elmo
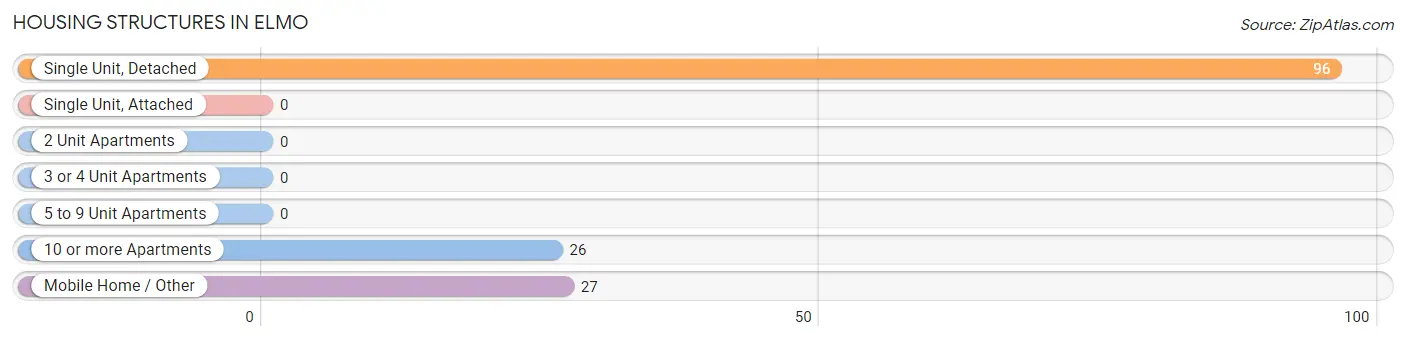
| Structure Type | # Housing Units | % Housing Units |
| Single Unit, Detached | 96 | 64.4% |
| Single Unit, Attached | 0 | 0.0% |
| 2 Unit Apartments | 0 | 0.0% |
| 3 or 4 Unit Apartments | 0 | 0.0% |
| 5 to 9 Unit Apartments | 0 | 0.0% |
| 10 or more Apartments | 26 | 17.4% |
| Mobile Home / Other | 27 | 18.1% |
| Total | 149 | 100.0% |
Housing Structures by Occupancy in Elmo
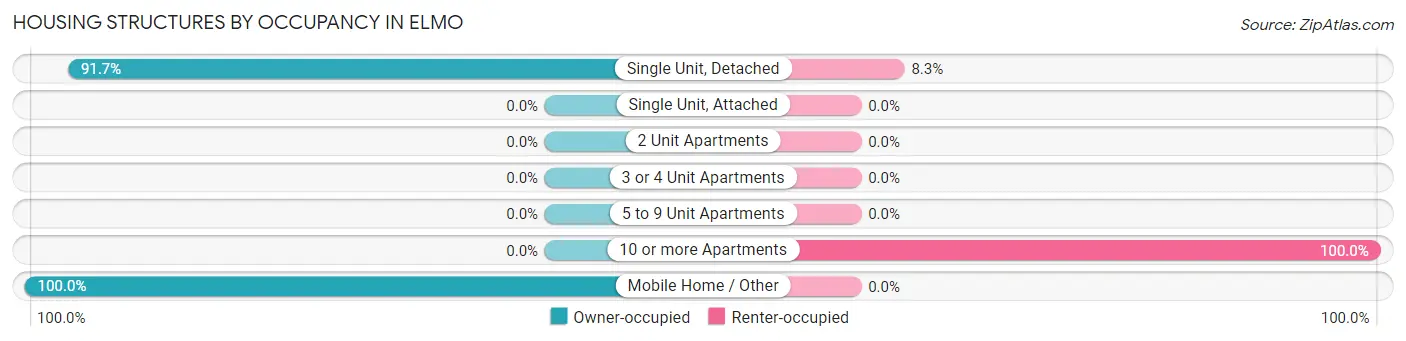
| Structure Type | Owner-occupied | Renter-occupied |
| Single Unit, Detached | 88 (91.7%) | 8 (8.3%) |
| Single Unit, Attached | 0 (0.0%) | 0 (0.0%) |
| 2 Unit Apartments | 0 (0.0%) | 0 (0.0%) |
| 3 or 4 Unit Apartments | 0 (0.0%) | 0 (0.0%) |
| 5 to 9 Unit Apartments | 0 (0.0%) | 0 (0.0%) |
| 10 or more Apartments | 0 (0.0%) | 26 (100.0%) |
| Mobile Home / Other | 27 (100.0%) | 0 (0.0%) |
| Total | 115 (77.2%) | 34 (22.8%) |
Housing Structures by Number of Rooms in Elmo
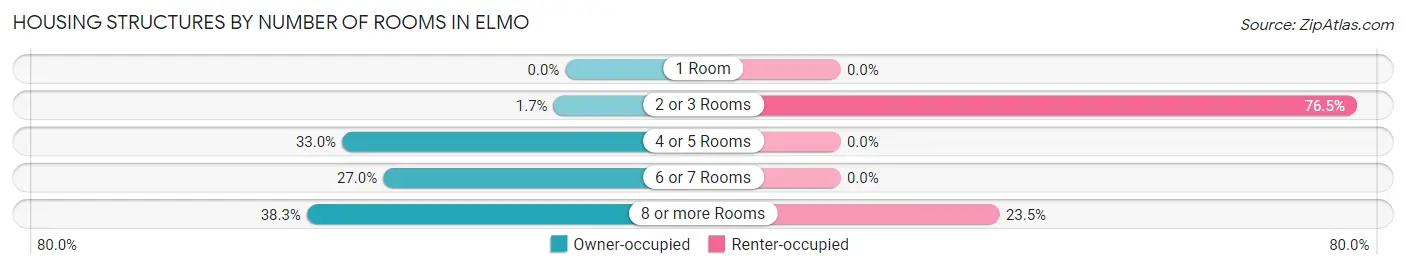
| Number of Rooms | Owner-occupied | Renter-occupied |
| 1 Room | 0 (0.0%) | 0 (0.0%) |
| 2 or 3 Rooms | 2 (1.7%) | 26 (76.5%) |
| 4 or 5 Rooms | 38 (33.0%) | 0 (0.0%) |
| 6 or 7 Rooms | 31 (27.0%) | 0 (0.0%) |
| 8 or more Rooms | 44 (38.3%) | 8 (23.5%) |
| Total | 115 (100.0%) | 34 (100.0%) |
Housing Structure by Heating Type in Elmo
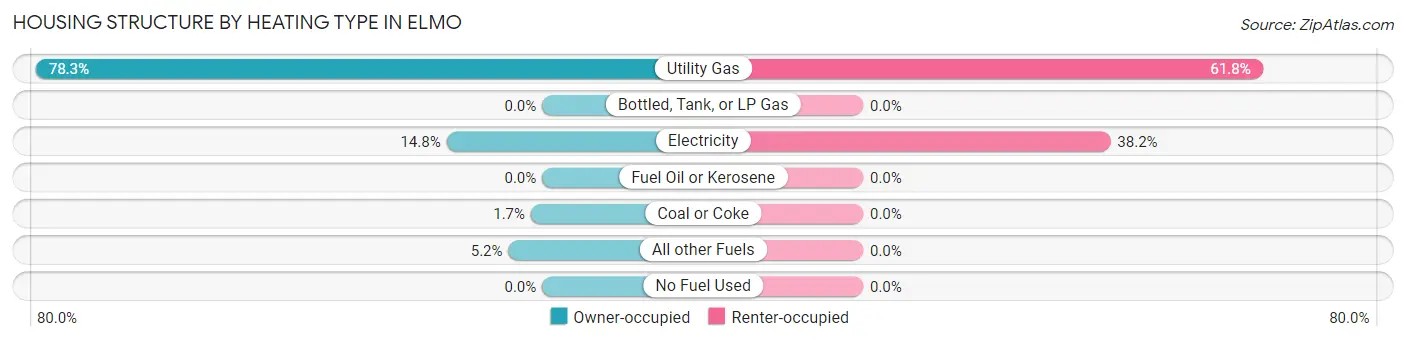
| Heating Type | Owner-occupied | Renter-occupied |
| Utility Gas | 90 (78.3%) | 21 (61.8%) |
| Bottled, Tank, or LP Gas | 0 (0.0%) | 0 (0.0%) |
| Electricity | 17 (14.8%) | 13 (38.2%) |
| Fuel Oil or Kerosene | 0 (0.0%) | 0 (0.0%) |
| Coal or Coke | 2 (1.7%) | 0 (0.0%) |
| All other Fuels | 6 (5.2%) | 0 (0.0%) |
| No Fuel Used | 0 (0.0%) | 0 (0.0%) |
| Total | 115 (100.0%) | 34 (100.0%) |
Household Vehicle Usage in Elmo
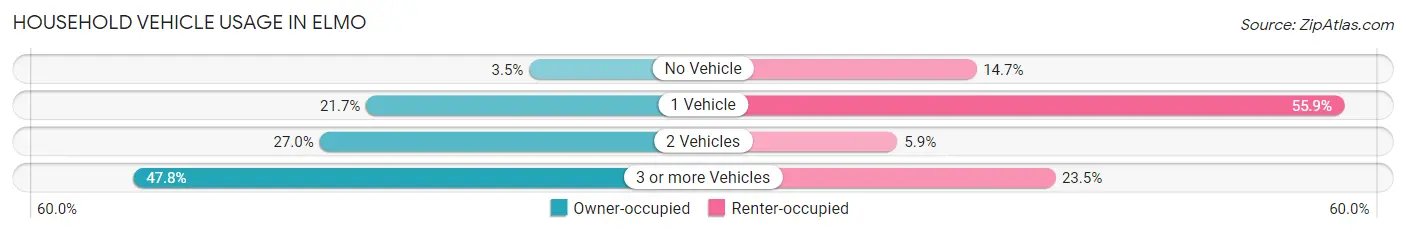
| Vehicles per Household | Owner-occupied | Renter-occupied |
| No Vehicle | 4 (3.5%) | 5 (14.7%) |
| 1 Vehicle | 25 (21.7%) | 19 (55.9%) |
| 2 Vehicles | 31 (27.0%) | 2 (5.9%) |
| 3 or more Vehicles | 55 (47.8%) | 8 (23.5%) |
| Total | 115 (100.0%) | 34 (100.0%) |
Real Estate & Mortgages in Elmo
Real Estate and Mortgage Overview in Elmo
| Characteristic | Without Mortgage | With Mortgage |
| Housing Units | 60 | 55 |
| Median Property Value | $112,500 | $193,800 |
| Median Household Income | $44,167 | $7 |
| Monthly Housing Costs | $310 | $0 |
| Real Estate Taxes | $900 | $0 |
Property Value by Mortgage Status in Elmo
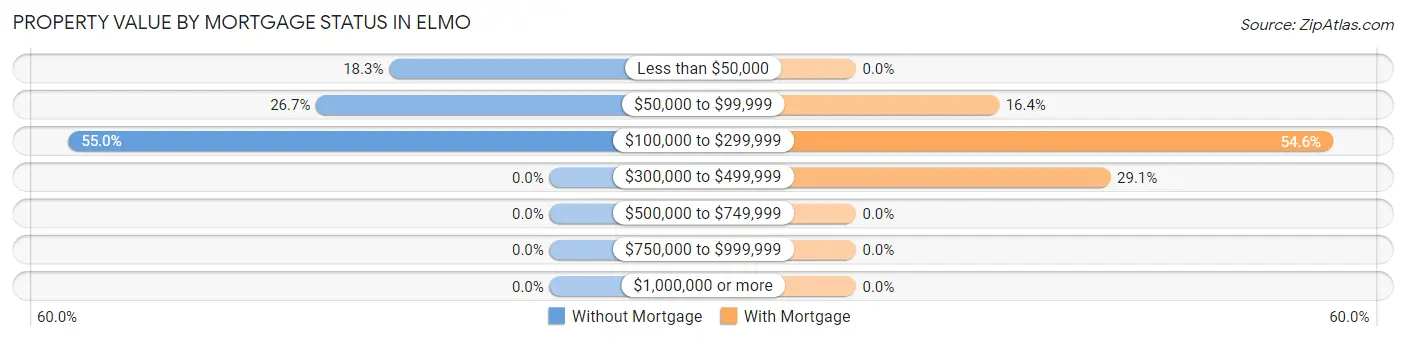
| Property Value | Without Mortgage | With Mortgage |
| Less than $50,000 | 11 (18.3%) | 0 (0.0%) |
| $50,000 to $99,999 | 16 (26.7%) | 9 (16.4%) |
| $100,000 to $299,999 | 33 (55.0%) | 30 (54.5%) |
| $300,000 to $499,999 | 0 (0.0%) | 16 (29.1%) |
| $500,000 to $749,999 | 0 (0.0%) | 0 (0.0%) |
| $750,000 to $999,999 | 0 (0.0%) | 0 (0.0%) |
| $1,000,000 or more | 0 (0.0%) | 0 (0.0%) |
| Total | 60 (100.0%) | 55 (100.0%) |
Household Income by Mortgage Status in Elmo
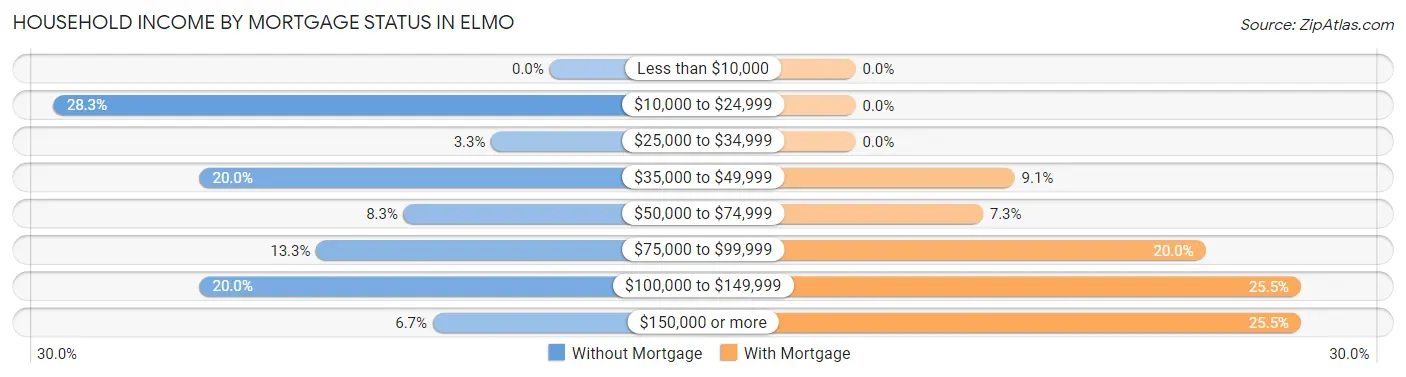
| Household Income | Without Mortgage | With Mortgage |
| Less than $10,000 | 0 (0.0%) | 0 (0.0%) |
| $10,000 to $24,999 | 17 (28.3%) | 0 (0.0%) |
| $25,000 to $34,999 | 2 (3.3%) | 0 (0.0%) |
| $35,000 to $49,999 | 12 (20.0%) | 5 (9.1%) |
| $50,000 to $74,999 | 5 (8.3%) | 4 (7.3%) |
| $75,000 to $99,999 | 8 (13.3%) | 11 (20.0%) |
| $100,000 to $149,999 | 12 (20.0%) | 14 (25.5%) |
| $150,000 or more | 4 (6.7%) | 14 (25.5%) |
| Total | 60 (100.0%) | 55 (100.0%) |
Property Value to Household Income Ratio in Elmo
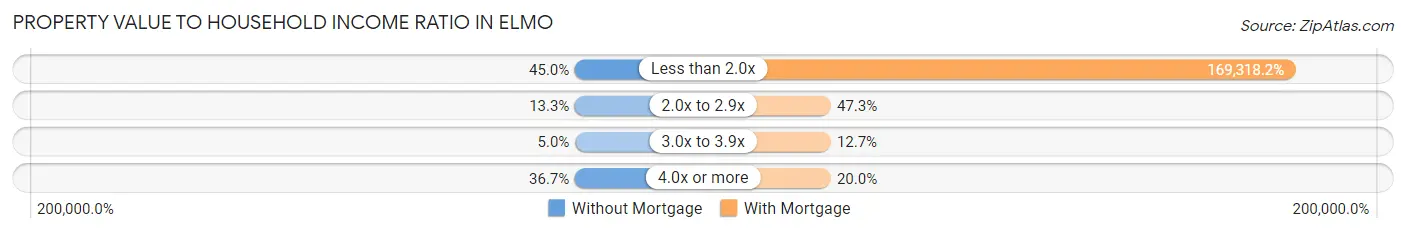
| Value-to-Income Ratio | Without Mortgage | With Mortgage |
| Less than 2.0x | 27 (45.0%) | 93,125 (169,318.2%) |
| 2.0x to 2.9x | 8 (13.3%) | 26 (47.3%) |
| 3.0x to 3.9x | 3 (5.0%) | 7 (12.7%) |
| 4.0x or more | 22 (36.7%) | 11 (20.0%) |
| Total | 60 (100.0%) | 55 (100.0%) |
Real Estate Taxes by Mortgage Status in Elmo
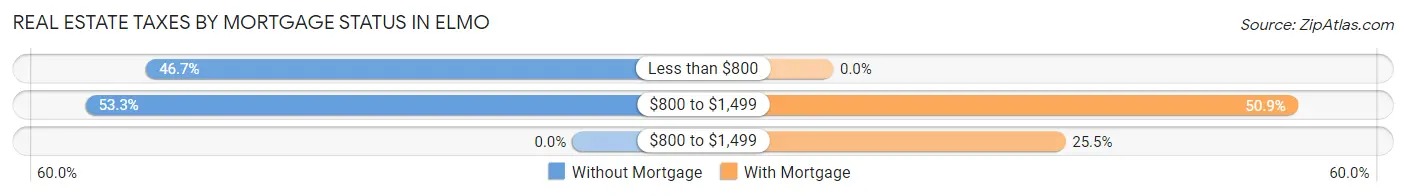
| Property Taxes | Without Mortgage | With Mortgage |
| Less than $800 | 28 (46.7%) | 0 (0.0%) |
| $800 to $1,499 | 32 (53.3%) | 28 (50.9%) |
| $800 to $1,499 | 0 (0.0%) | 14 (25.5%) |
| Total | 60 (100.0%) | 55 (100.0%) |
Health & Disability in Elmo
Health Insurance Coverage by Age in Elmo
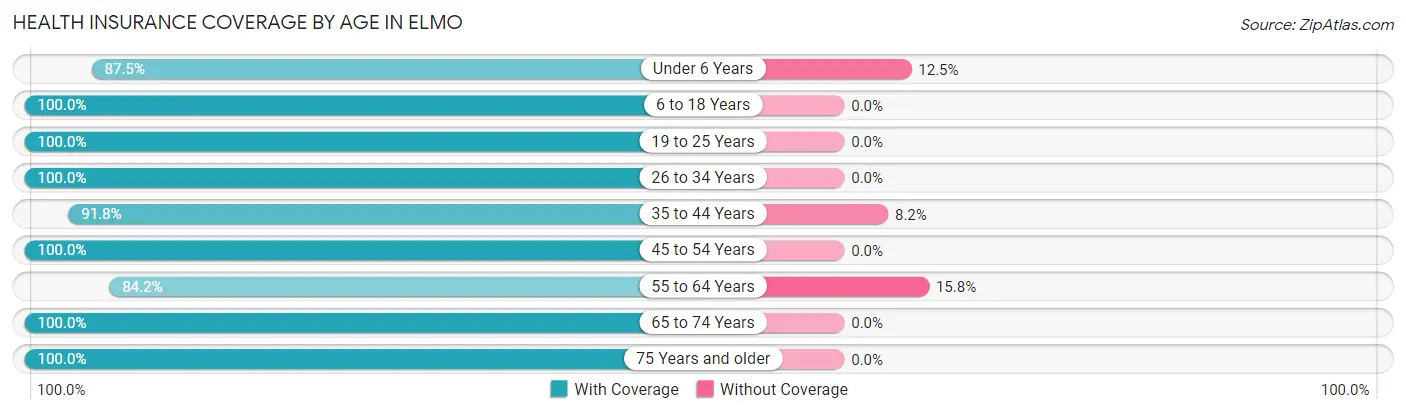
| Age Bracket | With Coverage | Without Coverage |
| Under 6 Years | 21 (87.5%) | 3 (12.5%) |
| 6 to 18 Years | 153 (100.0%) | 0 (0.0%) |
| 19 to 25 Years | 26 (100.0%) | 0 (0.0%) |
| 26 to 34 Years | 29 (100.0%) | 0 (0.0%) |
| 35 to 44 Years | 45 (91.8%) | 4 (8.2%) |
| 45 to 54 Years | 38 (100.0%) | 0 (0.0%) |
| 55 to 64 Years | 48 (84.2%) | 9 (15.8%) |
| 65 to 74 Years | 43 (100.0%) | 0 (0.0%) |
| 75 Years and older | 33 (100.0%) | 0 (0.0%) |
| Total | 436 (96.5%) | 16 (3.5%) |
Health Insurance Coverage by Citizenship Status in Elmo
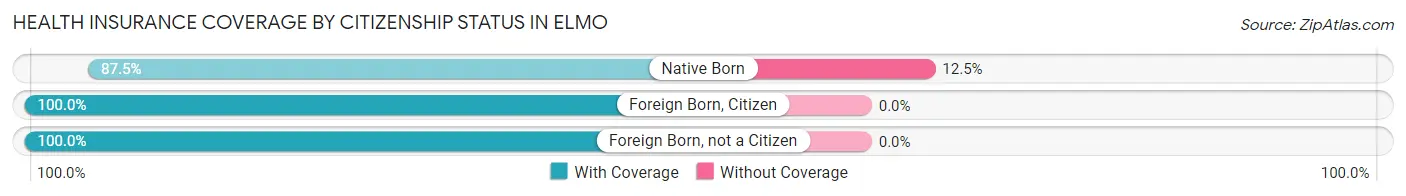
| Citizenship Status | With Coverage | Without Coverage |
| Native Born | 21 (87.5%) | 3 (12.5%) |
| Foreign Born, Citizen | 153 (100.0%) | 0 (0.0%) |
| Foreign Born, not a Citizen | 26 (100.0%) | 0 (0.0%) |
Health Insurance Coverage by Household Income in Elmo
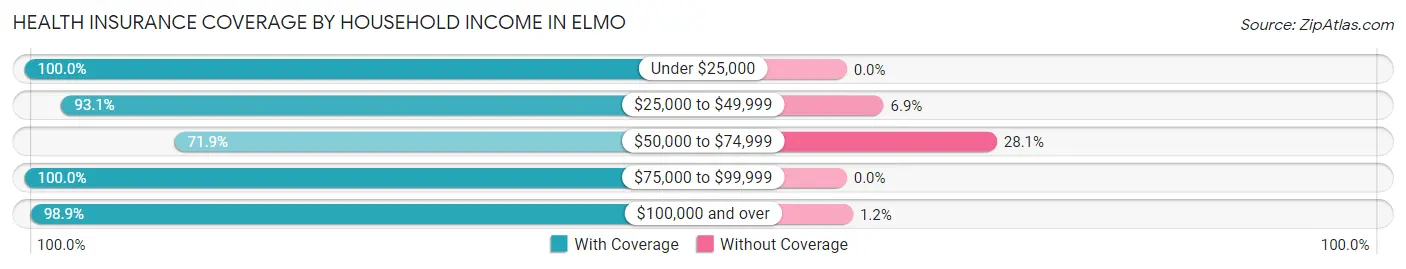
| Household Income | With Coverage | Without Coverage |
| Under $25,000 | 33 (100.0%) | 0 (0.0%) |
| $25,000 to $49,999 | 54 (93.1%) | 4 (6.9%) |
| $50,000 to $74,999 | 23 (71.9%) | 9 (28.1%) |
| $75,000 to $99,999 | 68 (100.0%) | 0 (0.0%) |
| $100,000 and over | 258 (98.9%) | 3 (1.1%) |
Public vs Private Health Insurance Coverage by Age in Elmo
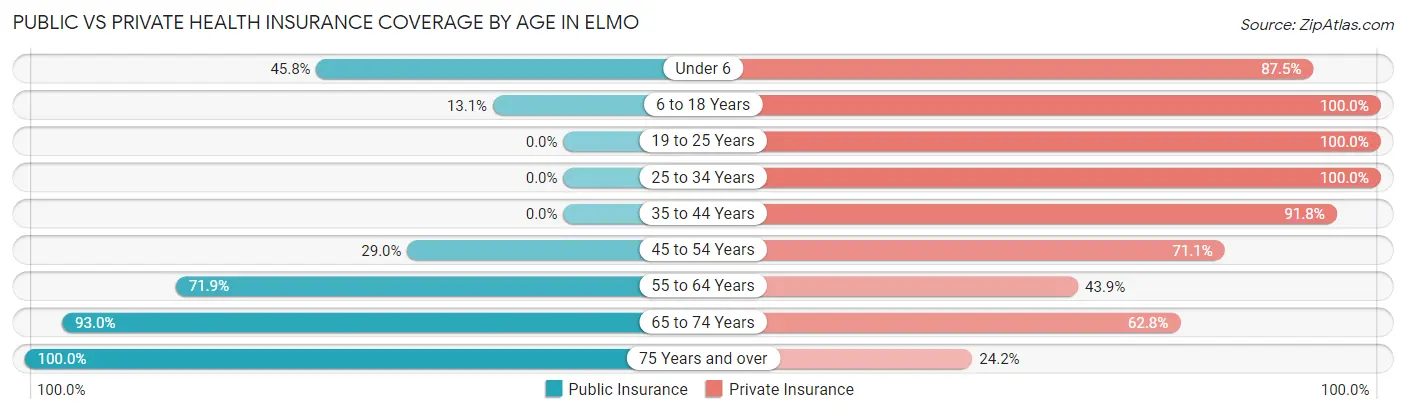
| Age Bracket | Public Insurance | Private Insurance |
| Under 6 | 11 (45.8%) | 21 (87.5%) |
| 6 to 18 Years | 20 (13.1%) | 153 (100.0%) |
| 19 to 25 Years | 0 (0.0%) | 26 (100.0%) |
| 25 to 34 Years | 0 (0.0%) | 29 (100.0%) |
| 35 to 44 Years | 0 (0.0%) | 45 (91.8%) |
| 45 to 54 Years | 11 (28.9%) | 27 (71.1%) |
| 55 to 64 Years | 41 (71.9%) | 25 (43.9%) |
| 65 to 74 Years | 40 (93.0%) | 27 (62.8%) |
| 75 Years and over | 33 (100.0%) | 8 (24.2%) |
| Total | 156 (34.5%) | 361 (79.9%) |
Disability Status by Sex by Age in Elmo
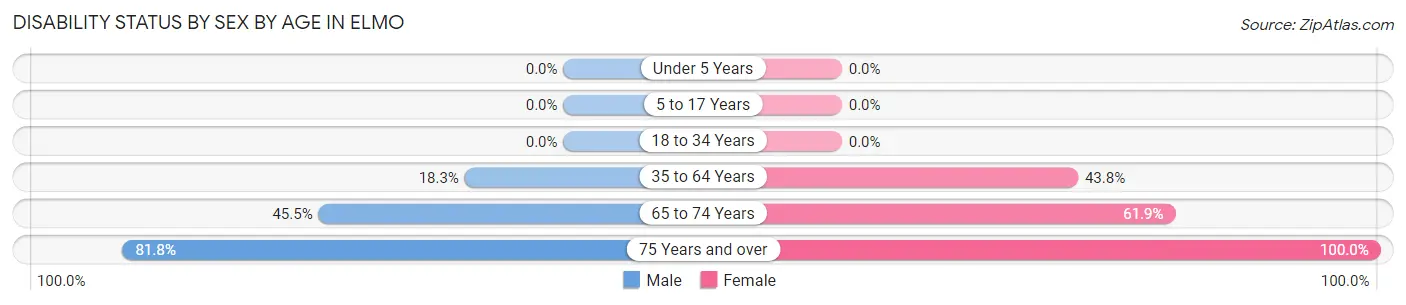
| Age Bracket | Male | Female |
| Under 5 Years | 0 (0.0%) | 0 (0.0%) |
| 5 to 17 Years | 0 (0.0%) | 0 (0.0%) |
| 18 to 34 Years | 0 (0.0%) | 0 (0.0%) |
| 35 to 64 Years | 13 (18.3%) | 32 (43.8%) |
| 65 to 74 Years | 10 (45.5%) | 13 (61.9%) |
| 75 Years and over | 9 (81.8%) | 22 (100.0%) |
Disability Class by Sex by Age in Elmo
Disability Class: Hearing Difficulty
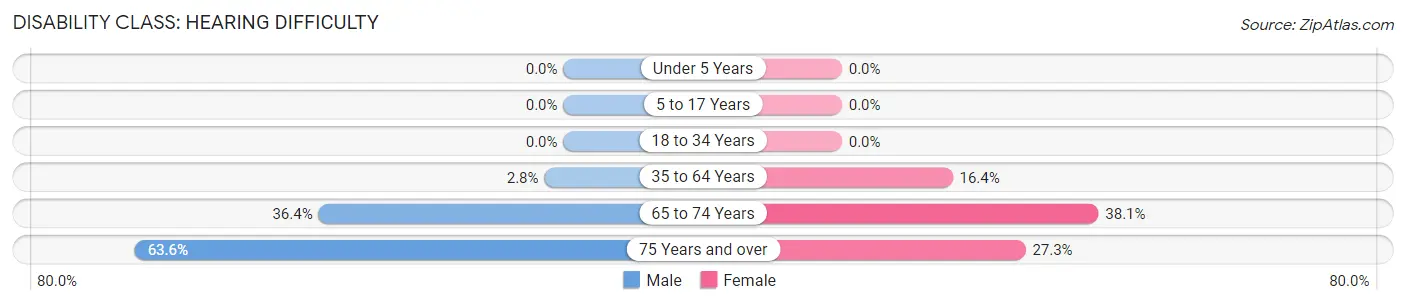
| Age Bracket | Male | Female |
| Under 5 Years | 0 (0.0%) | 0 (0.0%) |
| 5 to 17 Years | 0 (0.0%) | 0 (0.0%) |
| 18 to 34 Years | 0 (0.0%) | 0 (0.0%) |
| 35 to 64 Years | 2 (2.8%) | 12 (16.4%) |
| 65 to 74 Years | 8 (36.4%) | 8 (38.1%) |
| 75 Years and over | 7 (63.6%) | 6 (27.3%) |
Disability Class: Vision Difficulty
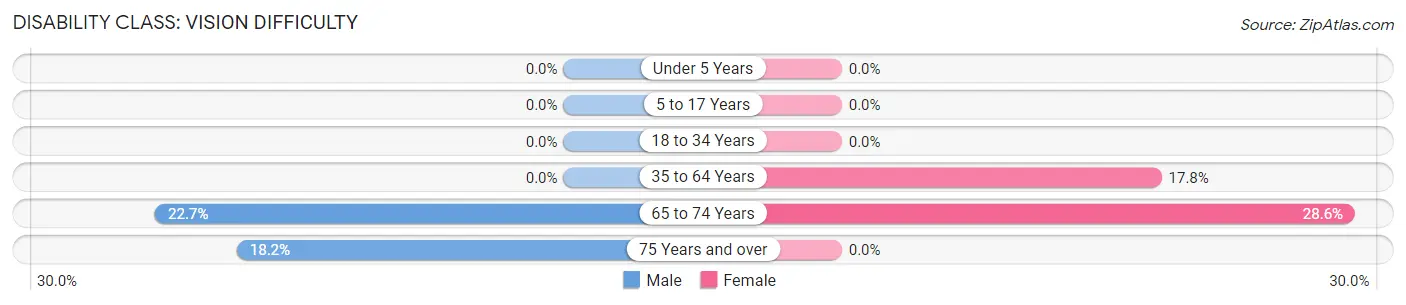
| Age Bracket | Male | Female |
| Under 5 Years | 0 (0.0%) | 0 (0.0%) |
| 5 to 17 Years | 0 (0.0%) | 0 (0.0%) |
| 18 to 34 Years | 0 (0.0%) | 0 (0.0%) |
| 35 to 64 Years | 0 (0.0%) | 13 (17.8%) |
| 65 to 74 Years | 5 (22.7%) | 6 (28.6%) |
| 75 Years and over | 2 (18.2%) | 0 (0.0%) |
Disability Class: Cognitive Difficulty
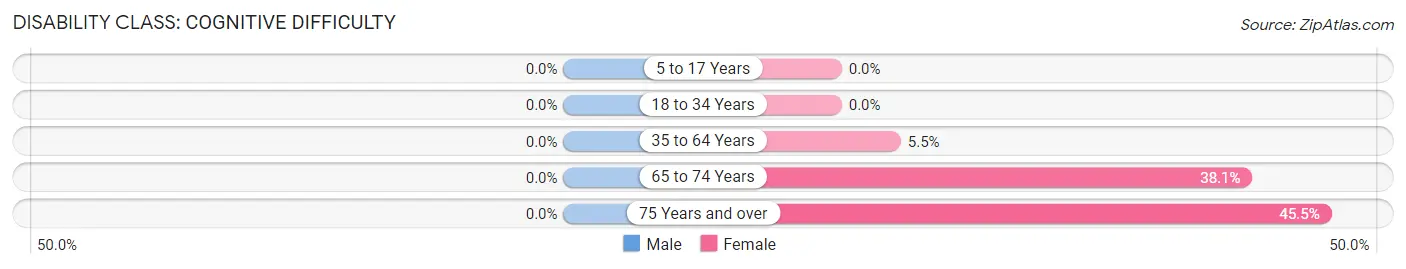
| Age Bracket | Male | Female |
| 5 to 17 Years | 0 (0.0%) | 0 (0.0%) |
| 18 to 34 Years | 0 (0.0%) | 0 (0.0%) |
| 35 to 64 Years | 0 (0.0%) | 4 (5.5%) |
| 65 to 74 Years | 0 (0.0%) | 8 (38.1%) |
| 75 Years and over | 0 (0.0%) | 10 (45.5%) |
Disability Class: Ambulatory Difficulty
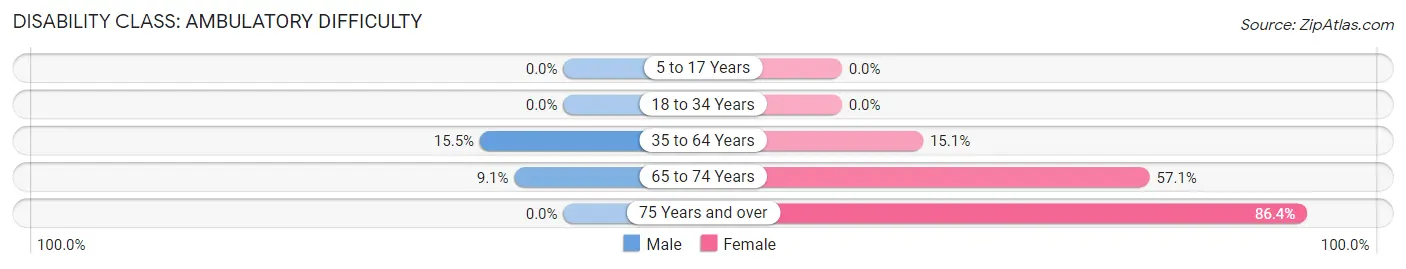
| Age Bracket | Male | Female |
| 5 to 17 Years | 0 (0.0%) | 0 (0.0%) |
| 18 to 34 Years | 0 (0.0%) | 0 (0.0%) |
| 35 to 64 Years | 11 (15.5%) | 11 (15.1%) |
| 65 to 74 Years | 2 (9.1%) | 12 (57.1%) |
| 75 Years and over | 0 (0.0%) | 19 (86.4%) |
Disability Class: Self-Care Difficulty
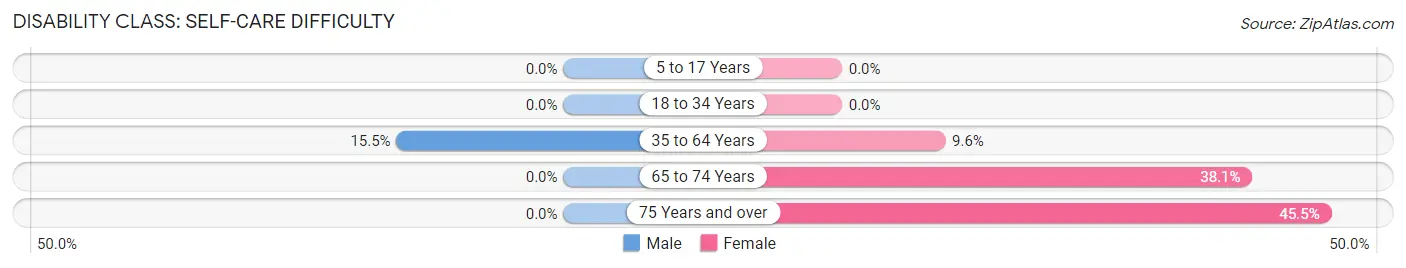
| Age Bracket | Male | Female |
| 5 to 17 Years | 0 (0.0%) | 0 (0.0%) |
| 18 to 34 Years | 0 (0.0%) | 0 (0.0%) |
| 35 to 64 Years | 11 (15.5%) | 7 (9.6%) |
| 65 to 74 Years | 0 (0.0%) | 8 (38.1%) |
| 75 Years and over | 0 (0.0%) | 10 (45.5%) |
Technology Access in Elmo
Computing Device Access in Elmo
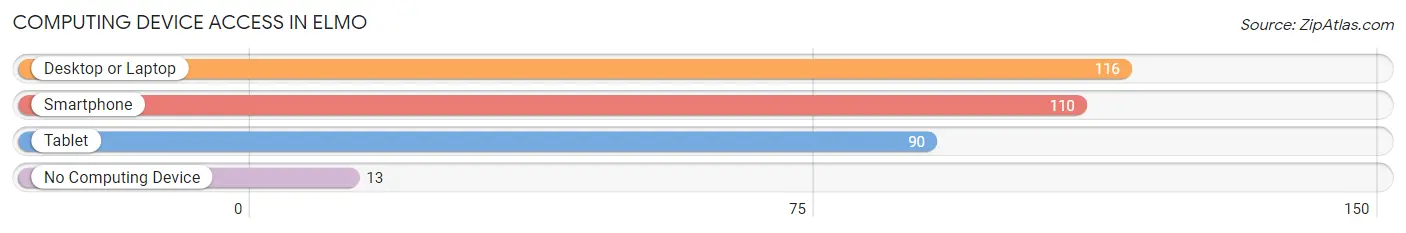
| Device Type | # Households | % Households |
| Desktop or Laptop | 116 | 77.8% |
| Smartphone | 110 | 73.8% |
| Tablet | 90 | 60.4% |
| No Computing Device | 13 | 8.7% |
| Total | 149 | 100.0% |
Internet Access in Elmo
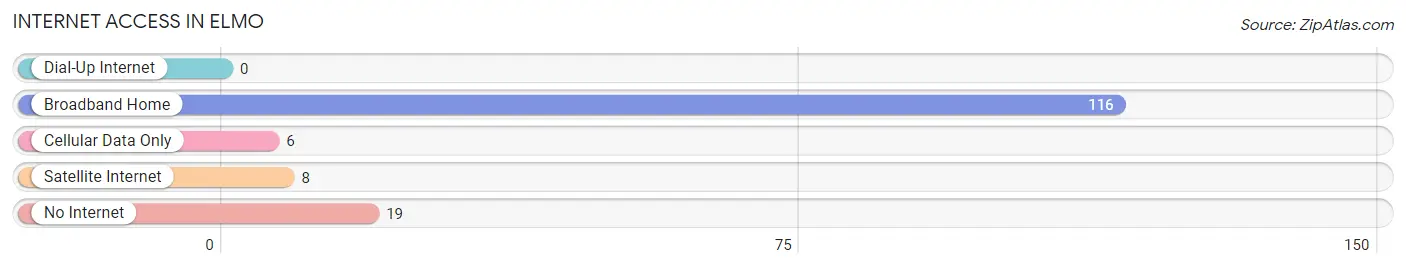
| Internet Type | # Households | % Households |
| Dial-Up Internet | 0 | 0.0% |
| Broadband Home | 116 | 77.8% |
| Cellular Data Only | 6 | 4.0% |
| Satellite Internet | 8 | 5.4% |
| No Internet | 19 | 12.8% |
| Total | 149 | 100.0% |
Elmo Summary
Elmo, Utah is a small town located in the southeastern corner of the state, near the border of Colorado. It is situated in the San Rafael Swell, a large geological formation that is part of the Colorado Plateau. The town is located in Emery County, and is home to about 500 people.
History
Elmo was founded in 1883 by a group of Mormon settlers who were sent to the area by the Church of Jesus Christ of Latter-day Saints. The settlers were sent to the area to establish a farming community, and the town was named after one of the settlers, Elmo Johnson. The town was incorporated in 1891, and the first post office was established in 1892.
The town grew slowly over the years, and by the early 1900s, it had a population of about 200 people. The town was primarily an agricultural community, and the main crops grown were wheat, corn, and hay. The town also had a few businesses, including a general store, a blacksmith shop, and a hotel.
In the 1920s, the town began to experience a period of growth, as the nearby coal mines began to expand. The coal mines provided employment for many of the town’s residents, and the population grew to about 500 people. The town also had a few other businesses, including a bank, a movie theater, and a few restaurants.
Geography
Elmo is located in the San Rafael Swell, a large geological formation that is part of the Colorado Plateau. The town is situated at an elevation of 5,400 feet, and is surrounded by mountains and canyons. The town is located in Emery County, and is about 30 miles from the nearest major city, Price.
The climate in Elmo is semi-arid, with hot summers and cold winters. The average annual temperature is about 50 degrees Fahrenheit, and the average annual precipitation is about 10 inches.
Economy
The economy of Elmo is primarily based on agriculture and tourism. The town is home to several farms, which produce wheat, corn, hay, and other crops. The town also has a few businesses, including a general store, a bank, and a few restaurants.
Tourism is also an important part of the economy, as the town is located near several popular outdoor recreation areas, including the San Rafael Swell, the Manti-La Sal National Forest, and the Fishlake National Forest. The town also has a few bed and breakfasts, and is a popular destination for hunters and fishermen.
Demographics
As of the 2010 census, the population of Elmo was 498 people. The racial makeup of the town was 97.2% White, 0.2% African American, 0.2% Native American, 0.2% Asian, 0.2% Pacific Islander, 0.4% from other races, and 1.8% from two or more races. The median household income was $37,500, and the median family income was $41,250. The per capita income was $17,857. About 8.2% of the population was below the poverty line.
Common Questions
What is Per Capita Income in Elmo?
Per Capita income in Elmo is $25,713.
What is the Median Family Income in Elmo?
Median Family Income in Elmo is $93,333.
What is the Median Household income in Elmo?
Median Household Income in Elmo is $62,917.
What is Inequality or Gini Index in Elmo?
Inequality or Gini Index in Elmo is 0.39.
What is the Total Population of Elmo?
Total Population of Elmo is 487.
What is the Total Male Population of Elmo?
Total Male Population of Elmo is 278.
What is the Total Female Population of Elmo?
Total Female Population of Elmo is 209.
What is the Ratio of Males per 100 Females in Elmo?
There are 133.01 Males per 100 Females in Elmo.
What is the Ratio of Females per 100 Males in Elmo?
There are 75.18 Females per 100 Males in Elmo.
What is the Median Population Age in Elmo?
Median Population Age in Elmo is 38.3 Years.
What is the Average Family Size in Elmo
Average Family Size in Elmo is 4.4 People.
What is the Average Household Size in Elmo
Average Household Size in Elmo is 3.2 People.
How Large is the Labor Force in Elmo?
There are 165 People in the Labor Forcein in Elmo.
What is the Percentage of People in the Labor Force in Elmo?
47.3% of People are in the Labor Force in Elmo.
What is the Unemployment Rate in Elmo?
Unemployment Rate in Elmo is 4.1%.