Lake Shore, UT Map & Demographics
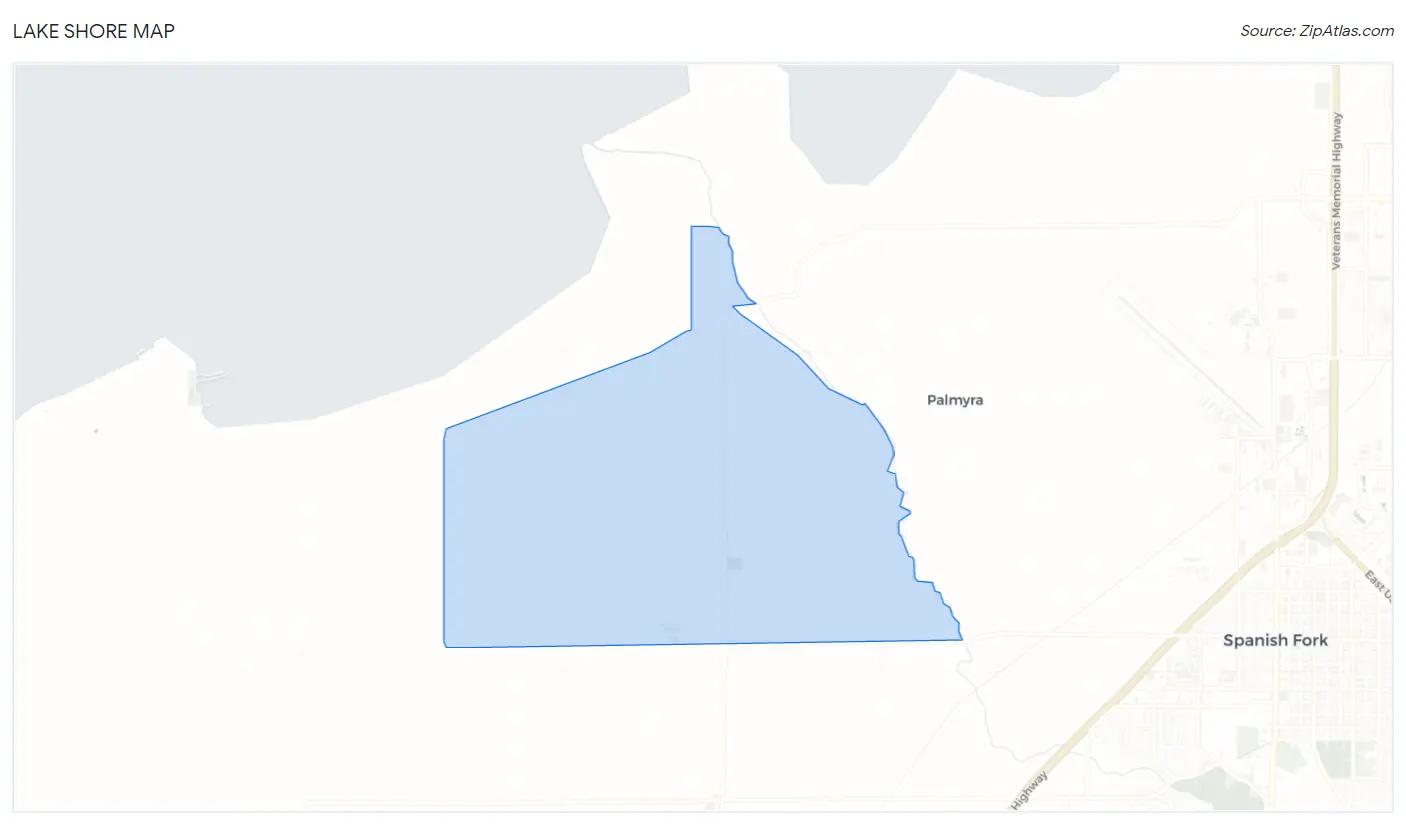
Lake Shore Map
Lake Shore Overview
$24,275
PER CAPITA INCOME
$105,667
AVG FAMILY INCOME
$91,912
AVG HOUSEHOLD INCOME
0.25
INEQUALITY / GINI INDEX
1,235
TOTAL POPULATION
524
MALE POPULATION
711
FEMALE POPULATION
73.70
MALES / 100 FEMALES
135.69
FEMALES / 100 MALES
20.1
MEDIAN AGE
5.0
AVG FAMILY SIZE
4.5
AVG HOUSEHOLD SIZE
562
LABOR FORCE [ PEOPLE ]
70.5%
PERCENT IN LABOR FORCE
13.9%
UNEMPLOYMENT RATE
Income in Lake Shore
Income Overview in Lake Shore
Per Capita Income in Lake Shore is $24,275, while median incomes of families and households are $105,667 and $91,912 respectively.
| Characteristic | Number | Measure |
| Per Capita Income | 1,235 | $24,275 |
| Median Family Income | 234 | $105,667 |
| Mean Family Income | 234 | $115,743 |
| Median Household Income | 274 | $91,912 |
| Mean Household Income | 274 | $107,980 |
| Income Deficit | 234 | $0 |
| Wage / Income Gap (%) | 1,235 | 0.00% |
| Wage / Income Gap ($) | 1,235 | 100.00¢ per $1 |
| Gini / Inequality Index | 1,235 | 0.25 |
Earnings by Sex in Lake Shore
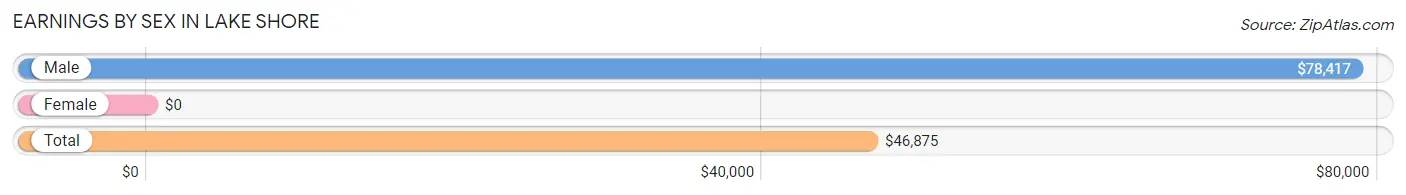
| Sex | Number | Average Earnings |
| Male | 293 (50.9%) | $78,417 |
| Female | 283 (49.1%) | $0 |
| Total | 576 (100.0%) | $46,875 |
Earnings by Sex by Income Bracket in Lake Shore
The most common earnings brackets in Lake Shore are $75,000 to $99,999 for men (151 | 51.5%) and $10,000 to $12,499 for women (91 | 32.2%).
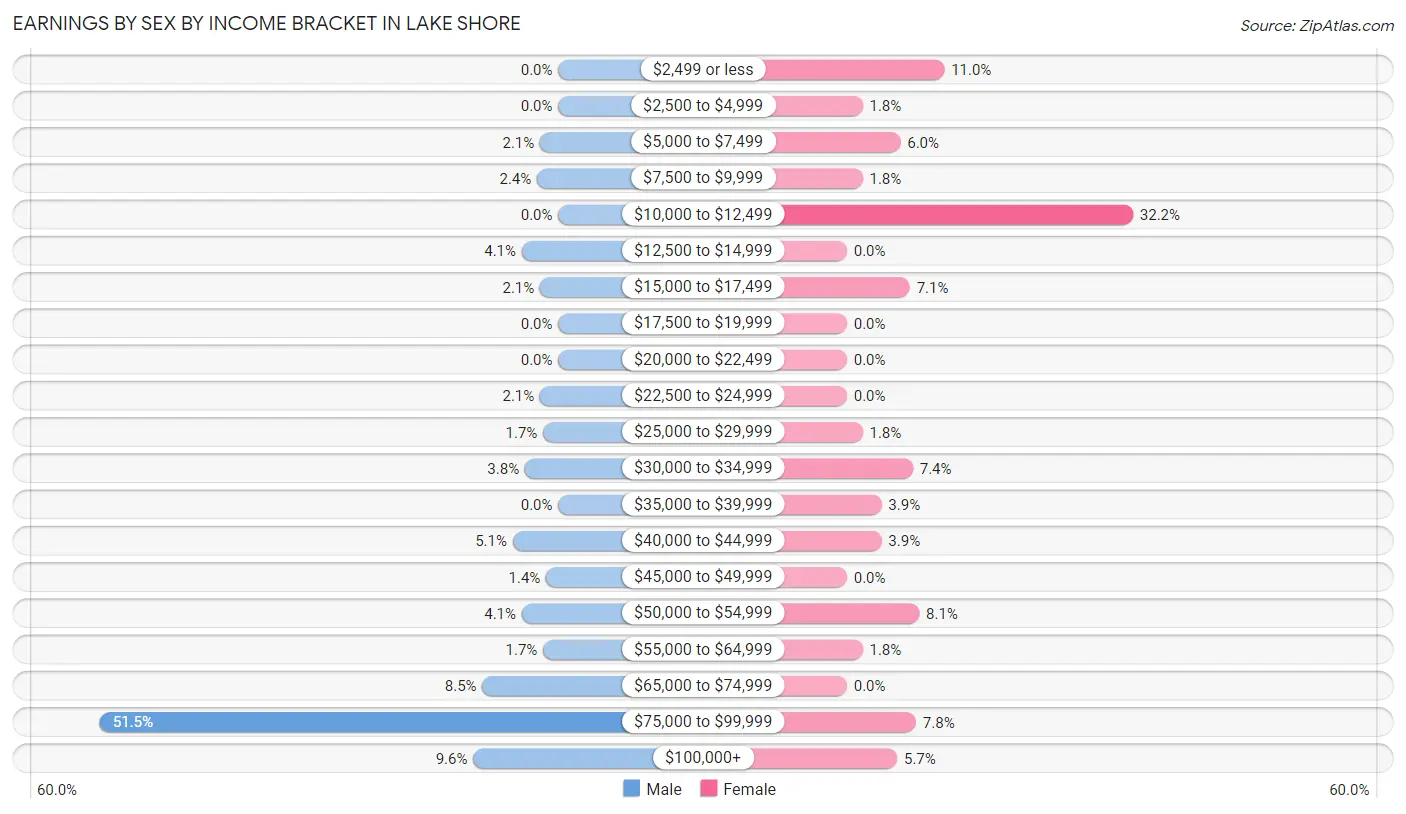
| Income | Male | Female |
| $2,499 or less | 0 (0.0%) | 31 (11.0%) |
| $2,500 to $4,999 | 0 (0.0%) | 5 (1.8%) |
| $5,000 to $7,499 | 6 (2.1%) | 17 (6.0%) |
| $7,500 to $9,999 | 7 (2.4%) | 5 (1.8%) |
| $10,000 to $12,499 | 0 (0.0%) | 91 (32.2%) |
| $12,500 to $14,999 | 12 (4.1%) | 0 (0.0%) |
| $15,000 to $17,499 | 6 (2.1%) | 20 (7.1%) |
| $17,500 to $19,999 | 0 (0.0%) | 0 (0.0%) |
| $20,000 to $22,499 | 0 (0.0%) | 0 (0.0%) |
| $22,500 to $24,999 | 6 (2.1%) | 0 (0.0%) |
| $25,000 to $29,999 | 5 (1.7%) | 5 (1.8%) |
| $30,000 to $34,999 | 11 (3.7%) | 21 (7.4%) |
| $35,000 to $39,999 | 0 (0.0%) | 11 (3.9%) |
| $40,000 to $44,999 | 15 (5.1%) | 11 (3.9%) |
| $45,000 to $49,999 | 4 (1.4%) | 0 (0.0%) |
| $50,000 to $54,999 | 12 (4.1%) | 23 (8.1%) |
| $55,000 to $64,999 | 5 (1.7%) | 5 (1.8%) |
| $65,000 to $74,999 | 25 (8.5%) | 0 (0.0%) |
| $75,000 to $99,999 | 151 (51.5%) | 22 (7.8%) |
| $100,000+ | 28 (9.6%) | 16 (5.7%) |
| Total | 293 (100.0%) | 283 (100.0%) |
Earnings by Sex by Educational Attainment in Lake Shore
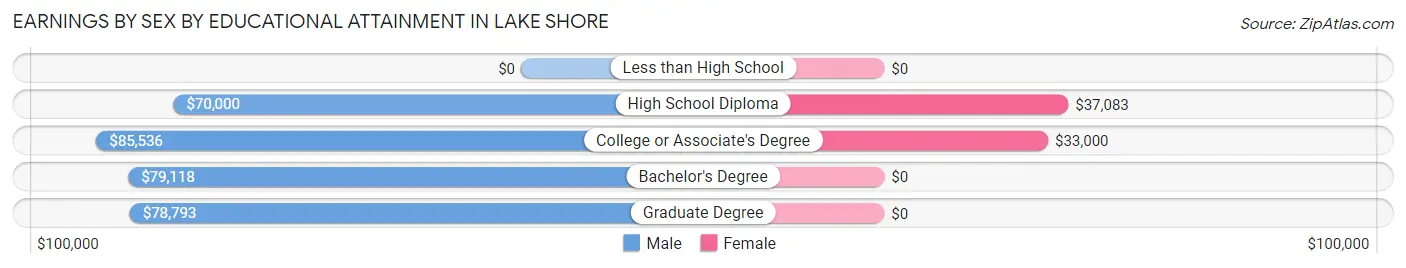
| Educational Attainment | Male Income | Female Income |
| Less than High School | - | - |
| High School Diploma | $70,000 | $37,083 |
| College or Associate's Degree | $85,536 | $33,000 |
| Bachelor's Degree | $79,118 | $0 |
| Graduate Degree | $78,793 | $0 |
| Total | $78,850 | $0 |
Family Income in Lake Shore
Family Income Brackets in Lake Shore
According to the Lake Shore family income data, there are 75 families falling into the $100,000 to $149,999 income range, which is the most common income bracket and makes up 32.1% of all families.
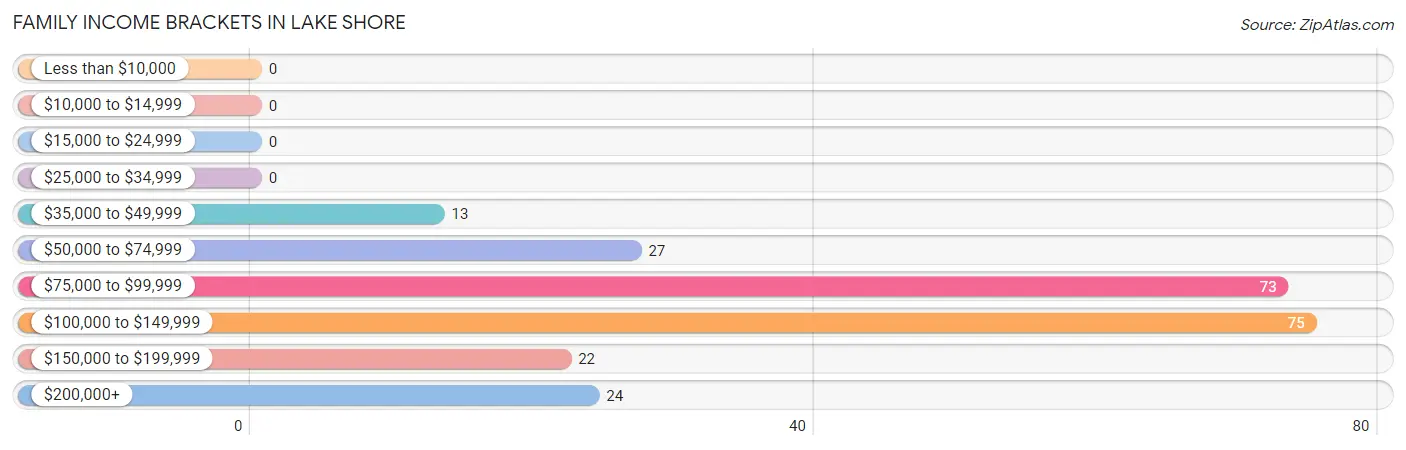
| Income Bracket | # Families | % Families |
| Less than $10,000 | 0 | 0.0% |
| $10,000 to $14,999 | 0 | 0.0% |
| $15,000 to $24,999 | 0 | 0.0% |
| $25,000 to $34,999 | 0 | 0.0% |
| $35,000 to $49,999 | 13 | 5.6% |
| $50,000 to $74,999 | 27 | 11.5% |
| $75,000 to $99,999 | 73 | 31.2% |
| $100,000 to $149,999 | 75 | 32.1% |
| $150,000 to $199,999 | 22 | 9.4% |
| $200,000+ | 24 | 10.3% |
Family Income by Famaliy Size in Lake Shore
5-person families (46 | 19.7%) account for the highest median family income in Lake Shore with $187,794 per family, while 5-person families (46 | 19.7%) have the highest median income of $37,559 per family member.
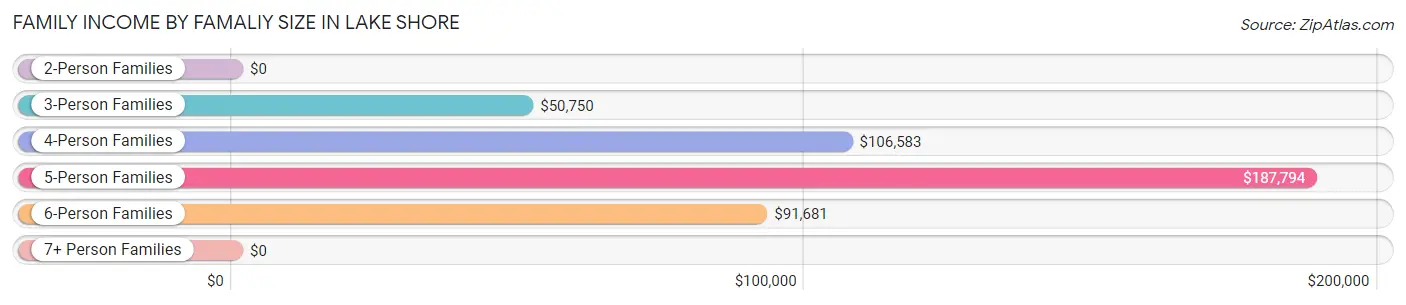
| Income Bracket | # Families | Median Income |
| 2-Person Families | 42 (17.9%) | $0 |
| 3-Person Families | 19 (8.1%) | $50,750 |
| 4-Person Families | 39 (16.7%) | $106,583 |
| 5-Person Families | 46 (19.7%) | $187,794 |
| 6-Person Families | 78 (33.3%) | $91,681 |
| 7+ Person Families | 10 (4.3%) | $0 |
| Total | 234 (100.0%) | $105,667 |
Family Income by Number of Earners in Lake Shore
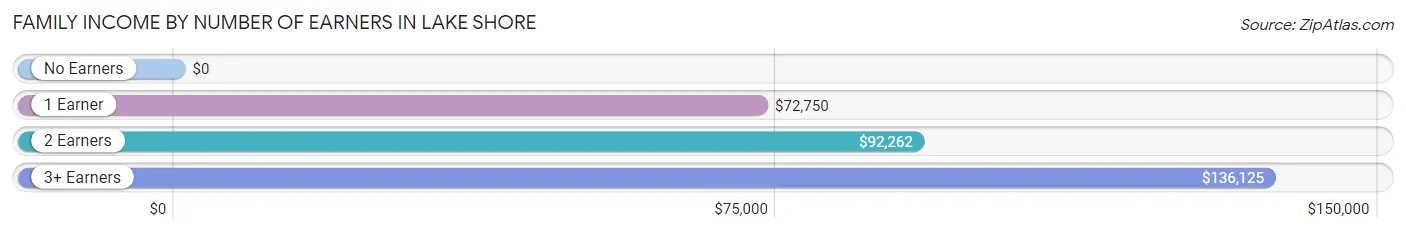
| Number of Earners | # Families | Median Income |
| No Earners | 0 (0.0%) | $0 |
| 1 Earner | 49 (20.9%) | $72,750 |
| 2 Earners | 114 (48.7%) | $92,262 |
| 3+ Earners | 71 (30.3%) | $136,125 |
| Total | 234 (100.0%) | $105,667 |
Household Income in Lake Shore
Household Income Brackets in Lake Shore
With 90 households falling in the category, the $75,000 to $99,999 income range is the most frequent in Lake Shore, accounting for 32.9% of all households.
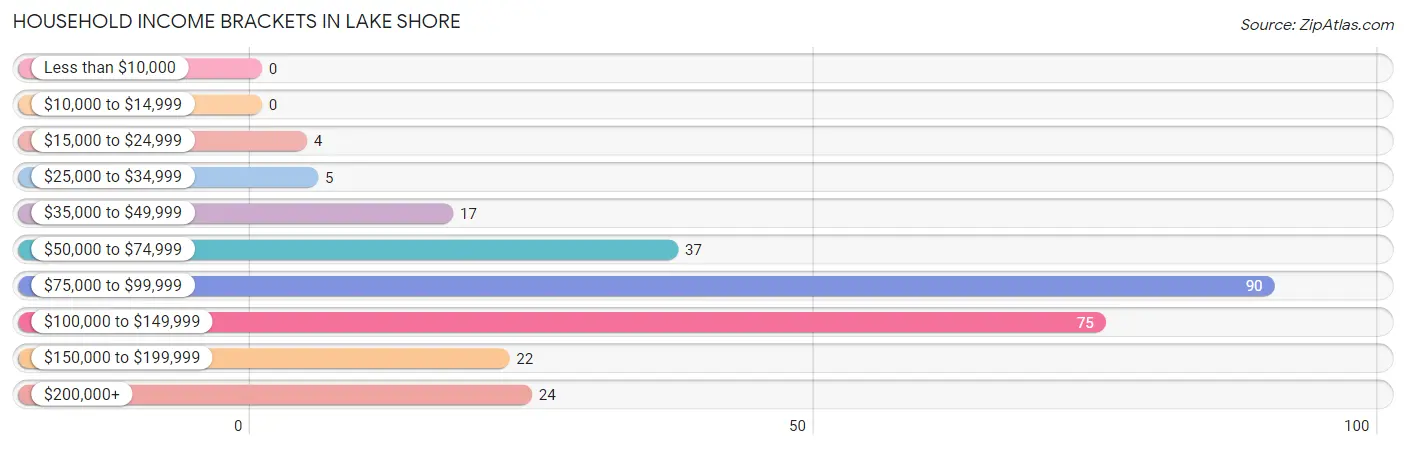
| Income Bracket | # Households | % Households |
| Less than $10,000 | 0 | 0.0% |
| $10,000 to $14,999 | 0 | 0.0% |
| $15,000 to $24,999 | 4 | 1.5% |
| $25,000 to $34,999 | 5 | 1.8% |
| $35,000 to $49,999 | 17 | 6.2% |
| $50,000 to $74,999 | 37 | 13.5% |
| $75,000 to $99,999 | 90 | 32.8% |
| $100,000 to $149,999 | 75 | 27.4% |
| $150,000 to $199,999 | 22 | 8.0% |
| $200,000+ | 24 | 8.8% |
Household Income by Householder Age in Lake Shore
The median household income in Lake Shore is $91,912, with the highest median household income of $119,250 found in the 45 to 64 years age bracket for the primary householder. A total of 143 households (52.2%) fall into this category.
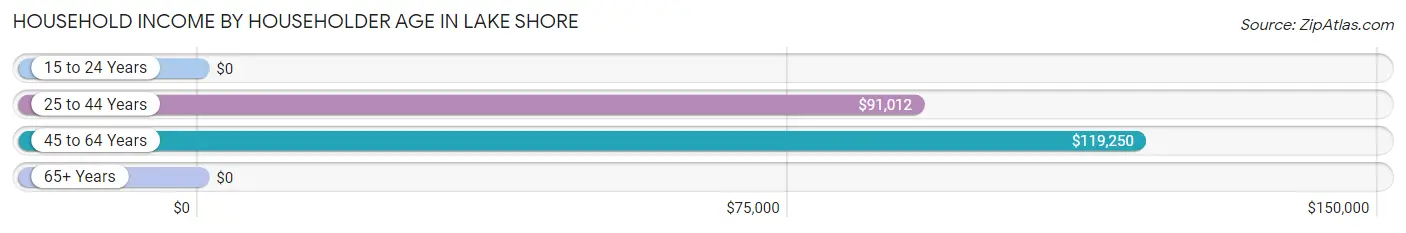
| Income Bracket | # Households | Median Income |
| 15 to 24 Years | 0 (0.0%) | $0 |
| 25 to 44 Years | 117 (42.7%) | $91,012 |
| 45 to 64 Years | 143 (52.2%) | $119,250 |
| 65+ Years | 14 (5.1%) | $0 |
| Total | 274 (100.0%) | $91,912 |
Poverty in Lake Shore
Income Below Poverty by Sex and Age in Lake Shore
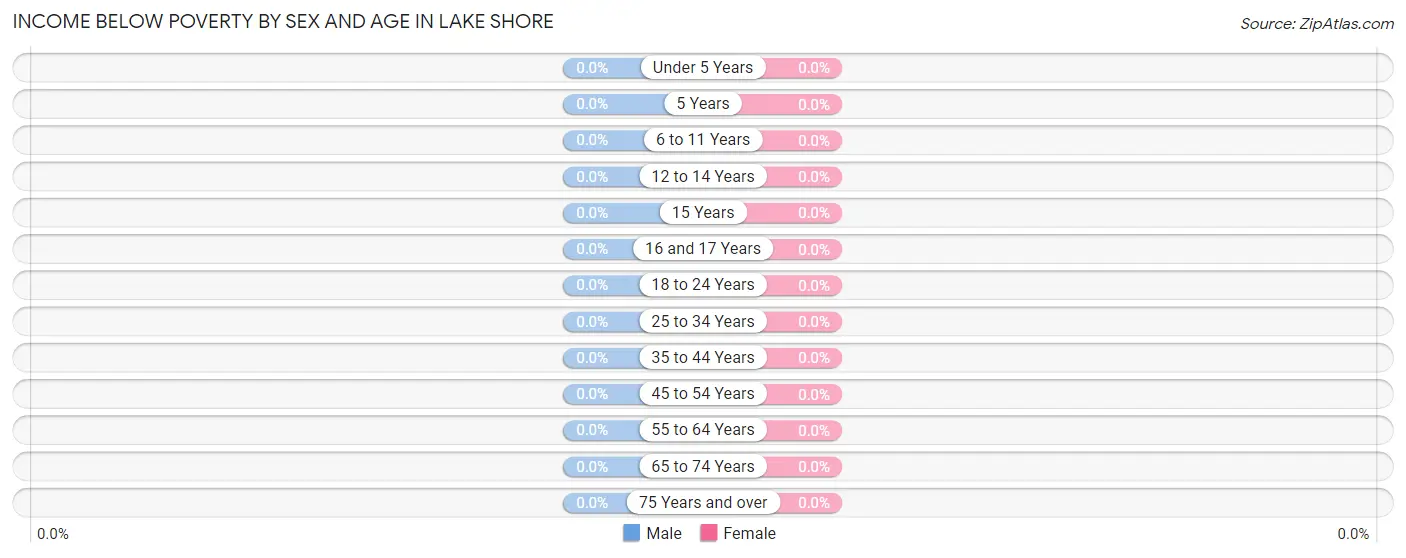
| Age Bracket | Male | Female |
| Under 5 Years | 0 (0.0%) | 0 (0.0%) |
| 5 Years | 0 (0.0%) | 0 (0.0%) |
| 6 to 11 Years | 0 (0.0%) | 0 (0.0%) |
| 12 to 14 Years | 0 (0.0%) | 0 (0.0%) |
| 15 Years | 0 (0.0%) | 0 (0.0%) |
| 16 and 17 Years | 0 (0.0%) | 0 (0.0%) |
| 18 to 24 Years | 0 (0.0%) | 0 (0.0%) |
| 25 to 34 Years | 0 (0.0%) | 0 (0.0%) |
| 35 to 44 Years | 0 (0.0%) | 0 (0.0%) |
| 45 to 54 Years | 0 (0.0%) | 0 (0.0%) |
| 55 to 64 Years | 0 (0.0%) | 0 (0.0%) |
| 65 to 74 Years | 0 (0.0%) | 0 (0.0%) |
| 75 Years and over | 0 (0.0%) | 0 (0.0%) |
| Total | 0 (0.0%) | 0 (0.0%) |
Income Above Poverty by Sex and Age in Lake Shore
According to the poverty statistics in Lake Shore, males aged under 5 years and females aged under 5 years are the age groups that are most secure financially, with 100.0% of males and 100.0% of females in these age groups living above the poverty line.
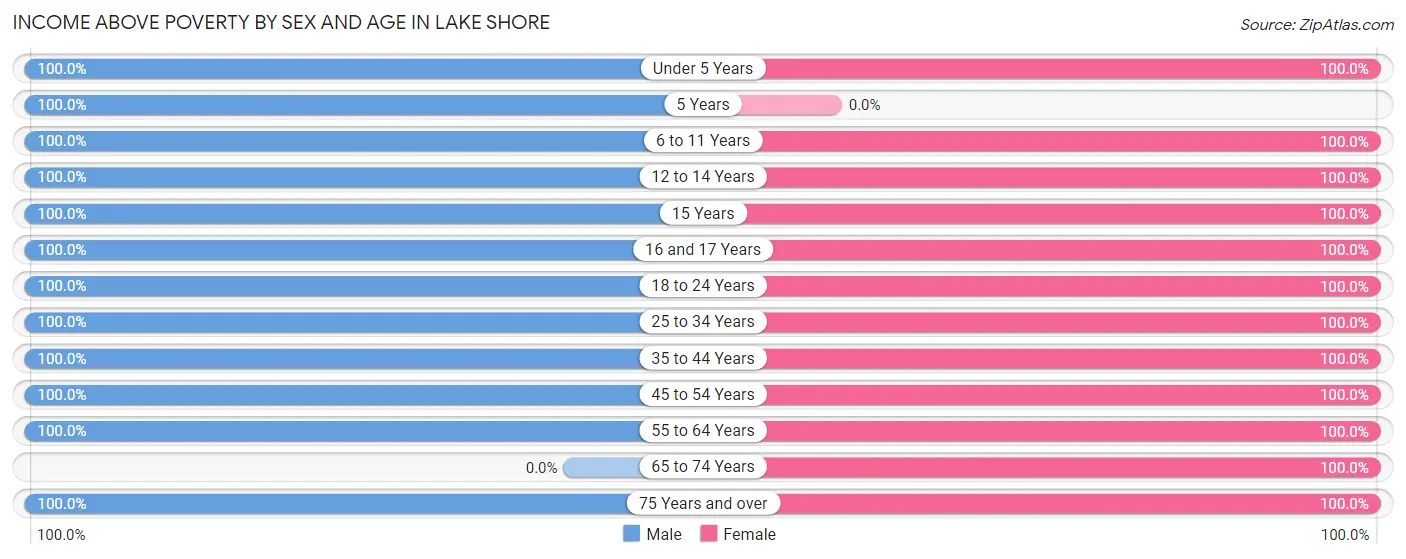
| Age Bracket | Male | Female |
| Under 5 Years | 28 (100.0%) | 10 (100.0%) |
| 5 Years | 5 (100.0%) | 0 (0.0%) |
| 6 to 11 Years | 48 (100.0%) | 199 (100.0%) |
| 12 to 14 Years | 27 (100.0%) | 35 (100.0%) |
| 15 Years | 80 (100.0%) | 6 (100.0%) |
| 16 and 17 Years | 6 (100.0%) | 110 (100.0%) |
| 18 to 24 Years | 40 (100.0%) | 50 (100.0%) |
| 25 to 34 Years | 35 (100.0%) | 25 (100.0%) |
| 35 to 44 Years | 111 (100.0%) | 20 (100.0%) |
| 45 to 54 Years | 85 (100.0%) | 192 (100.0%) |
| 55 to 64 Years | 55 (100.0%) | 31 (100.0%) |
| 65 to 74 Years | 0 (0.0%) | 10 (100.0%) |
| 75 Years and over | 4 (100.0%) | 8 (100.0%) |
| Total | 524 (100.0%) | 696 (100.0%) |
Income Below Poverty Among Married-Couple Families in Lake Shore
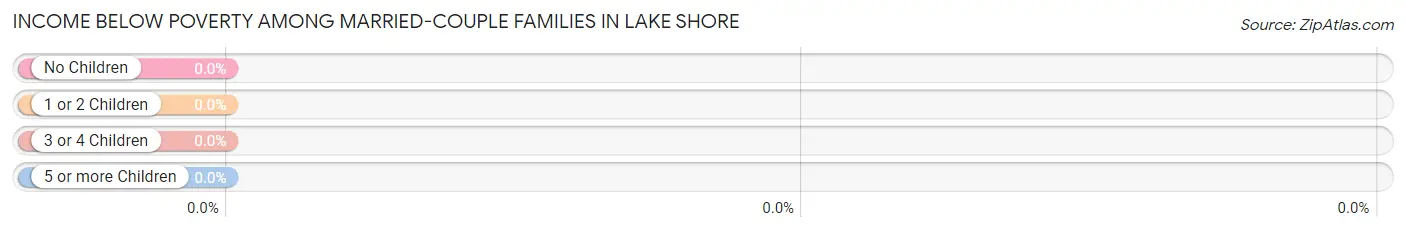
| Children | Above Poverty | Below Poverty |
| No Children | 66 (100.0%) | 0 (0.0%) |
| 1 or 2 Children | 74 (100.0%) | 0 (0.0%) |
| 3 or 4 Children | 79 (100.0%) | 0 (0.0%) |
| 5 or more Children | 5 (100.0%) | 0 (0.0%) |
| Total | 224 (100.0%) | 0 (0.0%) |
Income Below Poverty Among Single-Parent Households in Lake Shore
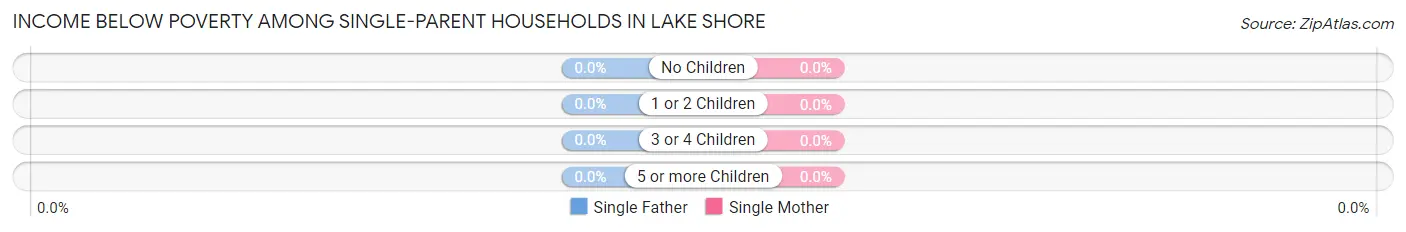
| Children | Single Father | Single Mother |
| No Children | 0 (0.0%) | 0 (0.0%) |
| 1 or 2 Children | 0 (0.0%) | 0 (0.0%) |
| 3 or 4 Children | 0 (0.0%) | 0 (0.0%) |
| 5 or more Children | 0 (0.0%) | 0 (0.0%) |
| Total | 0 (0.0%) | 0 (0.0%) |
Income Below Poverty Among Married-Couple vs Single-Parent Households in Lake Shore
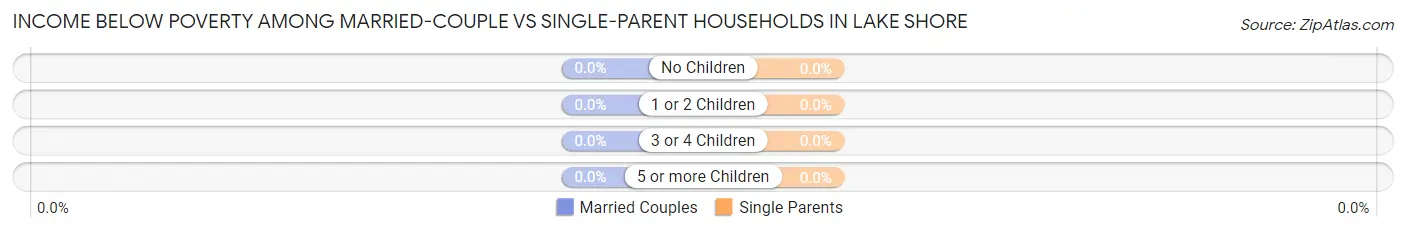
| Children | Married-Couple Families | Single-Parent Households |
| No Children | 0 (0.0%) | 0 (0.0%) |
| 1 or 2 Children | 0 (0.0%) | 0 (0.0%) |
| 3 or 4 Children | 0 (0.0%) | 0 (0.0%) |
| 5 or more Children | 0 (0.0%) | 0 (0.0%) |
| Total | 0 (0.0%) | 0 (0.0%) |
Race in Lake Shore
The most populous races in Lake Shore are White / Caucasian (1,226 | 99.3%), Two or more Races (8 | 0.6%), and Hispanic or Latino (5 | 0.4%).
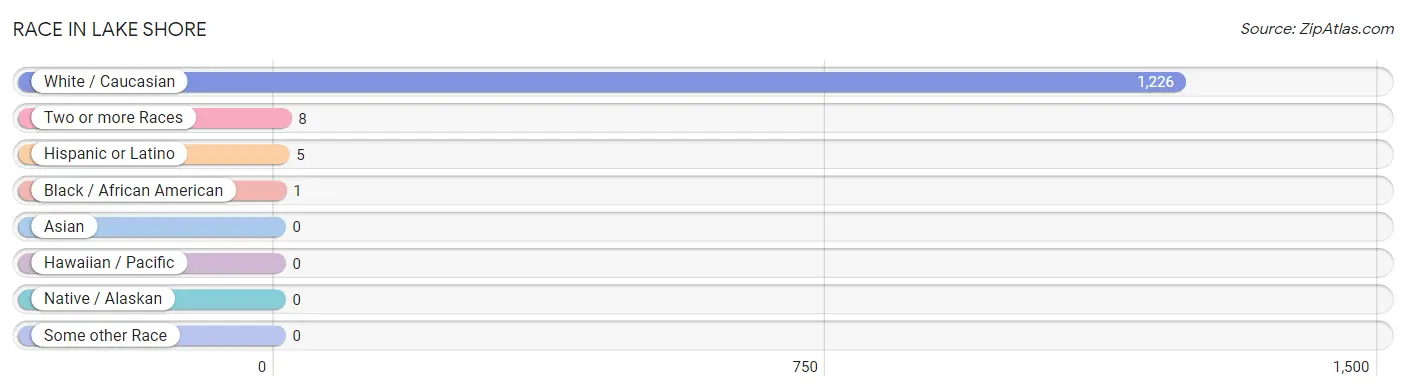
| Race | # Population | % Population |
| Asian | 0 | 0.0% |
| Black / African American | 1 | 0.1% |
| Hawaiian / Pacific | 0 | 0.0% |
| Hispanic or Latino | 5 | 0.4% |
| Native / Alaskan | 0 | 0.0% |
| White / Caucasian | 1,226 | 99.3% |
| Two or more Races | 8 | 0.6% |
| Some other Race | 0 | 0.0% |
| Total | 1,235 | 100.0% |
Ancestry in Lake Shore
The most populous ancestries reported in Lake Shore are English (622 | 50.4%), German (148 | 12.0%), Scottish (107 | 8.7%), Scotch-Irish (58 | 4.7%), and Swiss (54 | 4.4%), together accounting for 80.1% of all Lake Shore residents.
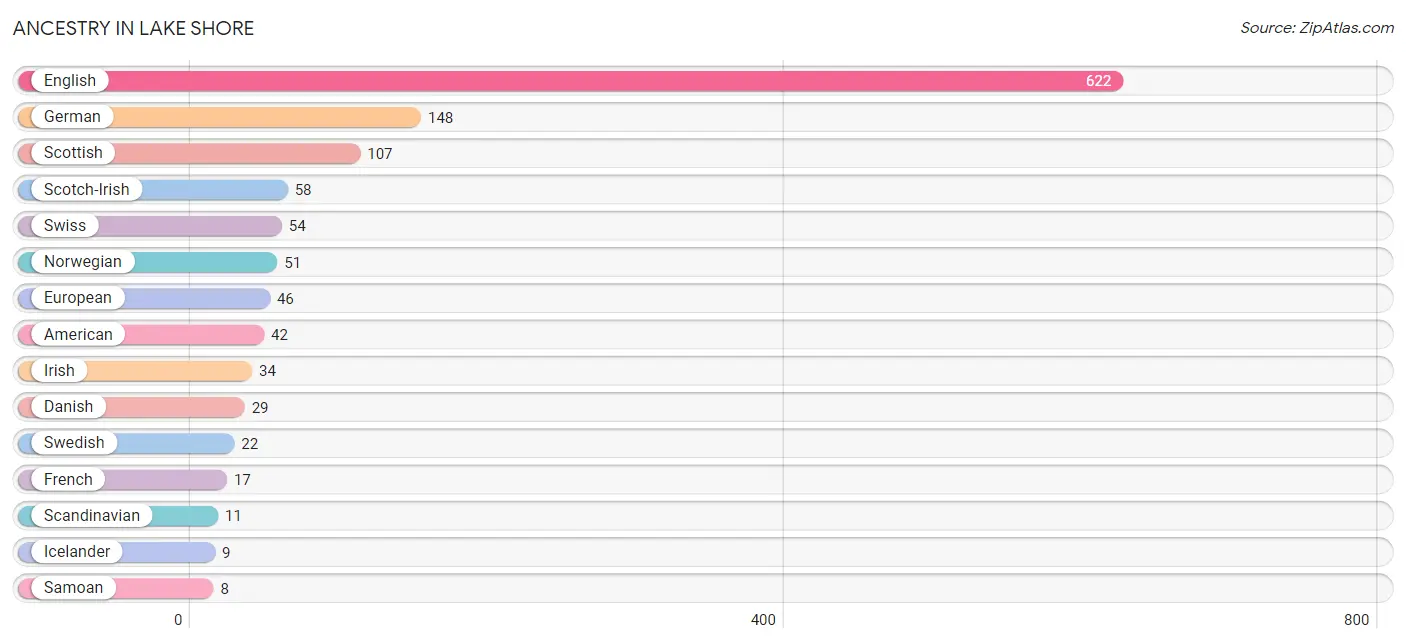
| Ancestry | # Population | % Population |
| American | 42 | 3.4% |
| Danish | 29 | 2.4% |
| English | 622 | 50.4% |
| European | 46 | 3.7% |
| French | 17 | 1.4% |
| German | 148 | 12.0% |
| Icelander | 9 | 0.7% |
| Irish | 34 | 2.8% |
| Italian | 5 | 0.4% |
| Mexican | 5 | 0.4% |
| Norwegian | 51 | 4.1% |
| Samoan | 8 | 0.6% |
| Scandinavian | 11 | 0.9% |
| Scotch-Irish | 58 | 4.7% |
| Scottish | 107 | 8.7% |
| Swedish | 22 | 1.8% |
| Swiss | 54 | 4.4% |
| Welsh | 8 | 0.6% | View All 18 Rows |
Immigrants in Lake Shore
The most numerous immigrant groups reported in Lake Shore came from Europe (10 | 0.8%), Germany (10 | 0.8%), and Western Europe (10 | 0.8%), together accounting for 2.4% of all Lake Shore residents.
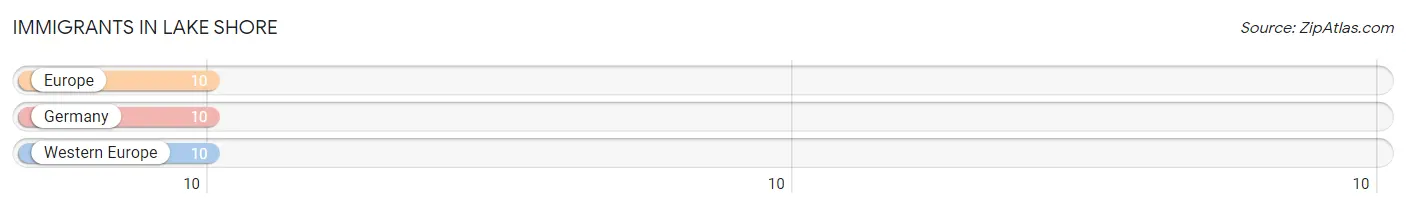
| Immigration Origin | # Population | % Population |
| Europe | 10 | 0.8% |
| Germany | 10 | 0.8% |
| Western Europe | 10 | 0.8% | View All 3 Rows |
Sex and Age in Lake Shore
Sex and Age in Lake Shore
The most populous age groups in Lake Shore are 15 to 19 Years (106 | 20.2%) for men and 45 to 49 Years (168 | 23.6%) for women.
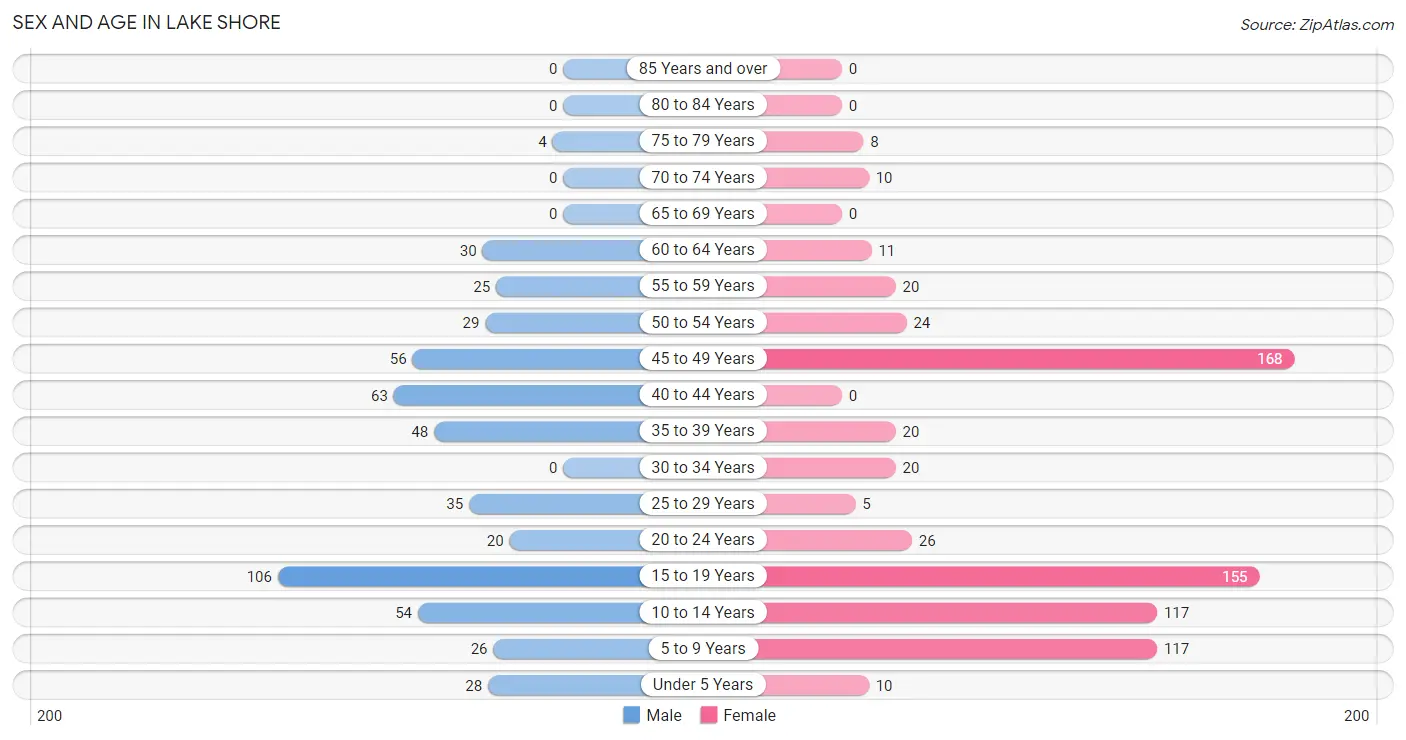
| Age Bracket | Male | Female |
| Under 5 Years | 28 (5.3%) | 10 (1.4%) |
| 5 to 9 Years | 26 (5.0%) | 117 (16.5%) |
| 10 to 14 Years | 54 (10.3%) | 117 (16.5%) |
| 15 to 19 Years | 106 (20.2%) | 155 (21.8%) |
| 20 to 24 Years | 20 (3.8%) | 26 (3.7%) |
| 25 to 29 Years | 35 (6.7%) | 5 (0.7%) |
| 30 to 34 Years | 0 (0.0%) | 20 (2.8%) |
| 35 to 39 Years | 48 (9.2%) | 20 (2.8%) |
| 40 to 44 Years | 63 (12.0%) | 0 (0.0%) |
| 45 to 49 Years | 56 (10.7%) | 168 (23.6%) |
| 50 to 54 Years | 29 (5.5%) | 24 (3.4%) |
| 55 to 59 Years | 25 (4.8%) | 20 (2.8%) |
| 60 to 64 Years | 30 (5.7%) | 11 (1.5%) |
| 65 to 69 Years | 0 (0.0%) | 0 (0.0%) |
| 70 to 74 Years | 0 (0.0%) | 10 (1.4%) |
| 75 to 79 Years | 4 (0.8%) | 8 (1.1%) |
| 80 to 84 Years | 0 (0.0%) | 0 (0.0%) |
| 85 Years and over | 0 (0.0%) | 0 (0.0%) |
| Total | 524 (100.0%) | 711 (100.0%) |
Families and Households in Lake Shore
Median Family Size in Lake Shore
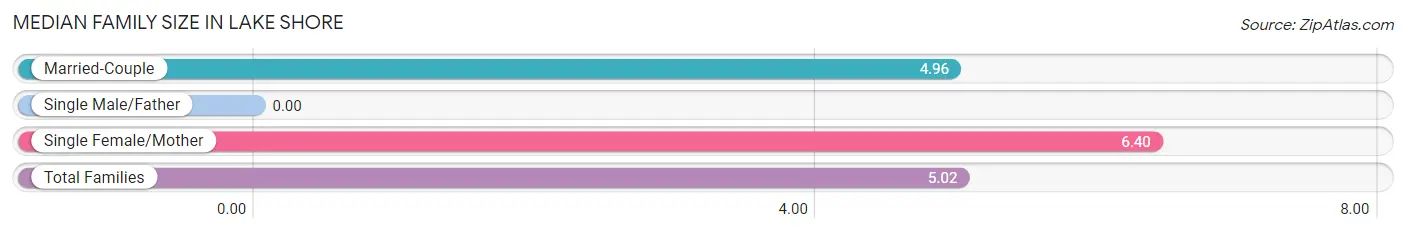
| Family Type | # Families | Family Size |
| Married-Couple | 224 (95.7%) | 4.96 |
| Single Male/Father | 0 (0.0%) | - |
| Single Female/Mother | 10 (4.3%) | 6.40 |
| Total Families | 234 (100.0%) | 5.02 |
Median Household Size in Lake Shore
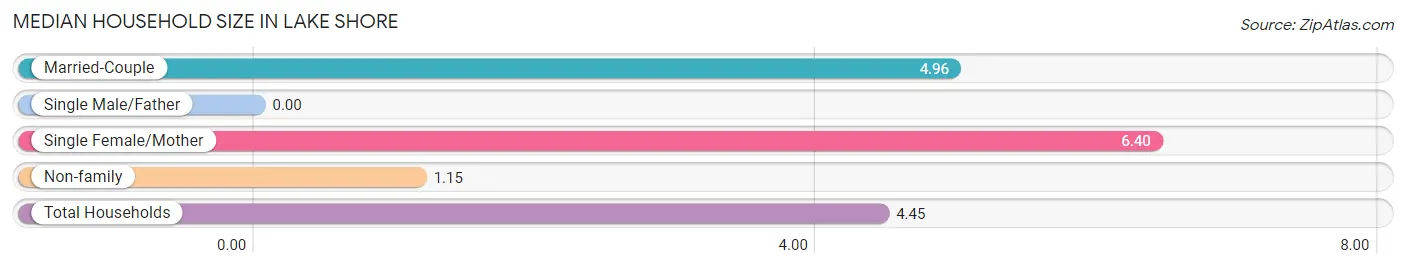
| Household Type | # Households | Household Size |
| Married-Couple | 224 (81.8%) | 4.96 |
| Single Male/Father | 0 (0.0%) | - |
| Single Female/Mother | 10 (3.6%) | 6.40 |
| Non-family | 40 (14.6%) | 1.15 |
| Total Households | 274 (100.0%) | 4.45 |
Household Size by Marriage Status in Lake Shore
Out of a total of 274 households in Lake Shore, 234 (85.4%) are family households, while 40 (14.6%) are nonfamily households. The most numerous type of family households are 6-person households, comprising 78, and the most common type of nonfamily households are 1-person households, comprising 36.
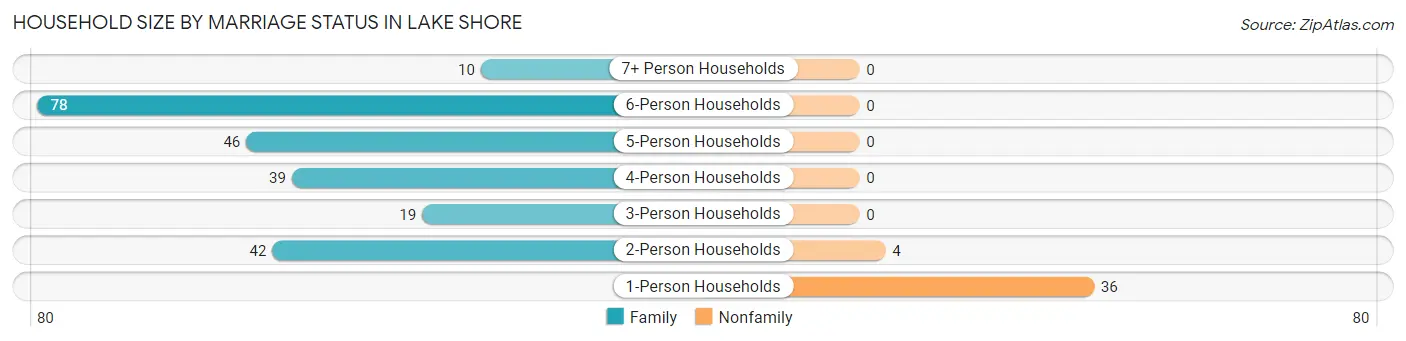
| Household Size | Family Households | Nonfamily Households |
| 1-Person Households | - | 36 (13.1%) |
| 2-Person Households | 42 (15.3%) | 4 (1.5%) |
| 3-Person Households | 19 (6.9%) | 0 (0.0%) |
| 4-Person Households | 39 (14.2%) | 0 (0.0%) |
| 5-Person Households | 46 (16.8%) | 0 (0.0%) |
| 6-Person Households | 78 (28.5%) | 0 (0.0%) |
| 7+ Person Households | 10 (3.6%) | 0 (0.0%) |
| Total | 234 (85.4%) | 40 (14.6%) |
Female Fertility in Lake Shore
Fertility by Age in Lake Shore
| Age Bracket | Women with Births | Births / 1,000 Women |
| 15 to 19 years | 0 (0.0%) | 0.0 |
| 20 to 34 years | 0 (0.0%) | 0.0 |
| 35 to 50 years | 0 (0.0%) | 0.0 |
| Total | 0 (0.0%) | 0.0 |
Fertility by Age by Marriage Status in Lake Shore
| Age Bracket | Married | Unmarried |
| 15 to 19 years | 0 (0.0%) | 0 (0.0%) |
| 20 to 34 years | 0 (0.0%) | 0 (0.0%) |
| 35 to 50 years | 0 (0.0%) | 0 (0.0%) |
| Total | 0 (0.0%) | 0 (0.0%) |
Fertility by Education in Lake Shore
| Educational Attainment | Women with Births | Births / 1,000 Women |
| Less than High School | 0 (0.0%) | 0.0 |
| High School Diploma | 0 (0.0%) | 0.0 |
| College or Associate's Degree | 0 (0.0%) | 0.0 |
| Bachelor's Degree | 0 (0.0%) | 0.0 |
| Graduate Degree | 0 (0.0%) | 0.0 |
| Total | 0 (0.0%) | 0.0 |
Fertility by Education by Marriage Status in Lake Shore
| Educational Attainment | Married | Unmarried |
| Less than High School | 0 (0.0%) | 0 (0.0%) |
| High School Diploma | 0 (0.0%) | 0 (0.0%) |
| College or Associate's Degree | 0 (0.0%) | 0 (0.0%) |
| Bachelor's Degree | 0 (0.0%) | 0 (0.0%) |
| Graduate Degree | 0 (0.0%) | 0 (0.0%) |
| Total | 0 (0.0%) | 0 (0.0%) |
Employment Characteristics in Lake Shore
Employment by Class of Employer in Lake Shore
Among the 478 employed individuals in Lake Shore, private company employees (259 | 54.2%), state government employees (97 | 20.3%), and self-employed (not incorporated) (58 | 12.1%) make up the most common classes of employment.
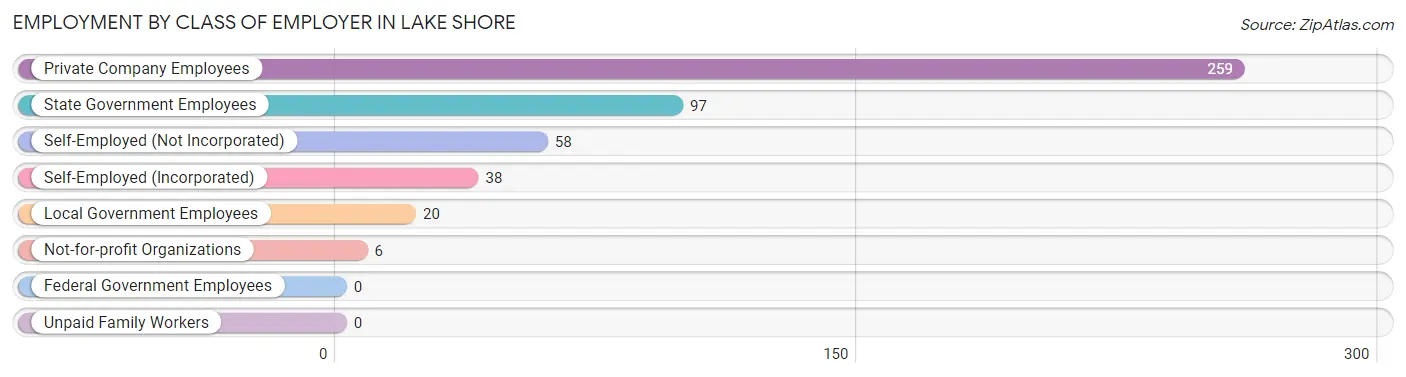
| Employer Class | # Employees | % Employees |
| Private Company Employees | 259 | 54.2% |
| Self-Employed (Incorporated) | 38 | 8.0% |
| Self-Employed (Not Incorporated) | 58 | 12.1% |
| Not-for-profit Organizations | 6 | 1.3% |
| Local Government Employees | 20 | 4.2% |
| State Government Employees | 97 | 20.3% |
| Federal Government Employees | 0 | 0.0% |
| Unpaid Family Workers | 0 | 0.0% |
| Total | 478 | 100.0% |
Employment Status by Age in Lake Shore
According to the labor force statistics for Lake Shore, out of the total population over 16 years of age (797), 70.5% or 562 individuals are in the labor force, with 13.9% or 78 of them unemployed. The age group with the highest labor force participation rate is 25 to 29 years, with 100.0% or 40 individuals in the labor force. Within the labor force, the 45 to 54 years age range has the highest percentage of unemployed individuals, with 30.1% or 78 of them being unemployed.
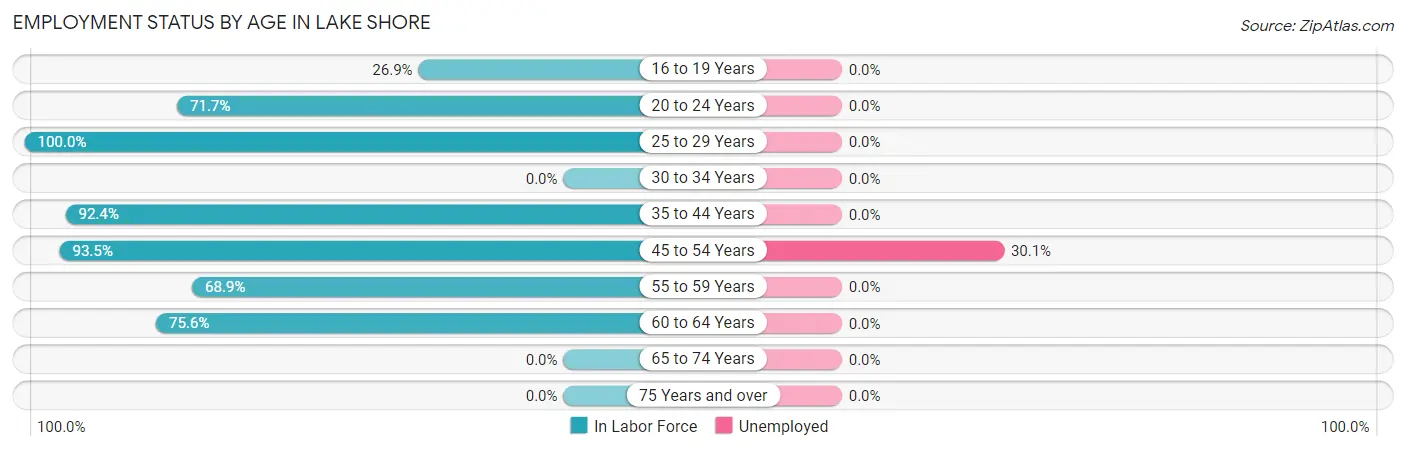
| Age Bracket | In Labor Force | Unemployed |
| 16 to 19 Years | 47 (26.9%) | 0 (0.0%) |
| 20 to 24 Years | 33 (71.7%) | 0 (0.0%) |
| 25 to 29 Years | 40 (100.0%) | 0 (0.0%) |
| 30 to 34 Years | 0 (0.0%) | 0 (0.0%) |
| 35 to 44 Years | 121 (92.4%) | 0 (0.0%) |
| 45 to 54 Years | 259 (93.5%) | 78 (30.1%) |
| 55 to 59 Years | 31 (68.9%) | 0 (0.0%) |
| 60 to 64 Years | 31 (75.6%) | 0 (0.0%) |
| 65 to 74 Years | 0 (0.0%) | 0 (0.0%) |
| 75 Years and over | 0 (0.0%) | 0 (0.0%) |
| Total | 562 (70.5%) | 78 (13.9%) |
Employment Status by Educational Attainment in Lake Shore
According to labor force statistics for Lake Shore, 87.0% of individuals (482) out of the total population between 25 and 64 years of age (554) are in the labor force, with 16.2% or 78 of them being unemployed. The group with the highest labor force participation rate are those with the educational attainment of less than high school, with 100.0% or 24 individuals in the labor force. Within the labor force, individuals with bachelor's degree or higher education have the highest percentage of unemployment, with 29.9% or 78 of them being unemployed.
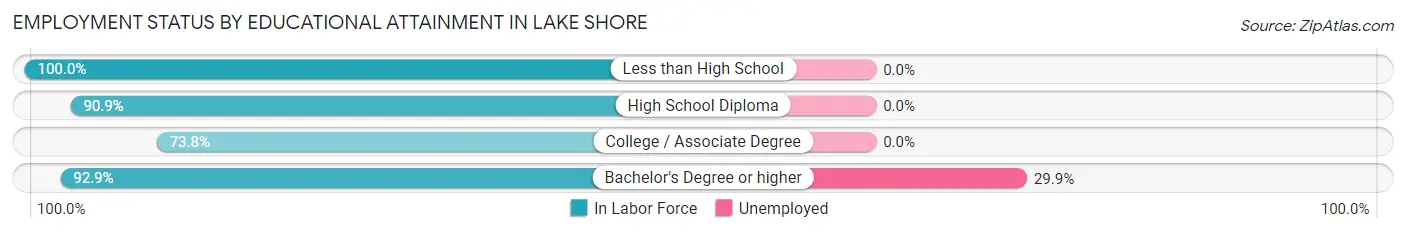
| Educational Attainment | In Labor Force | Unemployed |
| Less than High School | 24 (100.0%) | 0 (0.0%) |
| High School Diploma | 70 (90.9%) | 0 (0.0%) |
| College / Associate Degree | 127 (73.8%) | 0 (0.0%) |
| Bachelor's Degree or higher | 261 (92.9%) | 84 (29.9%) |
| Total | 482 (87.0%) | 90 (16.2%) |
Employment Occupations by Sex in Lake Shore
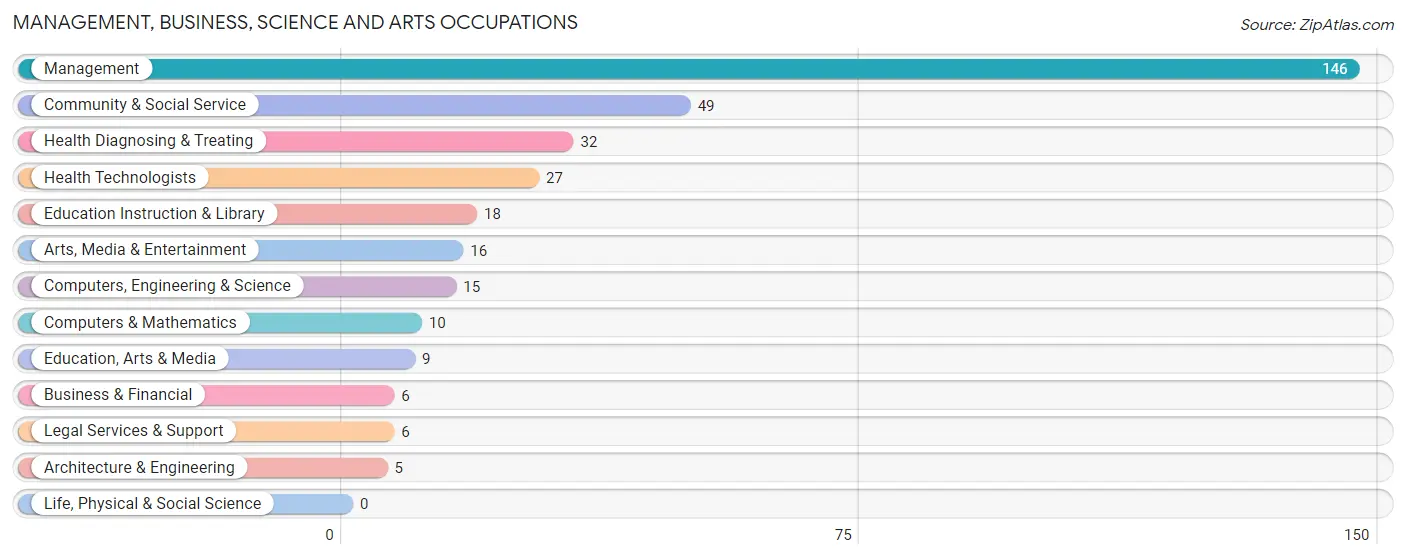
Management, Business, Science and Arts Occupations
The most common Management, Business, Science and Arts occupations in Lake Shore are Management (146 | 30.2%), Community & Social Service (49 | 10.1%), Health Diagnosing & Treating (32 | 6.6%), Health Technologists (27 | 5.6%), and Education Instruction & Library (18 | 3.7%).
Management, Business, Science and Arts Occupations by Sex
Within the Management, Business, Science and Arts occupations in Lake Shore, the most male-oriented occupations are Computers, Engineering & Science (100.0%), Computers & Mathematics (100.0%), and Architecture & Engineering (100.0%), while the most female-oriented occupations are Business & Financial (100.0%), Education, Arts & Media (100.0%), and Arts, Media & Entertainment (100.0%).
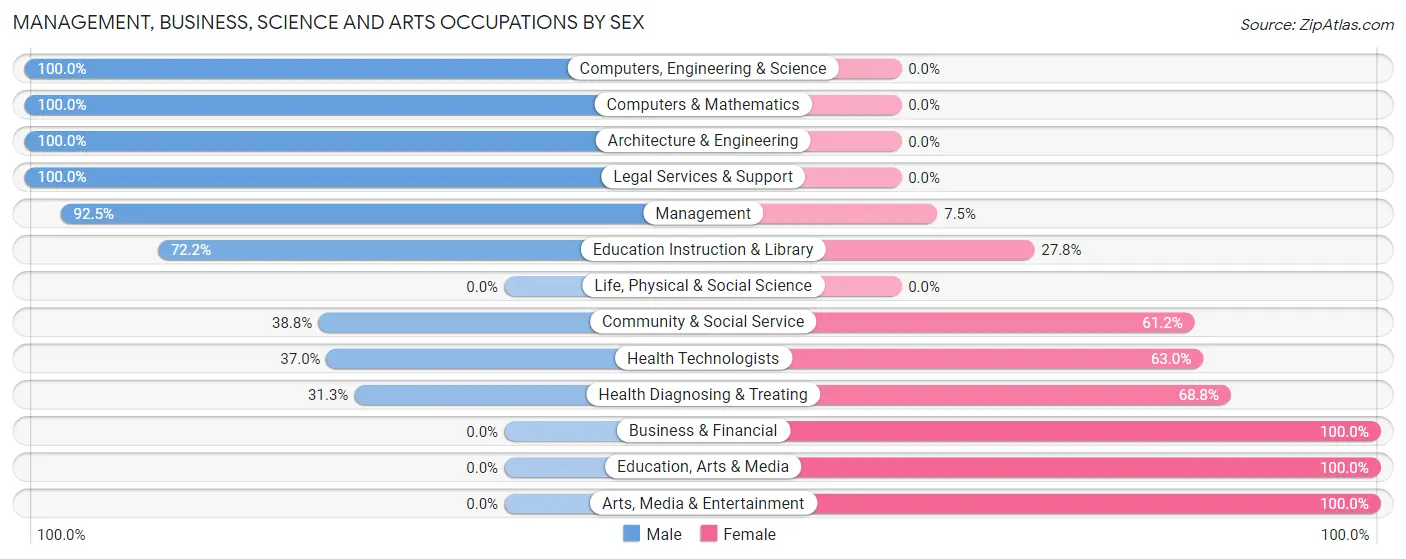
| Occupation | Male | Female |
| Management | 135 (92.5%) | 11 (7.5%) |
| Business & Financial | 0 (0.0%) | 6 (100.0%) |
| Computers, Engineering & Science | 15 (100.0%) | 0 (0.0%) |
| Computers & Mathematics | 10 (100.0%) | 0 (0.0%) |
| Architecture & Engineering | 5 (100.0%) | 0 (0.0%) |
| Life, Physical & Social Science | 0 (0.0%) | 0 (0.0%) |
| Community & Social Service | 19 (38.8%) | 30 (61.2%) |
| Education, Arts & Media | 0 (0.0%) | 9 (100.0%) |
| Legal Services & Support | 6 (100.0%) | 0 (0.0%) |
| Education Instruction & Library | 13 (72.2%) | 5 (27.8%) |
| Arts, Media & Entertainment | 0 (0.0%) | 16 (100.0%) |
| Health Diagnosing & Treating | 10 (31.2%) | 22 (68.8%) |
| Health Technologists | 10 (37.0%) | 17 (63.0%) |
| Total (Category) | 179 (72.2%) | 69 (27.8%) |
| Total (Overall) | 287 (59.3%) | 197 (40.7%) |
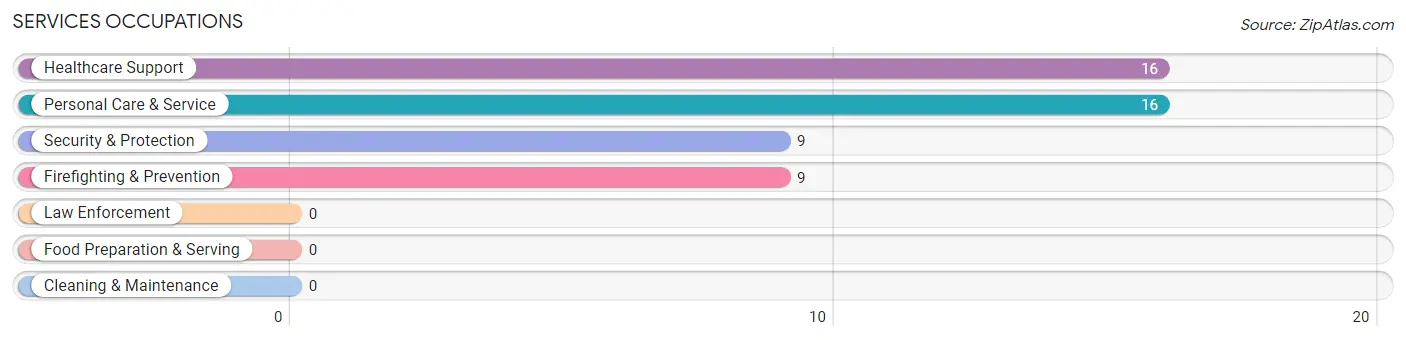
Services Occupations
The most common Services occupations in Lake Shore are Healthcare Support (16 | 3.3%), Personal Care & Service (16 | 3.3%), Security & Protection (9 | 1.9%), and Firefighting & Prevention (9 | 1.9%).
Services Occupations by Sex
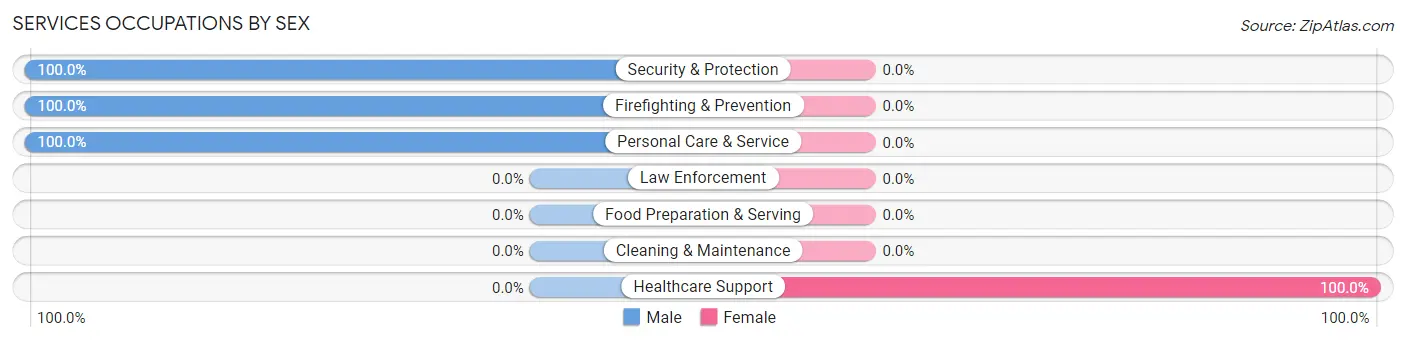
| Occupation | Male | Female |
| Healthcare Support | 0 (0.0%) | 16 (100.0%) |
| Security & Protection | 9 (100.0%) | 0 (0.0%) |
| Firefighting & Prevention | 9 (100.0%) | 0 (0.0%) |
| Law Enforcement | 0 (0.0%) | 0 (0.0%) |
| Food Preparation & Serving | 0 (0.0%) | 0 (0.0%) |
| Cleaning & Maintenance | 0 (0.0%) | 0 (0.0%) |
| Personal Care & Service | 16 (100.0%) | 0 (0.0%) |
| Total (Category) | 25 (61.0%) | 16 (39.0%) |
| Total (Overall) | 287 (59.3%) | 197 (40.7%) |
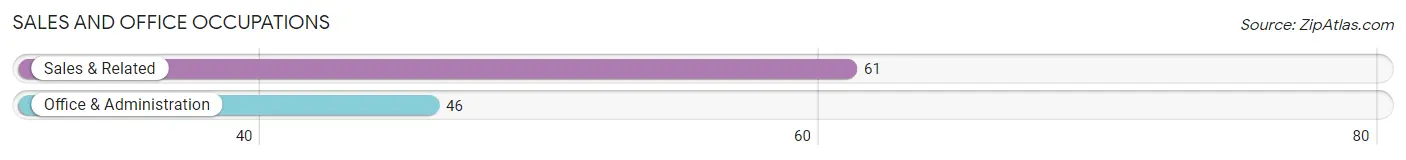
Sales and Office Occupations
The most common Sales and Office occupations in Lake Shore are Sales & Related (61 | 12.6%), and Office & Administration (46 | 9.5%).
Sales and Office Occupations by Sex
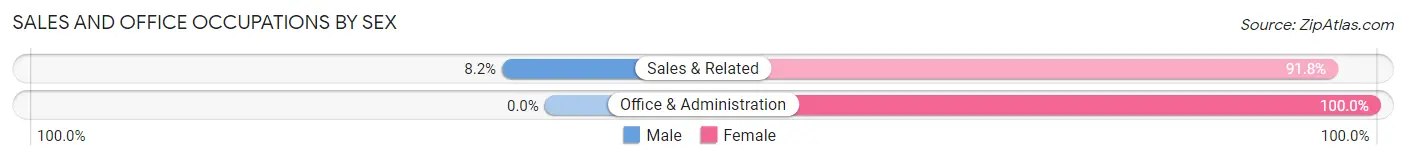
| Occupation | Male | Female |
| Sales & Related | 5 (8.2%) | 56 (91.8%) |
| Office & Administration | 0 (0.0%) | 46 (100.0%) |
| Total (Category) | 5 (4.7%) | 102 (95.3%) |
| Total (Overall) | 287 (59.3%) | 197 (40.7%) |
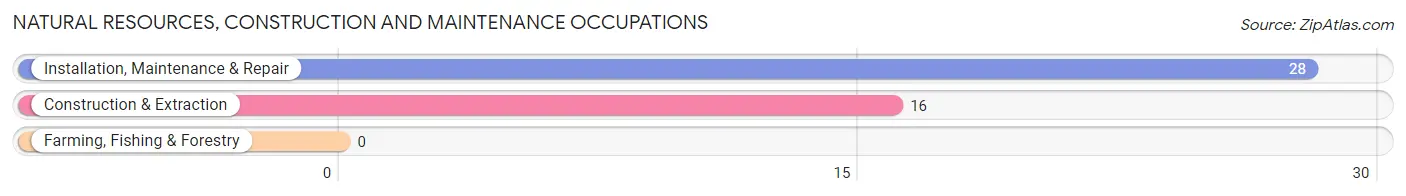
Natural Resources, Construction and Maintenance Occupations
The most common Natural Resources, Construction and Maintenance occupations in Lake Shore are Installation, Maintenance & Repair (28 | 5.8%), and Construction & Extraction (16 | 3.3%).
Natural Resources, Construction and Maintenance Occupations by Sex
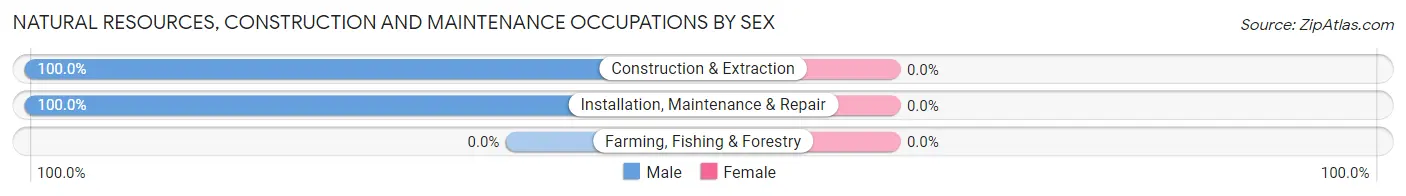
| Occupation | Male | Female |
| Farming, Fishing & Forestry | 0 (0.0%) | 0 (0.0%) |
| Construction & Extraction | 16 (100.0%) | 0 (0.0%) |
| Installation, Maintenance & Repair | 28 (100.0%) | 0 (0.0%) |
| Total (Category) | 44 (100.0%) | 0 (0.0%) |
| Total (Overall) | 287 (59.3%) | 197 (40.7%) |
Production, Transportation and Moving Occupations
The most common Production, Transportation and Moving occupations in Lake Shore are Production (39 | 8.1%), and Transportation (5 | 1.0%).
Production, Transportation and Moving Occupations by Sex
| Occupation | Male | Female |
| Production | 29 (74.4%) | 10 (25.6%) |
| Transportation | 5 (100.0%) | 0 (0.0%) |
| Material Moving | 0 (0.0%) | 0 (0.0%) |
| Total (Category) | 34 (77.3%) | 10 (22.7%) |
| Total (Overall) | 287 (59.3%) | 197 (40.7%) |
Employment Industries by Sex in Lake Shore
Employment Industries in Lake Shore
The major employment industries in Lake Shore include Educational Services (110 | 22.7%), Manufacturing (71 | 14.7%), Construction (67 | 13.8%), Retail Trade (53 | 11.0%), and Health Care & Social Assistance (31 | 6.4%).
Employment Industries by Sex in Lake Shore
The Lake Shore industries that see more men than women are Agriculture, Fishing & Hunting (100.0%), Wholesale Trade (100.0%), and Real Estate, Rental & Leasing (100.0%), whereas the industries that tend to have a higher number of women are Public Administration (82.8%), Retail Trade (69.8%), and Health Care & Social Assistance (67.7%).
| Industry | Male | Female |
| Agriculture, Fishing & Hunting | 27 (100.0%) | 0 (0.0%) |
| Mining, Quarrying, & Extraction | 0 (0.0%) | 0 (0.0%) |
| Construction | 58 (86.6%) | 9 (13.4%) |
| Manufacturing | 50 (70.4%) | 21 (29.6%) |
| Wholesale Trade | 6 (100.0%) | 0 (0.0%) |
| Retail Trade | 16 (30.2%) | 37 (69.8%) |
| Transportation & Warehousing | 0 (0.0%) | 0 (0.0%) |
| Utilities | 0 (0.0%) | 0 (0.0%) |
| Information | 0 (0.0%) | 0 (0.0%) |
| Finance & Insurance | 0 (0.0%) | 0 (0.0%) |
| Real Estate, Rental & Leasing | 5 (100.0%) | 0 (0.0%) |
| Professional & Scientific | 16 (76.2%) | 5 (23.8%) |
| Enterprise Management | 0 (0.0%) | 0 (0.0%) |
| Administrative & Support | 0 (0.0%) | 0 (0.0%) |
| Educational Services | 66 (60.0%) | 44 (40.0%) |
| Health Care & Social Assistance | 10 (32.3%) | 21 (67.7%) |
| Arts, Entertainment & Recreation | 5 (100.0%) | 0 (0.0%) |
| Accommodation & Food Services | 5 (33.3%) | 10 (66.7%) |
| Public Administration | 5 (17.2%) | 24 (82.8%) |
| Total | 287 (59.3%) | 197 (40.7%) |
Education in Lake Shore
School Enrollment in Lake Shore
The most common levels of schooling among the 617 students in Lake Shore are high school (243 | 39.4%), middle school (165 | 26.7%), and elementary school (128 | 20.7%).
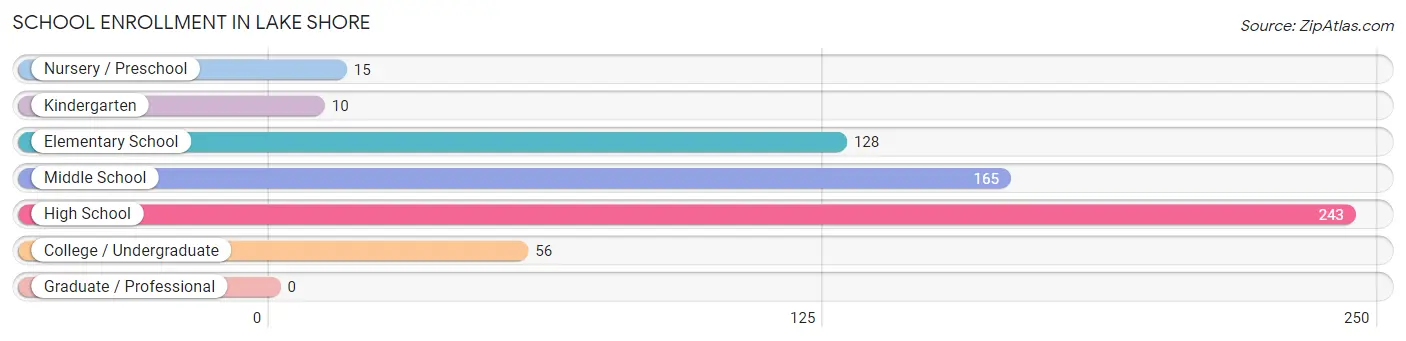
| School Level | # Students | % Students |
| Nursery / Preschool | 15 | 2.4% |
| Kindergarten | 10 | 1.6% |
| Elementary School | 128 | 20.7% |
| Middle School | 165 | 26.7% |
| High School | 243 | 39.4% |
| College / Undergraduate | 56 | 9.1% |
| Graduate / Professional | 0 | 0.0% |
| Total | 617 | 100.0% |
School Enrollment by Age by Funding Source in Lake Shore
Out of a total of 617 students who are enrolled in schools in Lake Shore, 72 (11.7%) attend a private institution, while the remaining 545 (88.3%) are enrolled in public schools. The age group of 3 to 4 year olds has the highest likelihood of being enrolled in private schools, with 10 (100.0% in the age bracket) enrolled. Conversely, the age group of 25 to 34 year olds has the lowest likelihood of being enrolled in a private school, with 6 (100.0% in the age bracket) attending a public institution.
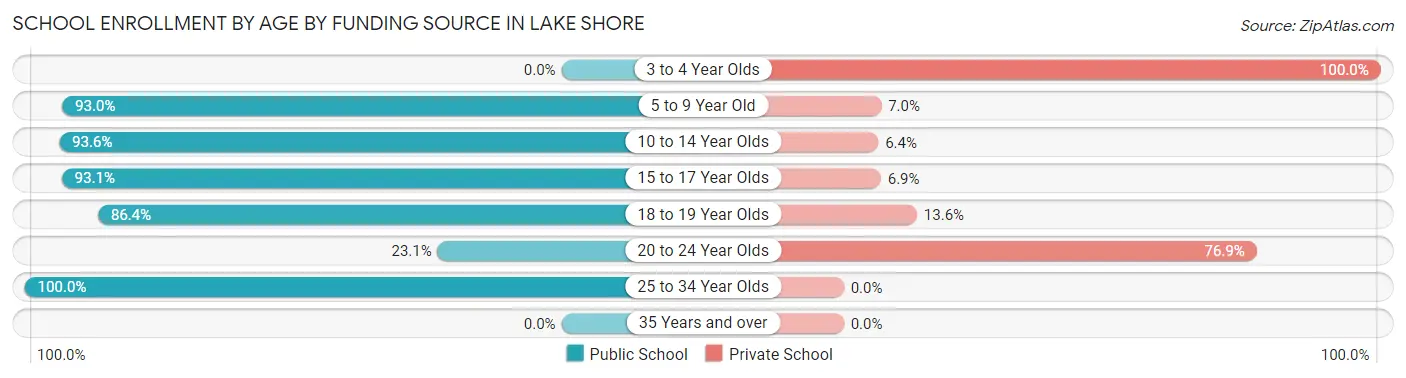
| Age Bracket | Public School | Private School |
| 3 to 4 Year Olds | 0 (0.0%) | 10 (100.0%) |
| 5 to 9 Year Old | 133 (93.0%) | 10 (7.0%) |
| 10 to 14 Year Olds | 160 (93.6%) | 11 (6.4%) |
| 15 to 17 Year Olds | 202 (93.1%) | 15 (6.9%) |
| 18 to 19 Year Olds | 38 (86.4%) | 6 (13.6%) |
| 20 to 24 Year Olds | 6 (23.1%) | 20 (76.9%) |
| 25 to 34 Year Olds | 6 (100.0%) | 0 (0.0%) |
| 35 Years and over | 0 (0.0%) | 0 (0.0%) |
| Total | 545 (88.3%) | 72 (11.7%) |
Educational Attainment by Field of Study in Lake Shore
Science & technology (96 | 26.7%), arts & humanities (83 | 23.1%), education (67 | 18.7%), business (45 | 12.5%), and psychology (27 | 7.5%) are the most common fields of study among 359 individuals in Lake Shore who have obtained a bachelor's degree or higher.
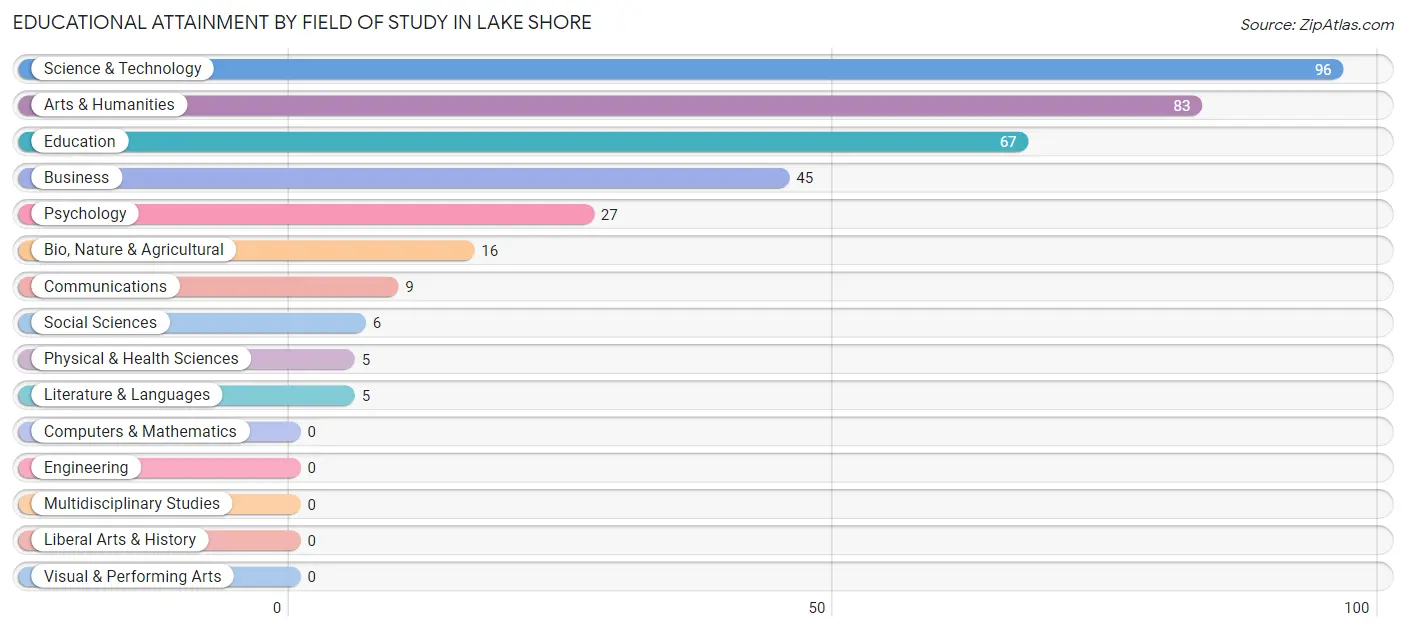
| Field of Study | # Graduates | % Graduates |
| Computers & Mathematics | 0 | 0.0% |
| Bio, Nature & Agricultural | 16 | 4.5% |
| Physical & Health Sciences | 5 | 1.4% |
| Psychology | 27 | 7.5% |
| Social Sciences | 6 | 1.7% |
| Engineering | 0 | 0.0% |
| Multidisciplinary Studies | 0 | 0.0% |
| Science & Technology | 96 | 26.7% |
| Business | 45 | 12.5% |
| Education | 67 | 18.7% |
| Literature & Languages | 5 | 1.4% |
| Liberal Arts & History | 0 | 0.0% |
| Visual & Performing Arts | 0 | 0.0% |
| Communications | 9 | 2.5% |
| Arts & Humanities | 83 | 23.1% |
| Total | 359 | 100.0% |
Transportation & Commute in Lake Shore
Vehicle Availability by Sex in Lake Shore
The most prevalent vehicle ownership categories in Lake Shore are males with 3 vehicles (88, accounting for 30.7%) and females with 3 vehicles (68, making up 46.1%).
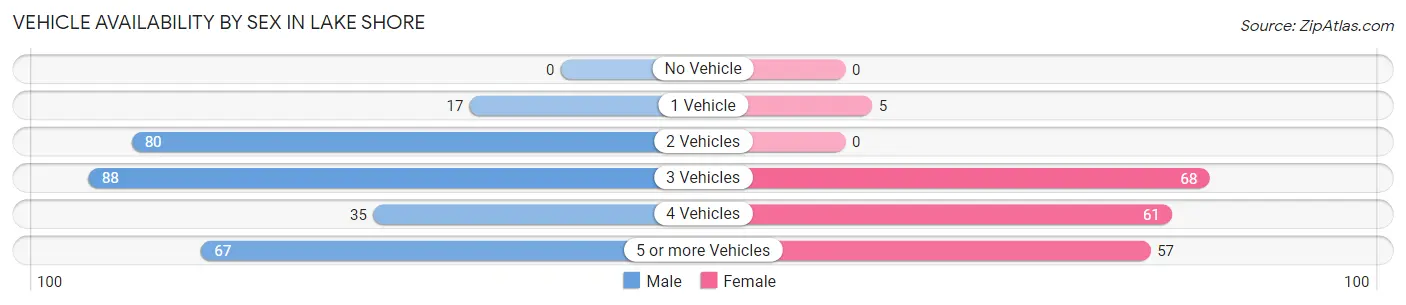
| Vehicles Available | Male | Female |
| No Vehicle | 0 (0.0%) | 0 (0.0%) |
| 1 Vehicle | 17 (5.9%) | 5 (2.6%) |
| 2 Vehicles | 80 (27.9%) | 0 (0.0%) |
| 3 Vehicles | 88 (30.7%) | 68 (35.6%) |
| 4 Vehicles | 35 (12.2%) | 61 (31.9%) |
| 5 or more Vehicles | 67 (23.3%) | 57 (29.8%) |
| Total | 287 (100.0%) | 191 (100.0%) |
Commute Time in Lake Shore
The most frequently occuring commute durations in Lake Shore are 20 to 24 minutes (124 commuters, 29.5%), 15 to 19 minutes (88 commuters, 20.9%), and 10 to 14 minutes (52 commuters, 12.4%).
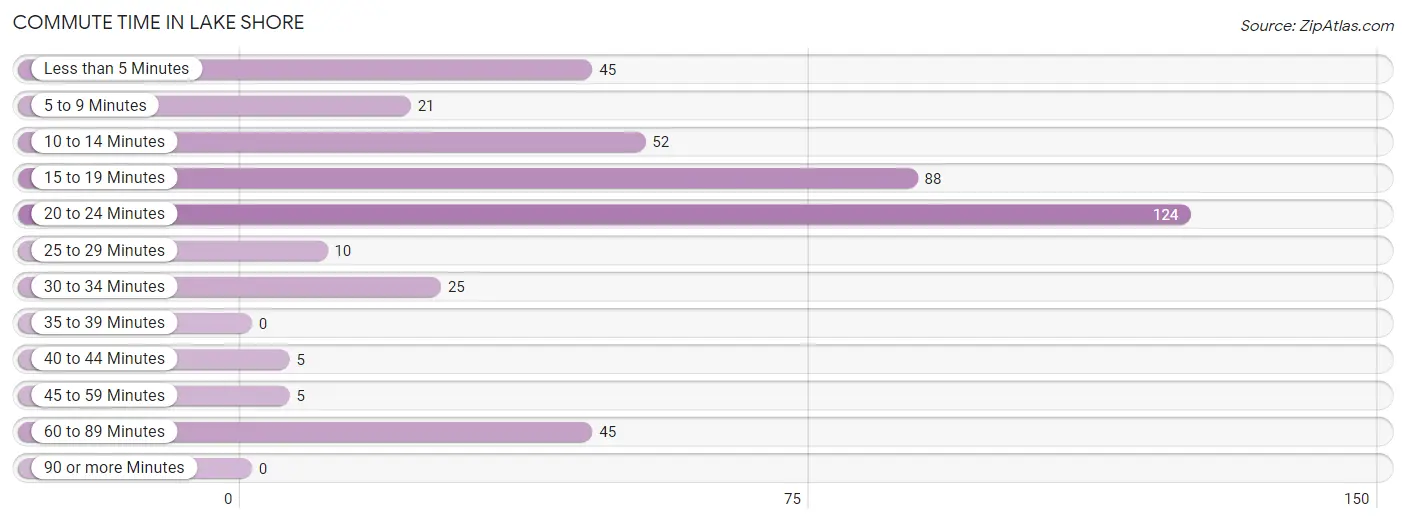
| Commute Time | # Commuters | % Commuters |
| Less than 5 Minutes | 45 | 10.7% |
| 5 to 9 Minutes | 21 | 5.0% |
| 10 to 14 Minutes | 52 | 12.4% |
| 15 to 19 Minutes | 88 | 20.9% |
| 20 to 24 Minutes | 124 | 29.5% |
| 25 to 29 Minutes | 10 | 2.4% |
| 30 to 34 Minutes | 25 | 5.9% |
| 35 to 39 Minutes | 0 | 0.0% |
| 40 to 44 Minutes | 5 | 1.2% |
| 45 to 59 Minutes | 5 | 1.2% |
| 60 to 89 Minutes | 45 | 10.7% |
| 90 or more Minutes | 0 | 0.0% |
Commute Time by Sex in Lake Shore
The most common commute times in Lake Shore are 20 to 24 minutes (91 commuters, 38.9%) for males and 15 to 19 minutes (47 commuters, 25.3%) for females.
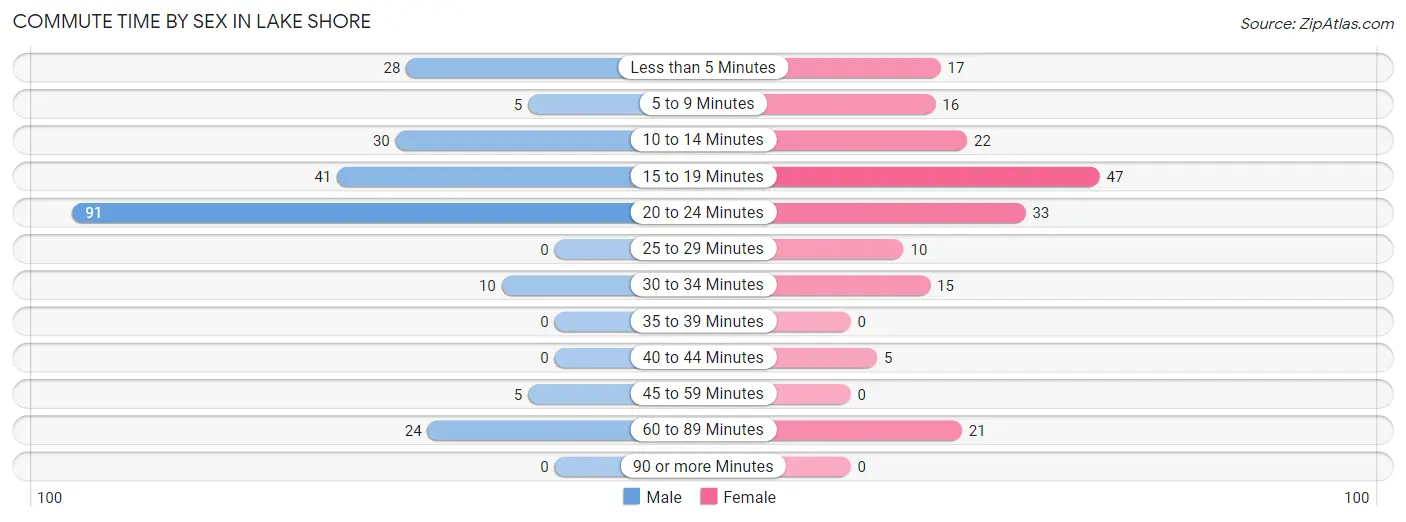
| Commute Time | Male | Female |
| Less than 5 Minutes | 28 (12.0%) | 17 (9.1%) |
| 5 to 9 Minutes | 5 (2.1%) | 16 (8.6%) |
| 10 to 14 Minutes | 30 (12.8%) | 22 (11.8%) |
| 15 to 19 Minutes | 41 (17.5%) | 47 (25.3%) |
| 20 to 24 Minutes | 91 (38.9%) | 33 (17.7%) |
| 25 to 29 Minutes | 0 (0.0%) | 10 (5.4%) |
| 30 to 34 Minutes | 10 (4.3%) | 15 (8.1%) |
| 35 to 39 Minutes | 0 (0.0%) | 0 (0.0%) |
| 40 to 44 Minutes | 0 (0.0%) | 5 (2.7%) |
| 45 to 59 Minutes | 5 (2.1%) | 0 (0.0%) |
| 60 to 89 Minutes | 24 (10.3%) | 21 (11.3%) |
| 90 or more Minutes | 0 (0.0%) | 0 (0.0%) |
Time of Departure to Work by Sex in Lake Shore
The most frequent times of departure to work in Lake Shore are 9:00 AM to 9:59 AM (58, 24.8%) for males and 7:30 AM to 7:59 AM (69, 37.1%) for females.
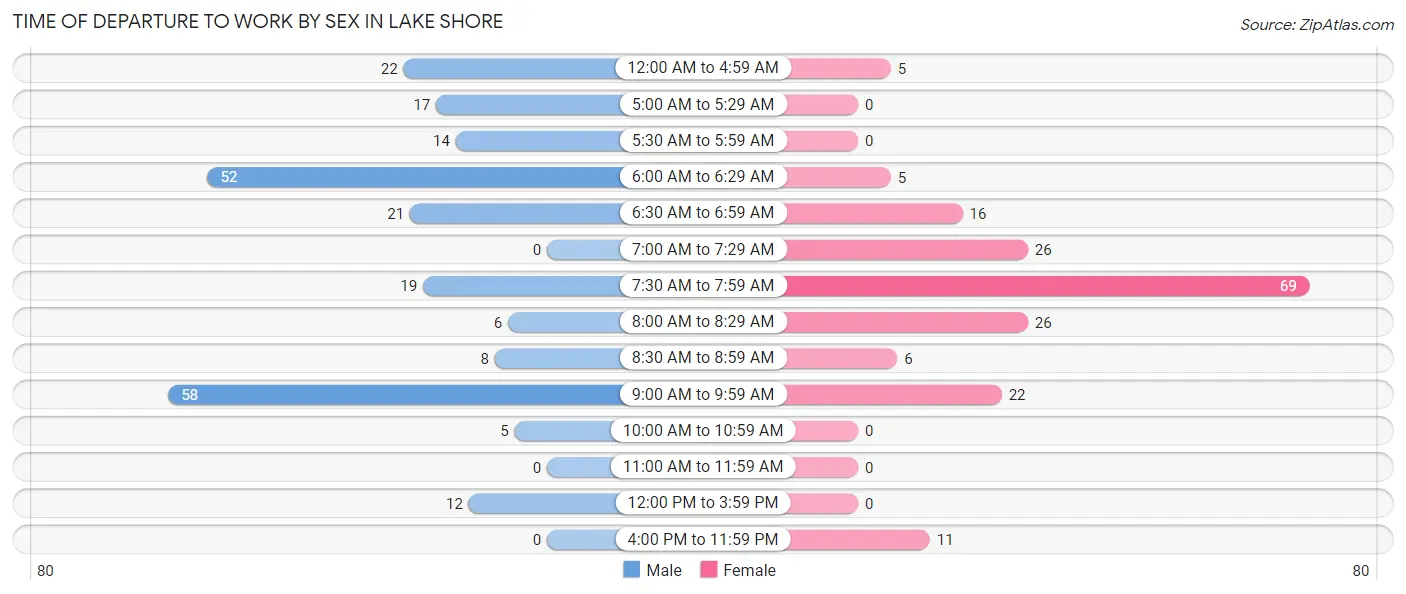
| Time of Departure | Male | Female |
| 12:00 AM to 4:59 AM | 22 (9.4%) | 5 (2.7%) |
| 5:00 AM to 5:29 AM | 17 (7.3%) | 0 (0.0%) |
| 5:30 AM to 5:59 AM | 14 (6.0%) | 0 (0.0%) |
| 6:00 AM to 6:29 AM | 52 (22.2%) | 5 (2.7%) |
| 6:30 AM to 6:59 AM | 21 (9.0%) | 16 (8.6%) |
| 7:00 AM to 7:29 AM | 0 (0.0%) | 26 (14.0%) |
| 7:30 AM to 7:59 AM | 19 (8.1%) | 69 (37.1%) |
| 8:00 AM to 8:29 AM | 6 (2.6%) | 26 (14.0%) |
| 8:30 AM to 8:59 AM | 8 (3.4%) | 6 (3.2%) |
| 9:00 AM to 9:59 AM | 58 (24.8%) | 22 (11.8%) |
| 10:00 AM to 10:59 AM | 5 (2.1%) | 0 (0.0%) |
| 11:00 AM to 11:59 AM | 0 (0.0%) | 0 (0.0%) |
| 12:00 PM to 3:59 PM | 12 (5.1%) | 0 (0.0%) |
| 4:00 PM to 11:59 PM | 0 (0.0%) | 11 (5.9%) |
| Total | 234 (100.0%) | 186 (100.0%) |
Housing Occupancy in Lake Shore
Occupancy by Ownership in Lake Shore
Of the total 274 dwellings in Lake Shore, owner-occupied units account for 195 (71.2%), while renter-occupied units make up 79 (28.8%).
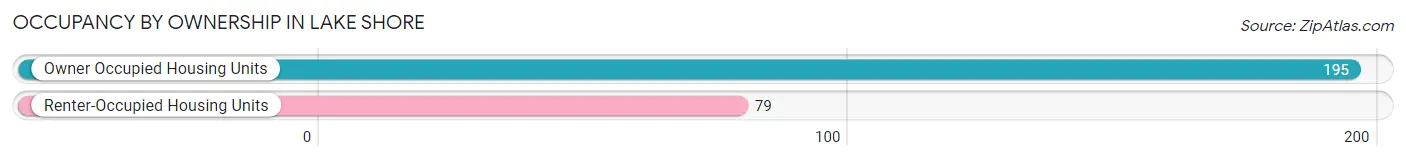
| Occupancy | # Housing Units | % Housing Units |
| Owner Occupied Housing Units | 195 | 71.2% |
| Renter-Occupied Housing Units | 79 | 28.8% |
| Total Occupied Housing Units | 274 | 100.0% |
Occupancy by Household Size in Lake Shore
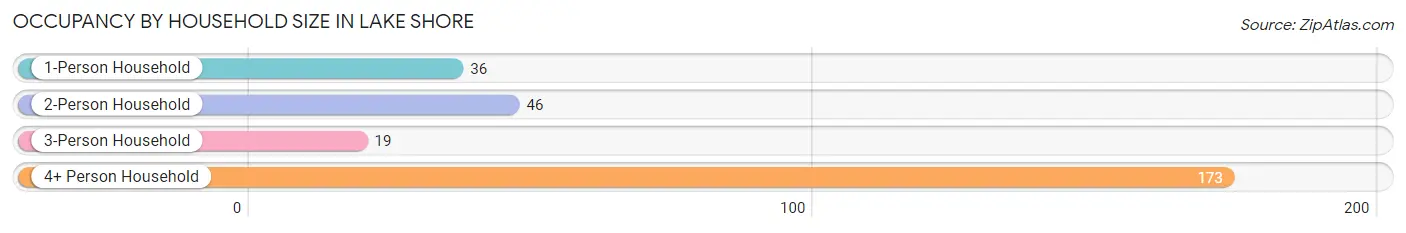
| Household Size | # Housing Units | % Housing Units |
| 1-Person Household | 36 | 13.1% |
| 2-Person Household | 46 | 16.8% |
| 3-Person Household | 19 | 6.9% |
| 4+ Person Household | 173 | 63.1% |
| Total Housing Units | 274 | 100.0% |
Occupancy by Ownership by Household Size in Lake Shore
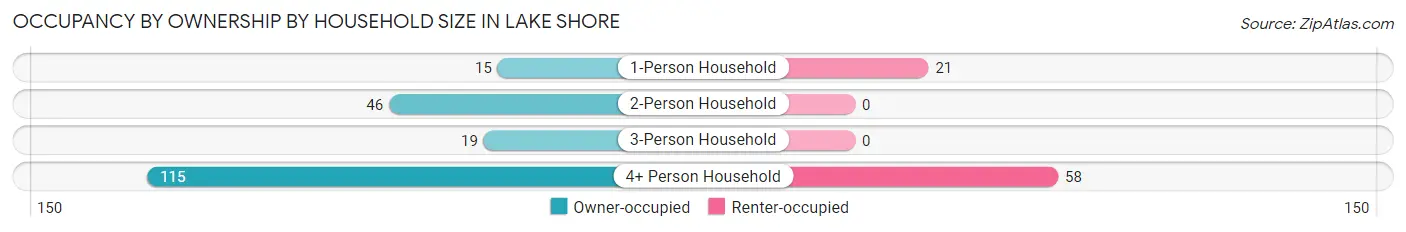
| Household Size | Owner-occupied | Renter-occupied |
| 1-Person Household | 15 (41.7%) | 21 (58.3%) |
| 2-Person Household | 46 (100.0%) | 0 (0.0%) |
| 3-Person Household | 19 (100.0%) | 0 (0.0%) |
| 4+ Person Household | 115 (66.5%) | 58 (33.5%) |
| Total Housing Units | 195 (71.2%) | 79 (28.8%) |
Occupancy by Educational Attainment in Lake Shore
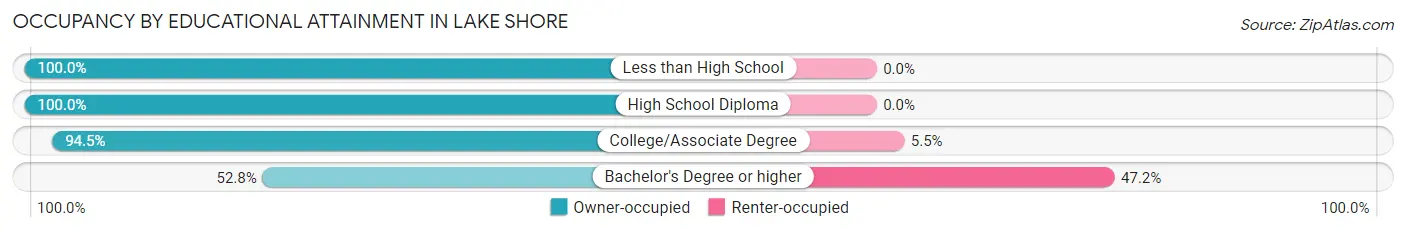
| Household Size | Owner-occupied | Renter-occupied |
| Less than High School | 13 (100.0%) | 0 (0.0%) |
| High School Diploma | 29 (100.0%) | 0 (0.0%) |
| College/Associate Degree | 69 (94.5%) | 4 (5.5%) |
| Bachelor's Degree or higher | 84 (52.8%) | 75 (47.2%) |
Occupancy by Age of Householder in Lake Shore
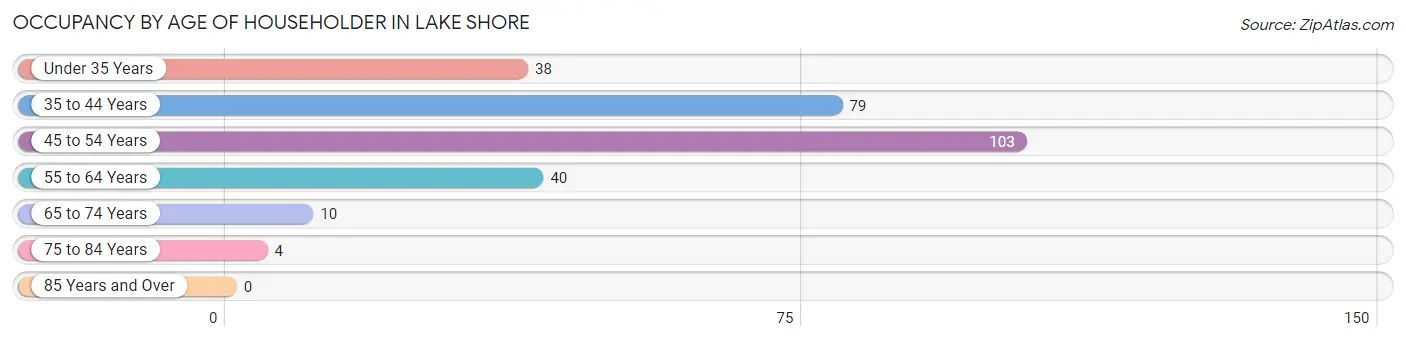
| Age Bracket | # Households | % Households |
| Under 35 Years | 38 | 13.9% |
| 35 to 44 Years | 79 | 28.8% |
| 45 to 54 Years | 103 | 37.6% |
| 55 to 64 Years | 40 | 14.6% |
| 65 to 74 Years | 10 | 3.6% |
| 75 to 84 Years | 4 | 1.5% |
| 85 Years and Over | 0 | 0.0% |
| Total | 274 | 100.0% |
Housing Finances in Lake Shore
Median Income by Occupancy in Lake Shore
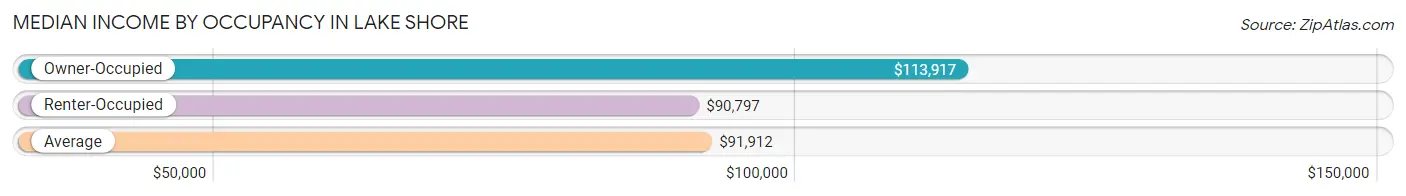
| Occupancy Type | # Households | Median Income |
| Owner-Occupied | 195 (71.2%) | $113,917 |
| Renter-Occupied | 79 (28.8%) | $90,797 |
| Average | 274 (100.0%) | $91,912 |
Occupancy by Householder Income Bracket in Lake Shore
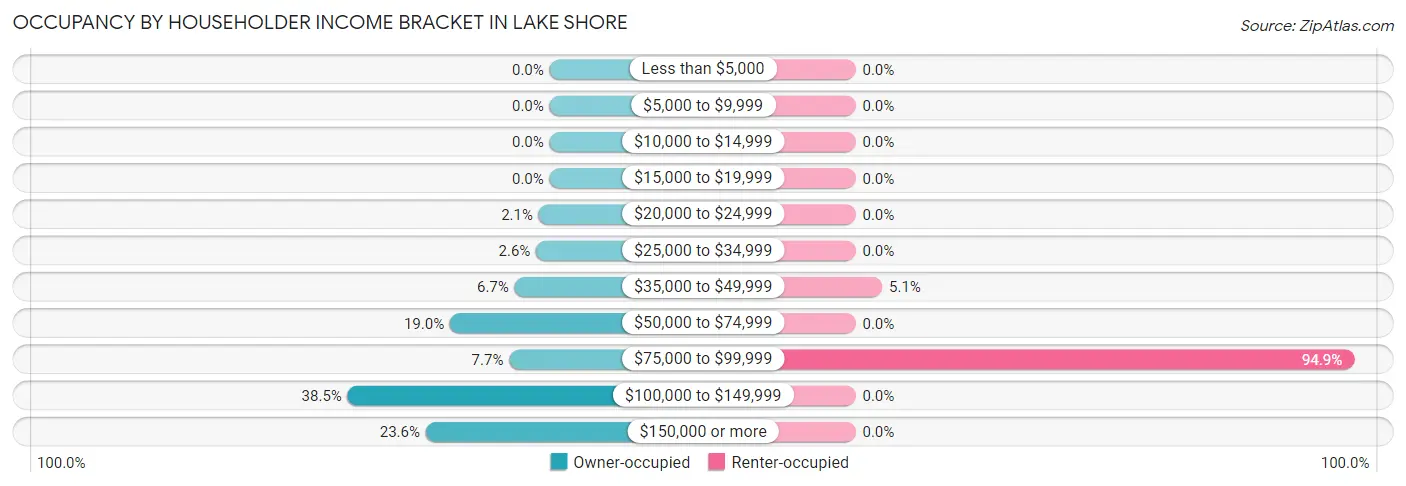
| Income Bracket | Owner-occupied | Renter-occupied |
| Less than $5,000 | 0 (0.0%) | 0 (0.0%) |
| $5,000 to $9,999 | 0 (0.0%) | 0 (0.0%) |
| $10,000 to $14,999 | 0 (0.0%) | 0 (0.0%) |
| $15,000 to $19,999 | 0 (0.0%) | 0 (0.0%) |
| $20,000 to $24,999 | 4 (2.1%) | 0 (0.0%) |
| $25,000 to $34,999 | 5 (2.6%) | 0 (0.0%) |
| $35,000 to $49,999 | 13 (6.7%) | 4 (5.1%) |
| $50,000 to $74,999 | 37 (19.0%) | 0 (0.0%) |
| $75,000 to $99,999 | 15 (7.7%) | 75 (94.9%) |
| $100,000 to $149,999 | 75 (38.5%) | 0 (0.0%) |
| $150,000 or more | 46 (23.6%) | 0 (0.0%) |
| Total | 195 (100.0%) | 79 (100.0%) |
Monthly Housing Cost Tiers in Lake Shore
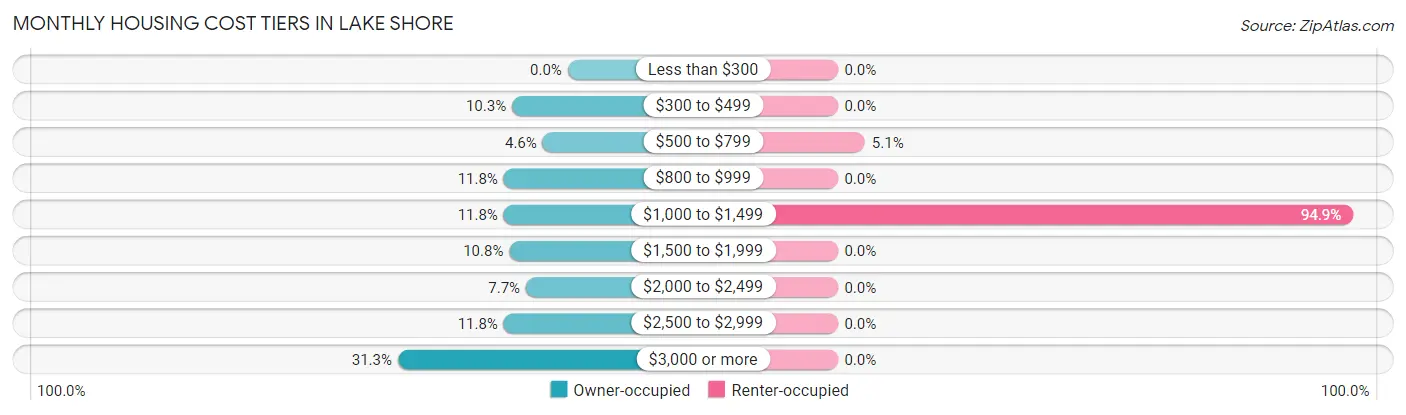
| Monthly Cost | Owner-occupied | Renter-occupied |
| Less than $300 | 0 (0.0%) | 0 (0.0%) |
| $300 to $499 | 20 (10.3%) | 0 (0.0%) |
| $500 to $799 | 9 (4.6%) | 4 (5.1%) |
| $800 to $999 | 23 (11.8%) | 0 (0.0%) |
| $1,000 to $1,499 | 23 (11.8%) | 75 (94.9%) |
| $1,500 to $1,999 | 21 (10.8%) | 0 (0.0%) |
| $2,000 to $2,499 | 15 (7.7%) | 0 (0.0%) |
| $2,500 to $2,999 | 23 (11.8%) | 0 (0.0%) |
| $3,000 or more | 61 (31.3%) | 0 (0.0%) |
| Total | 195 (100.0%) | 79 (100.0%) |
Physical Housing Characteristics in Lake Shore
Housing Structures in Lake Shore
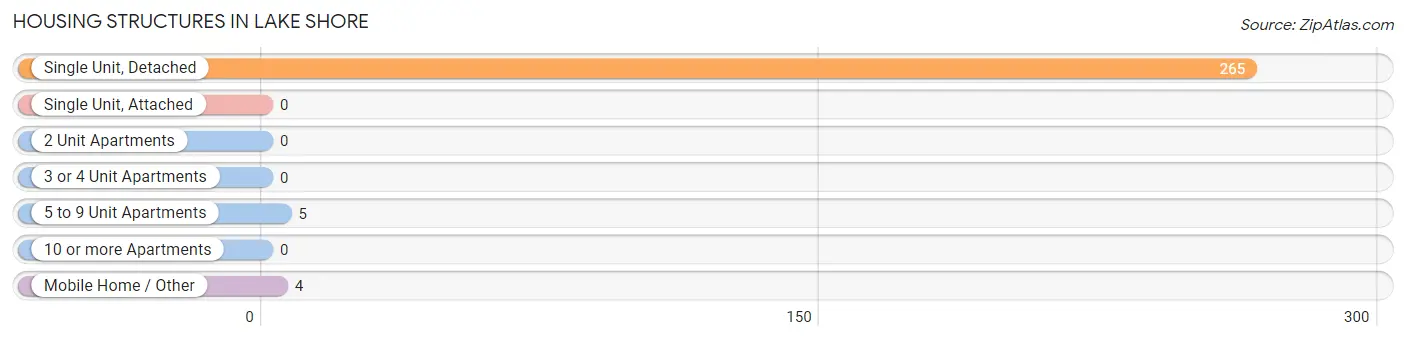
| Structure Type | # Housing Units | % Housing Units |
| Single Unit, Detached | 265 | 96.7% |
| Single Unit, Attached | 0 | 0.0% |
| 2 Unit Apartments | 0 | 0.0% |
| 3 or 4 Unit Apartments | 0 | 0.0% |
| 5 to 9 Unit Apartments | 5 | 1.8% |
| 10 or more Apartments | 0 | 0.0% |
| Mobile Home / Other | 4 | 1.5% |
| Total | 274 | 100.0% |
Housing Structures by Occupancy in Lake Shore
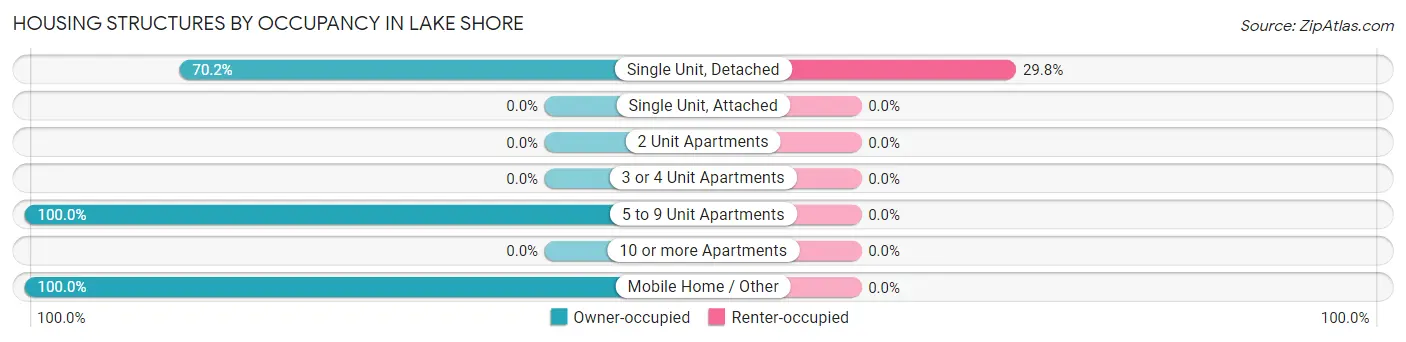
| Structure Type | Owner-occupied | Renter-occupied |
| Single Unit, Detached | 186 (70.2%) | 79 (29.8%) |
| Single Unit, Attached | 0 (0.0%) | 0 (0.0%) |
| 2 Unit Apartments | 0 (0.0%) | 0 (0.0%) |
| 3 or 4 Unit Apartments | 0 (0.0%) | 0 (0.0%) |
| 5 to 9 Unit Apartments | 5 (100.0%) | 0 (0.0%) |
| 10 or more Apartments | 0 (0.0%) | 0 (0.0%) |
| Mobile Home / Other | 4 (100.0%) | 0 (0.0%) |
| Total | 195 (71.2%) | 79 (28.8%) |
Housing Structures by Number of Rooms in Lake Shore
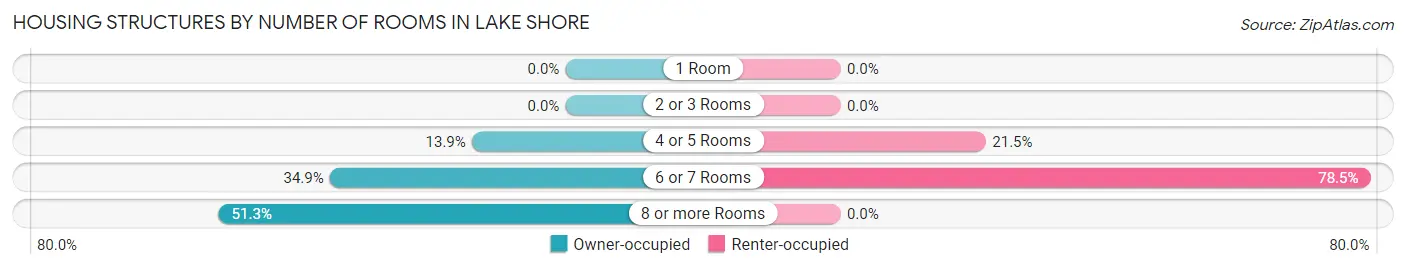
| Number of Rooms | Owner-occupied | Renter-occupied |
| 1 Room | 0 (0.0%) | 0 (0.0%) |
| 2 or 3 Rooms | 0 (0.0%) | 0 (0.0%) |
| 4 or 5 Rooms | 27 (13.9%) | 17 (21.5%) |
| 6 or 7 Rooms | 68 (34.9%) | 62 (78.5%) |
| 8 or more Rooms | 100 (51.3%) | 0 (0.0%) |
| Total | 195 (100.0%) | 79 (100.0%) |
Housing Structure by Heating Type in Lake Shore
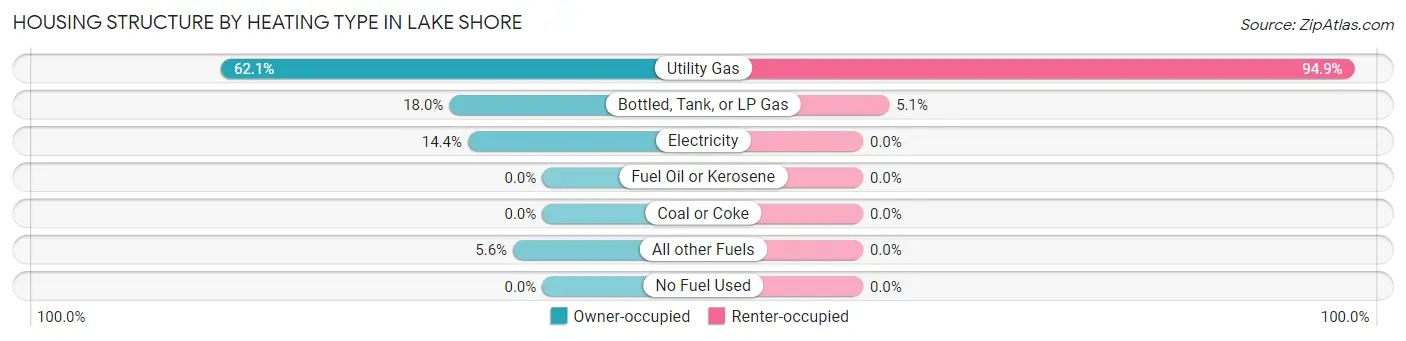
| Heating Type | Owner-occupied | Renter-occupied |
| Utility Gas | 121 (62.1%) | 75 (94.9%) |
| Bottled, Tank, or LP Gas | 35 (17.9%) | 4 (5.1%) |
| Electricity | 28 (14.4%) | 0 (0.0%) |
| Fuel Oil or Kerosene | 0 (0.0%) | 0 (0.0%) |
| Coal or Coke | 0 (0.0%) | 0 (0.0%) |
| All other Fuels | 11 (5.6%) | 0 (0.0%) |
| No Fuel Used | 0 (0.0%) | 0 (0.0%) |
| Total | 195 (100.0%) | 79 (100.0%) |
Household Vehicle Usage in Lake Shore
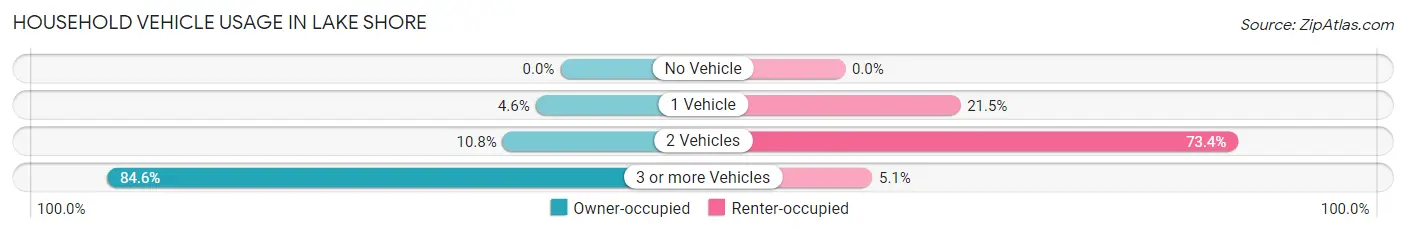
| Vehicles per Household | Owner-occupied | Renter-occupied |
| No Vehicle | 0 (0.0%) | 0 (0.0%) |
| 1 Vehicle | 9 (4.6%) | 17 (21.5%) |
| 2 Vehicles | 21 (10.8%) | 58 (73.4%) |
| 3 or more Vehicles | 165 (84.6%) | 4 (5.1%) |
| Total | 195 (100.0%) | 79 (100.0%) |
Real Estate & Mortgages in Lake Shore
Real Estate and Mortgage Overview in Lake Shore
| Characteristic | Without Mortgage | With Mortgage |
| Housing Units | 52 | 143 |
| Median Property Value | $657,400 | $550,700 |
| Median Household Income | $114,000 | $24 |
| Monthly Housing Costs | $567 | $61 |
| Real Estate Taxes | $2,231 | $0 |
Property Value by Mortgage Status in Lake Shore
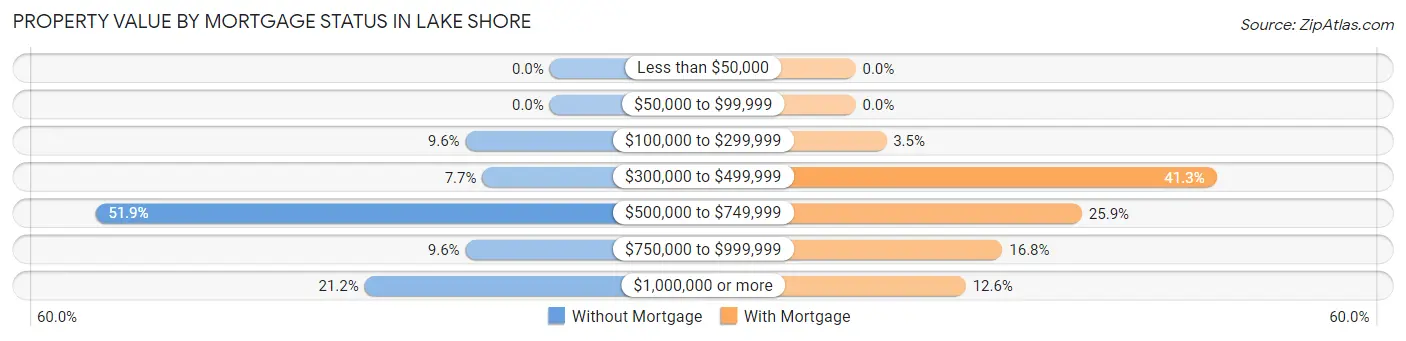
| Property Value | Without Mortgage | With Mortgage |
| Less than $50,000 | 0 (0.0%) | 0 (0.0%) |
| $50,000 to $99,999 | 0 (0.0%) | 0 (0.0%) |
| $100,000 to $299,999 | 5 (9.6%) | 5 (3.5%) |
| $300,000 to $499,999 | 4 (7.7%) | 59 (41.3%) |
| $500,000 to $749,999 | 27 (51.9%) | 37 (25.9%) |
| $750,000 to $999,999 | 5 (9.6%) | 24 (16.8%) |
| $1,000,000 or more | 11 (21.1%) | 18 (12.6%) |
| Total | 52 (100.0%) | 143 (100.0%) |
Household Income by Mortgage Status in Lake Shore
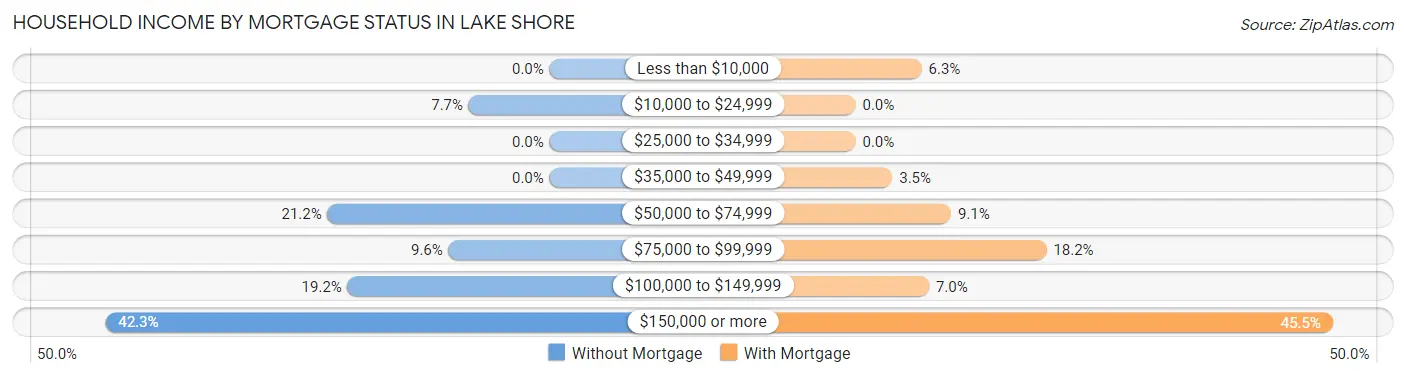
| Household Income | Without Mortgage | With Mortgage |
| Less than $10,000 | 0 (0.0%) | 9 (6.3%) |
| $10,000 to $24,999 | 4 (7.7%) | 0 (0.0%) |
| $25,000 to $34,999 | 0 (0.0%) | 0 (0.0%) |
| $35,000 to $49,999 | 0 (0.0%) | 5 (3.5%) |
| $50,000 to $74,999 | 11 (21.1%) | 13 (9.1%) |
| $75,000 to $99,999 | 5 (9.6%) | 26 (18.2%) |
| $100,000 to $149,999 | 10 (19.2%) | 10 (7.0%) |
| $150,000 or more | 22 (42.3%) | 65 (45.5%) |
| Total | 52 (100.0%) | 143 (100.0%) |
Property Value to Household Income Ratio in Lake Shore
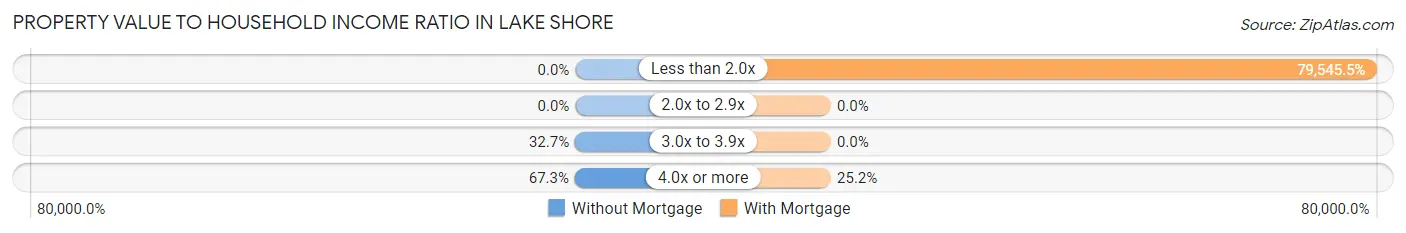
| Value-to-Income Ratio | Without Mortgage | With Mortgage |
| Less than 2.0x | 0 (0.0%) | 113,750 (79,545.5%) |
| 2.0x to 2.9x | 0 (0.0%) | 0 (0.0%) |
| 3.0x to 3.9x | 17 (32.7%) | 0 (0.0%) |
| 4.0x or more | 35 (67.3%) | 36 (25.2%) |
| Total | 52 (100.0%) | 143 (100.0%) |
Real Estate Taxes by Mortgage Status in Lake Shore
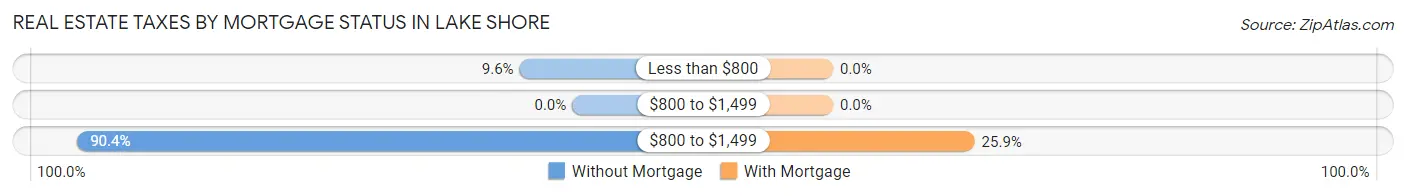
| Property Taxes | Without Mortgage | With Mortgage |
| Less than $800 | 5 (9.6%) | 0 (0.0%) |
| $800 to $1,499 | 0 (0.0%) | 0 (0.0%) |
| $800 to $1,499 | 47 (90.4%) | 37 (25.9%) |
| Total | 52 (100.0%) | 143 (100.0%) |
Health & Disability in Lake Shore
Health Insurance Coverage by Age in Lake Shore
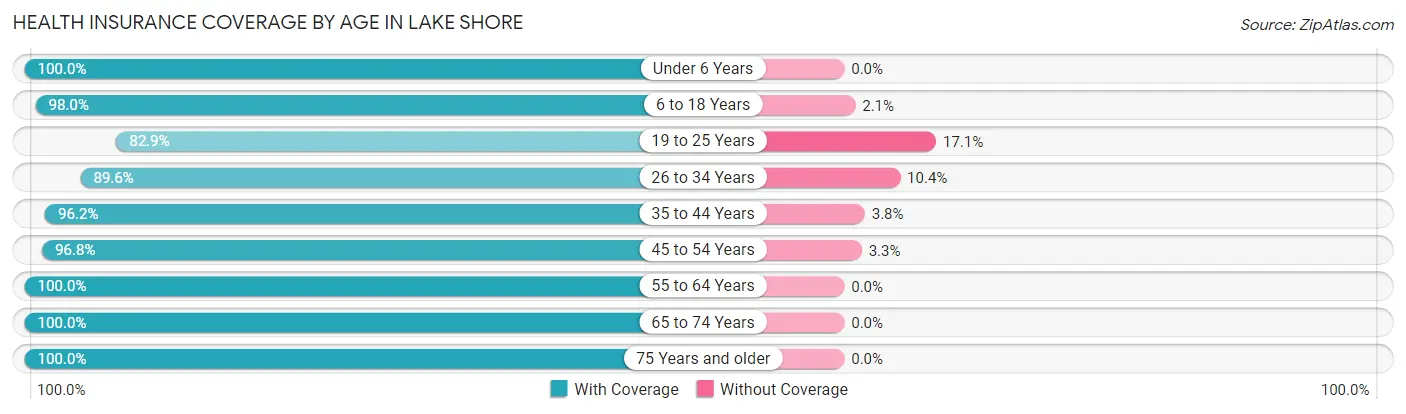
| Age Bracket | With Coverage | Without Coverage |
| Under 6 Years | 43 (100.0%) | 0 (0.0%) |
| 6 to 18 Years | 526 (98.0%) | 11 (2.1%) |
| 19 to 25 Years | 63 (82.9%) | 13 (17.1%) |
| 26 to 34 Years | 43 (89.6%) | 5 (10.4%) |
| 35 to 44 Years | 126 (96.2%) | 5 (3.8%) |
| 45 to 54 Years | 268 (96.8%) | 9 (3.3%) |
| 55 to 64 Years | 86 (100.0%) | 0 (0.0%) |
| 65 to 74 Years | 10 (100.0%) | 0 (0.0%) |
| 75 Years and older | 12 (100.0%) | 0 (0.0%) |
| Total | 1,177 (96.5%) | 43 (3.5%) |
Health Insurance Coverage by Citizenship Status in Lake Shore
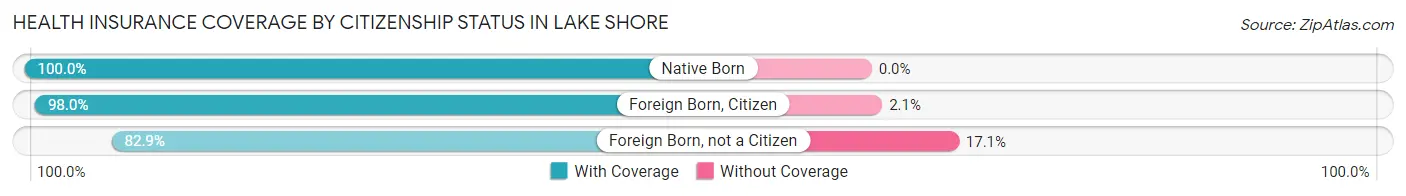
| Citizenship Status | With Coverage | Without Coverage |
| Native Born | 43 (100.0%) | 0 (0.0%) |
| Foreign Born, Citizen | 526 (98.0%) | 11 (2.1%) |
| Foreign Born, not a Citizen | 63 (82.9%) | 13 (17.1%) |
Health Insurance Coverage by Household Income in Lake Shore
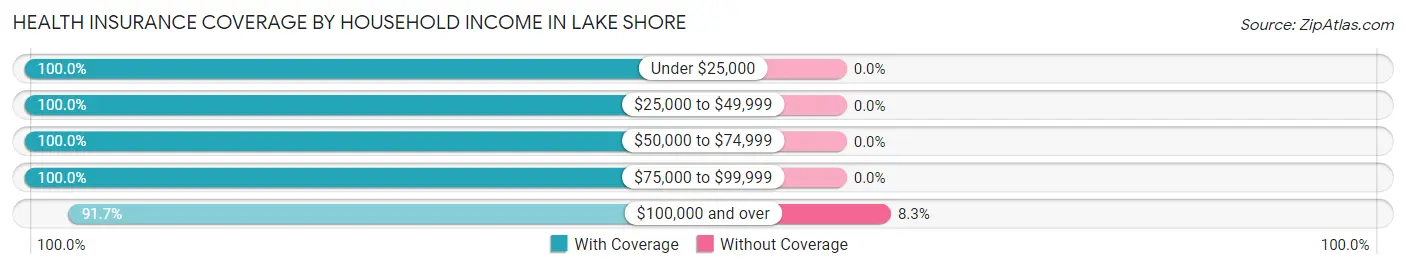
| Household Income | With Coverage | Without Coverage |
| Under $25,000 | 4 (100.0%) | 0 (0.0%) |
| $25,000 to $49,999 | 45 (100.0%) | 0 (0.0%) |
| $50,000 to $74,999 | 123 (100.0%) | 0 (0.0%) |
| $75,000 to $99,999 | 528 (100.0%) | 0 (0.0%) |
| $100,000 and over | 477 (91.7%) | 43 (8.3%) |
Public vs Private Health Insurance Coverage by Age in Lake Shore
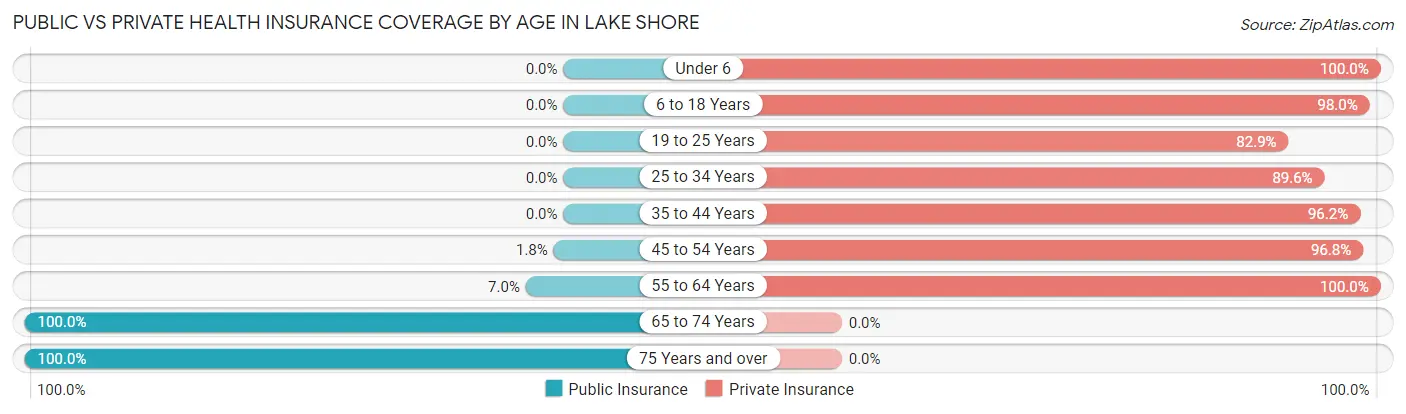
| Age Bracket | Public Insurance | Private Insurance |
| Under 6 | 0 (0.0%) | 43 (100.0%) |
| 6 to 18 Years | 0 (0.0%) | 526 (98.0%) |
| 19 to 25 Years | 0 (0.0%) | 63 (82.9%) |
| 25 to 34 Years | 0 (0.0%) | 43 (89.6%) |
| 35 to 44 Years | 0 (0.0%) | 126 (96.2%) |
| 45 to 54 Years | 5 (1.8%) | 268 (96.8%) |
| 55 to 64 Years | 6 (7.0%) | 86 (100.0%) |
| 65 to 74 Years | 10 (100.0%) | 0 (0.0%) |
| 75 Years and over | 12 (100.0%) | 0 (0.0%) |
| Total | 33 (2.7%) | 1,155 (94.7%) |
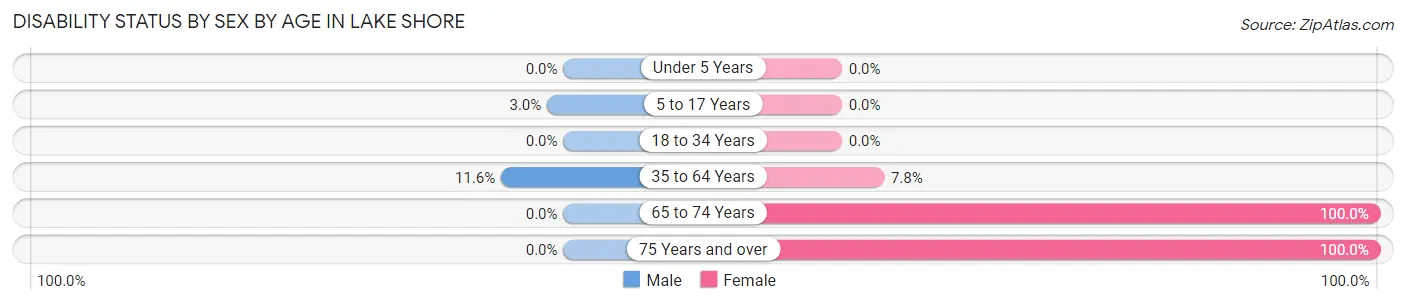
Disability Status by Sex by Age in Lake Shore
| Age Bracket | Male | Female |
| Under 5 Years | 0 (0.0%) | 0 (0.0%) |
| 5 to 17 Years | 5 (3.0%) | 0 (0.0%) |
| 18 to 34 Years | 0 (0.0%) | 0 (0.0%) |
| 35 to 64 Years | 29 (11.6%) | 19 (7.8%) |
| 65 to 74 Years | 0 (0.0%) | 10 (100.0%) |
| 75 Years and over | 0 (0.0%) | 8 (100.0%) |
Disability Class by Sex by Age in Lake Shore
Disability Class: Hearing Difficulty
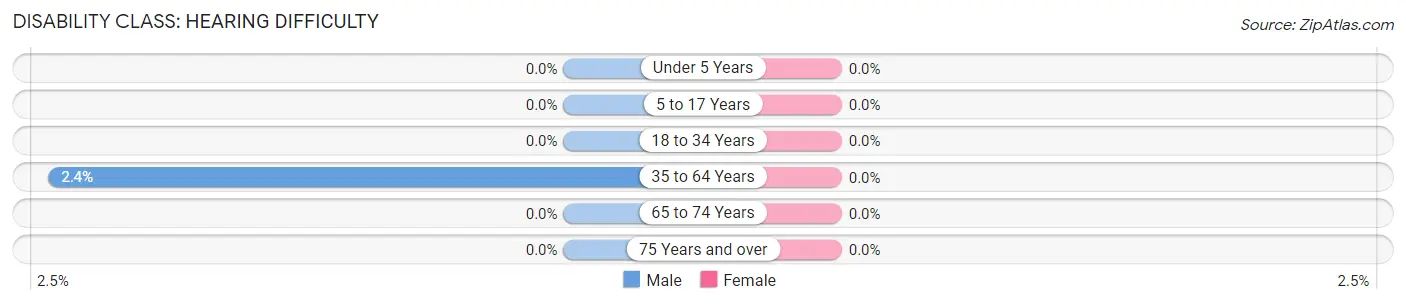
| Age Bracket | Male | Female |
| Under 5 Years | 0 (0.0%) | 0 (0.0%) |
| 5 to 17 Years | 0 (0.0%) | 0 (0.0%) |
| 18 to 34 Years | 0 (0.0%) | 0 (0.0%) |
| 35 to 64 Years | 6 (2.4%) | 0 (0.0%) |
| 65 to 74 Years | 0 (0.0%) | 0 (0.0%) |
| 75 Years and over | 0 (0.0%) | 0 (0.0%) |
Disability Class: Vision Difficulty
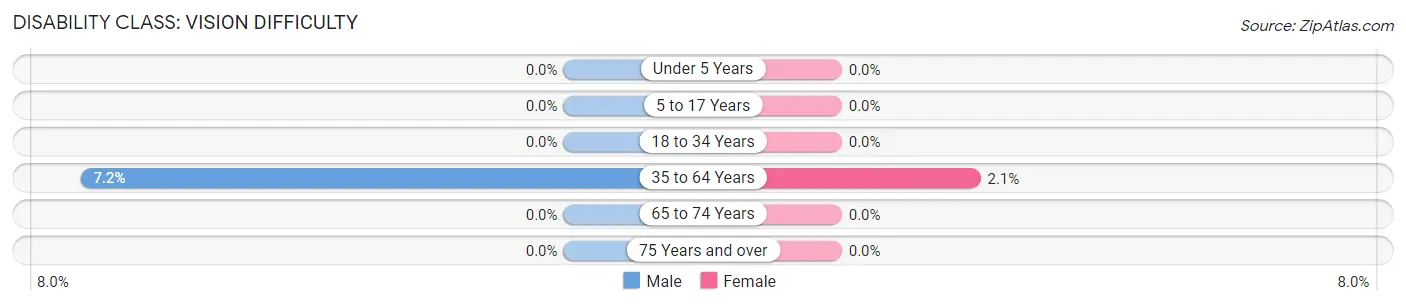
| Age Bracket | Male | Female |
| Under 5 Years | 0 (0.0%) | 0 (0.0%) |
| 5 to 17 Years | 0 (0.0%) | 0 (0.0%) |
| 18 to 34 Years | 0 (0.0%) | 0 (0.0%) |
| 35 to 64 Years | 18 (7.2%) | 5 (2.1%) |
| 65 to 74 Years | 0 (0.0%) | 0 (0.0%) |
| 75 Years and over | 0 (0.0%) | 0 (0.0%) |
Disability Class: Cognitive Difficulty
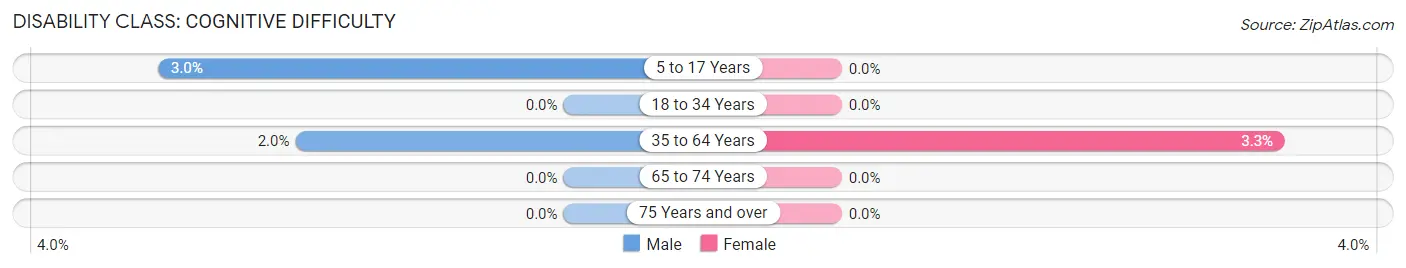
| Age Bracket | Male | Female |
| 5 to 17 Years | 5 (3.0%) | 0 (0.0%) |
| 18 to 34 Years | 0 (0.0%) | 0 (0.0%) |
| 35 to 64 Years | 5 (2.0%) | 8 (3.3%) |
| 65 to 74 Years | 0 (0.0%) | 0 (0.0%) |
| 75 Years and over | 0 (0.0%) | 0 (0.0%) |
Disability Class: Ambulatory Difficulty
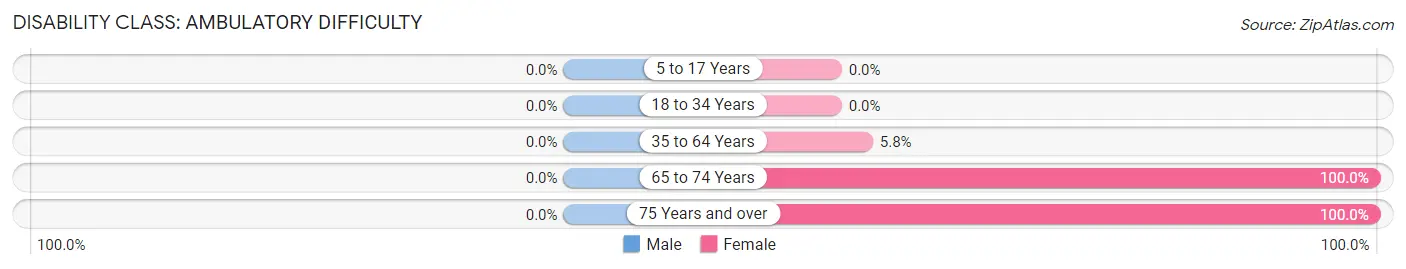
| Age Bracket | Male | Female |
| 5 to 17 Years | 0 (0.0%) | 0 (0.0%) |
| 18 to 34 Years | 0 (0.0%) | 0 (0.0%) |
| 35 to 64 Years | 0 (0.0%) | 14 (5.8%) |
| 65 to 74 Years | 0 (0.0%) | 10 (100.0%) |
| 75 Years and over | 0 (0.0%) | 8 (100.0%) |
Disability Class: Self-Care Difficulty
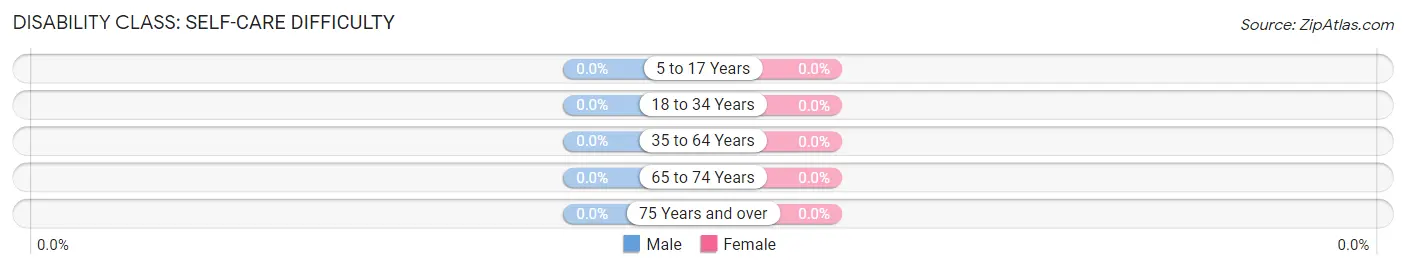
| Age Bracket | Male | Female |
| 5 to 17 Years | 0 (0.0%) | 0 (0.0%) |
| 18 to 34 Years | 0 (0.0%) | 0 (0.0%) |
| 35 to 64 Years | 0 (0.0%) | 0 (0.0%) |
| 65 to 74 Years | 0 (0.0%) | 0 (0.0%) |
| 75 Years and over | 0 (0.0%) | 0 (0.0%) |
Technology Access in Lake Shore
Computing Device Access in Lake Shore
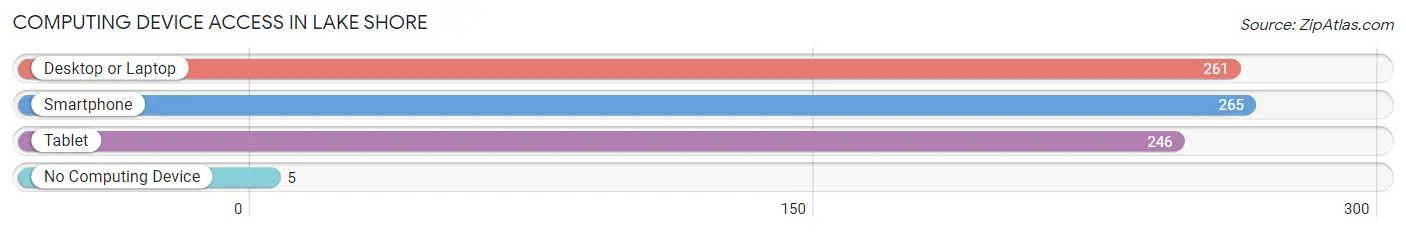
| Device Type | # Households | % Households |
| Desktop or Laptop | 261 | 95.3% |
| Smartphone | 265 | 96.7% |
| Tablet | 246 | 89.8% |
| No Computing Device | 5 | 1.8% |
| Total | 274 | 100.0% |
Internet Access in Lake Shore
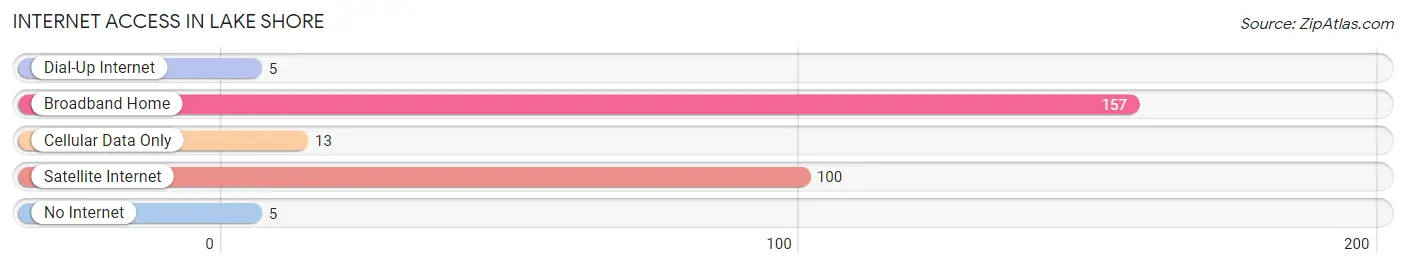
| Internet Type | # Households | % Households |
| Dial-Up Internet | 5 | 1.8% |
| Broadband Home | 157 | 57.3% |
| Cellular Data Only | 13 | 4.7% |
| Satellite Internet | 100 | 36.5% |
| No Internet | 5 | 1.8% |
| Total | 274 | 100.0% |
Lake Shore Summary
Lake Shore is a small town located in the state of Utah, in the United States. It is situated in the southeastern corner of the state, near the border with Arizona. The town is located in the middle of the Grand Staircase-Escalante National Monument, a protected area of land that is home to a variety of wildlife and plant species. The town is also located near the Glen Canyon National Recreation Area, which is a popular destination for outdoor recreation.
The town of Lake Shore was founded in 1876 by Mormon settlers. The town was originally called "Lake Shore City" and was the first settlement in the area. The town was named after the nearby lake, which was named after the nearby mountain range. The town was originally a farming community, but over time it has become a popular tourist destination.
The town of Lake Shore has a population of approximately 1,000 people. The majority of the population is white, with a small percentage of African Americans, Native Americans, and Hispanics. The median household income in the town is $45,000, and the median home value is $150,000. The town is served by two public schools, and there are several private schools in the area.
The economy of Lake Shore is largely based on tourism. The town is home to several resorts, hotels, and restaurants, as well as a variety of outdoor activities. The town is also home to a number of art galleries, museums, and other cultural attractions. The town is also home to a number of businesses, including a grocery store, a hardware store, and a gas station.
The geography of Lake Shore is characterized by its mountainous terrain. The town is located in the middle of the Grand Staircase-Escalante National Monument, which is a protected area of land that is home to a variety of wildlife and plant species. The town is also located near the Glen Canyon National Recreation Area, which is a popular destination for outdoor recreation.
The climate of Lake Shore is generally mild, with temperatures ranging from the mid-50s in the winter to the mid-80s in the summer. The town receives an average of 18 inches of precipitation per year, with most of it falling in the form of snow.
Lake Shore is a small town with a rich history and a vibrant economy. The town is home to a variety of attractions, businesses, and outdoor activities, making it a great place to visit or live. The town is also home to a diverse population, making it a great place to experience different cultures.
Common Questions
What is Per Capita Income in Lake Shore?
Per Capita income in Lake Shore is $24,275.
What is the Median Family Income in Lake Shore?
Median Family Income in Lake Shore is $105,667.
What is the Median Household income in Lake Shore?
Median Household Income in Lake Shore is $91,912.
What is Inequality or Gini Index in Lake Shore?
Inequality or Gini Index in Lake Shore is 0.25.
What is the Total Population of Lake Shore?
Total Population of Lake Shore is 1,235.
What is the Total Male Population of Lake Shore?
Total Male Population of Lake Shore is 524.
What is the Total Female Population of Lake Shore?
Total Female Population of Lake Shore is 711.
What is the Ratio of Males per 100 Females in Lake Shore?
There are 73.70 Males per 100 Females in Lake Shore.
What is the Ratio of Females per 100 Males in Lake Shore?
There are 135.69 Females per 100 Males in Lake Shore.
What is the Median Population Age in Lake Shore?
Median Population Age in Lake Shore is 20.1 Years.
What is the Average Family Size in Lake Shore
Average Family Size in Lake Shore is 5.0 People.
What is the Average Household Size in Lake Shore
Average Household Size in Lake Shore is 4.5 People.
How Large is the Labor Force in Lake Shore?
There are 562 People in the Labor Forcein in Lake Shore.
What is the Percentage of People in the Labor Force in Lake Shore?
70.5% of People are in the Labor Force in Lake Shore.
What is the Unemployment Rate in Lake Shore?
Unemployment Rate in Lake Shore is 13.9%.