Zip Codes with the Highest Percentage of Population Employed in Health Diagnosing & Treating in West Valley City, UT
RELATED REPORTS & OPTIONS
Health Diagnosing & Treating
West Valley City
Compare Zip Codes
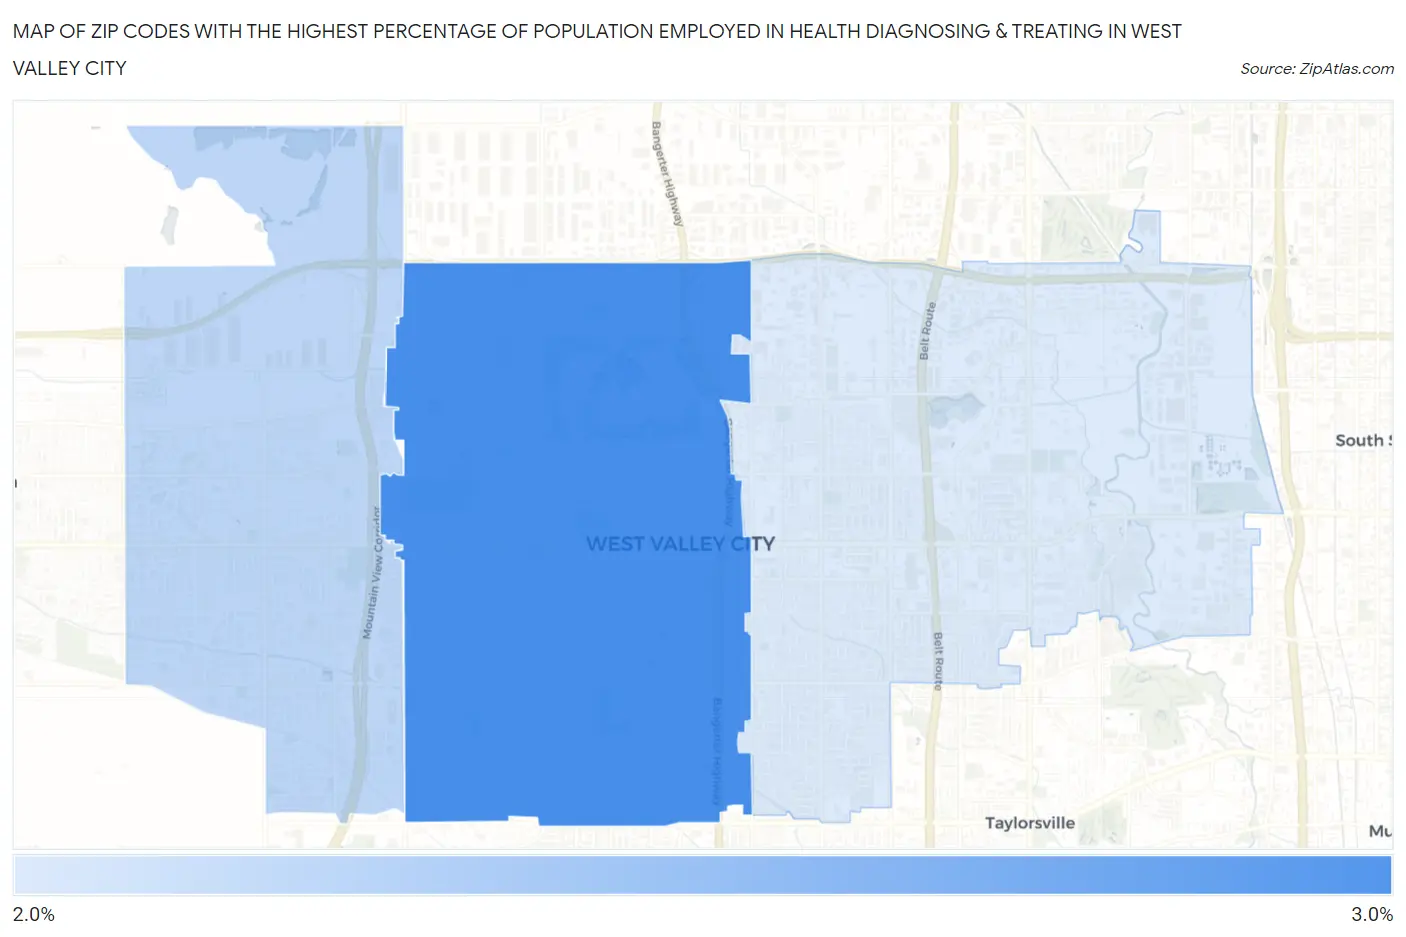
Map of Zip Codes with the Highest Percentage of Population Employed in Health Diagnosing & Treating in West Valley City
2.4%
2.7%
Zip Codes with the Highest Percentage of Population Employed in Health Diagnosing & Treating in West Valley City, UT
| Zip Code | % Employed | vs State | vs National | |
| 1. | 84120 | 2.7% | 5.1%(-2.42)#189 | 6.2%(-3.54)#25,054 |
| 2. | 84128 | 2.5% | 5.1%(-2.63)#197 | 6.2%(-3.75)#25,529 |
| 3. | 84119 | 2.4% | 5.1%(-2.68)#199 | 6.2%(-3.80)#25,650 |
1
Common Questions
What are the Top Zip Codes with the Highest Percentage of Population Employed in Health Diagnosing & Treating in West Valley City, UT?
Top Zip Codes with the Highest Percentage of Population Employed in Health Diagnosing & Treating in West Valley City, UT are:
What zip code has the Highest Percentage of Population Employed in Health Diagnosing & Treating in West Valley City, UT?
84120 has the Highest Percentage of Population Employed in Health Diagnosing & Treating in West Valley City, UT with 2.7%.
What is the Percentage of Population Employed in Health Diagnosing & Treating in West Valley City, UT?
Percentage of Population Employed in Health Diagnosing & Treating in West Valley City is 2.7%.
What is the Percentage of Population Employed in Health Diagnosing & Treating in Utah?
Percentage of Population Employed in Health Diagnosing & Treating in Utah is 5.1%.
What is the Percentage of Population Employed in Health Diagnosing & Treating in the United States?
Percentage of Population Employed in Health Diagnosing & Treating in the United States is 6.2%.