Zip Codes with the Highest Percentage of Population Employed in Health Diagnosing & Treating in Provo, UT
RELATED REPORTS & OPTIONS
Health Diagnosing & Treating
Provo
Compare Zip Codes
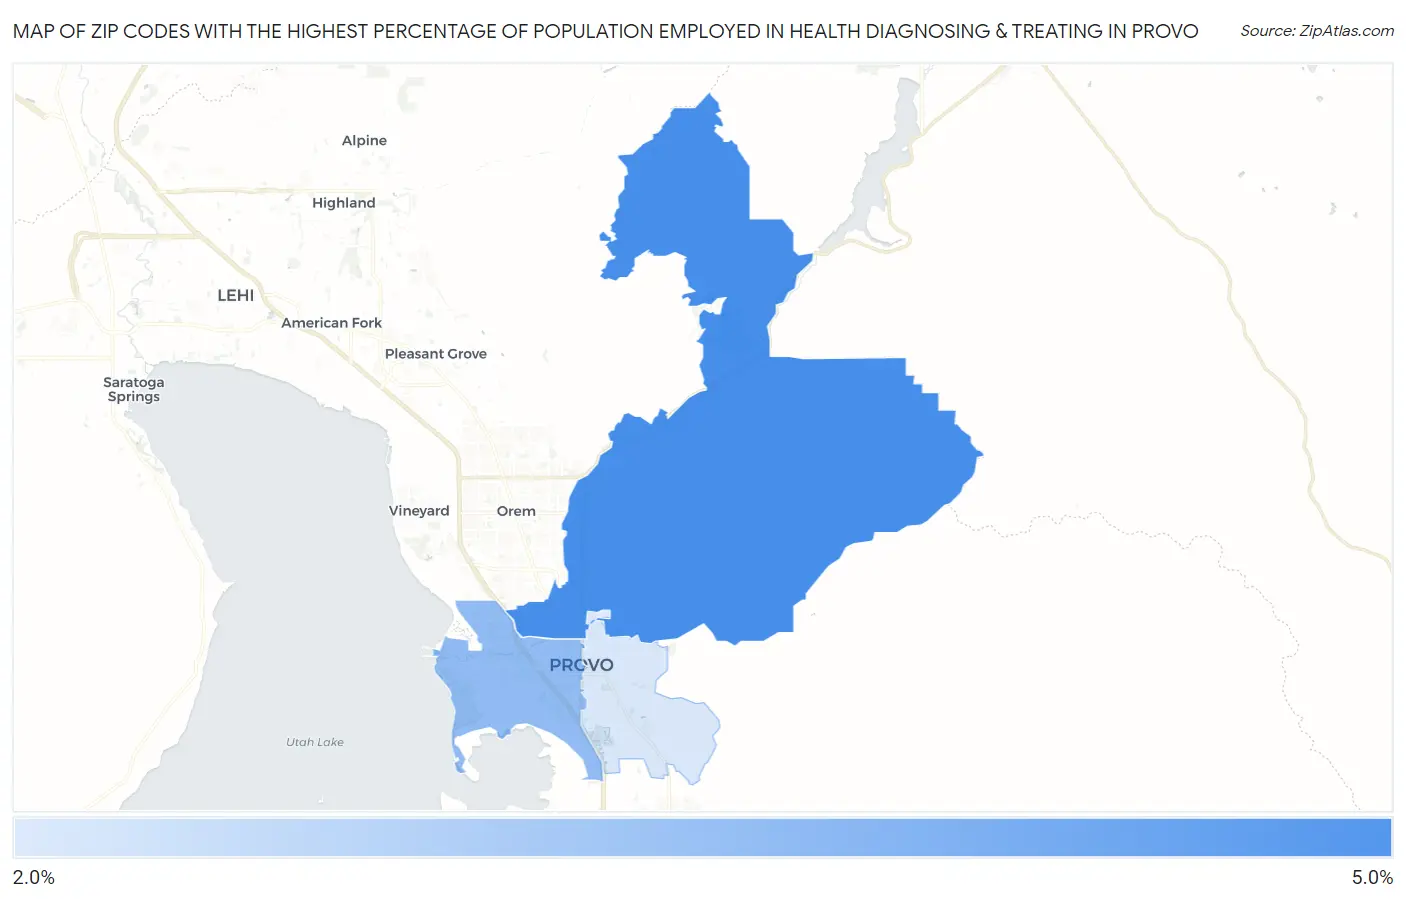
Map of Zip Codes with the Highest Percentage of Population Employed in Health Diagnosing & Treating in Provo
2.7%
4.1%
Zip Codes with the Highest Percentage of Population Employed in Health Diagnosing & Treating in Provo, UT
| Zip Code | % Employed | vs State | vs National | |
| 1. | 84604 | 4.1% | 5.1%(-1.04)#133 | 6.2%(-2.16)#21,100 |
| 2. | 84601 | 3.4% | 5.1%(-1.72)#160 | 6.2%(-2.84)#23,166 |
| 3. | 84606 | 2.8% | 5.1%(-2.36)#182 | 6.2%(-3.48)#24,913 |
| 4. | 84602 | 2.7% | 5.1%(-2.41)#187 | 6.2%(-3.53)#25,004 |
1
Common Questions
What are the Top 3 Zip Codes with the Highest Percentage of Population Employed in Health Diagnosing & Treating in Provo, UT?
Top 3 Zip Codes with the Highest Percentage of Population Employed in Health Diagnosing & Treating in Provo, UT are:
What zip code has the Highest Percentage of Population Employed in Health Diagnosing & Treating in Provo, UT?
84604 has the Highest Percentage of Population Employed in Health Diagnosing & Treating in Provo, UT with 4.1%.
What is the Percentage of Population Employed in Health Diagnosing & Treating in Provo, UT?
Percentage of Population Employed in Health Diagnosing & Treating in Provo is 3.4%.
What is the Percentage of Population Employed in Health Diagnosing & Treating in Utah?
Percentage of Population Employed in Health Diagnosing & Treating in Utah is 5.1%.
What is the Percentage of Population Employed in Health Diagnosing & Treating in the United States?
Percentage of Population Employed in Health Diagnosing & Treating in the United States is 6.2%.