Zip Codes with the Highest Percentage of Population Employed in Health Diagnosing & Treating in Park City, UT
RELATED REPORTS & OPTIONS
Health Diagnosing & Treating
Park City
Compare Zip Codes
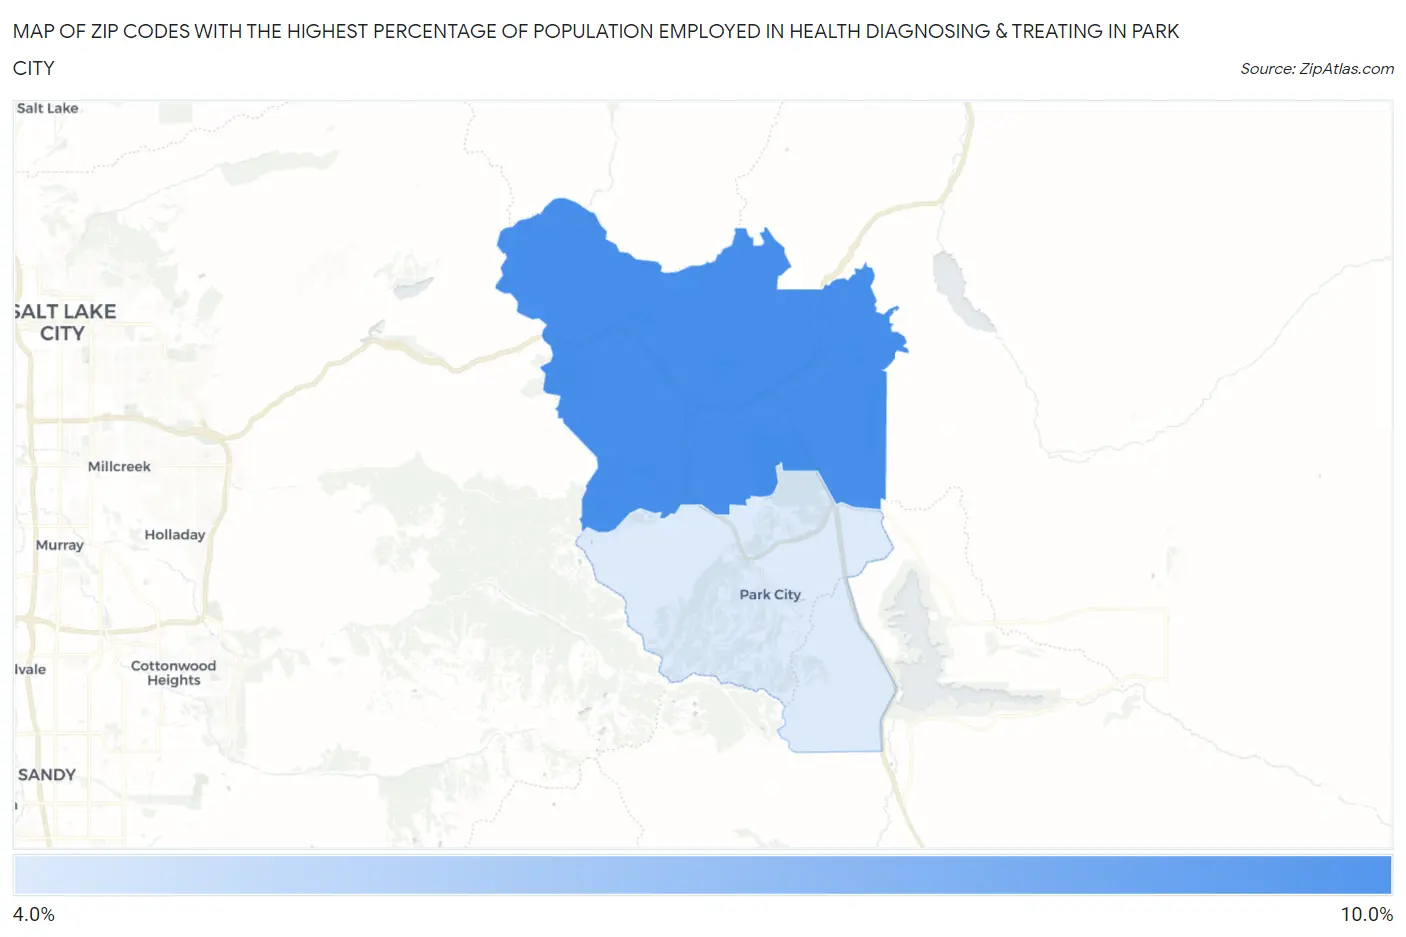
Map of Zip Codes with the Highest Percentage of Population Employed in Health Diagnosing & Treating in Park City
4.6%
8.6%
Zip Codes with the Highest Percentage of Population Employed in Health Diagnosing & Treating in Park City, UT
| Zip Code | % Employed | vs State | vs National | |
| 1. | 84098 | 8.6% | 5.1%(+3.47)#33 | 6.2%(+2.35)#6,144 |
| 2. | 84060 | 4.6% | 5.1%(-0.495)#109 | 6.2%(-1.62)#19,139 |
1
Common Questions
What are the Top Zip Codes with the Highest Percentage of Population Employed in Health Diagnosing & Treating in Park City, UT?
Top Zip Codes with the Highest Percentage of Population Employed in Health Diagnosing & Treating in Park City, UT are:
What zip code has the Highest Percentage of Population Employed in Health Diagnosing & Treating in Park City, UT?
84098 has the Highest Percentage of Population Employed in Health Diagnosing & Treating in Park City, UT with 8.6%.
What is the Percentage of Population Employed in Health Diagnosing & Treating in Park City, UT?
Percentage of Population Employed in Health Diagnosing & Treating in Park City is 4.8%.
What is the Percentage of Population Employed in Health Diagnosing & Treating in Utah?
Percentage of Population Employed in Health Diagnosing & Treating in Utah is 5.1%.
What is the Percentage of Population Employed in Health Diagnosing & Treating in the United States?
Percentage of Population Employed in Health Diagnosing & Treating in the United States is 6.2%.