Benjamin, UT Map & Demographics
Benjamin Map
Benjamin Overview
$35,040
PER CAPITA INCOME
$102,250
AVG FAMILY INCOME
$100,375
AVG HOUSEHOLD INCOME
58.9%
WAGE / INCOME GAP [ % ]
41.1¢/ $1
WAGE / INCOME GAP [ $ ]
0.44
INEQUALITY / GINI INDEX
848
TOTAL POPULATION
431
MALE POPULATION
417
FEMALE POPULATION
103.36
MALES / 100 FEMALES
96.75
FEMALES / 100 MALES
36.3
MEDIAN AGE
4.0
AVG FAMILY SIZE
3.8
AVG HOUSEHOLD SIZE
359
LABOR FORCE [ PEOPLE ]
65.6%
PERCENT IN LABOR FORCE
Income in Benjamin
Income Overview in Benjamin
Per Capita Income in Benjamin is $35,040, while median incomes of families and households are $102,250 and $100,375 respectively.
| Characteristic | Number | Measure |
| Per Capita Income | 848 | $35,040 |
| Median Family Income | 206 | $102,250 |
| Mean Family Income | 206 | $145,514 |
| Median Household Income | 221 | $100,375 |
| Mean Household Income | 221 | $139,198 |
| Income Deficit | 206 | $0 |
| Wage / Income Gap (%) | 848 | 58.87% |
| Wage / Income Gap ($) | 848 | 41.13¢ per $1 |
| Gini / Inequality Index | 848 | 0.44 |
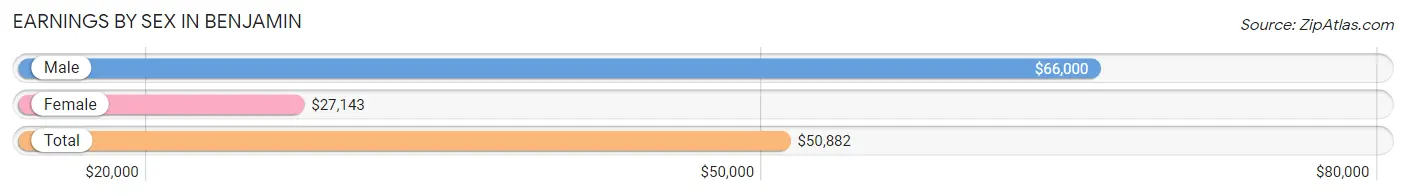
Earnings by Sex in Benjamin
Average Earnings in Benjamin are $50,882, $66,000 for men and $27,143 for women, a difference of 58.9%.
| Sex | Number | Average Earnings |
| Male | 200 (53.2%) | $66,000 |
| Female | 176 (46.8%) | $27,143 |
| Total | 376 (100.0%) | $50,882 |
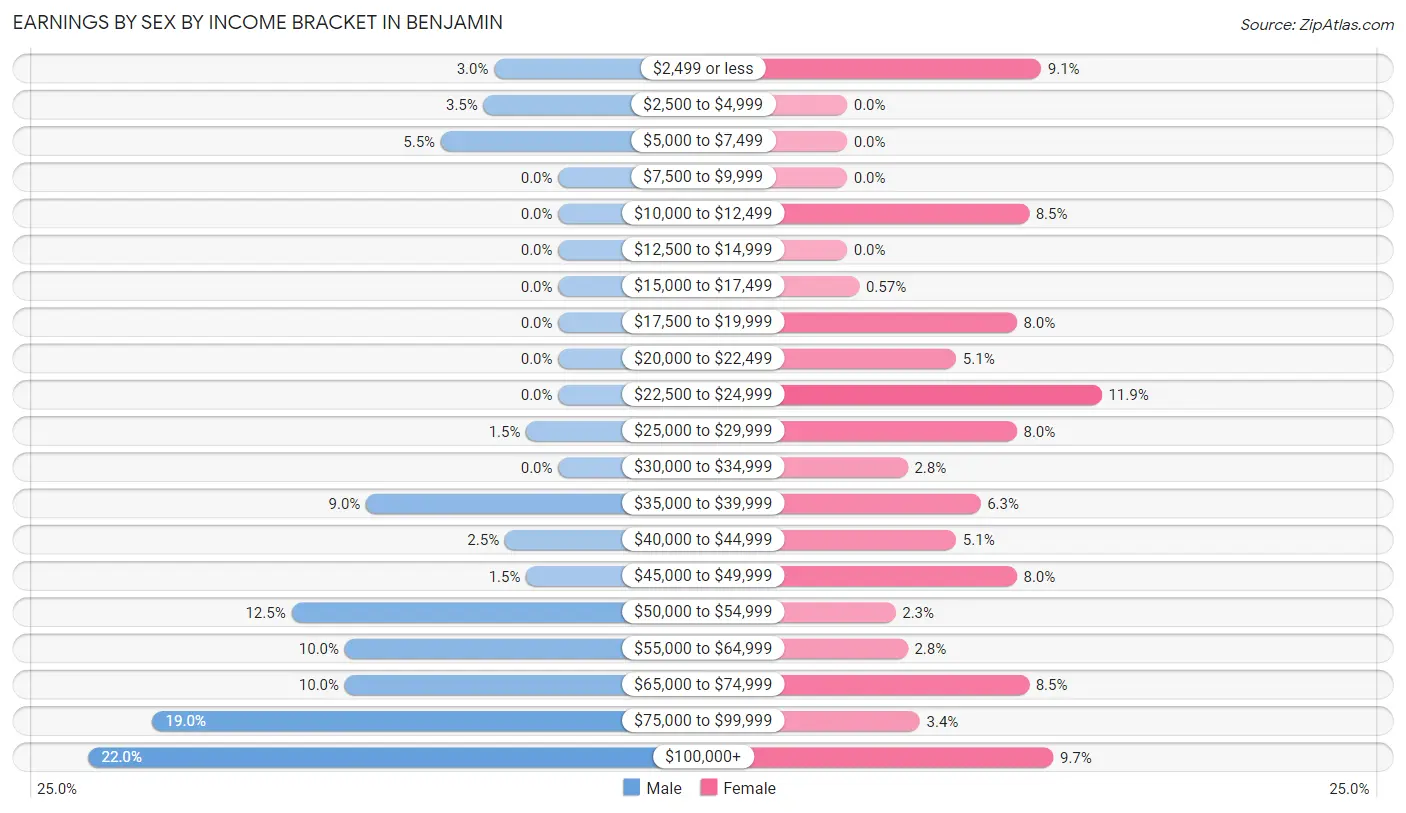
Earnings by Sex by Income Bracket in Benjamin
The most common earnings brackets in Benjamin are $100,000+ for men (44 | 22.0%) and $22,500 to $24,999 for women (21 | 11.9%).
| Income | Male | Female |
| $2,499 or less | 6 (3.0%) | 16 (9.1%) |
| $2,500 to $4,999 | 7 (3.5%) | 0 (0.0%) |
| $5,000 to $7,499 | 11 (5.5%) | 0 (0.0%) |
| $7,500 to $9,999 | 0 (0.0%) | 0 (0.0%) |
| $10,000 to $12,499 | 0 (0.0%) | 15 (8.5%) |
| $12,500 to $14,999 | 0 (0.0%) | 0 (0.0%) |
| $15,000 to $17,499 | 0 (0.0%) | 1 (0.6%) |
| $17,500 to $19,999 | 0 (0.0%) | 14 (8.0%) |
| $20,000 to $22,499 | 0 (0.0%) | 9 (5.1%) |
| $22,500 to $24,999 | 0 (0.0%) | 21 (11.9%) |
| $25,000 to $29,999 | 3 (1.5%) | 14 (8.0%) |
| $30,000 to $34,999 | 0 (0.0%) | 5 (2.8%) |
| $35,000 to $39,999 | 18 (9.0%) | 11 (6.2%) |
| $40,000 to $44,999 | 5 (2.5%) | 9 (5.1%) |
| $45,000 to $49,999 | 3 (1.5%) | 14 (8.0%) |
| $50,000 to $54,999 | 25 (12.5%) | 4 (2.3%) |
| $55,000 to $64,999 | 20 (10.0%) | 5 (2.8%) |
| $65,000 to $74,999 | 20 (10.0%) | 15 (8.5%) |
| $75,000 to $99,999 | 38 (19.0%) | 6 (3.4%) |
| $100,000+ | 44 (22.0%) | 17 (9.7%) |
| Total | 200 (100.0%) | 176 (100.0%) |
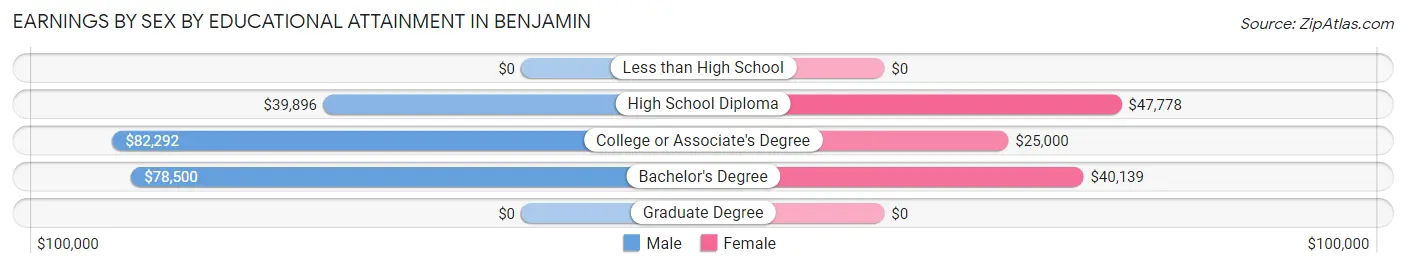
Earnings by Sex by Educational Attainment in Benjamin
Average earnings in Benjamin are $71,667 for men and $32,750 for women, a difference of 54.3%. Men with an educational attainment of college or associate's degree enjoy the highest average annual earnings of $82,292, while those with high school diploma education earn the least with $39,896. Women with an educational attainment of high school diploma earn the most with the average annual earnings of $47,778, while those with college or associate's degree education have the smallest earnings of $25,000.
| Educational Attainment | Male Income | Female Income |
| Less than High School | - | - |
| High School Diploma | $39,896 | $47,778 |
| College or Associate's Degree | $82,292 | $25,000 |
| Bachelor's Degree | $78,500 | $40,139 |
| Graduate Degree | - | - |
| Total | $71,667 | $32,750 |
Family Income in Benjamin
Family Income Brackets in Benjamin
According to the Benjamin family income data, there are 55 families falling into the $100,000 to $149,999 income range, which is the most common income bracket and makes up 26.7% of all families.
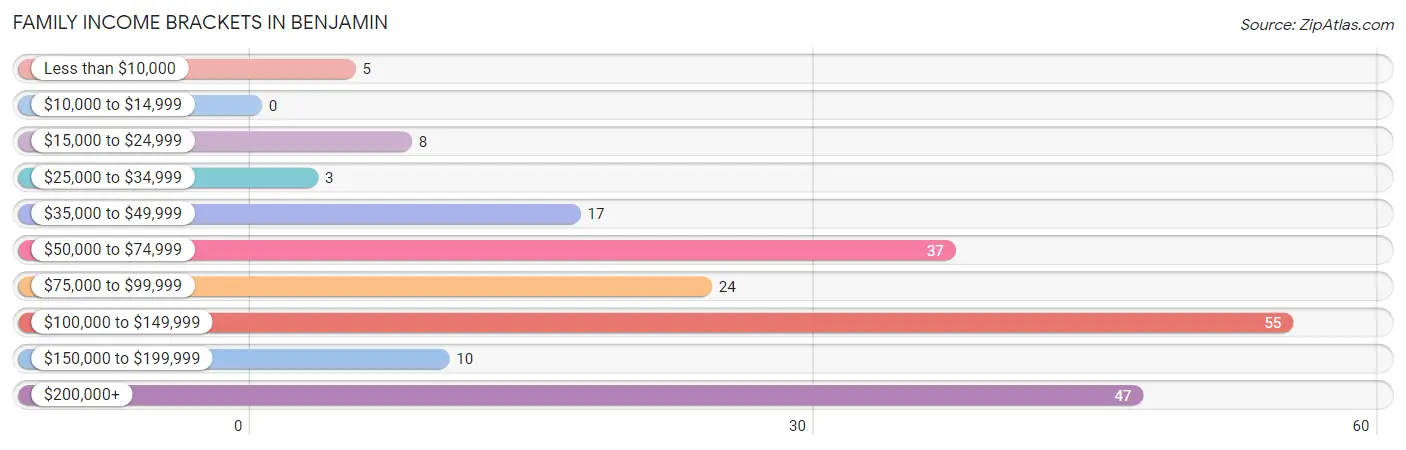
| Income Bracket | # Families | % Families |
| Less than $10,000 | 5 | 2.4% |
| $10,000 to $14,999 | 0 | 0.0% |
| $15,000 to $24,999 | 8 | 3.9% |
| $25,000 to $34,999 | 3 | 1.5% |
| $35,000 to $49,999 | 17 | 8.3% |
| $50,000 to $74,999 | 37 | 18.0% |
| $75,000 to $99,999 | 24 | 11.7% |
| $100,000 to $149,999 | 55 | 26.7% |
| $150,000 to $199,999 | 10 | 4.9% |
| $200,000+ | 47 | 22.8% |
Family Income by Famaliy Size in Benjamin
4-person families (11 | 5.3%) account for the highest median family income in Benjamin with $250,001 per family, while 4-person families (11 | 5.3%) have the highest median income of $62,500 per family member.
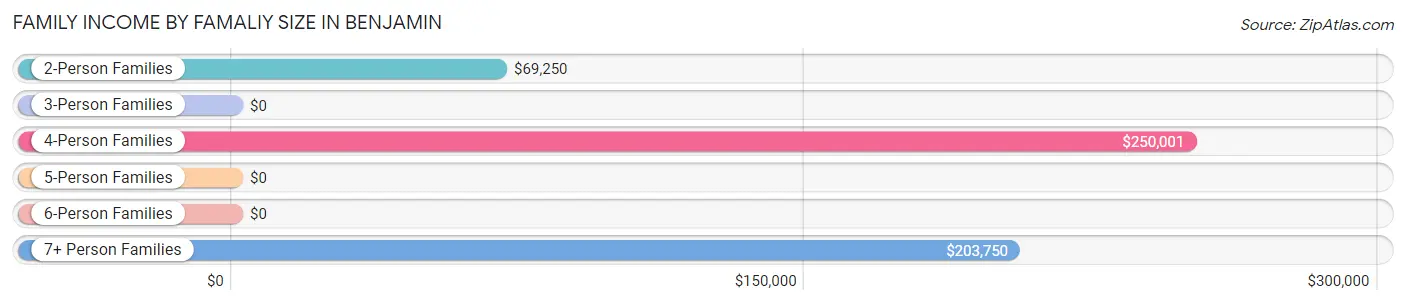
| Income Bracket | # Families | Median Income |
| 2-Person Families | 111 (53.9%) | $69,250 |
| 3-Person Families | 5 (2.4%) | $0 |
| 4-Person Families | 11 (5.3%) | $250,001 |
| 5-Person Families | 5 (2.4%) | $0 |
| 6-Person Families | 40 (19.4%) | $0 |
| 7+ Person Families | 34 (16.5%) | $203,750 |
| Total | 206 (100.0%) | $102,250 |
Family Income by Number of Earners in Benjamin
The median family income in Benjamin is $102,250, with families comprising 3+ earners (49) having the highest median family income of $250,001, while families with no earners (40) have the lowest median family income of $59,167, accounting for 23.8% and 19.4% of families, respectively.
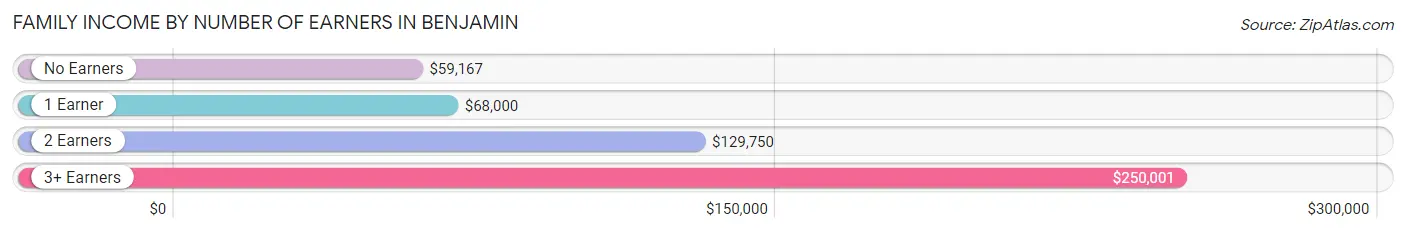
| Number of Earners | # Families | Median Income |
| No Earners | 40 (19.4%) | $59,167 |
| 1 Earner | 28 (13.6%) | $68,000 |
| 2 Earners | 89 (43.2%) | $129,750 |
| 3+ Earners | 49 (23.8%) | $250,001 |
| Total | 206 (100.0%) | $102,250 |
Household Income in Benjamin
Household Income Brackets in Benjamin
With 55 households falling in the category, the $100,000 to $149,999 income range is the most frequent in Benjamin, accounting for 24.9% of all households.
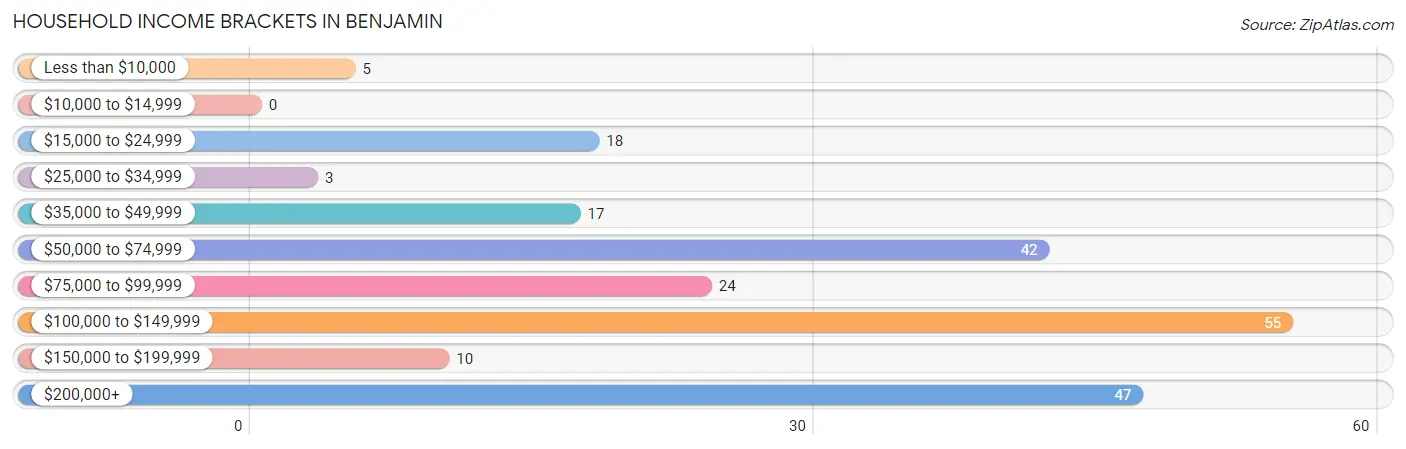
| Income Bracket | # Households | % Households |
| Less than $10,000 | 5 | 2.3% |
| $10,000 to $14,999 | 0 | 0.0% |
| $15,000 to $24,999 | 18 | 8.1% |
| $25,000 to $34,999 | 3 | 1.4% |
| $35,000 to $49,999 | 17 | 7.7% |
| $50,000 to $74,999 | 42 | 19.0% |
| $75,000 to $99,999 | 24 | 10.9% |
| $100,000 to $149,999 | 55 | 24.9% |
| $150,000 to $199,999 | 10 | 4.5% |
| $200,000+ | 47 | 21.3% |
Household Income by Householder Age in Benjamin
The median household income in Benjamin is $100,375, with the highest median household income of $123,750 found in the 25 to 44 years age bracket for the primary householder. A total of 62 households (28.1%) fall into this category.
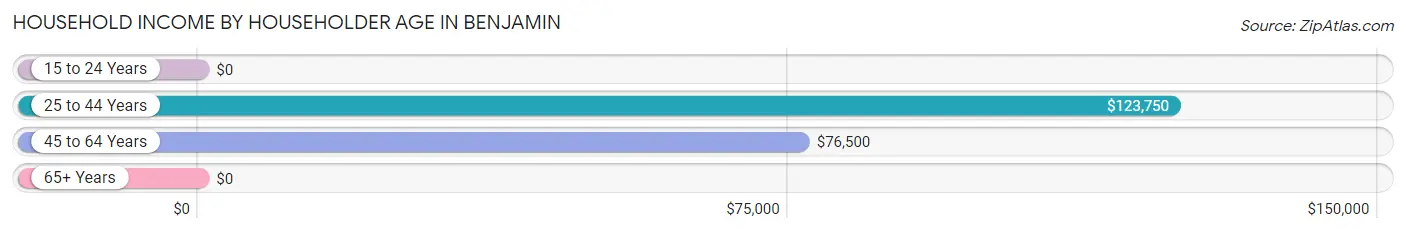
| Income Bracket | # Households | Median Income |
| 15 to 24 Years | 0 (0.0%) | $0 |
| 25 to 44 Years | 62 (28.1%) | $123,750 |
| 45 to 64 Years | 114 (51.6%) | $76,500 |
| 65+ Years | 45 (20.4%) | $0 |
| Total | 221 (100.0%) | $100,375 |
Poverty in Benjamin
Income Below Poverty by Sex and Age in Benjamin
With 7.2% poverty level for males and 2.4% for females among the residents of Benjamin, 15 year old males and 35 to 44 year old females are the most vulnerable to poverty, with 5 males (100.0%) and 5 females (8.1%) in their respective age groups living below the poverty level.
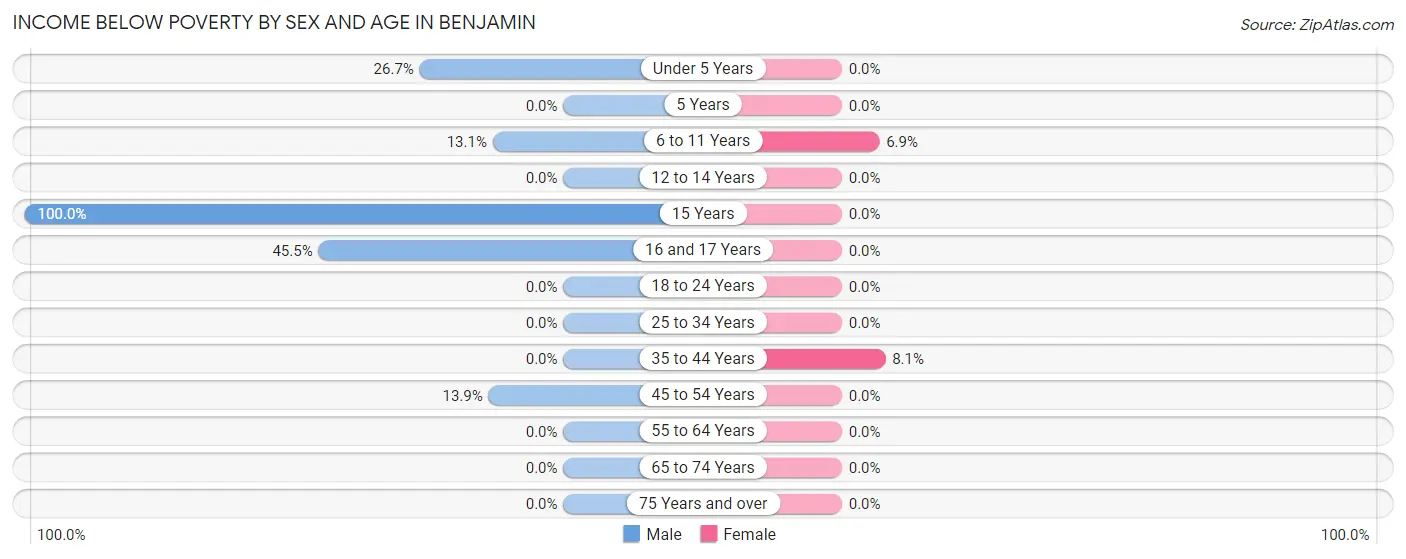
| Age Bracket | Male | Female |
| Under 5 Years | 8 (26.7%) | 0 (0.0%) |
| 5 Years | 0 (0.0%) | 0 (0.0%) |
| 6 to 11 Years | 8 (13.1%) | 5 (6.9%) |
| 12 to 14 Years | 0 (0.0%) | 0 (0.0%) |
| 15 Years | 5 (100.0%) | 0 (0.0%) |
| 16 and 17 Years | 5 (45.5%) | 0 (0.0%) |
| 18 to 24 Years | 0 (0.0%) | 0 (0.0%) |
| 25 to 34 Years | 0 (0.0%) | 0 (0.0%) |
| 35 to 44 Years | 0 (0.0%) | 5 (8.1%) |
| 45 to 54 Years | 5 (13.9%) | 0 (0.0%) |
| 55 to 64 Years | 0 (0.0%) | 0 (0.0%) |
| 65 to 74 Years | 0 (0.0%) | 0 (0.0%) |
| 75 Years and over | 0 (0.0%) | 0 (0.0%) |
| Total | 31 (7.2%) | 10 (2.4%) |
Income Above Poverty by Sex and Age in Benjamin
According to the poverty statistics in Benjamin, males aged 5 years and females aged under 5 years are the age groups that are most secure financially, with 100.0% of males and 100.0% of females in these age groups living above the poverty line.
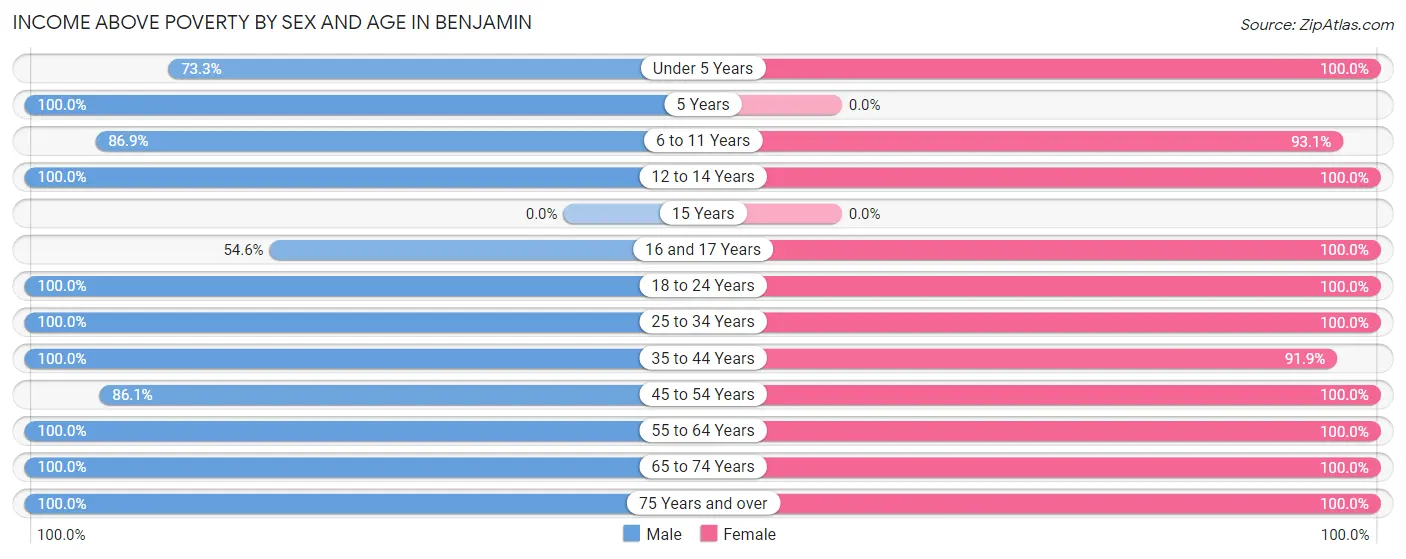
| Age Bracket | Male | Female |
| Under 5 Years | 22 (73.3%) | 27 (100.0%) |
| 5 Years | 5 (100.0%) | 0 (0.0%) |
| 6 to 11 Years | 53 (86.9%) | 67 (93.1%) |
| 12 to 14 Years | 53 (100.0%) | 48 (100.0%) |
| 15 Years | 0 (0.0%) | 0 (0.0%) |
| 16 and 17 Years | 6 (54.5%) | 21 (100.0%) |
| 18 to 24 Years | 20 (100.0%) | 6 (100.0%) |
| 25 to 34 Years | 21 (100.0%) | 20 (100.0%) |
| 35 to 44 Years | 56 (100.0%) | 57 (91.9%) |
| 45 to 54 Years | 31 (86.1%) | 16 (100.0%) |
| 55 to 64 Years | 71 (100.0%) | 100 (100.0%) |
| 65 to 74 Years | 40 (100.0%) | 23 (100.0%) |
| 75 Years and over | 22 (100.0%) | 22 (100.0%) |
| Total | 400 (92.8%) | 407 (97.6%) |
Income Below Poverty Among Married-Couple Families in Benjamin
The poverty statistics for married-couple families in Benjamin show that 2.5% or 5 of the total 201 families live below the poverty line. Families with 5 or more children have the highest poverty rate of 16.7%, comprising of 5 families. On the other hand, families with no children have the lowest poverty rate of 0.0%, which includes 0 families.
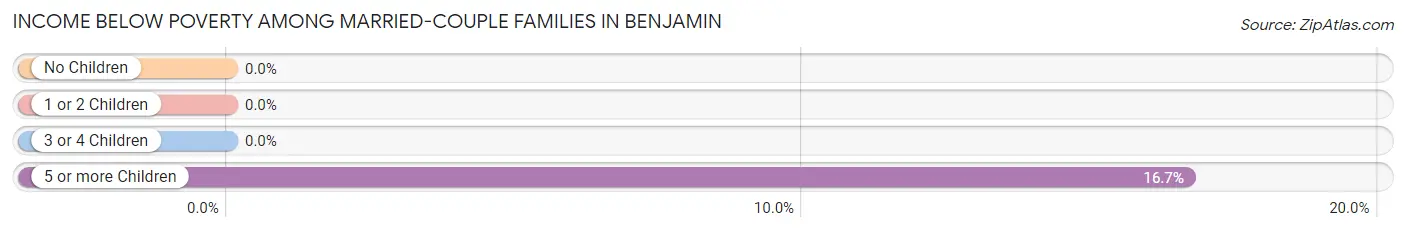
| Children | Above Poverty | Below Poverty |
| No Children | 110 (100.0%) | 0 (0.0%) |
| 1 or 2 Children | 34 (100.0%) | 0 (0.0%) |
| 3 or 4 Children | 27 (100.0%) | 0 (0.0%) |
| 5 or more Children | 25 (83.3%) | 5 (16.7%) |
| Total | 196 (97.5%) | 5 (2.5%) |
Income Below Poverty Among Single-Parent Households in Benjamin
| Children | Single Father | Single Mother |
| No Children | 0 (0.0%) | 0 (0.0%) |
| 1 or 2 Children | 0 (0.0%) | 0 (0.0%) |
| 3 or 4 Children | 0 (0.0%) | 0 (0.0%) |
| 5 or more Children | 0 (0.0%) | 0 (0.0%) |
| Total | 0 (0.0%) | 0 (0.0%) |
Income Below Poverty Among Married-Couple vs Single-Parent Households in Benjamin
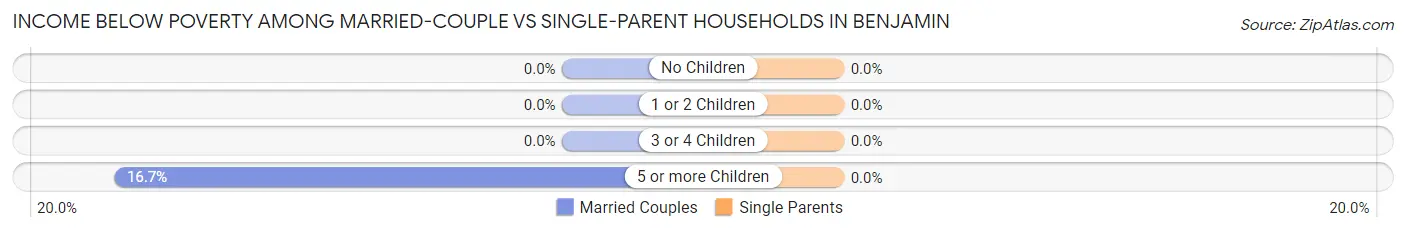
| Children | Married-Couple Families | Single-Parent Households |
| No Children | 0 (0.0%) | 0 (0.0%) |
| 1 or 2 Children | 0 (0.0%) | 0 (0.0%) |
| 3 or 4 Children | 0 (0.0%) | 0 (0.0%) |
| 5 or more Children | 5 (16.7%) | 0 (0.0%) |
| Total | 5 (2.5%) | 0 (0.0%) |
Race in Benjamin
The most populous races in Benjamin are White / Caucasian (848 | 100.0%), and Hispanic or Latino (28 | 3.3%).
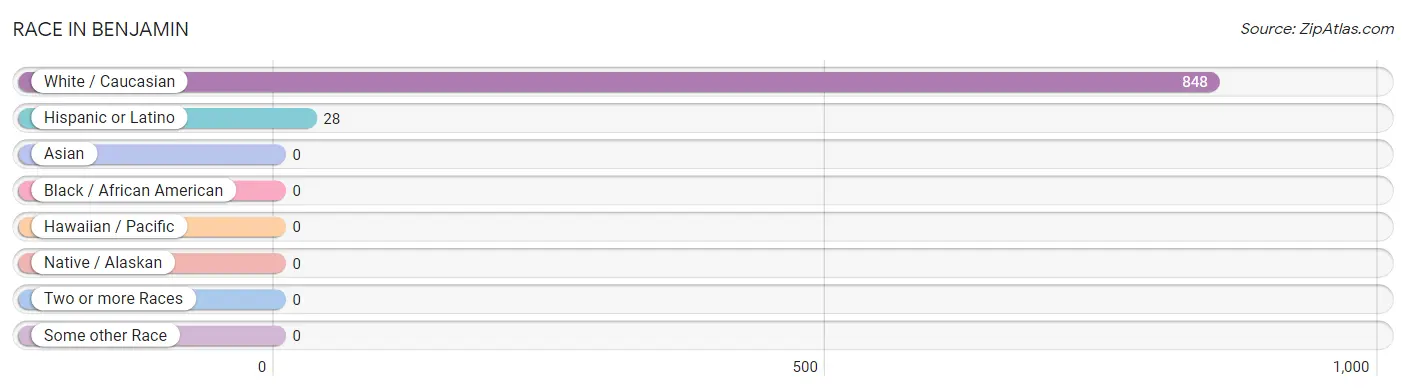
| Race | # Population | % Population |
| Asian | 0 | 0.0% |
| Black / African American | 0 | 0.0% |
| Hawaiian / Pacific | 0 | 0.0% |
| Hispanic or Latino | 28 | 3.3% |
| Native / Alaskan | 0 | 0.0% |
| White / Caucasian | 848 | 100.0% |
| Two or more Races | 0 | 0.0% |
| Some other Race | 0 | 0.0% |
| Total | 848 | 100.0% |
Ancestry in Benjamin
The most populous ancestries reported in Benjamin are English (289 | 34.1%), American (177 | 20.9%), Swedish (63 | 7.4%), Danish (62 | 7.3%), and European (62 | 7.3%), together accounting for 77.0% of all Benjamin residents.
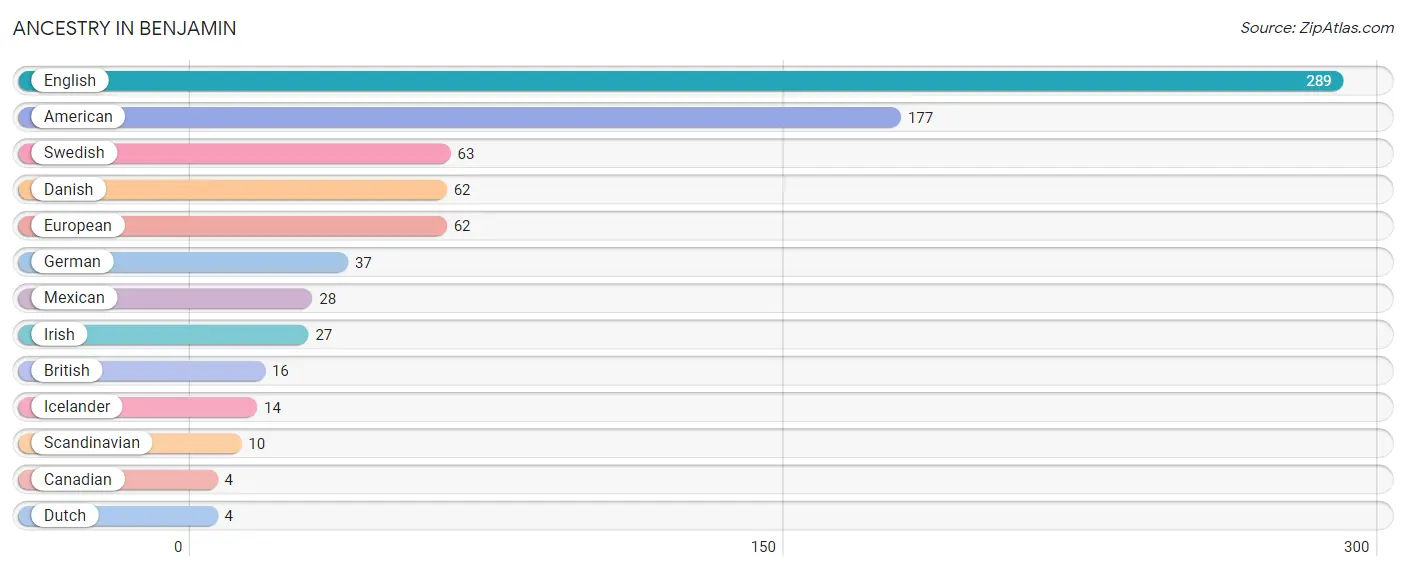
| Ancestry | # Population | % Population |
| American | 177 | 20.9% |
| British | 16 | 1.9% |
| Canadian | 4 | 0.5% |
| Danish | 62 | 7.3% |
| Dutch | 4 | 0.5% |
| English | 289 | 34.1% |
| European | 62 | 7.3% |
| German | 37 | 4.4% |
| Icelander | 14 | 1.7% |
| Irish | 27 | 3.2% |
| Mexican | 28 | 3.3% |
| Scandinavian | 10 | 1.2% |
| Swedish | 63 | 7.4% | View All 13 Rows |
Immigrants in Benjamin
The most numerous immigrant groups reported in Benjamin came from , and Canada (5 | 0.6%), together accounting for 0.6% of all Benjamin residents.

| Immigration Origin | # Population | % Population |
| Canada | 5 | 0.6% | View All 1 Rows |
Sex and Age in Benjamin
Sex and Age in Benjamin
The most populous age groups in Benjamin are 10 to 14 Years (82 | 19.0%) for men and 10 to 14 Years (75 | 18.0%) for women.
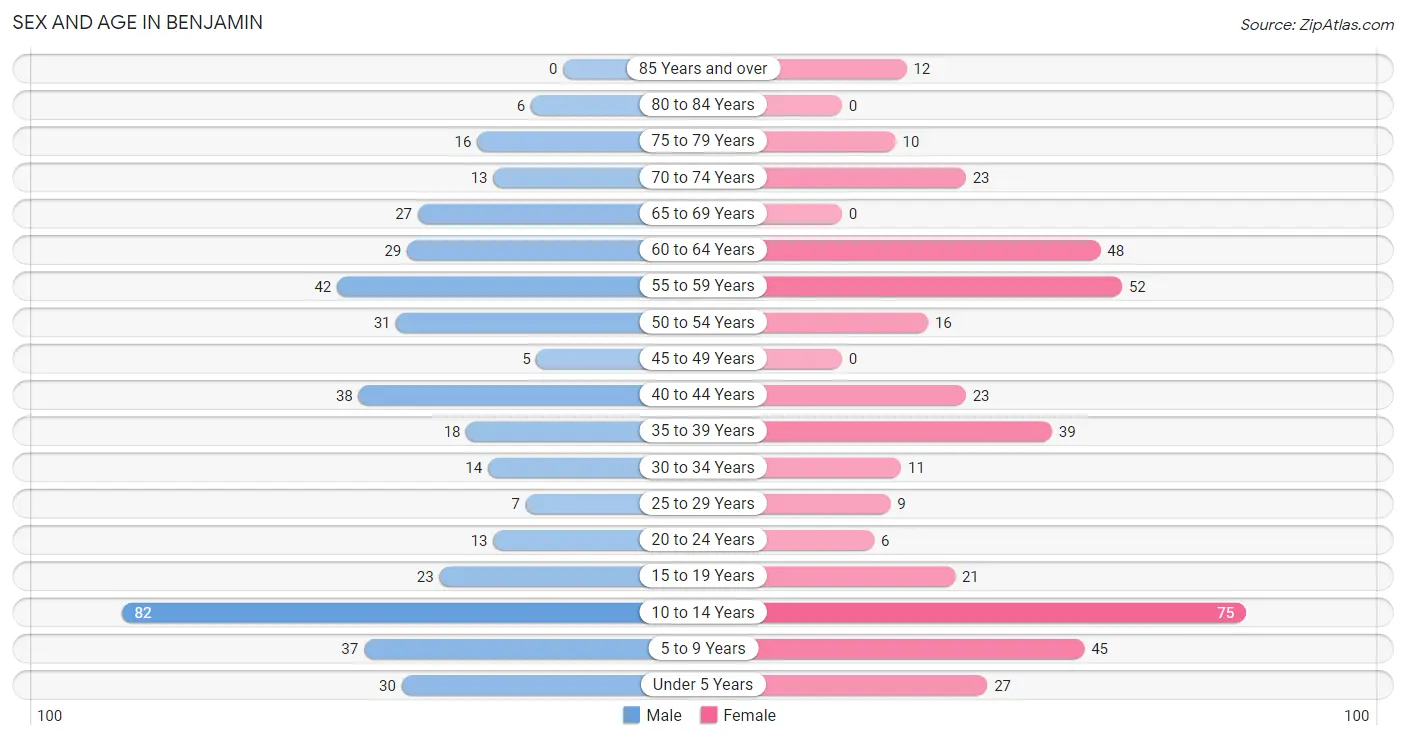
| Age Bracket | Male | Female |
| Under 5 Years | 30 (7.0%) | 27 (6.5%) |
| 5 to 9 Years | 37 (8.6%) | 45 (10.8%) |
| 10 to 14 Years | 82 (19.0%) | 75 (18.0%) |
| 15 to 19 Years | 23 (5.3%) | 21 (5.0%) |
| 20 to 24 Years | 13 (3.0%) | 6 (1.4%) |
| 25 to 29 Years | 7 (1.6%) | 9 (2.2%) |
| 30 to 34 Years | 14 (3.3%) | 11 (2.6%) |
| 35 to 39 Years | 18 (4.2%) | 39 (9.3%) |
| 40 to 44 Years | 38 (8.8%) | 23 (5.5%) |
| 45 to 49 Years | 5 (1.2%) | 0 (0.0%) |
| 50 to 54 Years | 31 (7.2%) | 16 (3.8%) |
| 55 to 59 Years | 42 (9.7%) | 52 (12.5%) |
| 60 to 64 Years | 29 (6.7%) | 48 (11.5%) |
| 65 to 69 Years | 27 (6.3%) | 0 (0.0%) |
| 70 to 74 Years | 13 (3.0%) | 23 (5.5%) |
| 75 to 79 Years | 16 (3.7%) | 10 (2.4%) |
| 80 to 84 Years | 6 (1.4%) | 0 (0.0%) |
| 85 Years and over | 0 (0.0%) | 12 (2.9%) |
| Total | 431 (100.0%) | 417 (100.0%) |
Families and Households in Benjamin
Median Family Size in Benjamin
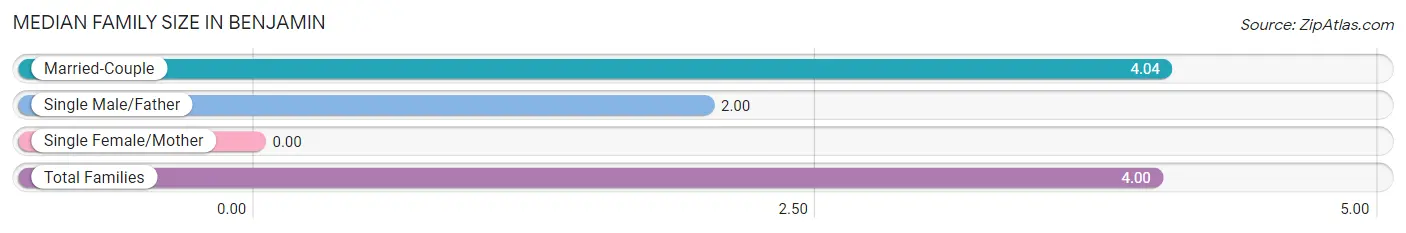
| Family Type | # Families | Family Size |
| Married-Couple | 201 (97.6%) | 4.04 |
| Single Male/Father | 5 (2.4%) | 2.00 |
| Single Female/Mother | 0 (0.0%) | - |
| Total Families | 206 (100.0%) | 4.00 |
Median Household Size in Benjamin
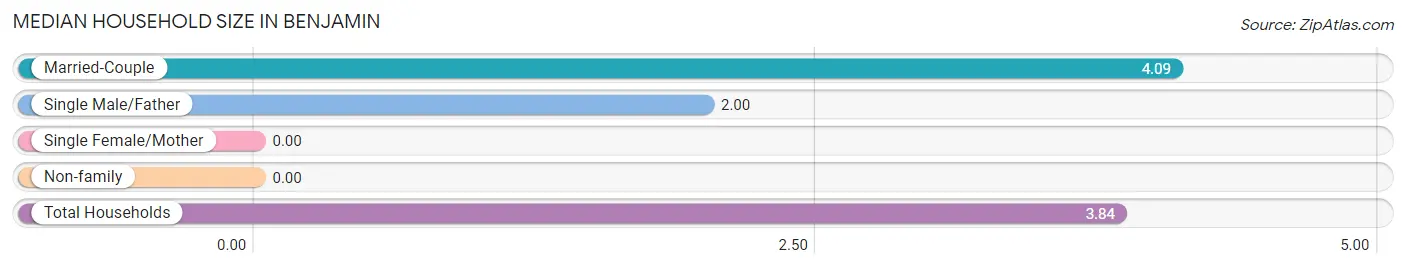
| Household Type | # Households | Household Size |
| Married-Couple | 201 (90.9%) | 4.09 |
| Single Male/Father | 5 (2.3%) | 2.00 |
| Single Female/Mother | 0 (0.0%) | - |
| Non-family | 15 (6.8%) | - |
| Total Households | 221 (100.0%) | 3.84 |
Household Size by Marriage Status in Benjamin
Out of a total of 221 households in Benjamin, 206 (93.2%) are family households, while 15 (6.8%) are nonfamily households. The most numerous type of family households are 2-person households, comprising 111, and the most common type of nonfamily households are 1-person households, comprising 15.
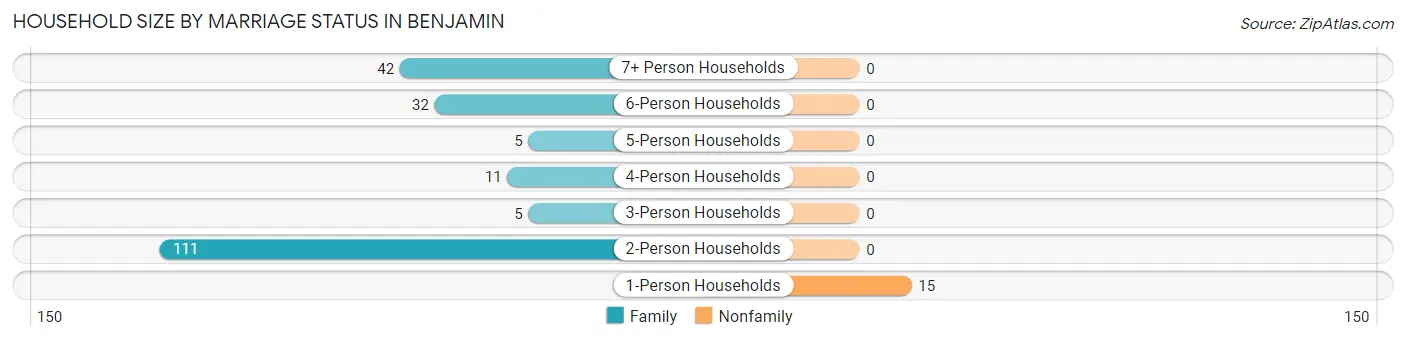
| Household Size | Family Households | Nonfamily Households |
| 1-Person Households | - | 15 (6.8%) |
| 2-Person Households | 111 (50.2%) | 0 (0.0%) |
| 3-Person Households | 5 (2.3%) | 0 (0.0%) |
| 4-Person Households | 11 (5.0%) | 0 (0.0%) |
| 5-Person Households | 5 (2.3%) | 0 (0.0%) |
| 6-Person Households | 32 (14.5%) | 0 (0.0%) |
| 7+ Person Households | 42 (19.0%) | 0 (0.0%) |
| Total | 206 (93.2%) | 15 (6.8%) |
Female Fertility in Benjamin
Fertility by Age in Benjamin
Average fertility rate in Benjamin is 88.0 births per 1,000 women. Women in the age bracket of 20 to 34 years have the highest fertility rate with 192.0 births per 1,000 women. Women in the age bracket of 20 to 34 years acount for 50.0% of all women with births.
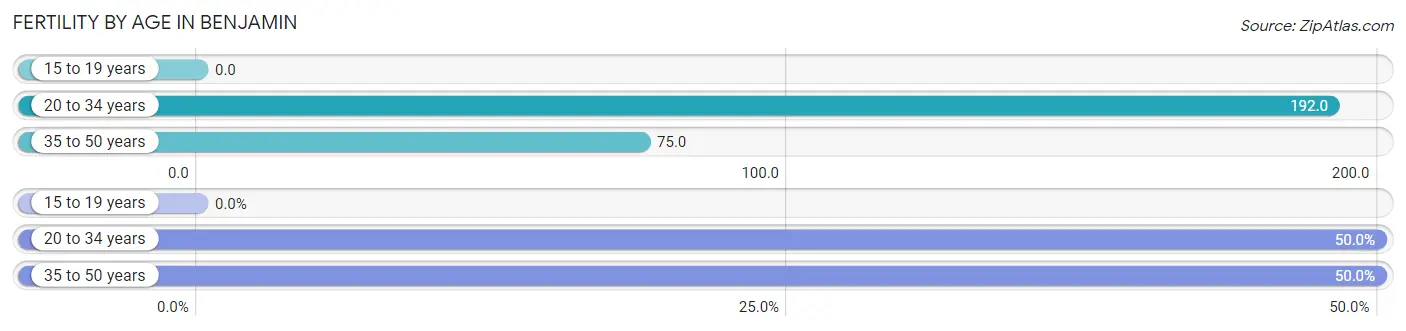
| Age Bracket | Women with Births | Births / 1,000 Women |
| 15 to 19 years | 0 (0.0%) | 0.0 |
| 20 to 34 years | 5 (50.0%) | 192.0 |
| 35 to 50 years | 5 (50.0%) | 75.0 |
| Total | 10 (100.0%) | 88.0 |
Fertility by Age by Marriage Status in Benjamin
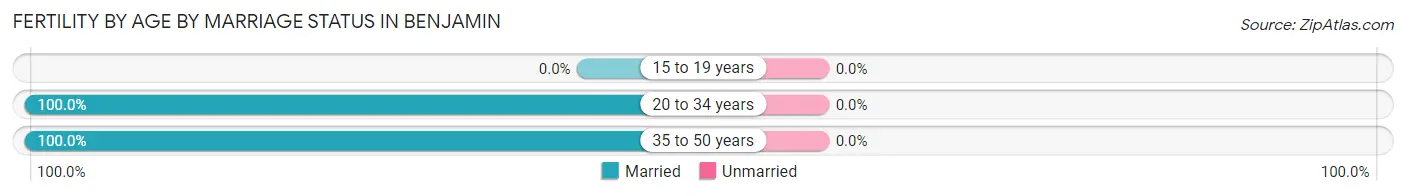
| Age Bracket | Married | Unmarried |
| 15 to 19 years | 0 (0.0%) | 0 (0.0%) |
| 20 to 34 years | 5 (100.0%) | 0 (0.0%) |
| 35 to 50 years | 5 (100.0%) | 0 (0.0%) |
| Total | 10 (100.0%) | 0 (0.0%) |
Fertility by Education in Benjamin
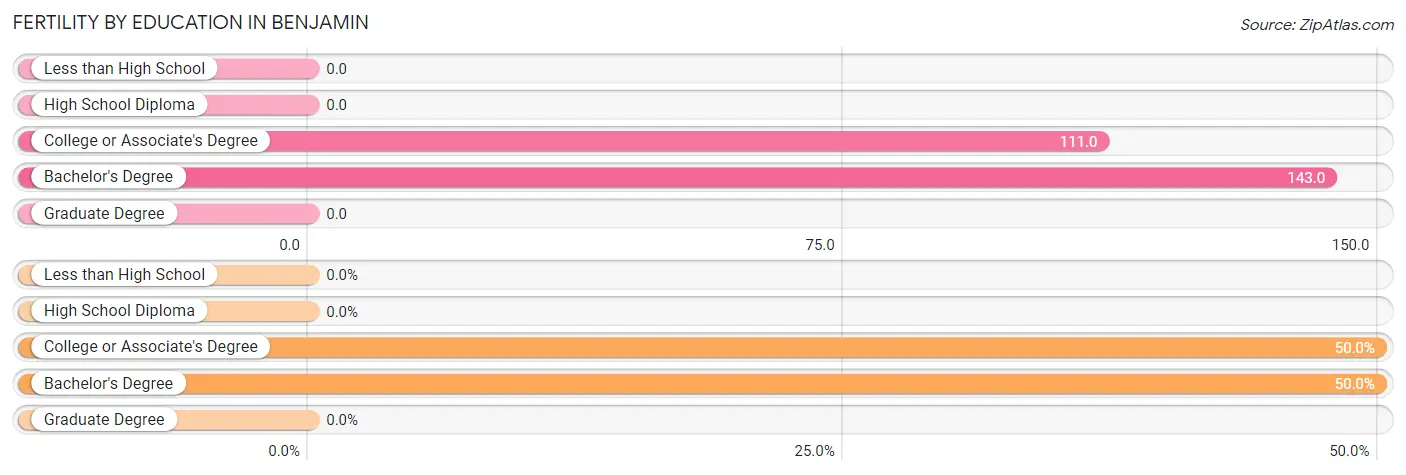
| Educational Attainment | Women with Births | Births / 1,000 Women |
| Less than High School | 0 (0.0%) | 0.0 |
| High School Diploma | 0 (0.0%) | 0.0 |
| College or Associate's Degree | 5 (50.0%) | 111.0 |
| Bachelor's Degree | 5 (50.0%) | 143.0 |
| Graduate Degree | 0 (0.0%) | 0.0 |
| Total | 10 (100.0%) | 88.0 |
Fertility by Education by Marriage Status in Benjamin
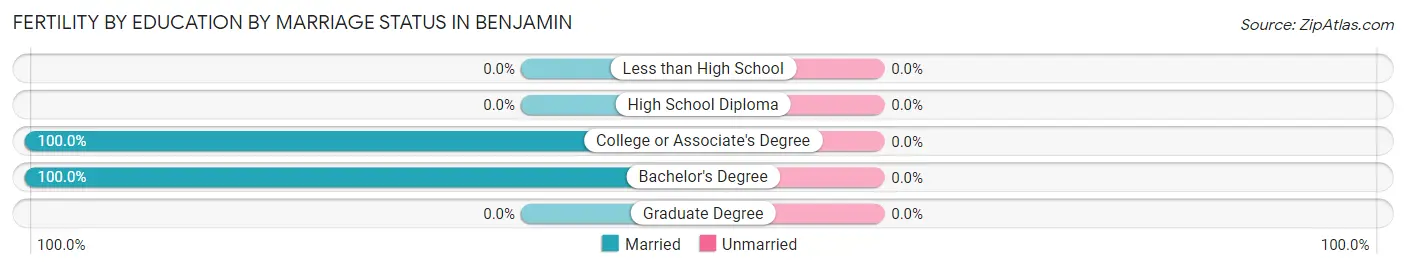
| Educational Attainment | Married | Unmarried |
| Less than High School | 0 (0.0%) | 0 (0.0%) |
| High School Diploma | 0 (0.0%) | 0 (0.0%) |
| College or Associate's Degree | 5 (100.0%) | 0 (0.0%) |
| Bachelor's Degree | 5 (100.0%) | 0 (0.0%) |
| Graduate Degree | 0 (0.0%) | 0 (0.0%) |
| Total | 10 (100.0%) | 0 (0.0%) |
Employment Characteristics in Benjamin
Employment by Class of Employer in Benjamin
Among the 359 employed individuals in Benjamin, private company employees (215 | 59.9%), self-employed (incorporated) (63 | 17.5%), and local government employees (42 | 11.7%) make up the most common classes of employment.
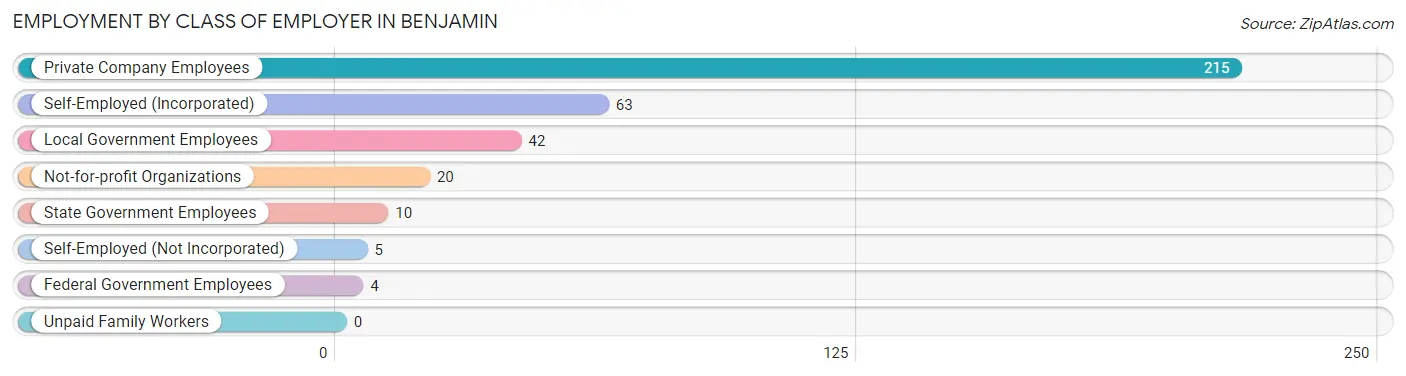
| Employer Class | # Employees | % Employees |
| Private Company Employees | 215 | 59.9% |
| Self-Employed (Incorporated) | 63 | 17.5% |
| Self-Employed (Not Incorporated) | 5 | 1.4% |
| Not-for-profit Organizations | 20 | 5.6% |
| Local Government Employees | 42 | 11.7% |
| State Government Employees | 10 | 2.8% |
| Federal Government Employees | 4 | 1.1% |
| Unpaid Family Workers | 0 | 0.0% |
| Total | 359 | 100.0% |
Employment Status by Age in Benjamin
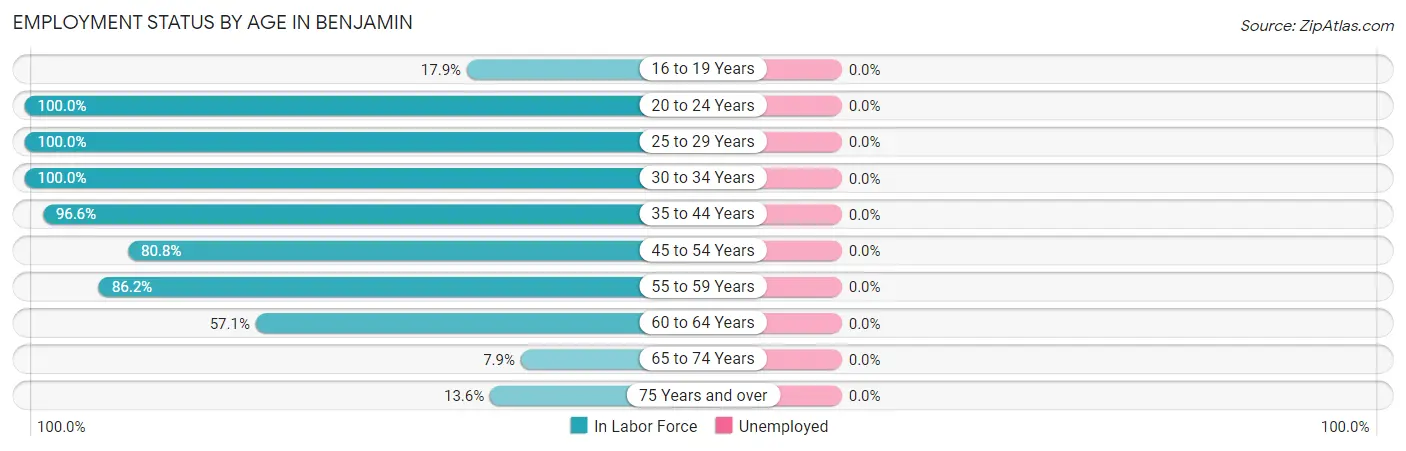
| Age Bracket | In Labor Force | Unemployed |
| 16 to 19 Years | 7 (17.9%) | 0 (0.0%) |
| 20 to 24 Years | 19 (100.0%) | 0 (0.0%) |
| 25 to 29 Years | 16 (100.0%) | 0 (0.0%) |
| 30 to 34 Years | 25 (100.0%) | 0 (0.0%) |
| 35 to 44 Years | 114 (96.6%) | 0 (0.0%) |
| 45 to 54 Years | 42 (80.8%) | 0 (0.0%) |
| 55 to 59 Years | 81 (86.2%) | 0 (0.0%) |
| 60 to 64 Years | 44 (57.1%) | 0 (0.0%) |
| 65 to 74 Years | 5 (7.9%) | 0 (0.0%) |
| 75 Years and over | 6 (13.6%) | 0 (0.0%) |
| Total | 359 (65.6%) | 0 (0.0%) |
Employment Status by Educational Attainment in Benjamin
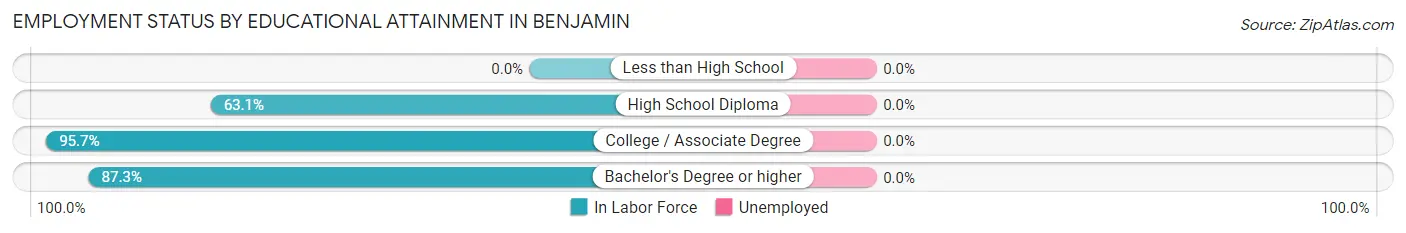
| Educational Attainment | In Labor Force | Unemployed |
| Less than High School | 0 (0.0%) | 0 (0.0%) |
| High School Diploma | 65 (63.1%) | 0 (0.0%) |
| College / Associate Degree | 154 (95.7%) | 0 (0.0%) |
| Bachelor's Degree or higher | 103 (87.3%) | 0 (0.0%) |
| Total | 322 (84.3%) | 0 (0.0%) |
Employment Occupations by Sex in Benjamin
Management, Business, Science and Arts Occupations
The most common Management, Business, Science and Arts occupations in Benjamin are Management (29 | 8.1%), Health Diagnosing & Treating (27 | 7.5%), Health Technologists (27 | 7.5%), Community & Social Service (19 | 5.3%), and Business & Financial (14 | 3.9%).
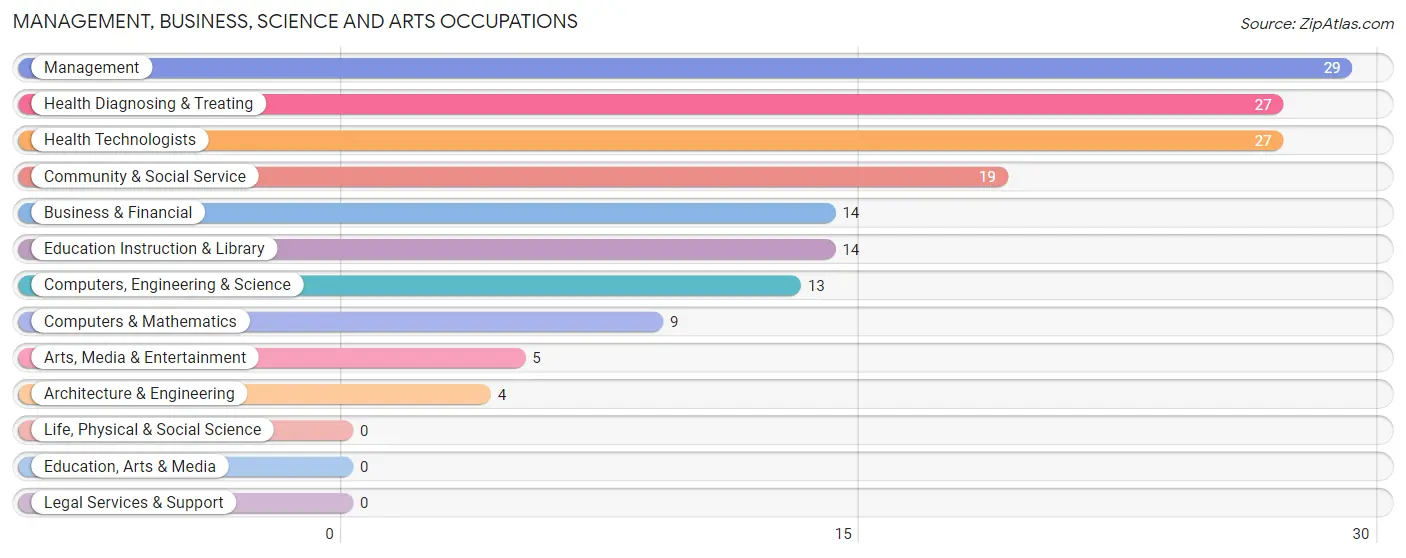
Management, Business, Science and Arts Occupations by Sex
Within the Management, Business, Science and Arts occupations in Benjamin, the most male-oriented occupations are Computers, Engineering & Science (100.0%), Computers & Mathematics (100.0%), and Architecture & Engineering (100.0%), while the most female-oriented occupations are Education Instruction & Library (100.0%), Health Diagnosing & Treating (100.0%), and Health Technologists (100.0%).
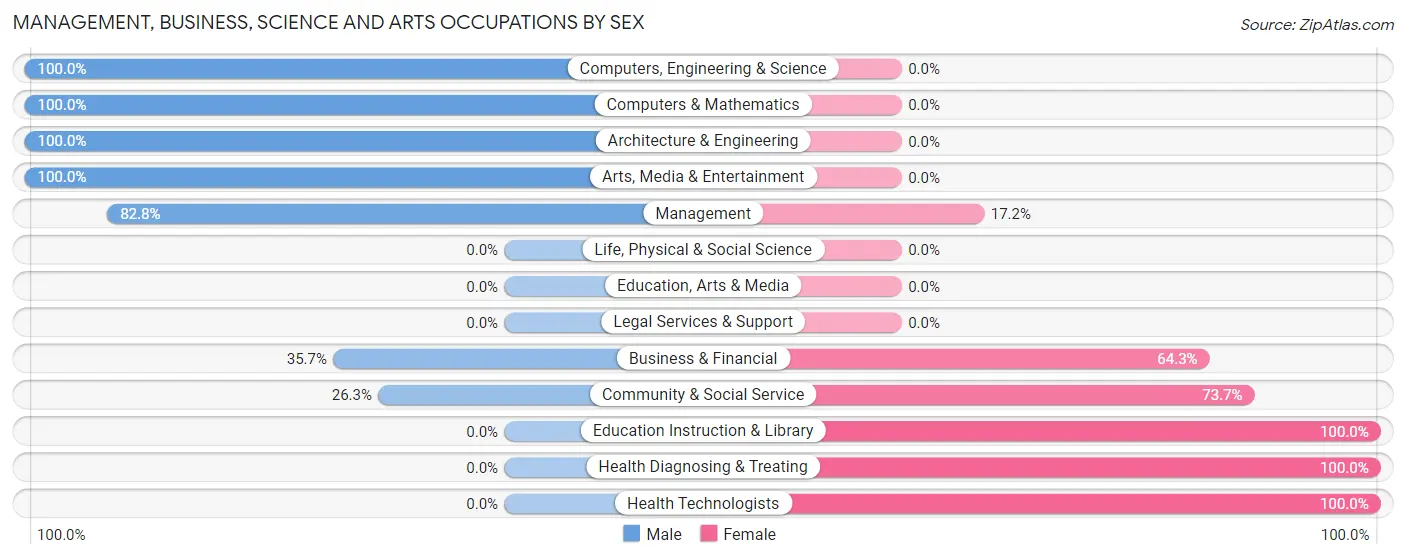
| Occupation | Male | Female |
| Management | 24 (82.8%) | 5 (17.2%) |
| Business & Financial | 5 (35.7%) | 9 (64.3%) |
| Computers, Engineering & Science | 13 (100.0%) | 0 (0.0%) |
| Computers & Mathematics | 9 (100.0%) | 0 (0.0%) |
| Architecture & Engineering | 4 (100.0%) | 0 (0.0%) |
| Life, Physical & Social Science | 0 (0.0%) | 0 (0.0%) |
| Community & Social Service | 5 (26.3%) | 14 (73.7%) |
| Education, Arts & Media | 0 (0.0%) | 0 (0.0%) |
| Legal Services & Support | 0 (0.0%) | 0 (0.0%) |
| Education Instruction & Library | 0 (0.0%) | 14 (100.0%) |
| Arts, Media & Entertainment | 5 (100.0%) | 0 (0.0%) |
| Health Diagnosing & Treating | 0 (0.0%) | 27 (100.0%) |
| Health Technologists | 0 (0.0%) | 27 (100.0%) |
| Total (Category) | 47 (46.1%) | 55 (53.9%) |
| Total (Overall) | 194 (54.0%) | 165 (46.0%) |
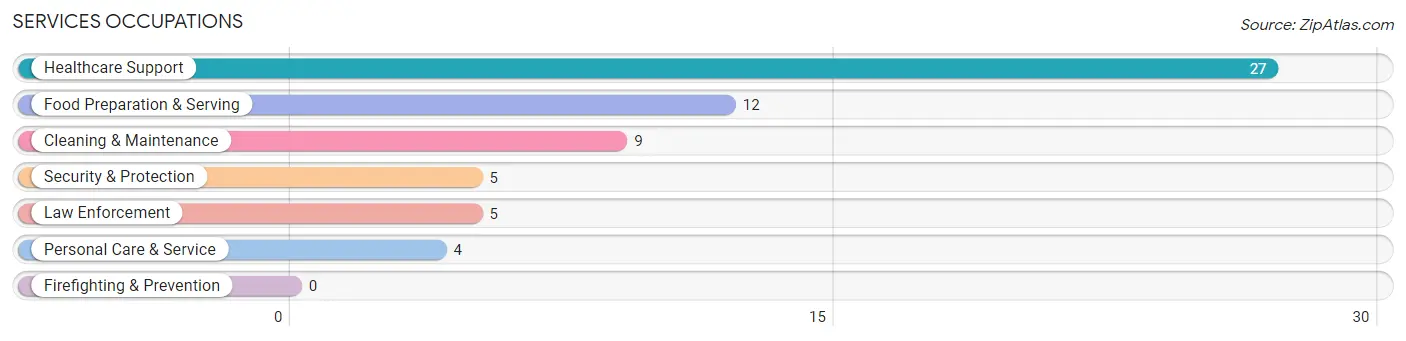
Services Occupations
The most common Services occupations in Benjamin are Healthcare Support (27 | 7.5%), Food Preparation & Serving (12 | 3.3%), Cleaning & Maintenance (9 | 2.5%), Security & Protection (5 | 1.4%), and Law Enforcement (5 | 1.4%).
Services Occupations by Sex
Within the Services occupations in Benjamin, the most male-oriented occupations are Security & Protection (100.0%), Law Enforcement (100.0%), and Food Preparation & Serving (58.3%), while the most female-oriented occupations are Healthcare Support (100.0%), Cleaning & Maintenance (100.0%), and Personal Care & Service (75.0%).
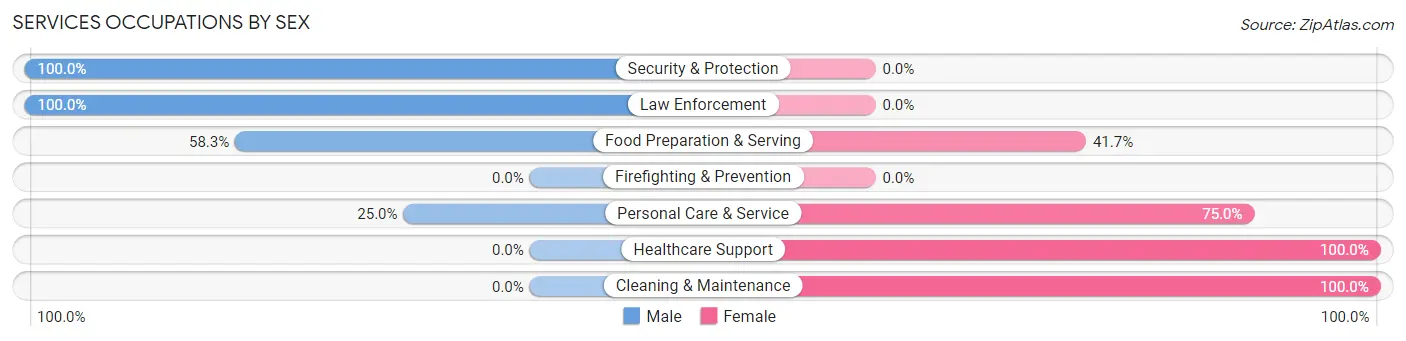
| Occupation | Male | Female |
| Healthcare Support | 0 (0.0%) | 27 (100.0%) |
| Security & Protection | 5 (100.0%) | 0 (0.0%) |
| Firefighting & Prevention | 0 (0.0%) | 0 (0.0%) |
| Law Enforcement | 5 (100.0%) | 0 (0.0%) |
| Food Preparation & Serving | 7 (58.3%) | 5 (41.7%) |
| Cleaning & Maintenance | 0 (0.0%) | 9 (100.0%) |
| Personal Care & Service | 1 (25.0%) | 3 (75.0%) |
| Total (Category) | 13 (22.8%) | 44 (77.2%) |
| Total (Overall) | 194 (54.0%) | 165 (46.0%) |
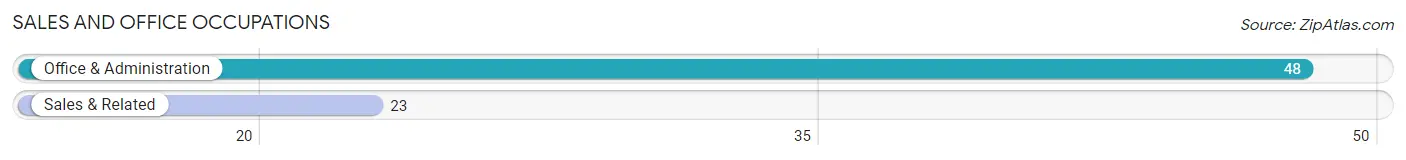
Sales and Office Occupations
The most common Sales and Office occupations in Benjamin are Office & Administration (48 | 13.4%), and Sales & Related (23 | 6.4%).
Sales and Office Occupations by Sex
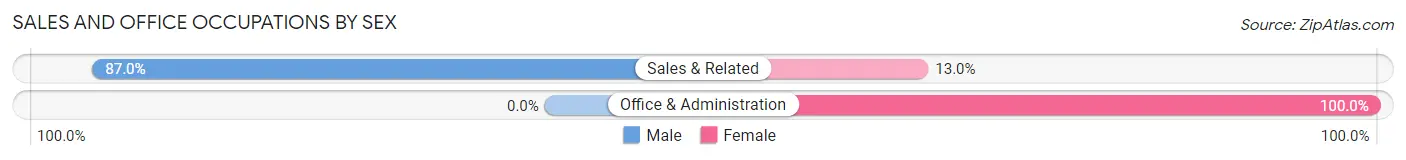
| Occupation | Male | Female |
| Sales & Related | 20 (87.0%) | 3 (13.0%) |
| Office & Administration | 0 (0.0%) | 48 (100.0%) |
| Total (Category) | 20 (28.2%) | 51 (71.8%) |
| Total (Overall) | 194 (54.0%) | 165 (46.0%) |
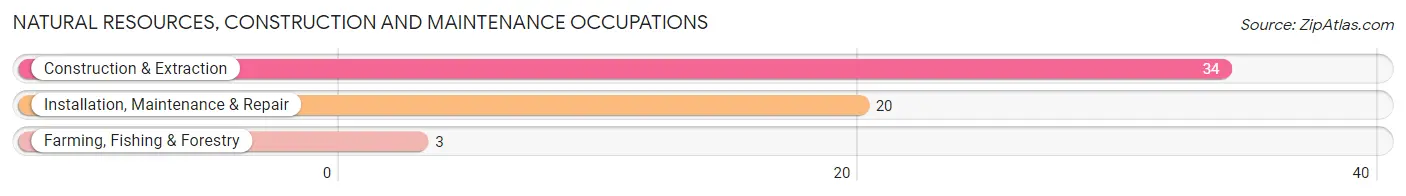
Natural Resources, Construction and Maintenance Occupations
The most common Natural Resources, Construction and Maintenance occupations in Benjamin are Construction & Extraction (34 | 9.5%), Installation, Maintenance & Repair (20 | 5.6%), and Farming, Fishing & Forestry (3 | 0.8%).
Natural Resources, Construction and Maintenance Occupations by Sex
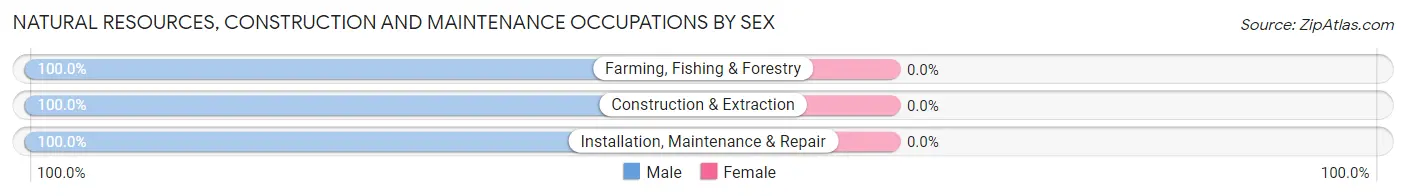
| Occupation | Male | Female |
| Farming, Fishing & Forestry | 3 (100.0%) | 0 (0.0%) |
| Construction & Extraction | 34 (100.0%) | 0 (0.0%) |
| Installation, Maintenance & Repair | 20 (100.0%) | 0 (0.0%) |
| Total (Category) | 57 (100.0%) | 0 (0.0%) |
| Total (Overall) | 194 (54.0%) | 165 (46.0%) |
Production, Transportation and Moving Occupations
The most common Production, Transportation and Moving occupations in Benjamin are Production (57 | 15.9%), and Transportation (15 | 4.2%).
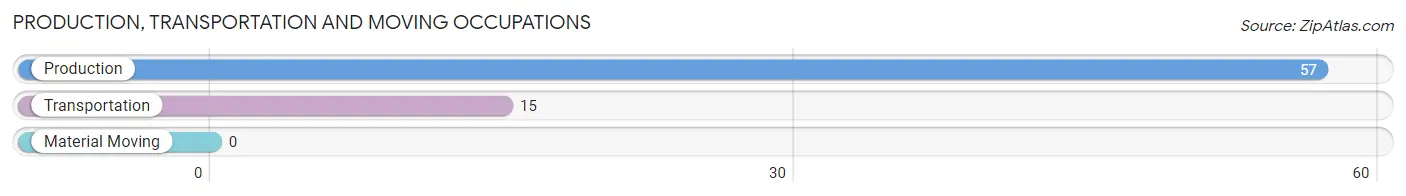
Production, Transportation and Moving Occupations by Sex
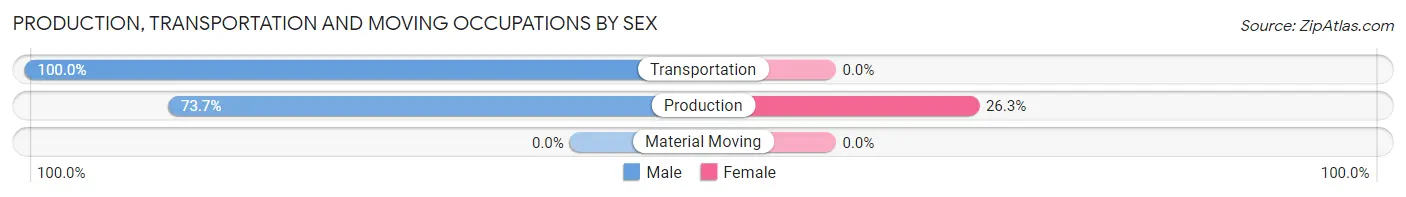
| Occupation | Male | Female |
| Production | 42 (73.7%) | 15 (26.3%) |
| Transportation | 15 (100.0%) | 0 (0.0%) |
| Material Moving | 0 (0.0%) | 0 (0.0%) |
| Total (Category) | 57 (79.2%) | 15 (20.8%) |
| Total (Overall) | 194 (54.0%) | 165 (46.0%) |
Employment Industries by Sex in Benjamin
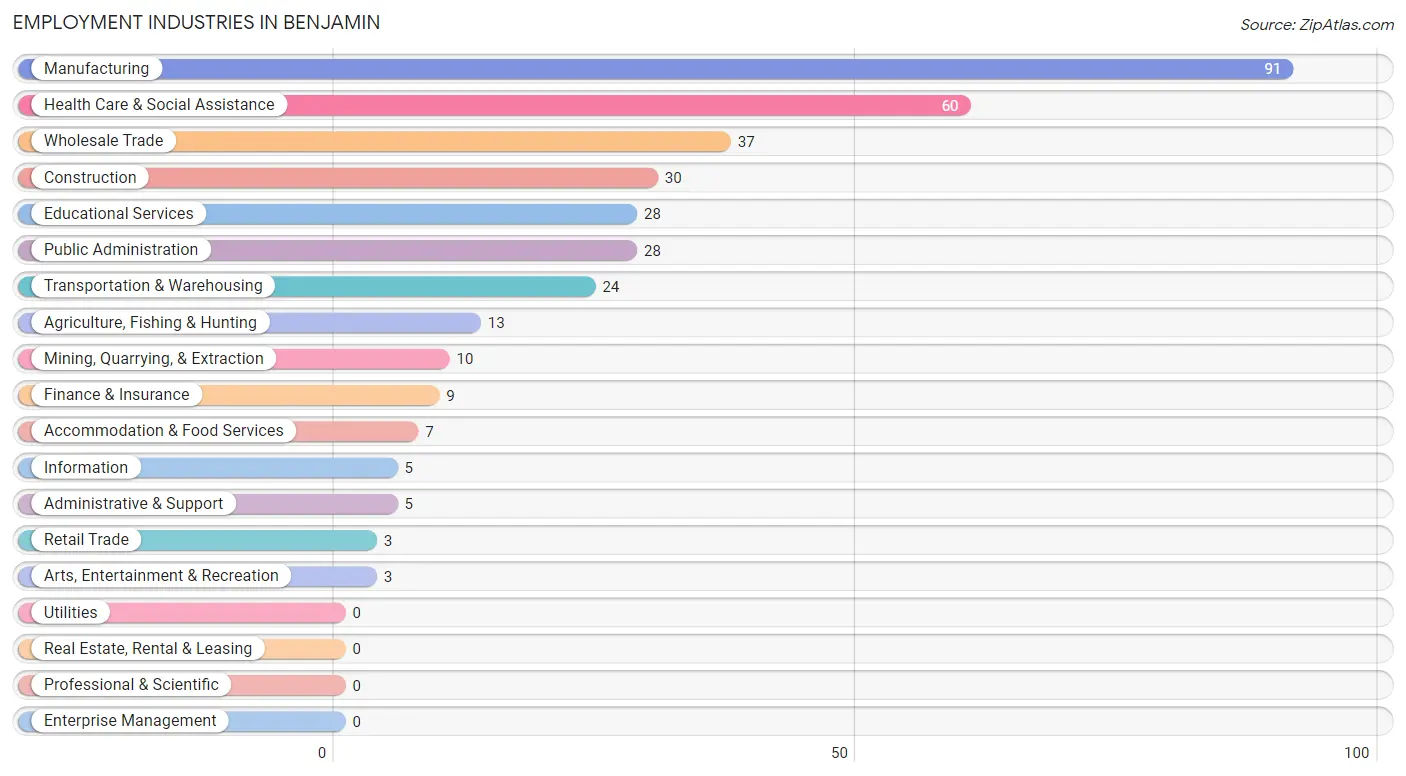
Employment Industries in Benjamin
The major employment industries in Benjamin include Manufacturing (91 | 25.4%), Health Care & Social Assistance (60 | 16.7%), Wholesale Trade (37 | 10.3%), Construction (30 | 8.4%), and Educational Services (28 | 7.8%).
Employment Industries by Sex in Benjamin
The Benjamin industries that see more men than women are Mining, Quarrying, & Extraction (100.0%), Transportation & Warehousing (100.0%), and Information (100.0%), whereas the industries that tend to have a higher number of women are Retail Trade (100.0%), Finance & Insurance (100.0%), and Administrative & Support (100.0%).
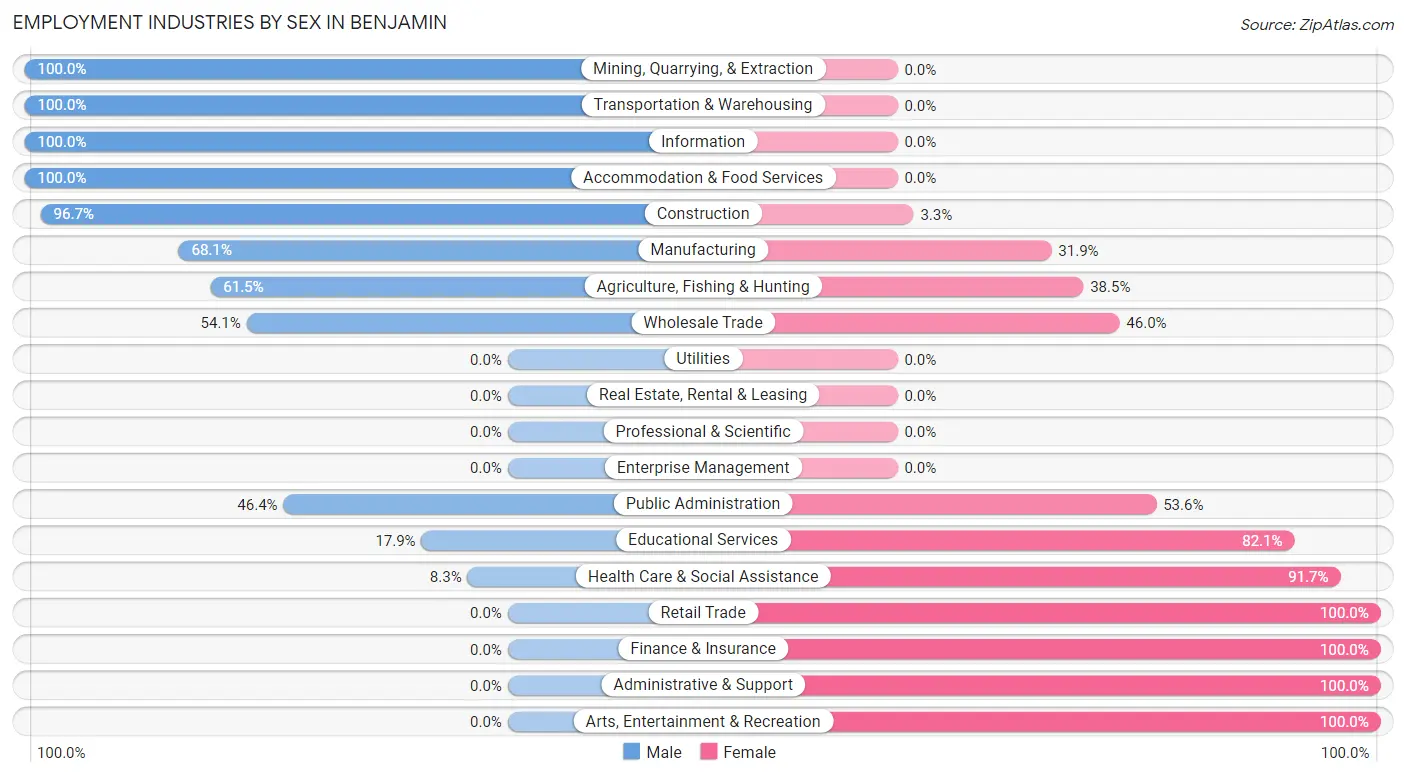
| Industry | Male | Female |
| Agriculture, Fishing & Hunting | 8 (61.5%) | 5 (38.5%) |
| Mining, Quarrying, & Extraction | 10 (100.0%) | 0 (0.0%) |
| Construction | 29 (96.7%) | 1 (3.3%) |
| Manufacturing | 62 (68.1%) | 29 (31.9%) |
| Wholesale Trade | 20 (54.0%) | 17 (46.0%) |
| Retail Trade | 0 (0.0%) | 3 (100.0%) |
| Transportation & Warehousing | 24 (100.0%) | 0 (0.0%) |
| Utilities | 0 (0.0%) | 0 (0.0%) |
| Information | 5 (100.0%) | 0 (0.0%) |
| Finance & Insurance | 0 (0.0%) | 9 (100.0%) |
| Real Estate, Rental & Leasing | 0 (0.0%) | 0 (0.0%) |
| Professional & Scientific | 0 (0.0%) | 0 (0.0%) |
| Enterprise Management | 0 (0.0%) | 0 (0.0%) |
| Administrative & Support | 0 (0.0%) | 5 (100.0%) |
| Educational Services | 5 (17.9%) | 23 (82.1%) |
| Health Care & Social Assistance | 5 (8.3%) | 55 (91.7%) |
| Arts, Entertainment & Recreation | 0 (0.0%) | 3 (100.0%) |
| Accommodation & Food Services | 7 (100.0%) | 0 (0.0%) |
| Public Administration | 13 (46.4%) | 15 (53.6%) |
| Total | 194 (54.0%) | 165 (46.0%) |
Education in Benjamin
School Enrollment in Benjamin
The most common levels of schooling among the 321 students in Benjamin are middle school (129 | 40.2%), elementary school (82 | 25.6%), and high school (49 | 15.3%).
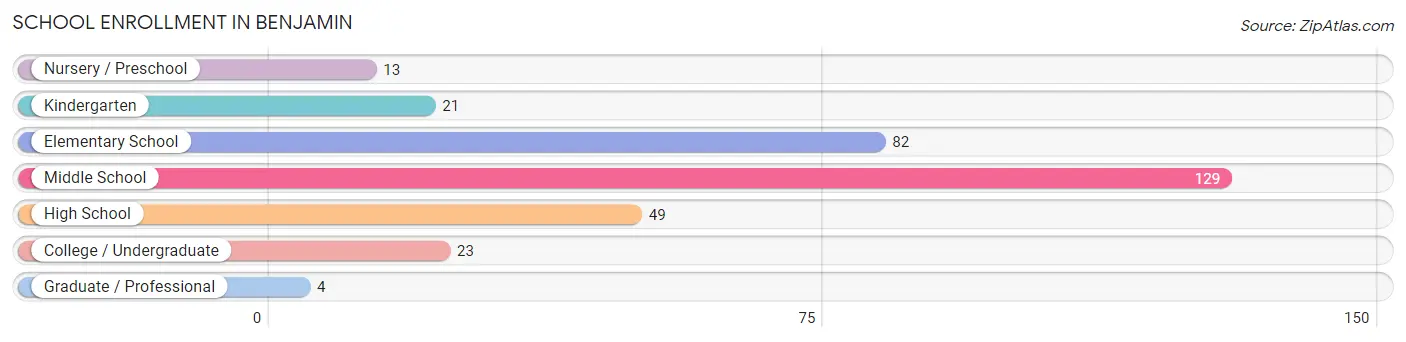
| School Level | # Students | % Students |
| Nursery / Preschool | 13 | 4.1% |
| Kindergarten | 21 | 6.5% |
| Elementary School | 82 | 25.6% |
| Middle School | 129 | 40.2% |
| High School | 49 | 15.3% |
| College / Undergraduate | 23 | 7.2% |
| Graduate / Professional | 4 | 1.3% |
| Total | 321 | 100.0% |
School Enrollment by Age by Funding Source in Benjamin
Out of a total of 321 students who are enrolled in schools in Benjamin, 23 (7.2%) attend a private institution, while the remaining 298 (92.8%) are enrolled in public schools. The age group of 3 to 4 year olds has the highest likelihood of being enrolled in private schools, with 13 (100.0% in the age bracket) enrolled. Conversely, the age group of 5 to 9 year old has the lowest likelihood of being enrolled in a private school, with 82 (100.0% in the age bracket) attending a public institution.
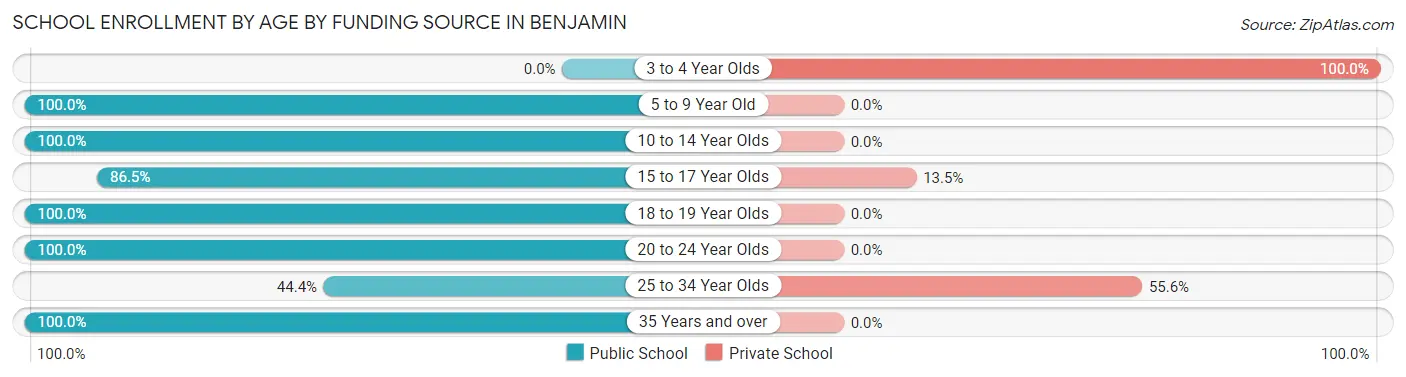
| Age Bracket | Public School | Private School |
| 3 to 4 Year Olds | 0 (0.0%) | 13 (100.0%) |
| 5 to 9 Year Old | 82 (100.0%) | 0 (0.0%) |
| 10 to 14 Year Olds | 155 (100.0%) | 0 (0.0%) |
| 15 to 17 Year Olds | 32 (86.5%) | 5 (13.5%) |
| 18 to 19 Year Olds | 7 (100.0%) | 0 (0.0%) |
| 20 to 24 Year Olds | 13 (100.0%) | 0 (0.0%) |
| 25 to 34 Year Olds | 4 (44.4%) | 5 (55.6%) |
| 35 Years and over | 5 (100.0%) | 0 (0.0%) |
| Total | 298 (92.8%) | 23 (7.2%) |
Educational Attainment by Field of Study in Benjamin
Arts & humanities (30 | 21.6%), business (26 | 18.7%), science & technology (25 | 18.0%), computers & mathematics (19 | 13.7%), and psychology (9 | 6.5%) are the most common fields of study among 139 individuals in Benjamin who have obtained a bachelor's degree or higher.
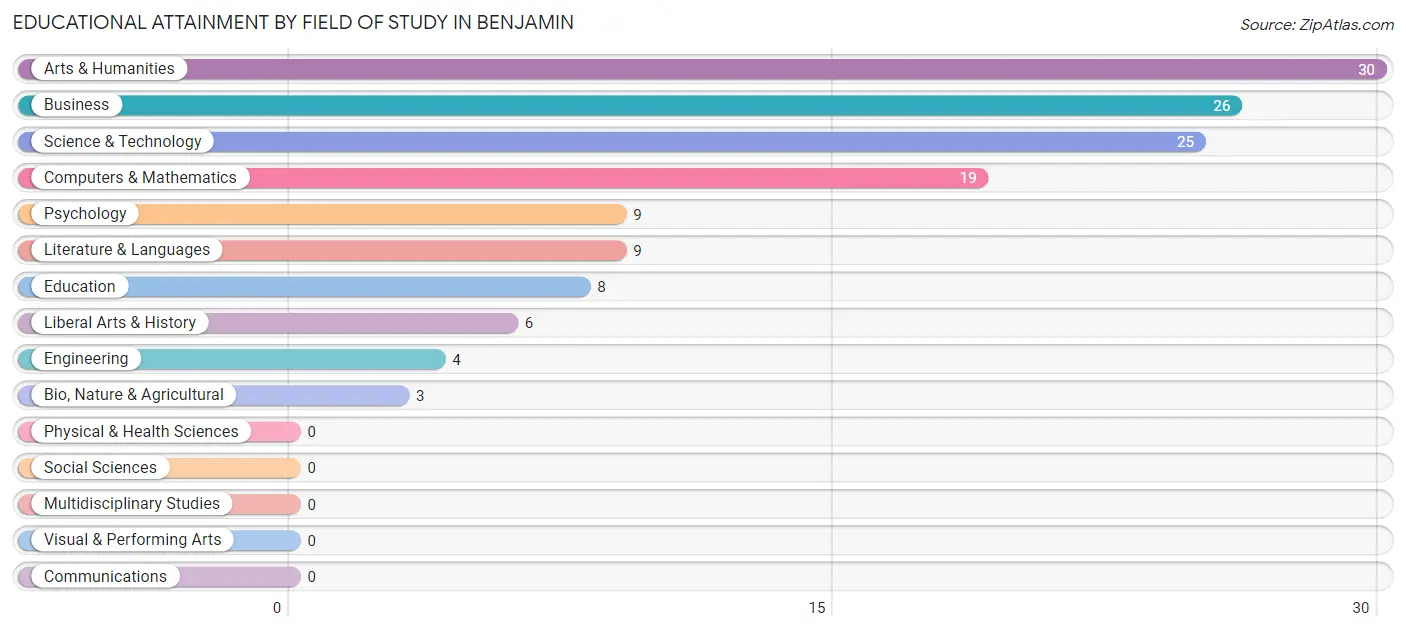
| Field of Study | # Graduates | % Graduates |
| Computers & Mathematics | 19 | 13.7% |
| Bio, Nature & Agricultural | 3 | 2.2% |
| Physical & Health Sciences | 0 | 0.0% |
| Psychology | 9 | 6.5% |
| Social Sciences | 0 | 0.0% |
| Engineering | 4 | 2.9% |
| Multidisciplinary Studies | 0 | 0.0% |
| Science & Technology | 25 | 18.0% |
| Business | 26 | 18.7% |
| Education | 8 | 5.8% |
| Literature & Languages | 9 | 6.5% |
| Liberal Arts & History | 6 | 4.3% |
| Visual & Performing Arts | 0 | 0.0% |
| Communications | 0 | 0.0% |
| Arts & Humanities | 30 | 21.6% |
| Total | 139 | 100.0% |
Transportation & Commute in Benjamin
Vehicle Availability by Sex in Benjamin
The most prevalent vehicle ownership categories in Benjamin are males with 5 or more vehicles (63, accounting for 32.5%) and females with 5 or more vehicles (59, making up 38.2%).
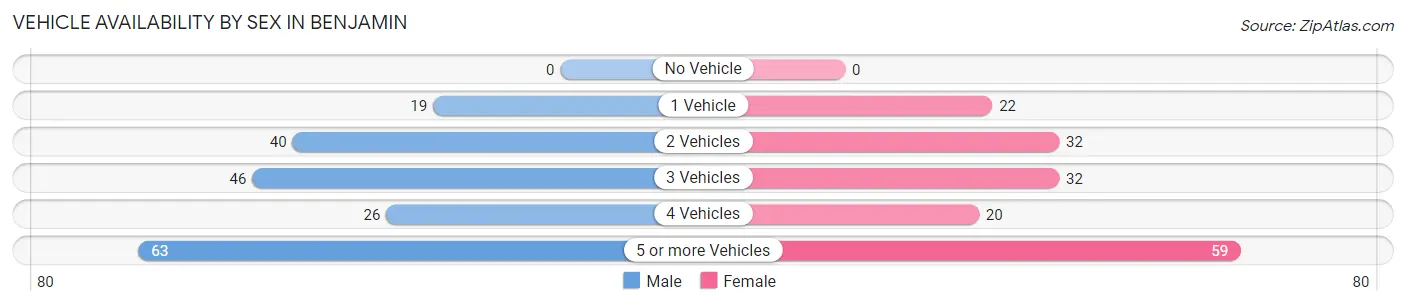
| Vehicles Available | Male | Female |
| No Vehicle | 0 (0.0%) | 0 (0.0%) |
| 1 Vehicle | 19 (9.8%) | 22 (13.3%) |
| 2 Vehicles | 40 (20.6%) | 32 (19.4%) |
| 3 Vehicles | 46 (23.7%) | 32 (19.4%) |
| 4 Vehicles | 26 (13.4%) | 20 (12.1%) |
| 5 or more Vehicles | 63 (32.5%) | 59 (35.8%) |
| Total | 194 (100.0%) | 165 (100.0%) |
Commute Time in Benjamin
The most frequently occuring commute durations in Benjamin are 20 to 24 minutes (74 commuters, 22.0%), 15 to 19 minutes (58 commuters, 17.3%), and 10 to 14 minutes (46 commuters, 13.7%).
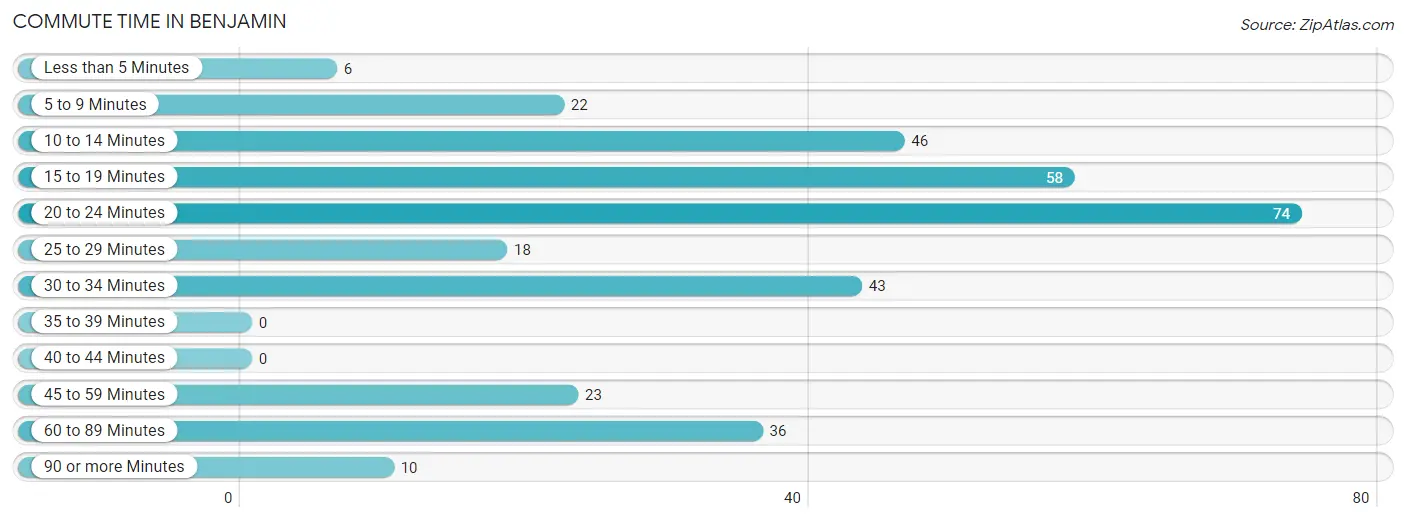
| Commute Time | # Commuters | % Commuters |
| Less than 5 Minutes | 6 | 1.8% |
| 5 to 9 Minutes | 22 | 6.6% |
| 10 to 14 Minutes | 46 | 13.7% |
| 15 to 19 Minutes | 58 | 17.3% |
| 20 to 24 Minutes | 74 | 22.0% |
| 25 to 29 Minutes | 18 | 5.4% |
| 30 to 34 Minutes | 43 | 12.8% |
| 35 to 39 Minutes | 0 | 0.0% |
| 40 to 44 Minutes | 0 | 0.0% |
| 45 to 59 Minutes | 23 | 6.9% |
| 60 to 89 Minutes | 36 | 10.7% |
| 90 or more Minutes | 10 | 3.0% |
Commute Time by Sex in Benjamin
The most common commute times in Benjamin are 15 to 19 minutes (36 commuters, 18.6%) for males and 20 to 24 minutes (43 commuters, 30.3%) for females.
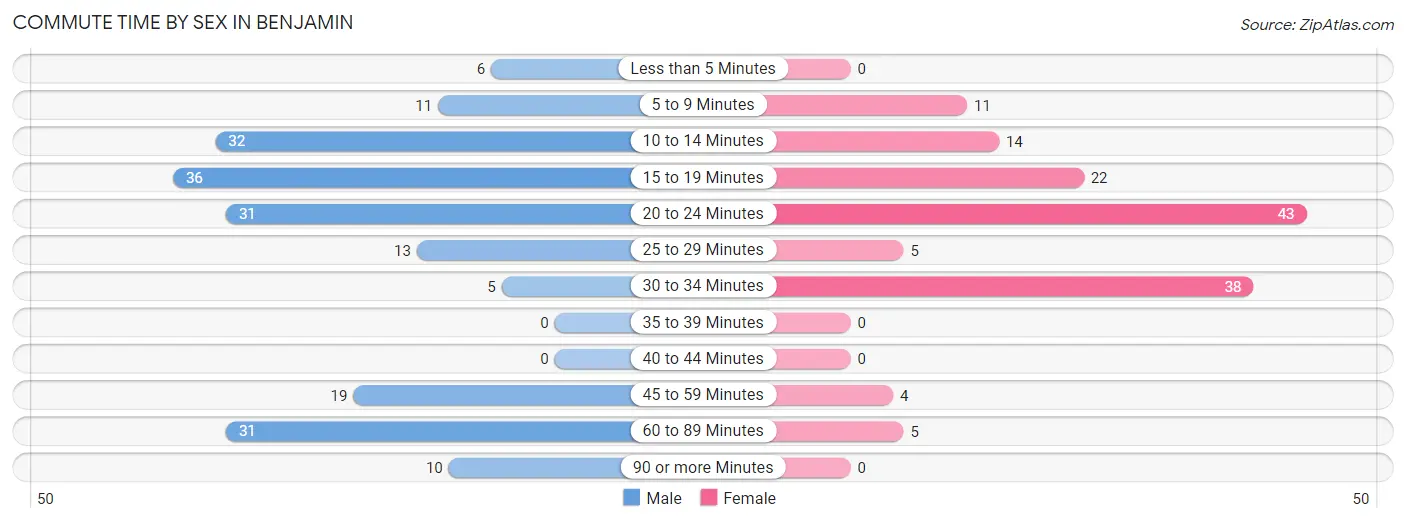
| Commute Time | Male | Female |
| Less than 5 Minutes | 6 (3.1%) | 0 (0.0%) |
| 5 to 9 Minutes | 11 (5.7%) | 11 (7.7%) |
| 10 to 14 Minutes | 32 (16.5%) | 14 (9.9%) |
| 15 to 19 Minutes | 36 (18.6%) | 22 (15.5%) |
| 20 to 24 Minutes | 31 (16.0%) | 43 (30.3%) |
| 25 to 29 Minutes | 13 (6.7%) | 5 (3.5%) |
| 30 to 34 Minutes | 5 (2.6%) | 38 (26.8%) |
| 35 to 39 Minutes | 0 (0.0%) | 0 (0.0%) |
| 40 to 44 Minutes | 0 (0.0%) | 0 (0.0%) |
| 45 to 59 Minutes | 19 (9.8%) | 4 (2.8%) |
| 60 to 89 Minutes | 31 (16.0%) | 5 (3.5%) |
| 90 or more Minutes | 10 (5.1%) | 0 (0.0%) |
Time of Departure to Work by Sex in Benjamin
The most frequent times of departure to work in Benjamin are 8:00 AM to 8:29 AM (52, 26.8%) for males and 7:30 AM to 7:59 AM (27, 19.0%) for females.
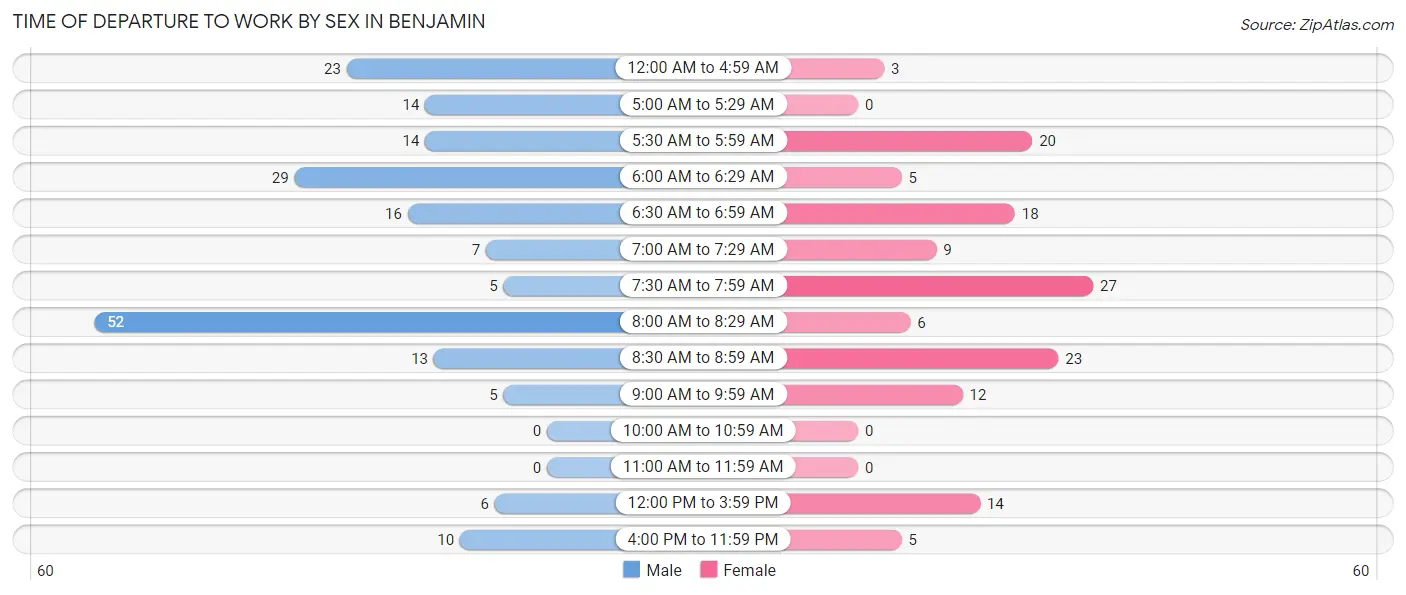
| Time of Departure | Male | Female |
| 12:00 AM to 4:59 AM | 23 (11.9%) | 3 (2.1%) |
| 5:00 AM to 5:29 AM | 14 (7.2%) | 0 (0.0%) |
| 5:30 AM to 5:59 AM | 14 (7.2%) | 20 (14.1%) |
| 6:00 AM to 6:29 AM | 29 (14.9%) | 5 (3.5%) |
| 6:30 AM to 6:59 AM | 16 (8.3%) | 18 (12.7%) |
| 7:00 AM to 7:29 AM | 7 (3.6%) | 9 (6.3%) |
| 7:30 AM to 7:59 AM | 5 (2.6%) | 27 (19.0%) |
| 8:00 AM to 8:29 AM | 52 (26.8%) | 6 (4.2%) |
| 8:30 AM to 8:59 AM | 13 (6.7%) | 23 (16.2%) |
| 9:00 AM to 9:59 AM | 5 (2.6%) | 12 (8.5%) |
| 10:00 AM to 10:59 AM | 0 (0.0%) | 0 (0.0%) |
| 11:00 AM to 11:59 AM | 0 (0.0%) | 0 (0.0%) |
| 12:00 PM to 3:59 PM | 6 (3.1%) | 14 (9.9%) |
| 4:00 PM to 11:59 PM | 10 (5.1%) | 5 (3.5%) |
| Total | 194 (100.0%) | 142 (100.0%) |
Housing Occupancy in Benjamin
Occupancy by Ownership in Benjamin
Of the total 221 dwellings in Benjamin, owner-occupied units account for 196 (88.7%), while renter-occupied units make up 25 (11.3%).
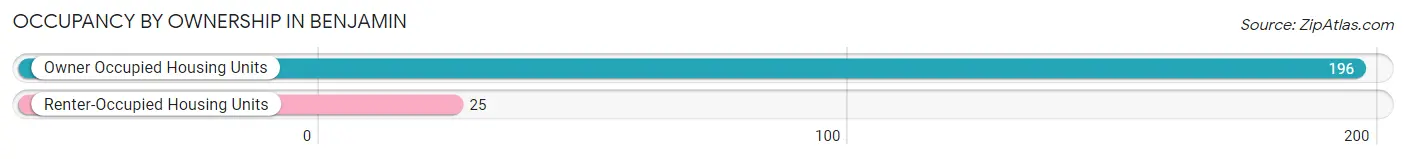
| Occupancy | # Housing Units | % Housing Units |
| Owner Occupied Housing Units | 196 | 88.7% |
| Renter-Occupied Housing Units | 25 | 11.3% |
| Total Occupied Housing Units | 221 | 100.0% |
Occupancy by Household Size in Benjamin
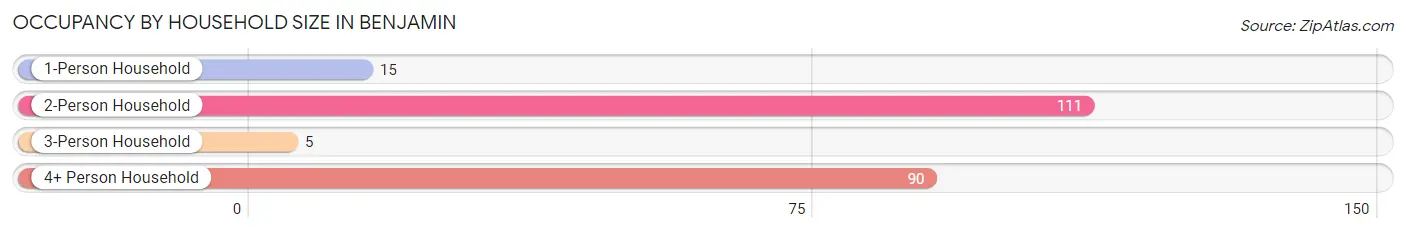
| Household Size | # Housing Units | % Housing Units |
| 1-Person Household | 15 | 6.8% |
| 2-Person Household | 111 | 50.2% |
| 3-Person Household | 5 | 2.3% |
| 4+ Person Household | 90 | 40.7% |
| Total Housing Units | 221 | 100.0% |
Occupancy by Ownership by Household Size in Benjamin
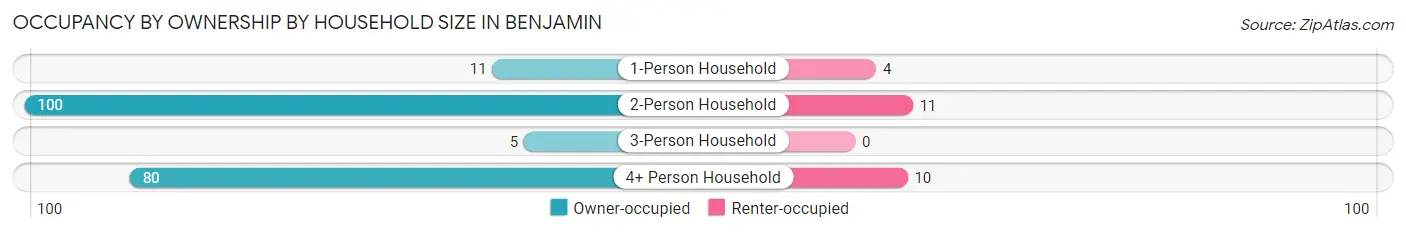
| Household Size | Owner-occupied | Renter-occupied |
| 1-Person Household | 11 (73.3%) | 4 (26.7%) |
| 2-Person Household | 100 (90.1%) | 11 (9.9%) |
| 3-Person Household | 5 (100.0%) | 0 (0.0%) |
| 4+ Person Household | 80 (88.9%) | 10 (11.1%) |
| Total Housing Units | 196 (88.7%) | 25 (11.3%) |
Occupancy by Educational Attainment in Benjamin
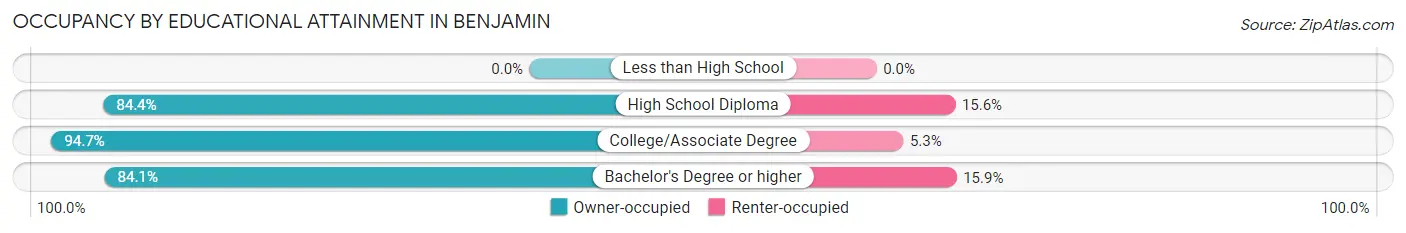
| Household Size | Owner-occupied | Renter-occupied |
| Less than High School | 0 (0.0%) | 0 (0.0%) |
| High School Diploma | 54 (84.4%) | 10 (15.6%) |
| College/Associate Degree | 89 (94.7%) | 5 (5.3%) |
| Bachelor's Degree or higher | 53 (84.1%) | 10 (15.9%) |
Occupancy by Age of Householder in Benjamin
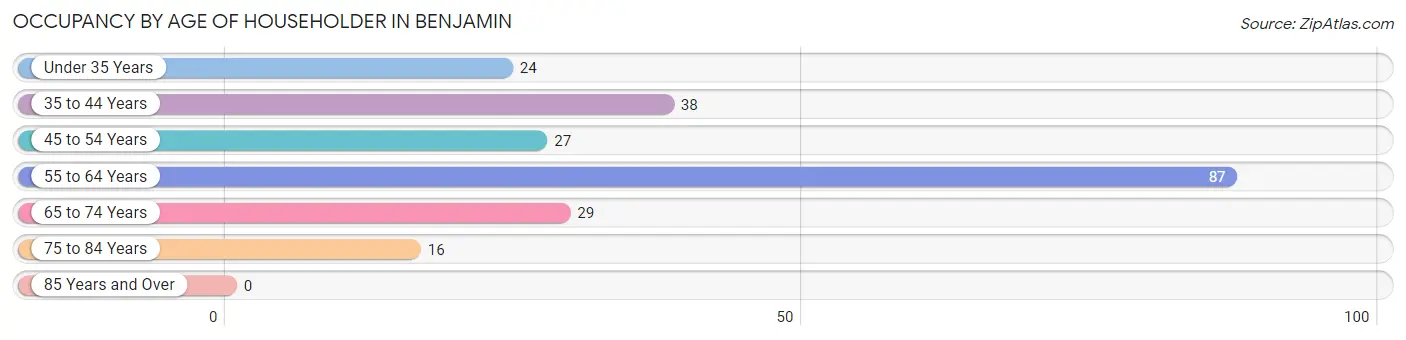
| Age Bracket | # Households | % Households |
| Under 35 Years | 24 | 10.9% |
| 35 to 44 Years | 38 | 17.2% |
| 45 to 54 Years | 27 | 12.2% |
| 55 to 64 Years | 87 | 39.4% |
| 65 to 74 Years | 29 | 13.1% |
| 75 to 84 Years | 16 | 7.2% |
| 85 Years and Over | 0 | 0.0% |
| Total | 221 | 100.0% |
Housing Finances in Benjamin
Median Income by Occupancy in Benjamin
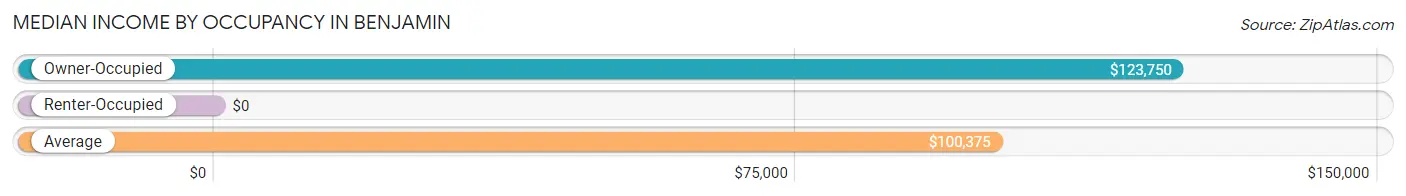
| Occupancy Type | # Households | Median Income |
| Owner-Occupied | 196 (88.7%) | $123,750 |
| Renter-Occupied | 25 (11.3%) | $0 |
| Average | 221 (100.0%) | $100,375 |
Occupancy by Householder Income Bracket in Benjamin
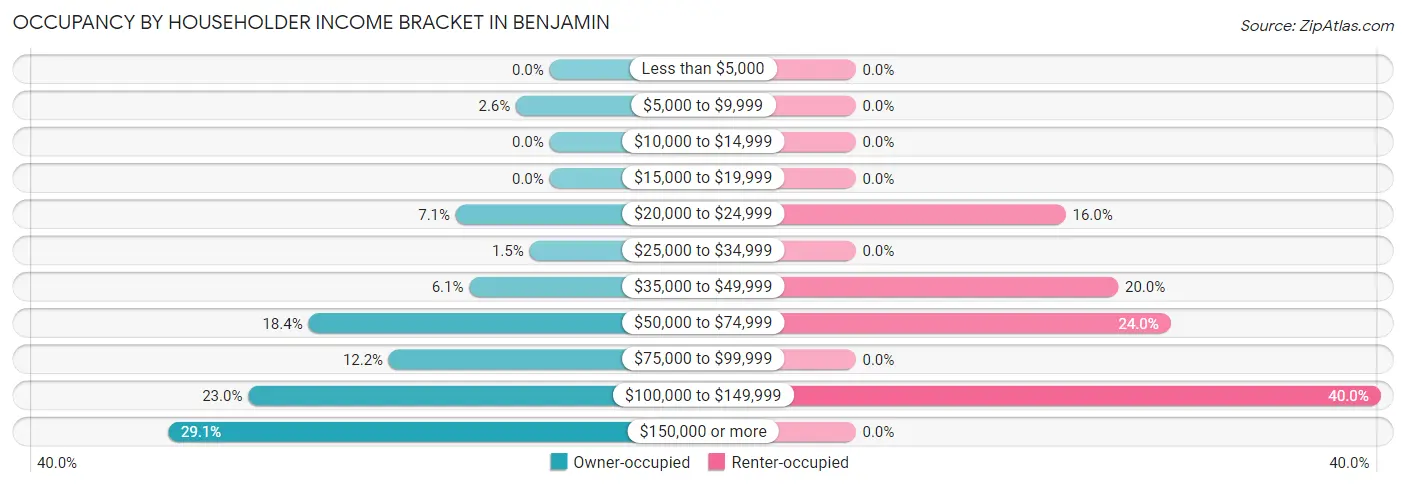
| Income Bracket | Owner-occupied | Renter-occupied |
| Less than $5,000 | 0 (0.0%) | 0 (0.0%) |
| $5,000 to $9,999 | 5 (2.5%) | 0 (0.0%) |
| $10,000 to $14,999 | 0 (0.0%) | 0 (0.0%) |
| $15,000 to $19,999 | 0 (0.0%) | 0 (0.0%) |
| $20,000 to $24,999 | 14 (7.1%) | 4 (16.0%) |
| $25,000 to $34,999 | 3 (1.5%) | 0 (0.0%) |
| $35,000 to $49,999 | 12 (6.1%) | 5 (20.0%) |
| $50,000 to $74,999 | 36 (18.4%) | 6 (24.0%) |
| $75,000 to $99,999 | 24 (12.2%) | 0 (0.0%) |
| $100,000 to $149,999 | 45 (23.0%) | 10 (40.0%) |
| $150,000 or more | 57 (29.1%) | 0 (0.0%) |
| Total | 196 (100.0%) | 25 (100.0%) |
Monthly Housing Cost Tiers in Benjamin
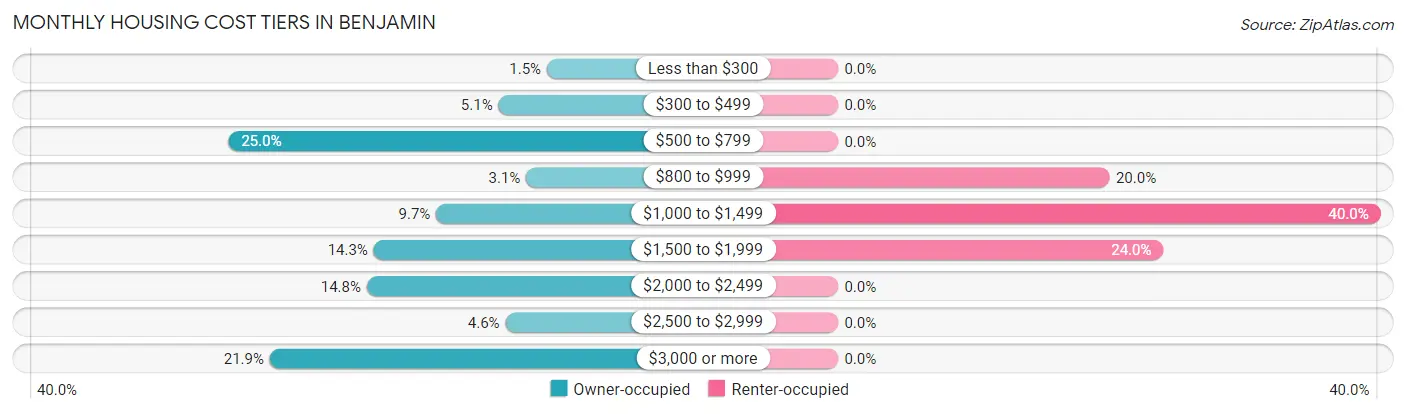
| Monthly Cost | Owner-occupied | Renter-occupied |
| Less than $300 | 3 (1.5%) | 0 (0.0%) |
| $300 to $499 | 10 (5.1%) | 0 (0.0%) |
| $500 to $799 | 49 (25.0%) | 0 (0.0%) |
| $800 to $999 | 6 (3.1%) | 5 (20.0%) |
| $1,000 to $1,499 | 19 (9.7%) | 10 (40.0%) |
| $1,500 to $1,999 | 28 (14.3%) | 6 (24.0%) |
| $2,000 to $2,499 | 29 (14.8%) | 0 (0.0%) |
| $2,500 to $2,999 | 9 (4.6%) | 0 (0.0%) |
| $3,000 or more | 43 (21.9%) | 0 (0.0%) |
| Total | 196 (100.0%) | 25 (100.0%) |
Physical Housing Characteristics in Benjamin
Housing Structures in Benjamin
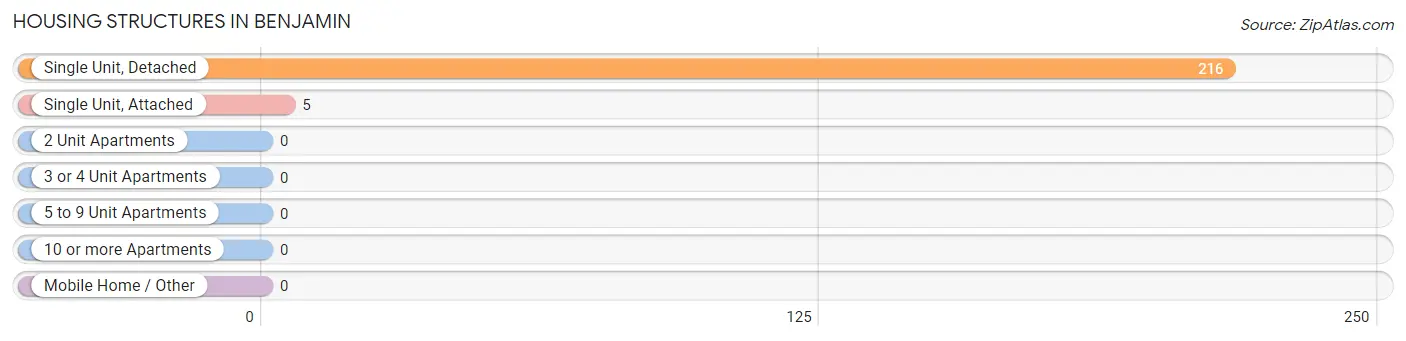
| Structure Type | # Housing Units | % Housing Units |
| Single Unit, Detached | 216 | 97.7% |
| Single Unit, Attached | 5 | 2.3% |
| 2 Unit Apartments | 0 | 0.0% |
| 3 or 4 Unit Apartments | 0 | 0.0% |
| 5 to 9 Unit Apartments | 0 | 0.0% |
| 10 or more Apartments | 0 | 0.0% |
| Mobile Home / Other | 0 | 0.0% |
| Total | 221 | 100.0% |
Housing Structures by Occupancy in Benjamin
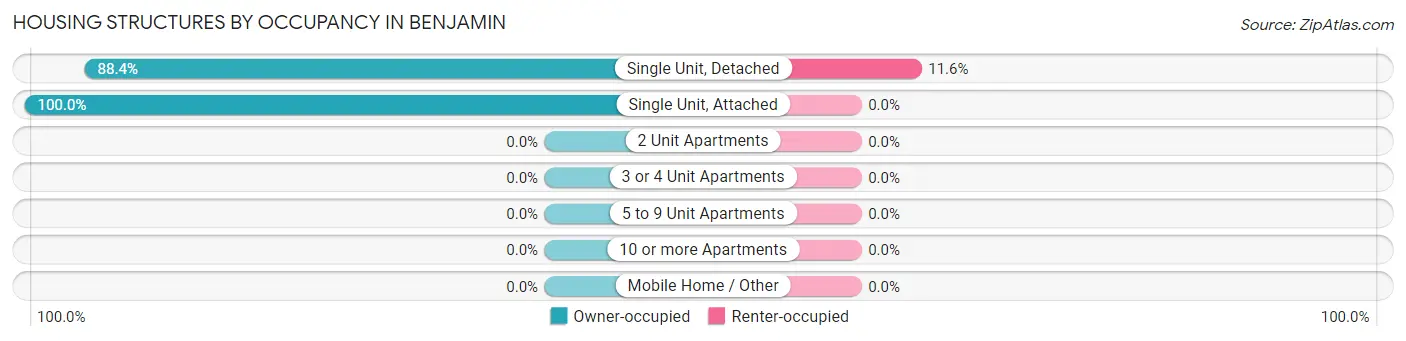
| Structure Type | Owner-occupied | Renter-occupied |
| Single Unit, Detached | 191 (88.4%) | 25 (11.6%) |
| Single Unit, Attached | 5 (100.0%) | 0 (0.0%) |
| 2 Unit Apartments | 0 (0.0%) | 0 (0.0%) |
| 3 or 4 Unit Apartments | 0 (0.0%) | 0 (0.0%) |
| 5 to 9 Unit Apartments | 0 (0.0%) | 0 (0.0%) |
| 10 or more Apartments | 0 (0.0%) | 0 (0.0%) |
| Mobile Home / Other | 0 (0.0%) | 0 (0.0%) |
| Total | 196 (88.7%) | 25 (11.3%) |
Housing Structures by Number of Rooms in Benjamin
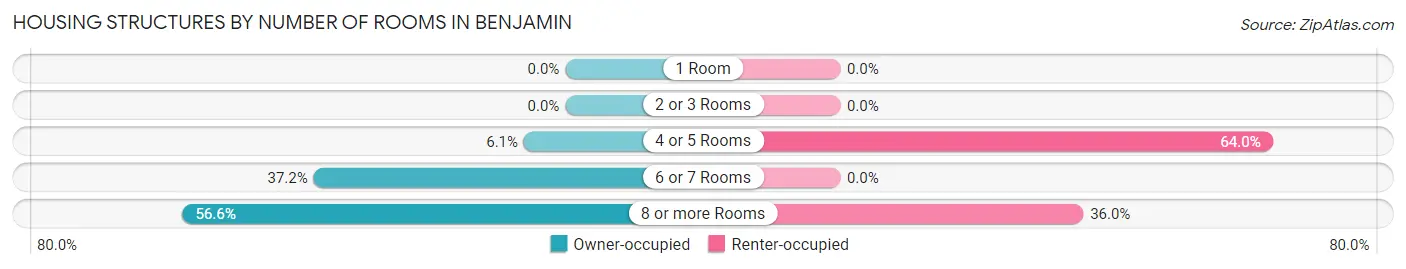
| Number of Rooms | Owner-occupied | Renter-occupied |
| 1 Room | 0 (0.0%) | 0 (0.0%) |
| 2 or 3 Rooms | 0 (0.0%) | 0 (0.0%) |
| 4 or 5 Rooms | 12 (6.1%) | 16 (64.0%) |
| 6 or 7 Rooms | 73 (37.2%) | 0 (0.0%) |
| 8 or more Rooms | 111 (56.6%) | 9 (36.0%) |
| Total | 196 (100.0%) | 25 (100.0%) |
Housing Structure by Heating Type in Benjamin
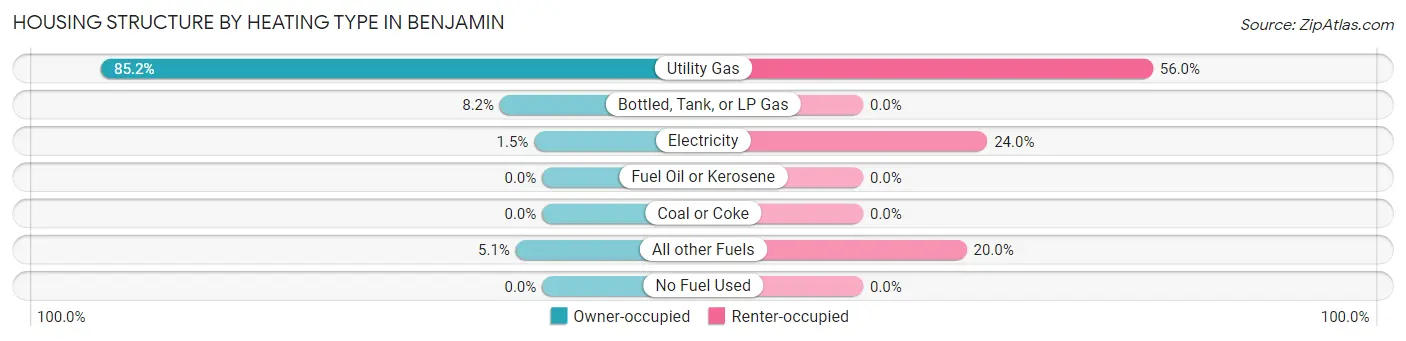
| Heating Type | Owner-occupied | Renter-occupied |
| Utility Gas | 167 (85.2%) | 14 (56.0%) |
| Bottled, Tank, or LP Gas | 16 (8.2%) | 0 (0.0%) |
| Electricity | 3 (1.5%) | 6 (24.0%) |
| Fuel Oil or Kerosene | 0 (0.0%) | 0 (0.0%) |
| Coal or Coke | 0 (0.0%) | 0 (0.0%) |
| All other Fuels | 10 (5.1%) | 5 (20.0%) |
| No Fuel Used | 0 (0.0%) | 0 (0.0%) |
| Total | 196 (100.0%) | 25 (100.0%) |
Household Vehicle Usage in Benjamin
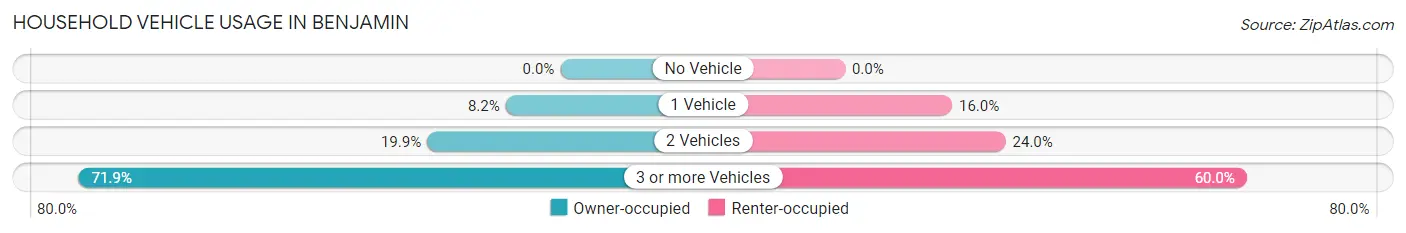
| Vehicles per Household | Owner-occupied | Renter-occupied |
| No Vehicle | 0 (0.0%) | 0 (0.0%) |
| 1 Vehicle | 16 (8.2%) | 4 (16.0%) |
| 2 Vehicles | 39 (19.9%) | 6 (24.0%) |
| 3 or more Vehicles | 141 (71.9%) | 15 (60.0%) |
| Total | 196 (100.0%) | 25 (100.0%) |
Real Estate & Mortgages in Benjamin
Real Estate and Mortgage Overview in Benjamin
| Characteristic | Without Mortgage | With Mortgage |
| Housing Units | 56 | 140 |
| Median Property Value | $830,900 | $602,300 |
| Median Household Income | $59,891 | $48 |
| Monthly Housing Costs | $626 | $43 |
| Real Estate Taxes | $2,672 | $0 |
Property Value by Mortgage Status in Benjamin
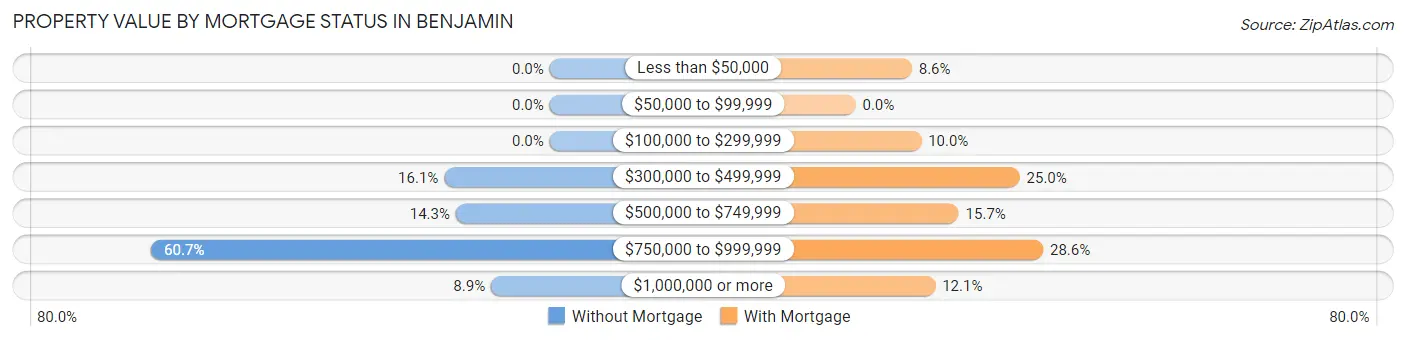
| Property Value | Without Mortgage | With Mortgage |
| Less than $50,000 | 0 (0.0%) | 12 (8.6%) |
| $50,000 to $99,999 | 0 (0.0%) | 0 (0.0%) |
| $100,000 to $299,999 | 0 (0.0%) | 14 (10.0%) |
| $300,000 to $499,999 | 9 (16.1%) | 35 (25.0%) |
| $500,000 to $749,999 | 8 (14.3%) | 22 (15.7%) |
| $750,000 to $999,999 | 34 (60.7%) | 40 (28.6%) |
| $1,000,000 or more | 5 (8.9%) | 17 (12.1%) |
| Total | 56 (100.0%) | 140 (100.0%) |
Household Income by Mortgage Status in Benjamin
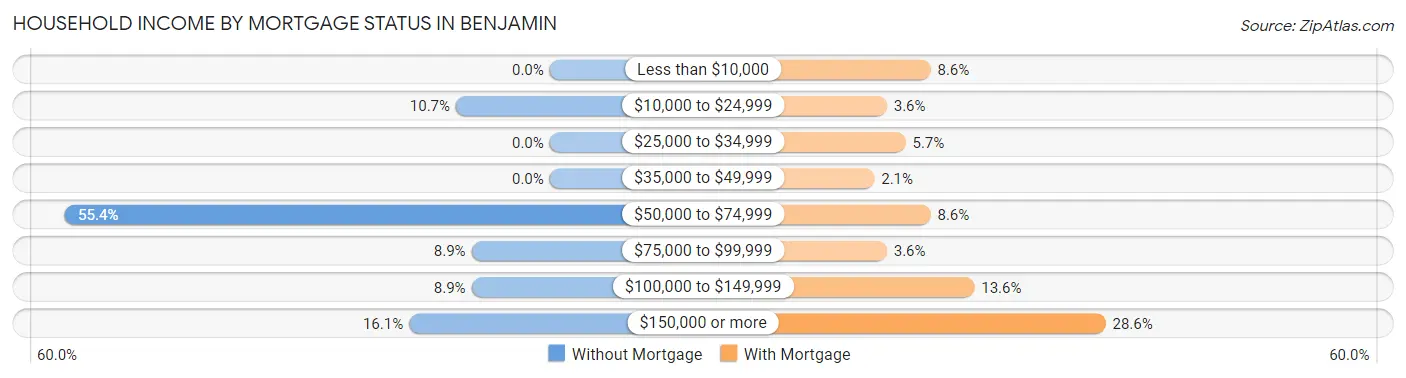
| Household Income | Without Mortgage | With Mortgage |
| Less than $10,000 | 0 (0.0%) | 12 (8.6%) |
| $10,000 to $24,999 | 6 (10.7%) | 5 (3.6%) |
| $25,000 to $34,999 | 0 (0.0%) | 8 (5.7%) |
| $35,000 to $49,999 | 0 (0.0%) | 3 (2.1%) |
| $50,000 to $74,999 | 31 (55.4%) | 12 (8.6%) |
| $75,000 to $99,999 | 5 (8.9%) | 5 (3.6%) |
| $100,000 to $149,999 | 5 (8.9%) | 19 (13.6%) |
| $150,000 or more | 9 (16.1%) | 40 (28.6%) |
| Total | 56 (100.0%) | 140 (100.0%) |
Property Value to Household Income Ratio in Benjamin
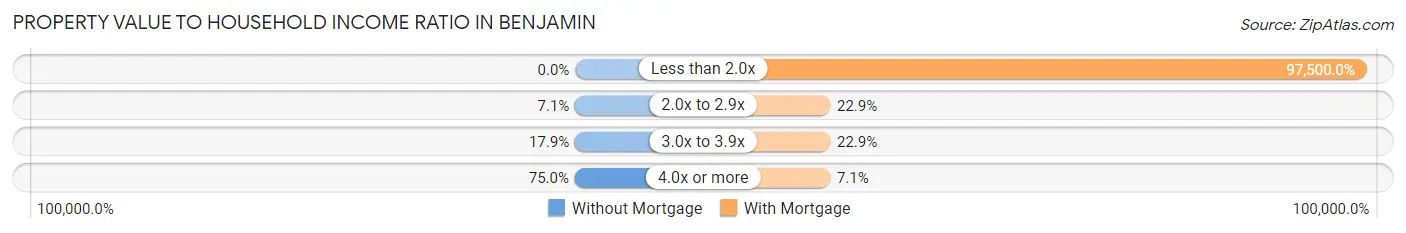
| Value-to-Income Ratio | Without Mortgage | With Mortgage |
| Less than 2.0x | 0 (0.0%) | 136,500 (97,500.0%) |
| 2.0x to 2.9x | 4 (7.1%) | 32 (22.9%) |
| 3.0x to 3.9x | 10 (17.9%) | 32 (22.9%) |
| 4.0x or more | 42 (75.0%) | 10 (7.1%) |
| Total | 56 (100.0%) | 140 (100.0%) |
Real Estate Taxes by Mortgage Status in Benjamin
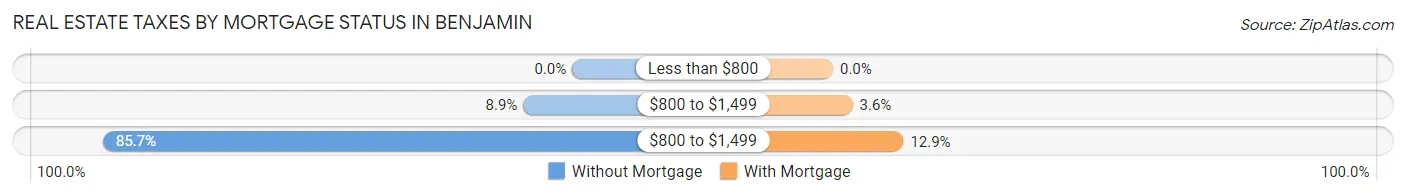
| Property Taxes | Without Mortgage | With Mortgage |
| Less than $800 | 0 (0.0%) | 0 (0.0%) |
| $800 to $1,499 | 5 (8.9%) | 5 (3.6%) |
| $800 to $1,499 | 48 (85.7%) | 18 (12.9%) |
| Total | 56 (100.0%) | 140 (100.0%) |
Health & Disability in Benjamin
Health Insurance Coverage by Age in Benjamin
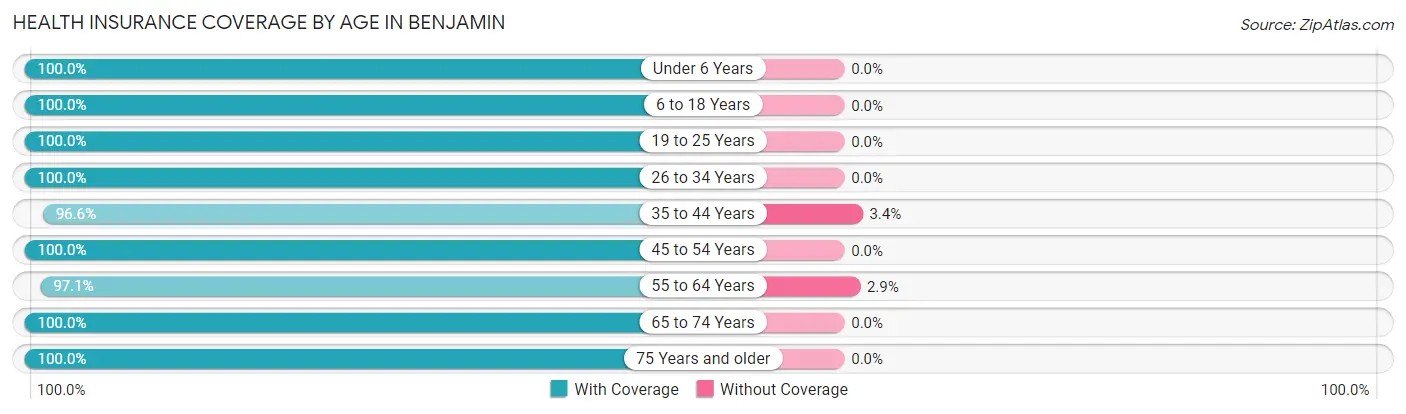
| Age Bracket | With Coverage | Without Coverage |
| Under 6 Years | 62 (100.0%) | 0 (0.0%) |
| 6 to 18 Years | 278 (100.0%) | 0 (0.0%) |
| 19 to 25 Years | 19 (100.0%) | 0 (0.0%) |
| 26 to 34 Years | 41 (100.0%) | 0 (0.0%) |
| 35 to 44 Years | 114 (96.6%) | 4 (3.4%) |
| 45 to 54 Years | 52 (100.0%) | 0 (0.0%) |
| 55 to 64 Years | 166 (97.1%) | 5 (2.9%) |
| 65 to 74 Years | 63 (100.0%) | 0 (0.0%) |
| 75 Years and older | 44 (100.0%) | 0 (0.0%) |
| Total | 839 (98.9%) | 9 (1.1%) |
Health Insurance Coverage by Citizenship Status in Benjamin
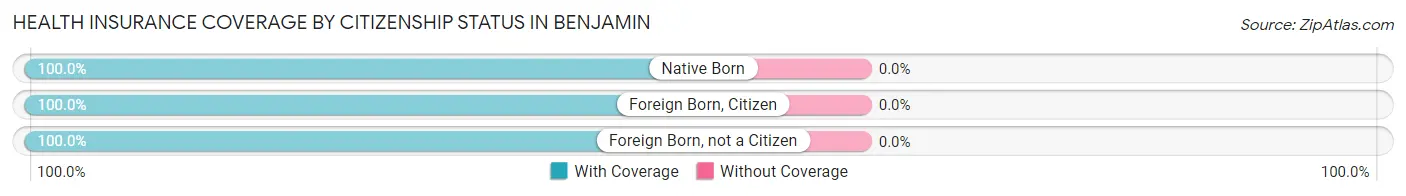
| Citizenship Status | With Coverage | Without Coverage |
| Native Born | 62 (100.0%) | 0 (0.0%) |
| Foreign Born, Citizen | 278 (100.0%) | 0 (0.0%) |
| Foreign Born, not a Citizen | 19 (100.0%) | 0 (0.0%) |
Health Insurance Coverage by Household Income in Benjamin
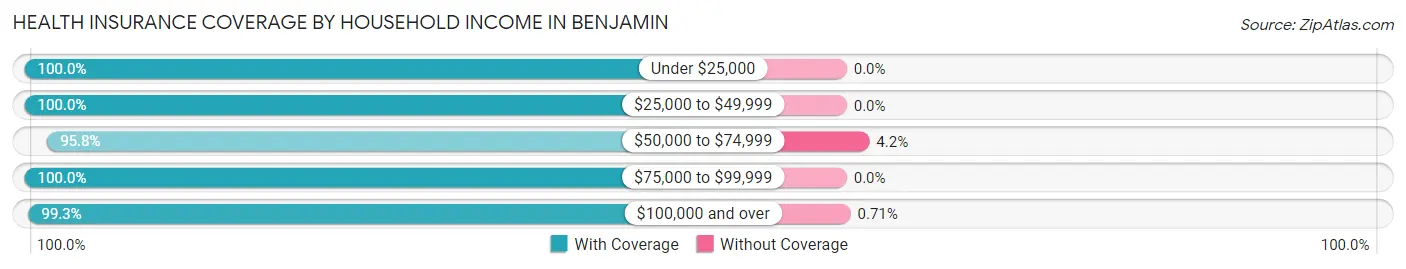
| Household Income | With Coverage | Without Coverage |
| Under $25,000 | 66 (100.0%) | 0 (0.0%) |
| $25,000 to $49,999 | 39 (100.0%) | 0 (0.0%) |
| $50,000 to $74,999 | 113 (95.8%) | 5 (4.2%) |
| $75,000 to $99,999 | 65 (100.0%) | 0 (0.0%) |
| $100,000 and over | 556 (99.3%) | 4 (0.7%) |
Public vs Private Health Insurance Coverage by Age in Benjamin
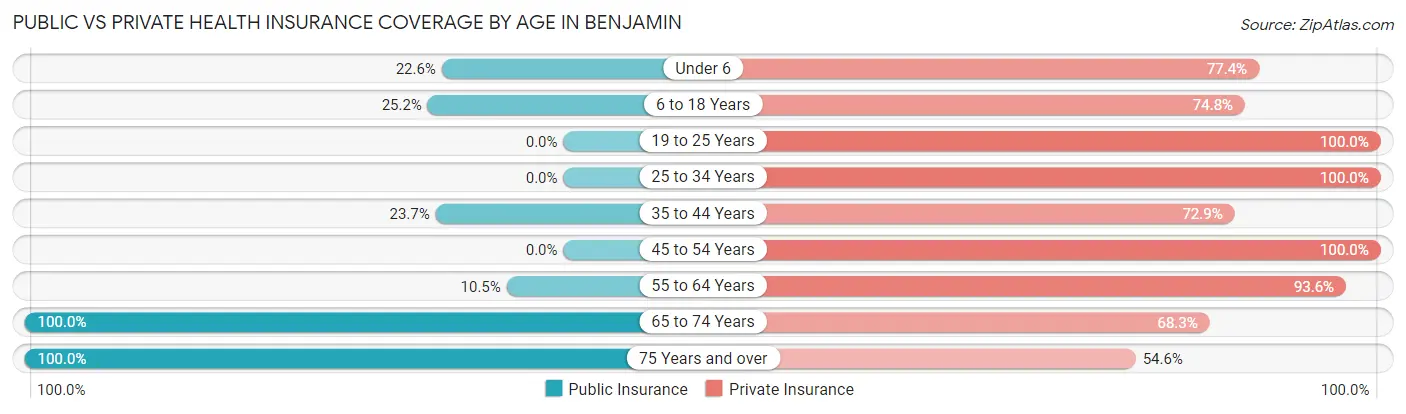
| Age Bracket | Public Insurance | Private Insurance |
| Under 6 | 14 (22.6%) | 48 (77.4%) |
| 6 to 18 Years | 70 (25.2%) | 208 (74.8%) |
| 19 to 25 Years | 0 (0.0%) | 19 (100.0%) |
| 25 to 34 Years | 0 (0.0%) | 41 (100.0%) |
| 35 to 44 Years | 28 (23.7%) | 86 (72.9%) |
| 45 to 54 Years | 0 (0.0%) | 52 (100.0%) |
| 55 to 64 Years | 18 (10.5%) | 160 (93.6%) |
| 65 to 74 Years | 63 (100.0%) | 43 (68.2%) |
| 75 Years and over | 44 (100.0%) | 24 (54.5%) |
| Total | 237 (28.0%) | 681 (80.3%) |
Disability Status by Sex by Age in Benjamin
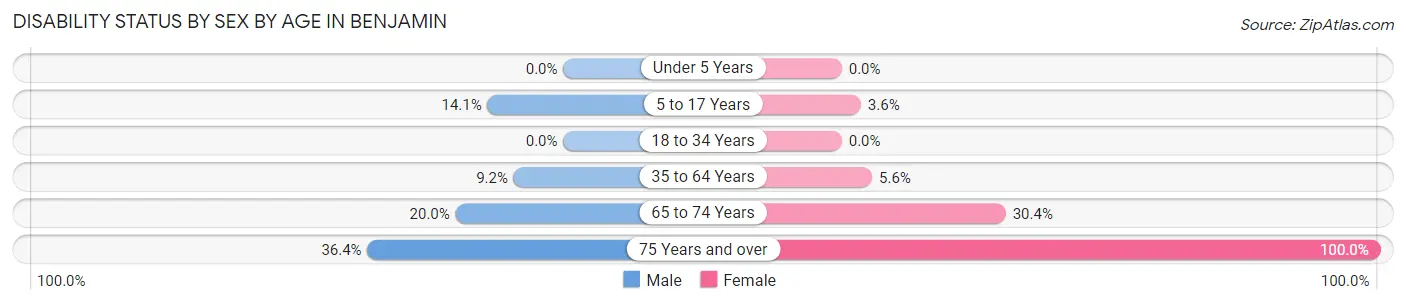
| Age Bracket | Male | Female |
| Under 5 Years | 0 (0.0%) | 0 (0.0%) |
| 5 to 17 Years | 19 (14.1%) | 5 (3.5%) |
| 18 to 34 Years | 0 (0.0%) | 0 (0.0%) |
| 35 to 64 Years | 15 (9.2%) | 10 (5.6%) |
| 65 to 74 Years | 8 (20.0%) | 7 (30.4%) |
| 75 Years and over | 8 (36.4%) | 22 (100.0%) |
Disability Class by Sex by Age in Benjamin
Disability Class: Hearing Difficulty
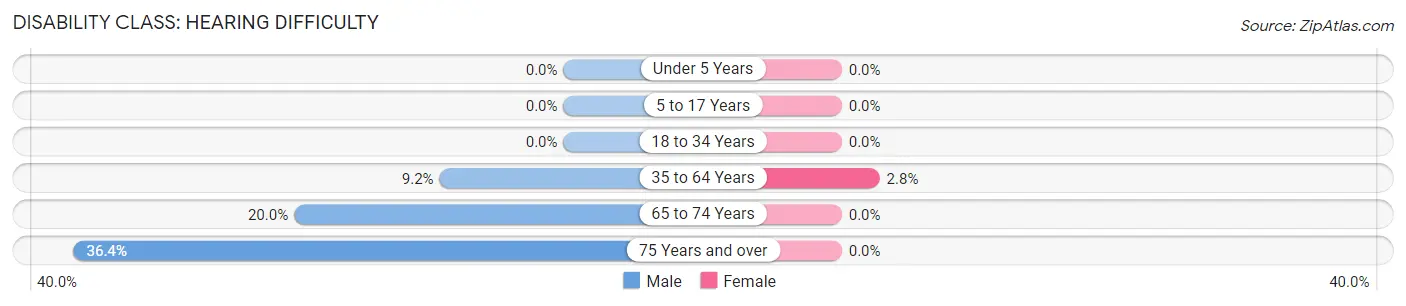
| Age Bracket | Male | Female |
| Under 5 Years | 0 (0.0%) | 0 (0.0%) |
| 5 to 17 Years | 0 (0.0%) | 0 (0.0%) |
| 18 to 34 Years | 0 (0.0%) | 0 (0.0%) |
| 35 to 64 Years | 15 (9.2%) | 5 (2.8%) |
| 65 to 74 Years | 8 (20.0%) | 0 (0.0%) |
| 75 Years and over | 8 (36.4%) | 0 (0.0%) |
Disability Class: Vision Difficulty
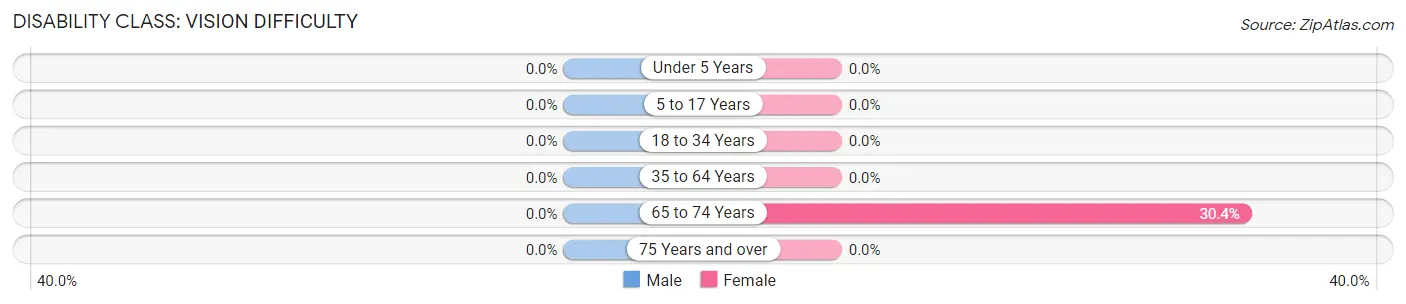
| Age Bracket | Male | Female |
| Under 5 Years | 0 (0.0%) | 0 (0.0%) |
| 5 to 17 Years | 0 (0.0%) | 0 (0.0%) |
| 18 to 34 Years | 0 (0.0%) | 0 (0.0%) |
| 35 to 64 Years | 0 (0.0%) | 0 (0.0%) |
| 65 to 74 Years | 0 (0.0%) | 7 (30.4%) |
| 75 Years and over | 0 (0.0%) | 0 (0.0%) |
Disability Class: Cognitive Difficulty
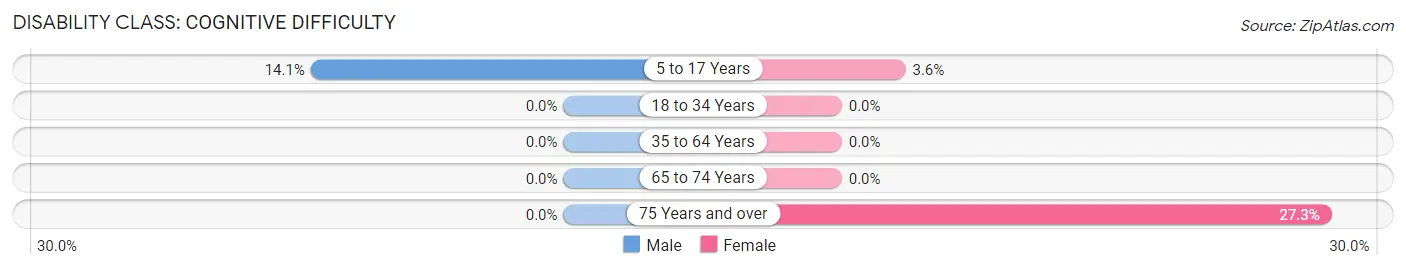
| Age Bracket | Male | Female |
| 5 to 17 Years | 19 (14.1%) | 5 (3.5%) |
| 18 to 34 Years | 0 (0.0%) | 0 (0.0%) |
| 35 to 64 Years | 0 (0.0%) | 0 (0.0%) |
| 65 to 74 Years | 0 (0.0%) | 0 (0.0%) |
| 75 Years and over | 0 (0.0%) | 6 (27.3%) |
Disability Class: Ambulatory Difficulty
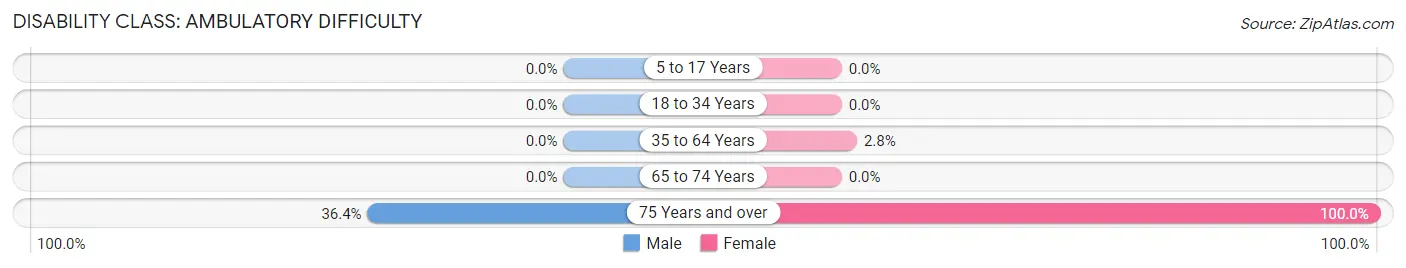
| Age Bracket | Male | Female |
| 5 to 17 Years | 0 (0.0%) | 0 (0.0%) |
| 18 to 34 Years | 0 (0.0%) | 0 (0.0%) |
| 35 to 64 Years | 0 (0.0%) | 5 (2.8%) |
| 65 to 74 Years | 0 (0.0%) | 0 (0.0%) |
| 75 Years and over | 8 (36.4%) | 22 (100.0%) |
Disability Class: Self-Care Difficulty
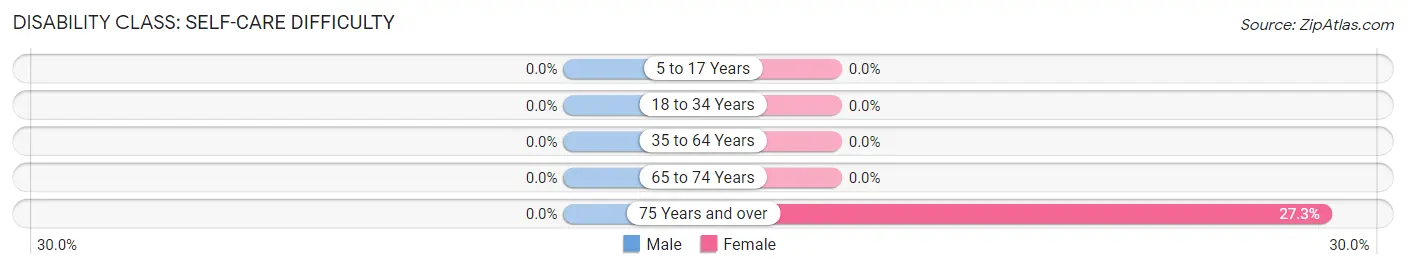
| Age Bracket | Male | Female |
| 5 to 17 Years | 0 (0.0%) | 0 (0.0%) |
| 18 to 34 Years | 0 (0.0%) | 0 (0.0%) |
| 35 to 64 Years | 0 (0.0%) | 0 (0.0%) |
| 65 to 74 Years | 0 (0.0%) | 0 (0.0%) |
| 75 Years and over | 0 (0.0%) | 6 (27.3%) |
Technology Access in Benjamin
Computing Device Access in Benjamin
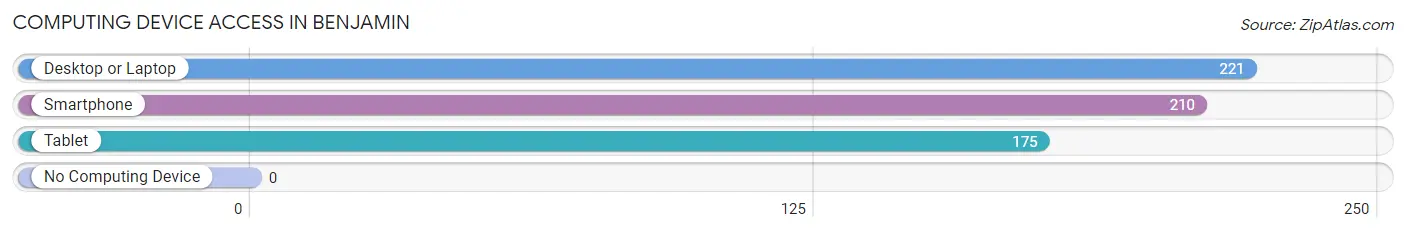
| Device Type | # Households | % Households |
| Desktop or Laptop | 221 | 100.0% |
| Smartphone | 210 | 95.0% |
| Tablet | 175 | 79.2% |
| No Computing Device | 0 | 0.0% |
| Total | 221 | 100.0% |
Internet Access in Benjamin
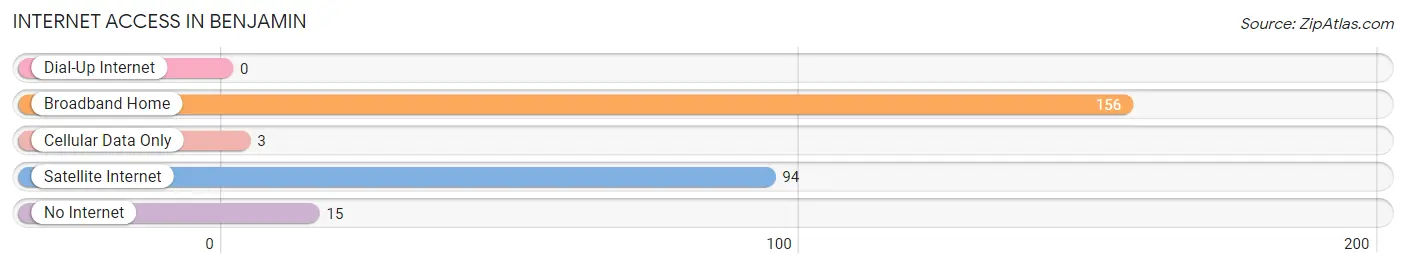
| Internet Type | # Households | % Households |
| Dial-Up Internet | 0 | 0.0% |
| Broadband Home | 156 | 70.6% |
| Cellular Data Only | 3 | 1.4% |
| Satellite Internet | 94 | 42.5% |
| No Internet | 15 | 6.8% |
| Total | 221 | 100.0% |
Benjamin Summary
The state of Utah is located in the western United States and is bordered by Idaho, Wyoming, Colorado, Arizona, and Nevada. It is the 13th largest state in the United States and the 11th most populous. Utah is known for its diverse geography, ranging from the Great Salt Lake in the north to the red rock canyons of the south. It is also home to five national parks, including Zion National Park and Bryce Canyon National Park.
Geography
Utah is located in the western United States and is bordered by Idaho, Wyoming, Colorado, Arizona, and Nevada. It is the 13th largest state in the United States and the 11th most populous. Utah is known for its diverse geography, ranging from the Great Salt Lake in the north to the red rock canyons of the south. It is also home to five national parks, including Zion National Park and Bryce Canyon National Park. The state is divided into three distinct geographic regions: the Great Basin, the Colorado Plateau, and the Rocky Mountains. The Great Basin is a large desert region in the western part of the state, while the Colorado Plateau is a high-altitude plateau in the south. The Rocky Mountains are located in the northern part of the state.
History
Utah was first inhabited by Native American tribes, including the Ute, Paiute, and Shoshone. The first Europeans to explore the area were Spanish explorers in the late 1700s. In 1847, Mormon pioneers led by Brigham Young arrived in the Salt Lake Valley and established the first permanent settlement in the area. The area was officially organized as the Utah Territory in 1850 and was admitted to the Union as the 45th state in 1896.
The state has a long history of mining and ranching, and the economy was largely based on these industries until the mid-20th century. In the 1950s, the state began to diversify its economy and attract new industries, such as technology and tourism.
Economy
Utah’s economy is largely based on services, manufacturing, and tourism. The state is home to several major companies, including the software company Adobe Systems, the outdoor retailer REI, and the online retailer Overstock.com. The state is also a major producer of coal, copper, and other minerals.
The state’s tourism industry is a major contributor to the economy, with visitors drawn to the state’s national parks and ski resorts. Utah is also home to several major universities, including the University of Utah and Brigham Young University.
Demographics
As of 2019, the population of Utah was estimated to be 3.2 million. The state is predominantly white, with 78.7% of the population identifying as white. The largest minority groups are Hispanic or Latino (13.7%), Asian (2.9%), and African American (1.7%).
The median household income in Utah is $68,358, and the median home value is $322,400. The state has a low unemployment rate of 3.2%.
Conclusion
Utah is a western state with a diverse geography, history, economy, and population. The state is home to five national parks, several major companies, and a thriving tourism industry. The population is predominantly white, with the largest minority groups being Hispanic or Latino, Asian, and African American. The median household income is $68,358, and the median home value is $322,400. The state has a low unemployment rate of 3.2%.
Common Questions
What is Per Capita Income in Benjamin?
Per Capita income in Benjamin is $35,040.
What is the Median Family Income in Benjamin?
Median Family Income in Benjamin is $102,250.
What is the Median Household income in Benjamin?
Median Household Income in Benjamin is $100,375.
What is Income or Wage Gap in Benjamin?
Income or Wage Gap in Benjamin is 58.9%.
Women in Benjamin earn 41.1 cents for every dollar earned by a man.
What is Inequality or Gini Index in Benjamin?
Inequality or Gini Index in Benjamin is 0.44.
What is the Total Population of Benjamin?
Total Population of Benjamin is 848.
What is the Total Male Population of Benjamin?
Total Male Population of Benjamin is 431.
What is the Total Female Population of Benjamin?
Total Female Population of Benjamin is 417.
What is the Ratio of Males per 100 Females in Benjamin?
There are 103.36 Males per 100 Females in Benjamin.
What is the Ratio of Females per 100 Males in Benjamin?
There are 96.75 Females per 100 Males in Benjamin.
What is the Median Population Age in Benjamin?
Median Population Age in Benjamin is 36.3 Years.
What is the Average Family Size in Benjamin
Average Family Size in Benjamin is 4.0 People.
What is the Average Household Size in Benjamin
Average Household Size in Benjamin is 3.8 People.
How Large is the Labor Force in Benjamin?
There are 359 People in the Labor Forcein in Benjamin.
What is the Percentage of People in the Labor Force in Benjamin?
65.6% of People are in the Labor Force in Benjamin.