Zip Codes with the Highest Percentage of Population Employed in Health Diagnosing & Treating in Layton, UT
RELATED REPORTS & OPTIONS
Health Diagnosing & Treating
Layton
Compare Zip Codes
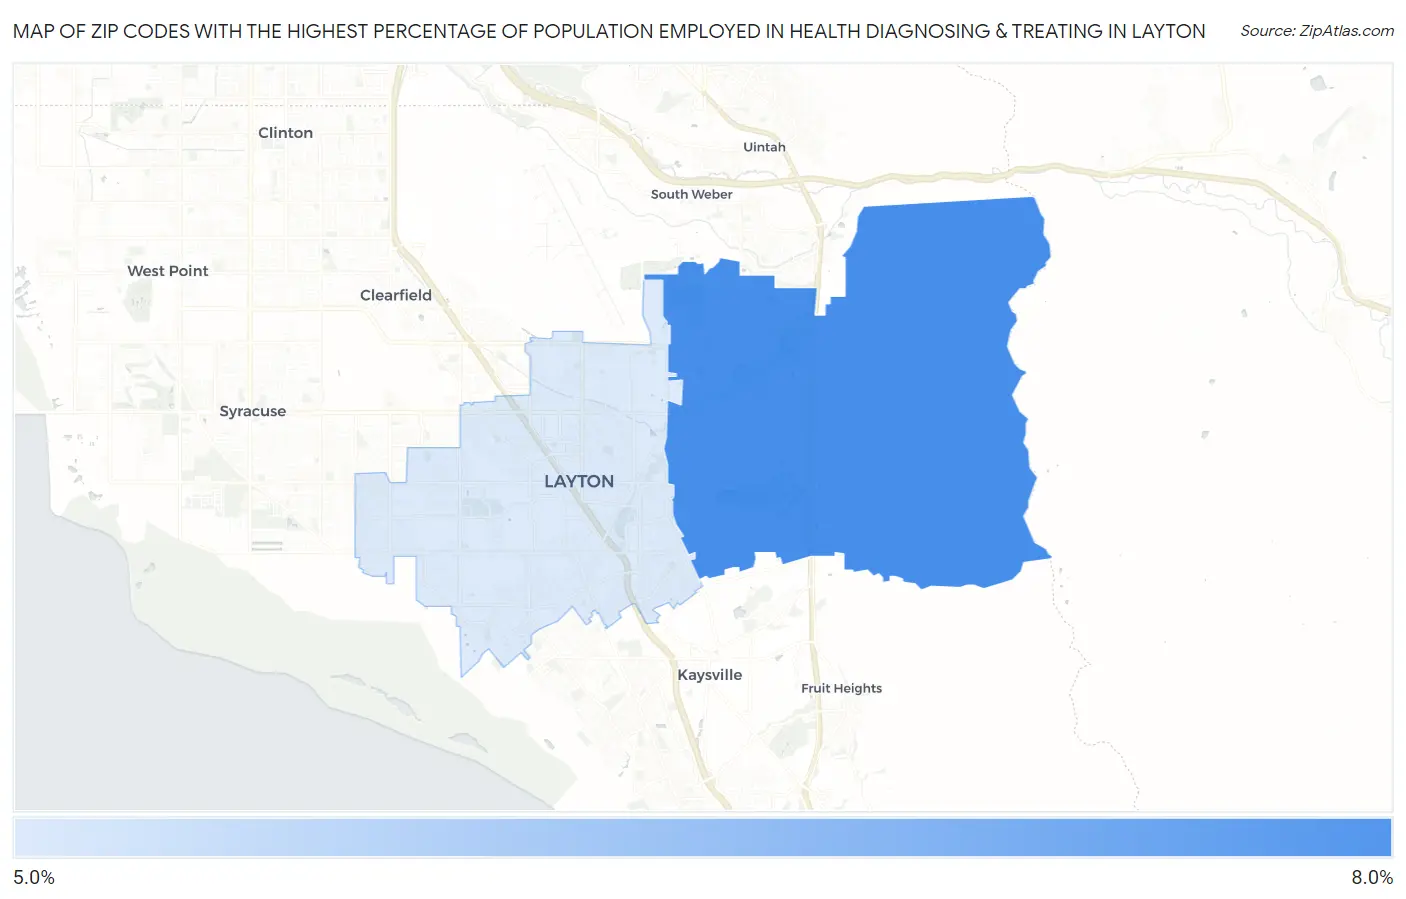
Map of Zip Codes with the Highest Percentage of Population Employed in Health Diagnosing & Treating in Layton
5.3%
7.3%
Zip Codes with the Highest Percentage of Population Employed in Health Diagnosing & Treating in Layton, UT
| Zip Code | % Employed | vs State | vs National | |
| 1. | 84040 | 7.3% | 5.1%(+2.19)#47 | 6.2%(+1.07)#9,382 |
| 2. | 84041 | 5.3% | 5.1%(+0.130)#88 | 6.2%(-0.990)#16,725 |
1
Common Questions
What are the Top Zip Codes with the Highest Percentage of Population Employed in Health Diagnosing & Treating in Layton, UT?
Top Zip Codes with the Highest Percentage of Population Employed in Health Diagnosing & Treating in Layton, UT are:
What zip code has the Highest Percentage of Population Employed in Health Diagnosing & Treating in Layton, UT?
84040 has the Highest Percentage of Population Employed in Health Diagnosing & Treating in Layton, UT with 7.3%.
What is the Percentage of Population Employed in Health Diagnosing & Treating in Layton, UT?
Percentage of Population Employed in Health Diagnosing & Treating in Layton is 5.9%.
What is the Percentage of Population Employed in Health Diagnosing & Treating in Utah?
Percentage of Population Employed in Health Diagnosing & Treating in Utah is 5.1%.
What is the Percentage of Population Employed in Health Diagnosing & Treating in the United States?
Percentage of Population Employed in Health Diagnosing & Treating in the United States is 6.2%.