Peoa, UT Map & Demographics
Peoa Map
Peoa Overview
$77,384
PER CAPITA INCOME
$186,528
AVG FAMILY INCOME
$116,641
AVG HOUSEHOLD INCOME
10.1%
WAGE / INCOME GAP [ % ]
89.9¢/ $1
WAGE / INCOME GAP [ $ ]
0.21
INEQUALITY / GINI INDEX
87
TOTAL POPULATION
42
MALE POPULATION
45
FEMALE POPULATION
93.33
MALES / 100 FEMALES
107.14
FEMALES / 100 MALES
58.6
MEDIAN AGE
2.0
AVG FAMILY SIZE
1.6
AVG HOUSEHOLD SIZE
70
LABOR FORCE [ PEOPLE ]
80.5%
PERCENT IN LABOR FORCE
Peoa Zip Codes
Peoa Area Codes
Income in Peoa
Income Overview in Peoa
Per Capita Income in Peoa is $77,384, while median incomes of families and households are $186,528 and $116,641 respectively.
| Characteristic | Number | Measure |
| Per Capita Income | 87 | $77,384 |
| Median Family Income | 21 | $186,528 |
| Mean Family Income | 21 | $183,533 |
| Median Household Income | 53 | $116,641 |
| Mean Household Income | 53 | $130,602 |
| Income Deficit | 21 | $0 |
| Wage / Income Gap (%) | 87 | 10.14% |
| Wage / Income Gap ($) | 87 | 89.86¢ per $1 |
| Gini / Inequality Index | 87 | 0.21 |
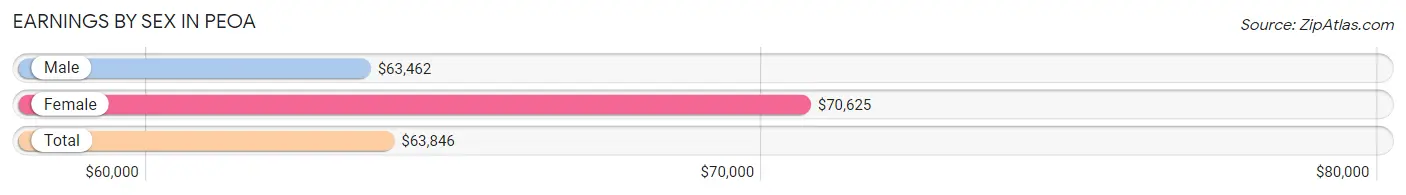
Earnings by Sex in Peoa
Average Earnings in Peoa are $63,846, $63,462 for men and $70,625 for women, a difference of 10.1%.
| Sex | Number | Average Earnings |
| Male | 34 (48.6%) | $63,462 |
| Female | 36 (51.4%) | $70,625 |
| Total | 70 (100.0%) | $63,846 |
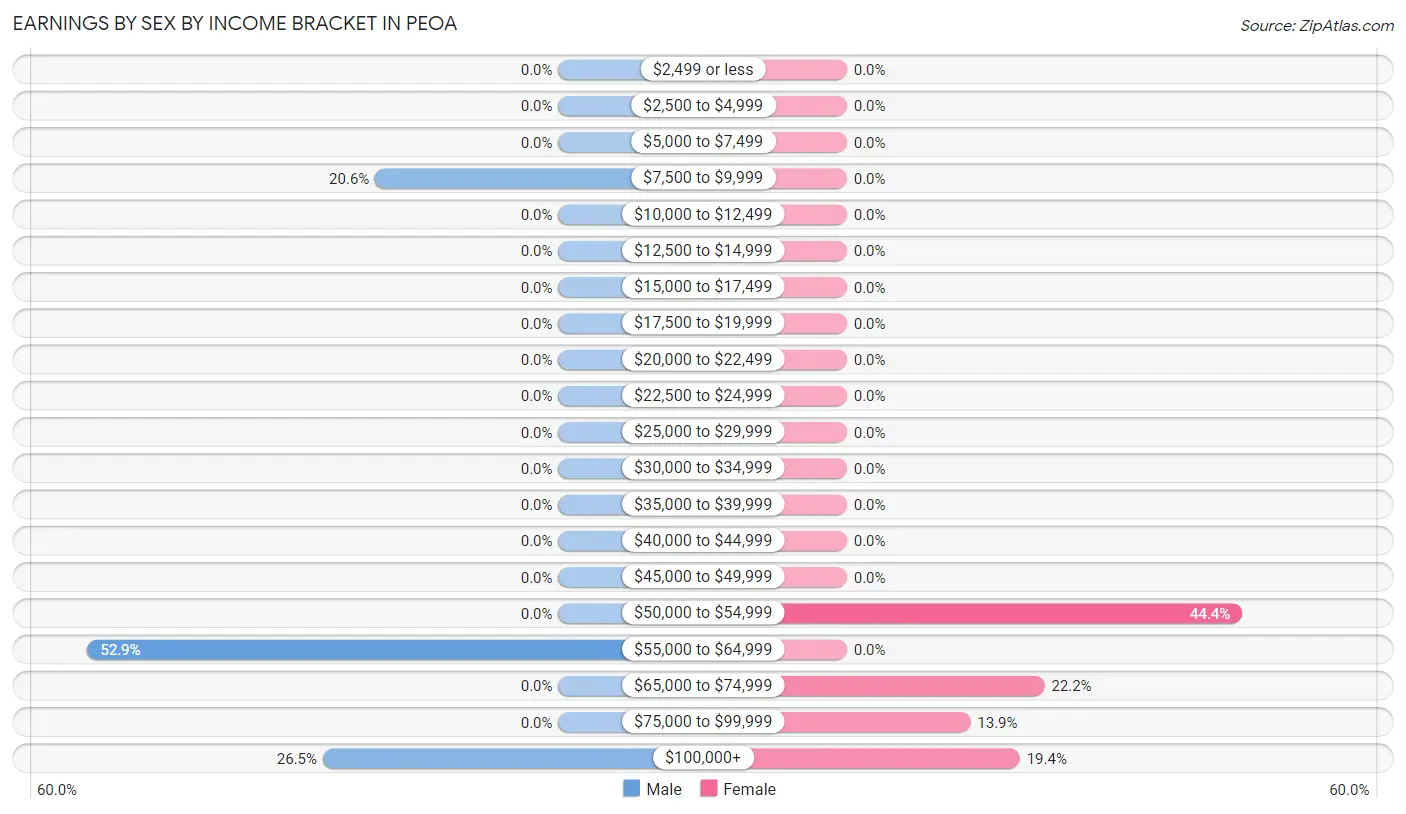
Earnings by Sex by Income Bracket in Peoa
The most common earnings brackets in Peoa are $55,000 to $64,999 for men (18 | 52.9%) and $50,000 to $54,999 for women (16 | 44.4%).
| Income | Male | Female |
| $2,499 or less | 0 (0.0%) | 0 (0.0%) |
| $2,500 to $4,999 | 0 (0.0%) | 0 (0.0%) |
| $5,000 to $7,499 | 0 (0.0%) | 0 (0.0%) |
| $7,500 to $9,999 | 7 (20.6%) | 0 (0.0%) |
| $10,000 to $12,499 | 0 (0.0%) | 0 (0.0%) |
| $12,500 to $14,999 | 0 (0.0%) | 0 (0.0%) |
| $15,000 to $17,499 | 0 (0.0%) | 0 (0.0%) |
| $17,500 to $19,999 | 0 (0.0%) | 0 (0.0%) |
| $20,000 to $22,499 | 0 (0.0%) | 0 (0.0%) |
| $22,500 to $24,999 | 0 (0.0%) | 0 (0.0%) |
| $25,000 to $29,999 | 0 (0.0%) | 0 (0.0%) |
| $30,000 to $34,999 | 0 (0.0%) | 0 (0.0%) |
| $35,000 to $39,999 | 0 (0.0%) | 0 (0.0%) |
| $40,000 to $44,999 | 0 (0.0%) | 0 (0.0%) |
| $45,000 to $49,999 | 0 (0.0%) | 0 (0.0%) |
| $50,000 to $54,999 | 0 (0.0%) | 16 (44.4%) |
| $55,000 to $64,999 | 18 (52.9%) | 0 (0.0%) |
| $65,000 to $74,999 | 0 (0.0%) | 8 (22.2%) |
| $75,000 to $99,999 | 0 (0.0%) | 5 (13.9%) |
| $100,000+ | 9 (26.5%) | 7 (19.4%) |
| Total | 34 (100.0%) | 36 (100.0%) |
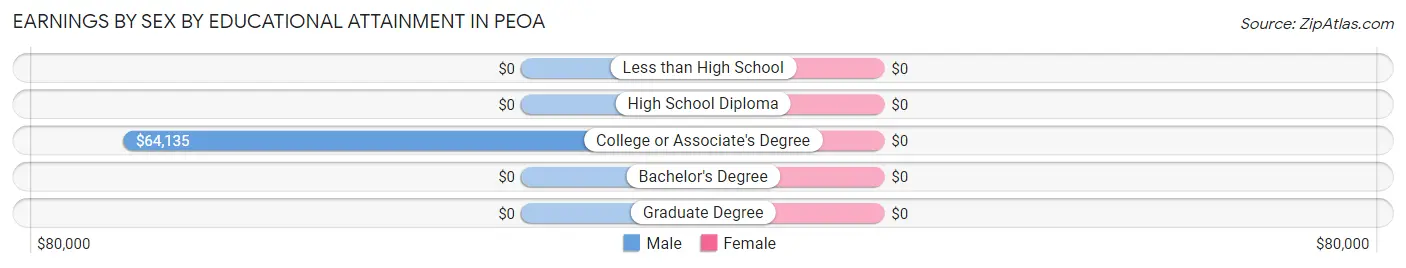
Earnings by Sex by Educational Attainment in Peoa
| Educational Attainment | Male Income | Female Income |
| Less than High School | - | - |
| High School Diploma | - | - |
| College or Associate's Degree | $64,135 | $0 |
| Bachelor's Degree | - | - |
| Graduate Degree | - | - |
| Total | $63,462 | $70,625 |
Family Income in Peoa
Family Income Brackets in Peoa
According to the Peoa family income data, there are 14 families falling into the $150,000 to $199,999 income range, which is the most common income bracket and makes up 66.7% of all families.
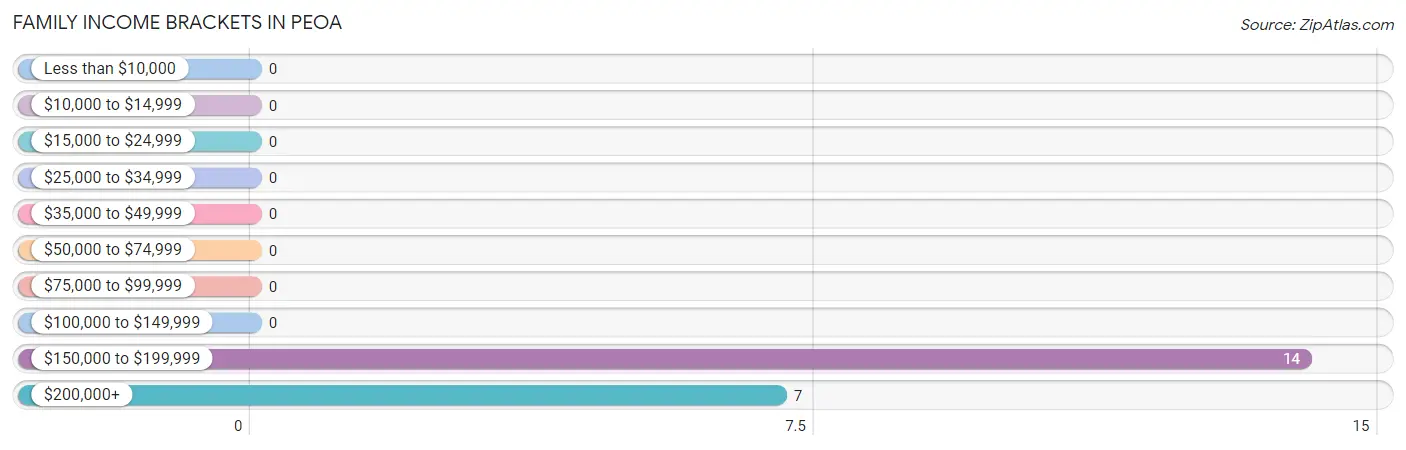
| Income Bracket | # Families | % Families |
| Less than $10,000 | 0 | 0.0% |
| $10,000 to $14,999 | 0 | 0.0% |
| $15,000 to $24,999 | 0 | 0.0% |
| $25,000 to $34,999 | 0 | 0.0% |
| $35,000 to $49,999 | 0 | 0.0% |
| $50,000 to $74,999 | 0 | 0.0% |
| $75,000 to $99,999 | 0 | 0.0% |
| $100,000 to $149,999 | 0 | 0.0% |
| $150,000 to $199,999 | 14 | 66.7% |
| $200,000+ | 7 | 33.3% |
Family Income by Famaliy Size in Peoa
2-person families (21 | 100.0%) account for the highest median family income in Peoa with $186,528 per family, while 2-person families (21 | 100.0%) have the highest median income of $93,264 per family member.
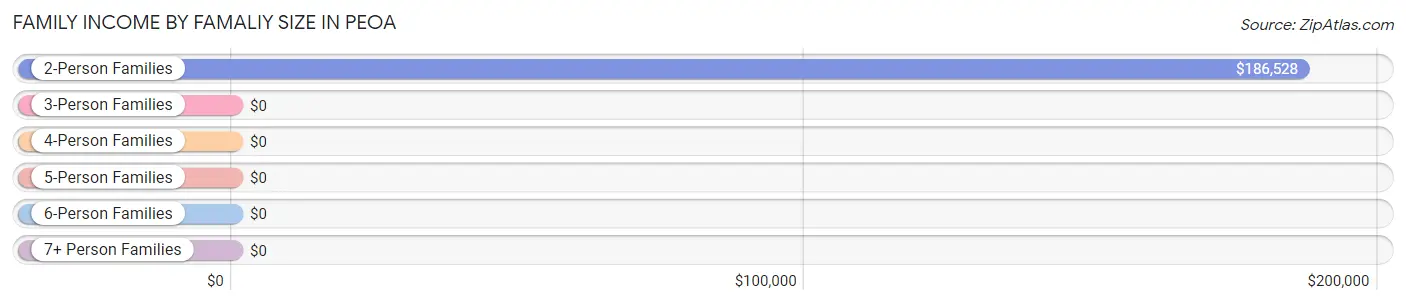
| Income Bracket | # Families | Median Income |
| 2-Person Families | 21 (100.0%) | $186,528 |
| 3-Person Families | 0 (0.0%) | $0 |
| 4-Person Families | 0 (0.0%) | $0 |
| 5-Person Families | 0 (0.0%) | $0 |
| 6-Person Families | 0 (0.0%) | $0 |
| 7+ Person Families | 0 (0.0%) | $0 |
| Total | 21 (100.0%) | $186,528 |
Family Income by Number of Earners in Peoa
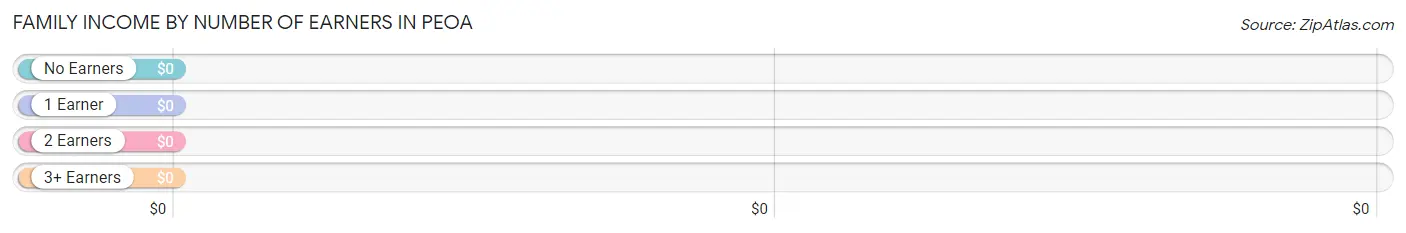
| Number of Earners | # Families | Median Income |
| No Earners | 0 (0.0%) | $0 |
| 1 Earner | 9 (42.9%) | $0 |
| 2 Earners | 12 (57.1%) | $0 |
| 3+ Earners | 0 (0.0%) | $0 |
| Total | 21 (100.0%) | $186,528 |
Household Income in Peoa
Household Income Brackets in Peoa
With 24 households falling in the category, the $100,000 to $149,999 income range is the most frequent in Peoa, accounting for 45.3% of all households.
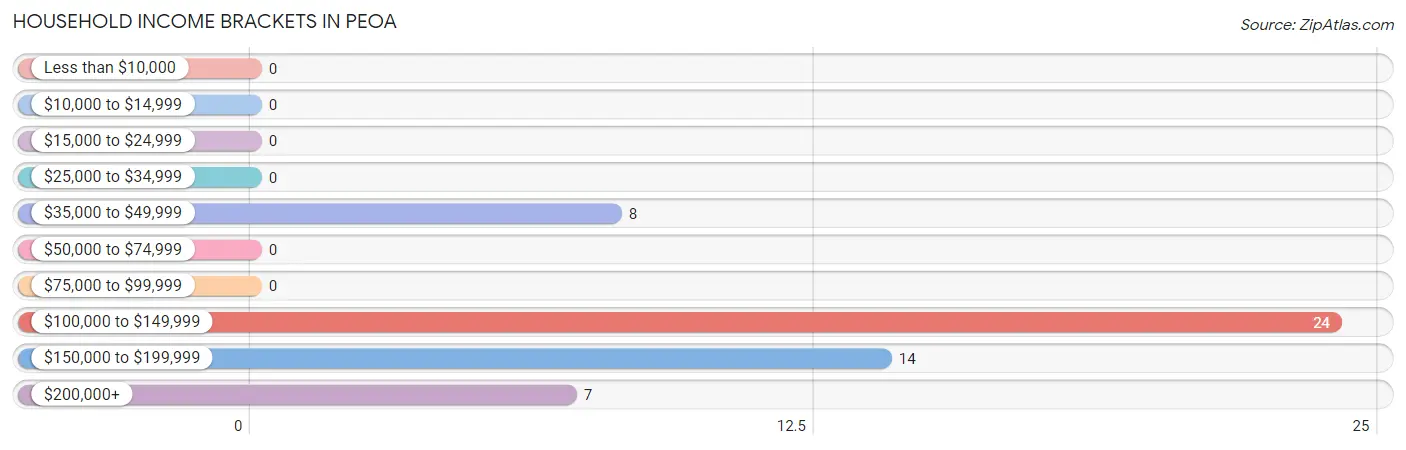
| Income Bracket | # Households | % Households |
| Less than $10,000 | 0 | 0.0% |
| $10,000 to $14,999 | 0 | 0.0% |
| $15,000 to $24,999 | 0 | 0.0% |
| $25,000 to $34,999 | 0 | 0.0% |
| $35,000 to $49,999 | 8 | 15.1% |
| $50,000 to $74,999 | 0 | 0.0% |
| $75,000 to $99,999 | 0 | 0.0% |
| $100,000 to $149,999 | 24 | 45.3% |
| $150,000 to $199,999 | 14 | 26.4% |
| $200,000+ | 7 | 13.2% |
Household Income by Householder Age in Peoa
The median household income in Peoa is $116,641, with the highest median household income of $108,594 found in the 45 to 64 years age bracket for the primary householder. A total of 23 households (43.4%) fall into this category.
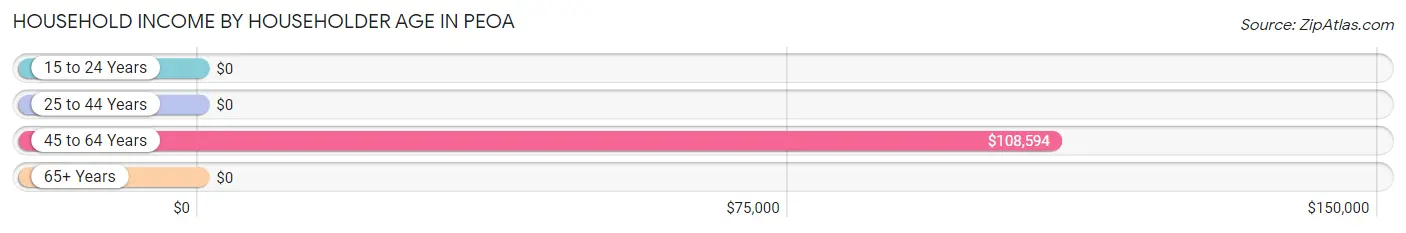
| Income Bracket | # Households | Median Income |
| 15 to 24 Years | 0 (0.0%) | $0 |
| 25 to 44 Years | 21 (39.6%) | $0 |
| 45 to 64 Years | 23 (43.4%) | $108,594 |
| 65+ Years | 9 (17.0%) | $0 |
| Total | 53 (100.0%) | $116,641 |
Poverty in Peoa
Income Below Poverty by Sex and Age in Peoa
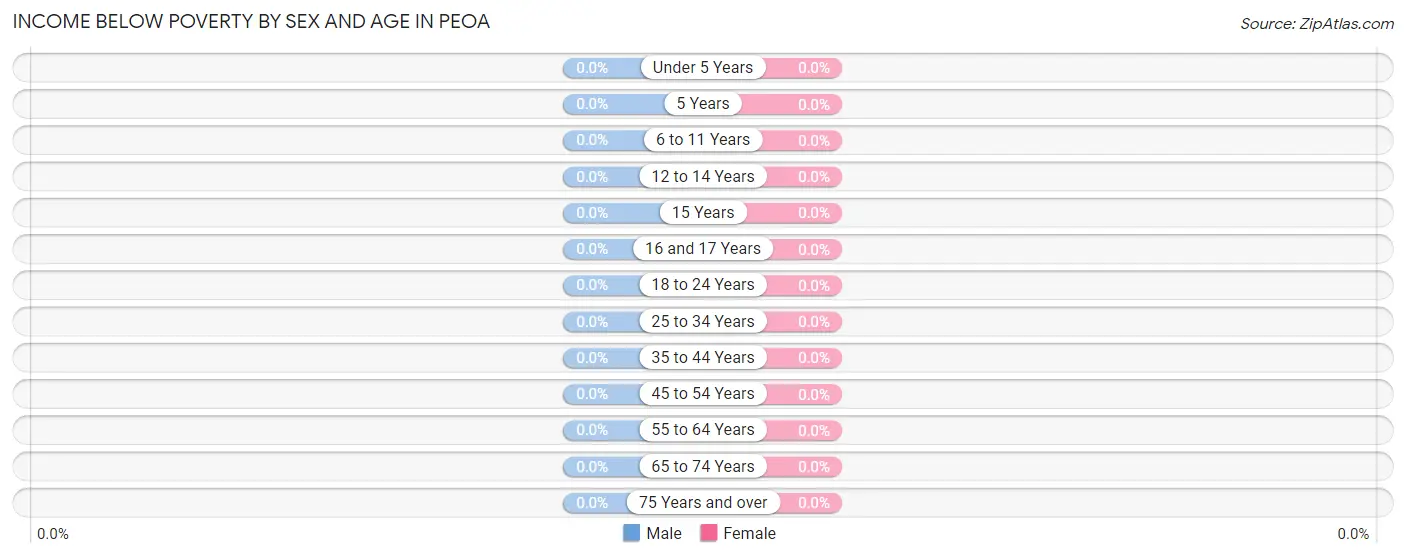
| Age Bracket | Male | Female |
| Under 5 Years | 0 (0.0%) | 0 (0.0%) |
| 5 Years | 0 (0.0%) | 0 (0.0%) |
| 6 to 11 Years | 0 (0.0%) | 0 (0.0%) |
| 12 to 14 Years | 0 (0.0%) | 0 (0.0%) |
| 15 Years | 0 (0.0%) | 0 (0.0%) |
| 16 and 17 Years | 0 (0.0%) | 0 (0.0%) |
| 18 to 24 Years | 0 (0.0%) | 0 (0.0%) |
| 25 to 34 Years | 0 (0.0%) | 0 (0.0%) |
| 35 to 44 Years | 0 (0.0%) | 0 (0.0%) |
| 45 to 54 Years | 0 (0.0%) | 0 (0.0%) |
| 55 to 64 Years | 0 (0.0%) | 0 (0.0%) |
| 65 to 74 Years | 0 (0.0%) | 0 (0.0%) |
| 75 Years and over | 0 (0.0%) | 0 (0.0%) |
| Total | 0 (0.0%) | 0 (0.0%) |
Income Above Poverty by Sex and Age in Peoa
According to the poverty statistics in Peoa, males aged 25 to 34 years and females aged 25 to 34 years are the age groups that are most secure financially, with 100.0% of males and 100.0% of females in these age groups living above the poverty line.
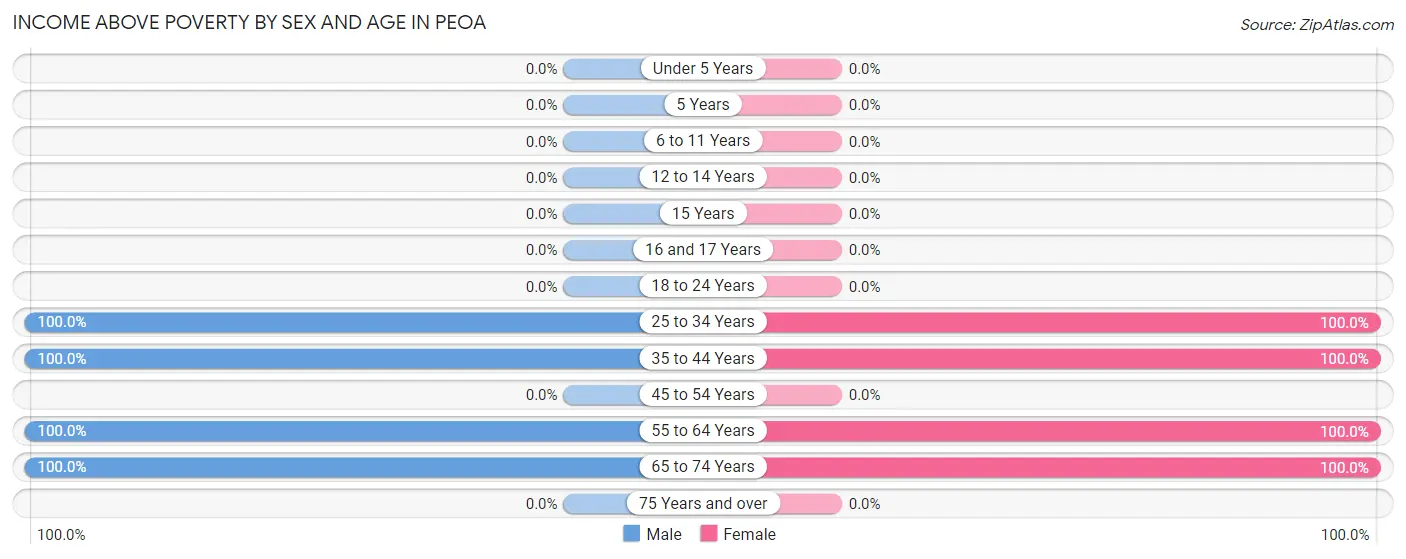
| Age Bracket | Male | Female |
| Under 5 Years | 0 (0.0%) | 0 (0.0%) |
| 5 Years | 0 (0.0%) | 0 (0.0%) |
| 6 to 11 Years | 0 (0.0%) | 0 (0.0%) |
| 12 to 14 Years | 0 (0.0%) | 0 (0.0%) |
| 15 Years | 0 (0.0%) | 0 (0.0%) |
| 16 and 17 Years | 0 (0.0%) | 0 (0.0%) |
| 18 to 24 Years | 0 (0.0%) | 0 (0.0%) |
| 25 to 34 Years | 13 (100.0%) | 16 (100.0%) |
| 35 to 44 Years | 5 (100.0%) | 5 (100.0%) |
| 45 to 54 Years | 0 (0.0%) | 0 (0.0%) |
| 55 to 64 Years | 8 (100.0%) | 15 (100.0%) |
| 65 to 74 Years | 16 (100.0%) | 9 (100.0%) |
| 75 Years and over | 0 (0.0%) | 0 (0.0%) |
| Total | 42 (100.0%) | 45 (100.0%) |
Income Below Poverty Among Married-Couple Families in Peoa
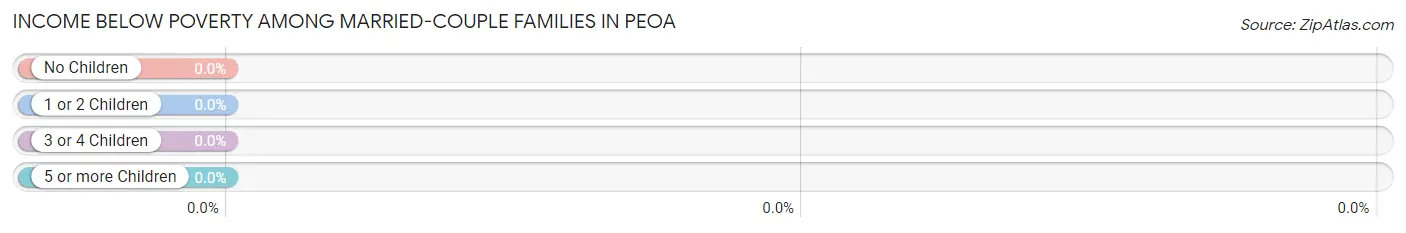
| Children | Above Poverty | Below Poverty |
| No Children | 21 (100.0%) | 0 (0.0%) |
| 1 or 2 Children | 0 (0.0%) | 0 (0.0%) |
| 3 or 4 Children | 0 (0.0%) | 0 (0.0%) |
| 5 or more Children | 0 (0.0%) | 0 (0.0%) |
| Total | 21 (100.0%) | 0 (0.0%) |
Income Below Poverty Among Single-Parent Households in Peoa
| Children | Single Father | Single Mother |
| No Children | 0 (0.0%) | 0 (0.0%) |
| 1 or 2 Children | 0 (0.0%) | 0 (0.0%) |
| 3 or 4 Children | 0 (0.0%) | 0 (0.0%) |
| 5 or more Children | 0 (0.0%) | 0 (0.0%) |
| Total | 0 (0.0%) | 0 (0.0%) |
Income Below Poverty Among Married-Couple vs Single-Parent Households in Peoa
| Children | Married-Couple Families | Single-Parent Households |
| No Children | 0 (0.0%) | 0 (0.0%) |
| 1 or 2 Children | 0 (0.0%) | 0 (0.0%) |
| 3 or 4 Children | 0 (0.0%) | 0 (0.0%) |
| 5 or more Children | 0 (0.0%) | 0 (0.0%) |
| Total | 0 (0.0%) | 0 (0.0%) |
Race in Peoa
The most populous races in Peoa are White / Caucasian (87 | 100.0%), and Hispanic or Latino (5 | 5.8%).
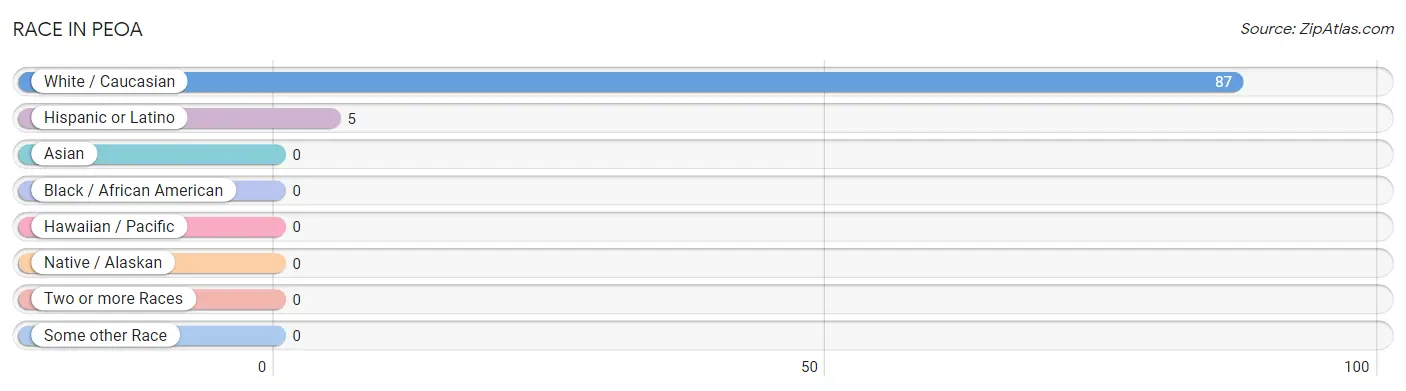
| Race | # Population | % Population |
| Asian | 0 | 0.0% |
| Black / African American | 0 | 0.0% |
| Hawaiian / Pacific | 0 | 0.0% |
| Hispanic or Latino | 5 | 5.8% |
| Native / Alaskan | 0 | 0.0% |
| White / Caucasian | 87 | 100.0% |
| Two or more Races | 0 | 0.0% |
| Some other Race | 0 | 0.0% |
| Total | 87 | 100.0% |
Ancestry in Peoa
The most populous ancestries reported in Peoa are English (38 | 43.7%), German (16 | 18.4%), Italian (13 | 14.9%), Irish (9 | 10.3%), and Welsh (8 | 9.2%), together accounting for 96.6% of all Peoa residents.
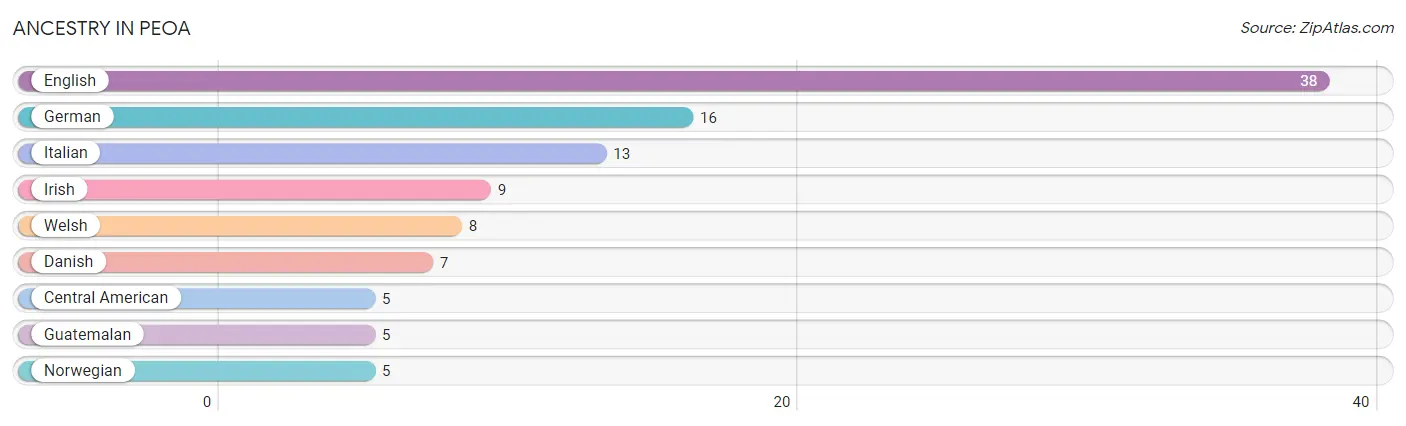
| Ancestry | # Population | % Population |
| Central American | 5 | 5.8% |
| Danish | 7 | 8.1% |
| English | 38 | 43.7% |
| German | 16 | 18.4% |
| Guatemalan | 5 | 5.8% |
| Irish | 9 | 10.3% |
| Italian | 13 | 14.9% |
| Norwegian | 5 | 5.8% |
| Welsh | 8 | 9.2% | View All 9 Rows |
Immigrants in Peoa

| Immigration Origin | # Population | % Population | View All 0 Rows |
Sex and Age in Peoa
Sex and Age in Peoa
The most populous age groups in Peoa are 30 to 34 Years (13 | 30.9%) for men and 30 to 34 Years (16 | 35.6%) for women.
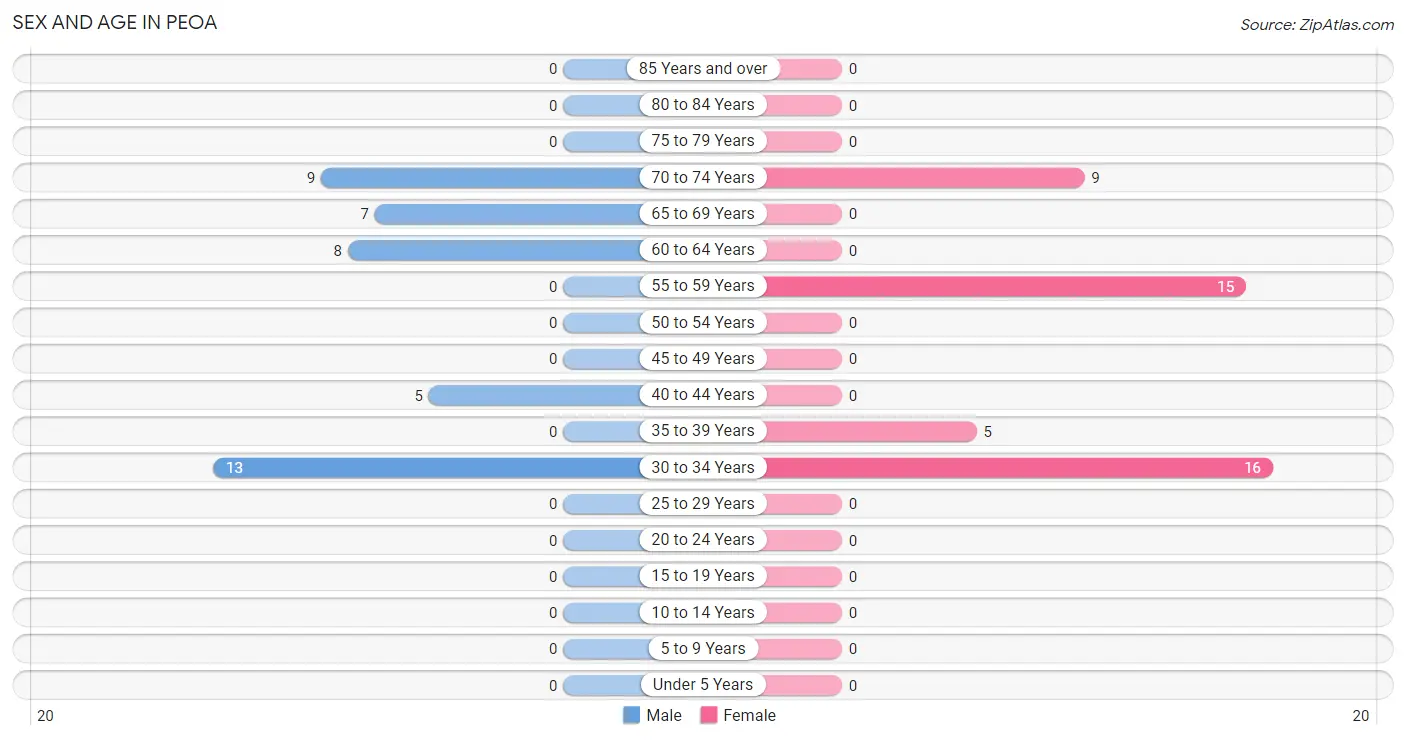
| Age Bracket | Male | Female |
| Under 5 Years | 0 (0.0%) | 0 (0.0%) |
| 5 to 9 Years | 0 (0.0%) | 0 (0.0%) |
| 10 to 14 Years | 0 (0.0%) | 0 (0.0%) |
| 15 to 19 Years | 0 (0.0%) | 0 (0.0%) |
| 20 to 24 Years | 0 (0.0%) | 0 (0.0%) |
| 25 to 29 Years | 0 (0.0%) | 0 (0.0%) |
| 30 to 34 Years | 13 (30.9%) | 16 (35.6%) |
| 35 to 39 Years | 0 (0.0%) | 5 (11.1%) |
| 40 to 44 Years | 5 (11.9%) | 0 (0.0%) |
| 45 to 49 Years | 0 (0.0%) | 0 (0.0%) |
| 50 to 54 Years | 0 (0.0%) | 0 (0.0%) |
| 55 to 59 Years | 0 (0.0%) | 15 (33.3%) |
| 60 to 64 Years | 8 (19.1%) | 0 (0.0%) |
| 65 to 69 Years | 7 (16.7%) | 0 (0.0%) |
| 70 to 74 Years | 9 (21.4%) | 9 (20.0%) |
| 75 to 79 Years | 0 (0.0%) | 0 (0.0%) |
| 80 to 84 Years | 0 (0.0%) | 0 (0.0%) |
| 85 Years and over | 0 (0.0%) | 0 (0.0%) |
| Total | 42 (100.0%) | 45 (100.0%) |
Families and Households in Peoa
Median Family Size in Peoa
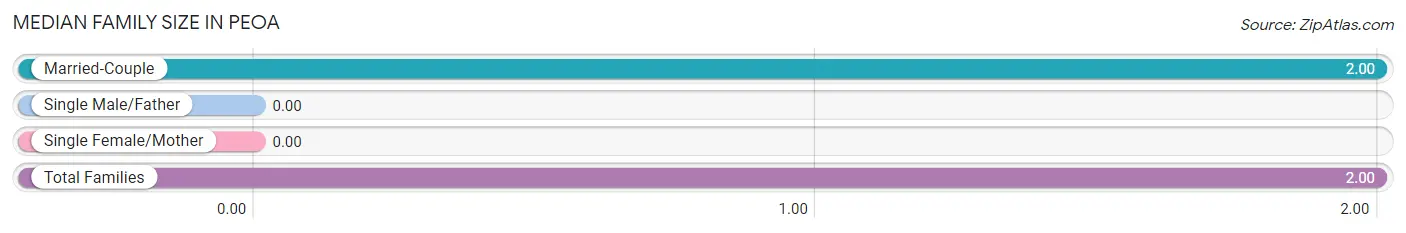
| Family Type | # Families | Family Size |
| Married-Couple | 21 (100.0%) | 2.00 |
| Single Male/Father | 0 (0.0%) | - |
| Single Female/Mother | 0 (0.0%) | - |
| Total Families | 21 (100.0%) | 2.00 |
Median Household Size in Peoa
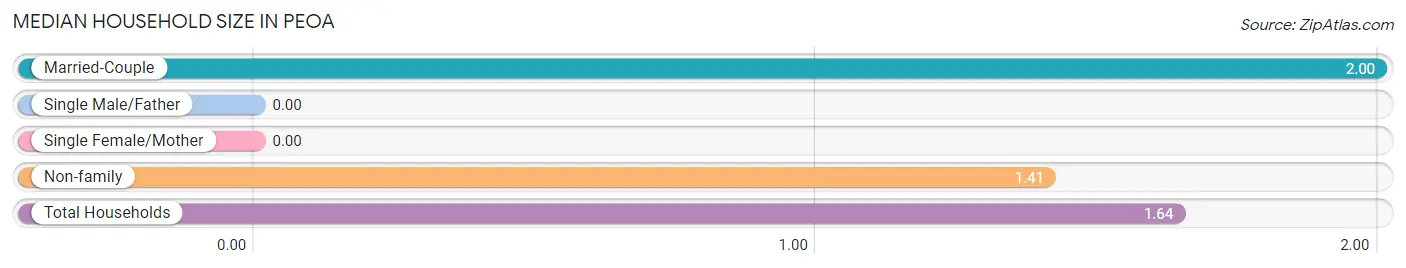
| Household Type | # Households | Household Size |
| Married-Couple | 21 (39.6%) | 2.00 |
| Single Male/Father | 0 (0.0%) | - |
| Single Female/Mother | 0 (0.0%) | - |
| Non-family | 32 (60.4%) | 1.41 |
| Total Households | 53 (100.0%) | 1.64 |
Household Size by Marriage Status in Peoa
Out of a total of 53 households in Peoa, 21 (39.6%) are family households, while 32 (60.4%) are nonfamily households. The most numerous type of family households are 2-person households, comprising 21, and the most common type of nonfamily households are 1-person households, comprising 16.
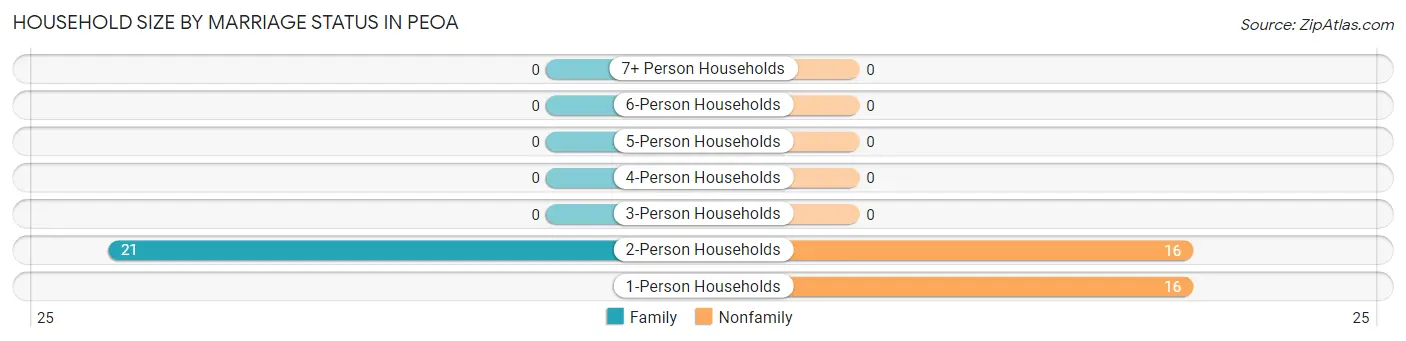
| Household Size | Family Households | Nonfamily Households |
| 1-Person Households | - | 16 (30.2%) |
| 2-Person Households | 21 (39.6%) | 16 (30.2%) |
| 3-Person Households | 0 (0.0%) | 0 (0.0%) |
| 4-Person Households | 0 (0.0%) | 0 (0.0%) |
| 5-Person Households | 0 (0.0%) | 0 (0.0%) |
| 6-Person Households | 0 (0.0%) | 0 (0.0%) |
| 7+ Person Households | 0 (0.0%) | 0 (0.0%) |
| Total | 21 (39.6%) | 32 (60.4%) |
Female Fertility in Peoa
Fertility by Age in Peoa
| Age Bracket | Women with Births | Births / 1,000 Women |
| 15 to 19 years | 0 (0.0%) | 0.0 |
| 20 to 34 years | 0 (0.0%) | 0.0 |
| 35 to 50 years | 0 (0.0%) | 0.0 |
| Total | 0 (0.0%) | 0.0 |
Fertility by Age by Marriage Status in Peoa
| Age Bracket | Married | Unmarried |
| 15 to 19 years | 0 (0.0%) | 0 (0.0%) |
| 20 to 34 years | 0 (0.0%) | 0 (0.0%) |
| 35 to 50 years | 0 (0.0%) | 0 (0.0%) |
| Total | 0 (0.0%) | 0 (0.0%) |
Fertility by Education in Peoa
| Educational Attainment | Women with Births | Births / 1,000 Women |
| Less than High School | 0 (0.0%) | 0.0 |
| High School Diploma | 0 (0.0%) | 0.0 |
| College or Associate's Degree | 0 (0.0%) | 0.0 |
| Bachelor's Degree | 0 (0.0%) | 0.0 |
| Graduate Degree | 0 (0.0%) | 0.0 |
| Total | 0 (0.0%) | 0.0 |
Fertility by Education by Marriage Status in Peoa
| Educational Attainment | Married | Unmarried |
| Less than High School | 0 (0.0%) | 0 (0.0%) |
| High School Diploma | 0 (0.0%) | 0 (0.0%) |
| College or Associate's Degree | 0 (0.0%) | 0 (0.0%) |
| Bachelor's Degree | 0 (0.0%) | 0 (0.0%) |
| Graduate Degree | 0 (0.0%) | 0 (0.0%) |
| Total | 0 (0.0%) | 0 (0.0%) |
Employment Characteristics in Peoa
Employment by Class of Employer in Peoa
Among the 70 employed individuals in Peoa, private company employees (41 | 58.6%), not-for-profit organizations (13 | 18.6%), and local government employees (9 | 12.9%) make up the most common classes of employment.
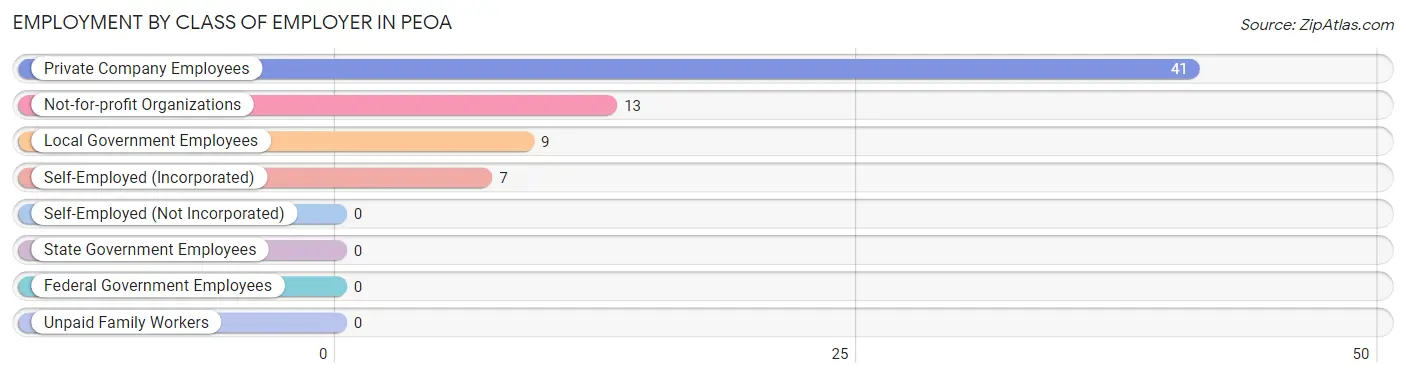
| Employer Class | # Employees | % Employees |
| Private Company Employees | 41 | 58.6% |
| Self-Employed (Incorporated) | 7 | 10.0% |
| Self-Employed (Not Incorporated) | 0 | 0.0% |
| Not-for-profit Organizations | 13 | 18.6% |
| Local Government Employees | 9 | 12.9% |
| State Government Employees | 0 | 0.0% |
| Federal Government Employees | 0 | 0.0% |
| Unpaid Family Workers | 0 | 0.0% |
| Total | 70 | 100.0% |
Employment Status by Age in Peoa
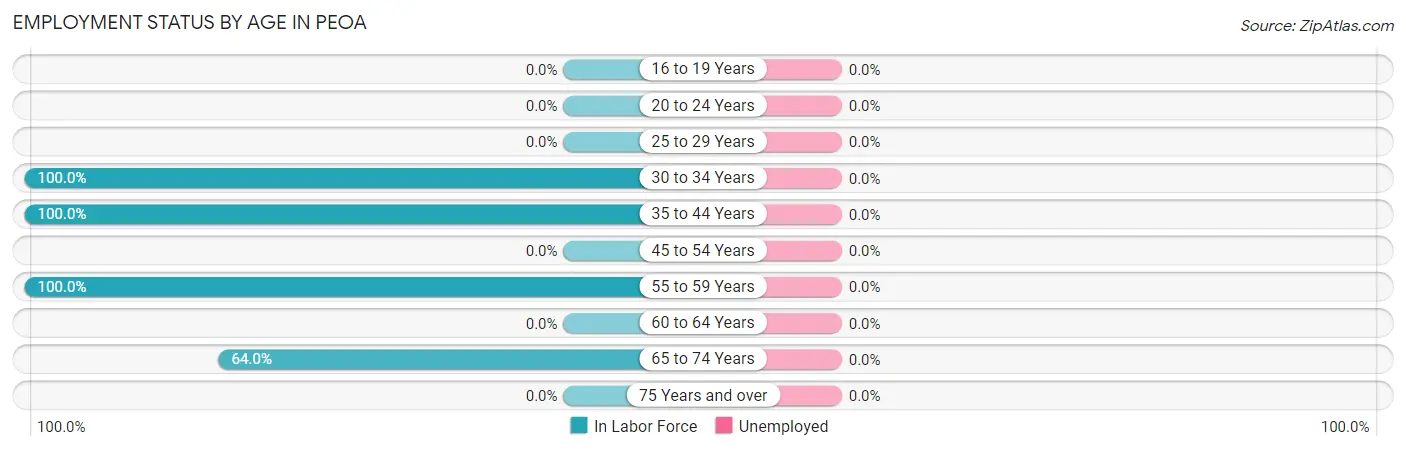
| Age Bracket | In Labor Force | Unemployed |
| 16 to 19 Years | 0 (0.0%) | 0 (0.0%) |
| 20 to 24 Years | 0 (0.0%) | 0 (0.0%) |
| 25 to 29 Years | 0 (0.0%) | 0 (0.0%) |
| 30 to 34 Years | 29 (100.0%) | 0 (0.0%) |
| 35 to 44 Years | 10 (100.0%) | 0 (0.0%) |
| 45 to 54 Years | 0 (0.0%) | 0 (0.0%) |
| 55 to 59 Years | 15 (100.0%) | 0 (0.0%) |
| 60 to 64 Years | 0 (0.0%) | 0 (0.0%) |
| 65 to 74 Years | 16 (64.0%) | 0 (0.0%) |
| 75 Years and over | 0 (0.0%) | 0 (0.0%) |
| Total | 70 (80.5%) | 0 (0.0%) |
Employment Status by Educational Attainment in Peoa
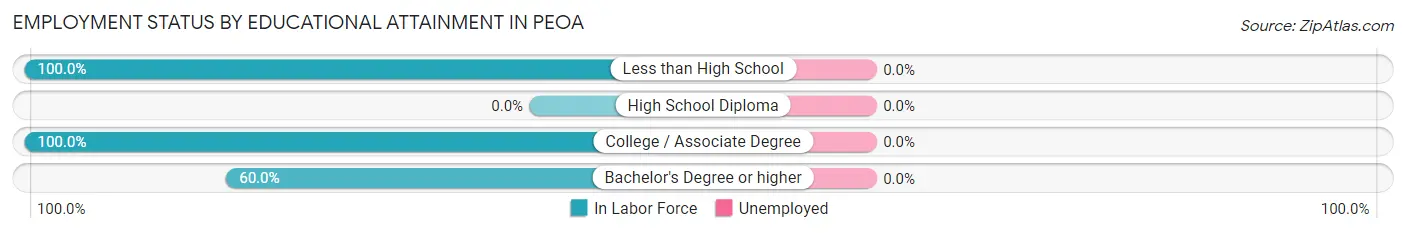
| Educational Attainment | In Labor Force | Unemployed |
| Less than High School | 16 (100.0%) | 0 (0.0%) |
| High School Diploma | 0 (0.0%) | 0 (0.0%) |
| College / Associate Degree | 26 (100.0%) | 0 (0.0%) |
| Bachelor's Degree or higher | 12 (60.0%) | 0 (0.0%) |
| Total | 54 (87.1%) | 0 (0.0%) |
Employment Occupations by Sex in Peoa
Management, Business, Science and Arts Occupations
The most common Management, Business, Science and Arts occupations in Peoa are Health Diagnosing & Treating (13 | 18.6%), Health Technologists (13 | 18.6%), Business & Financial (9 | 12.9%), Management (7 | 10.0%), and Community & Social Service (7 | 10.0%).
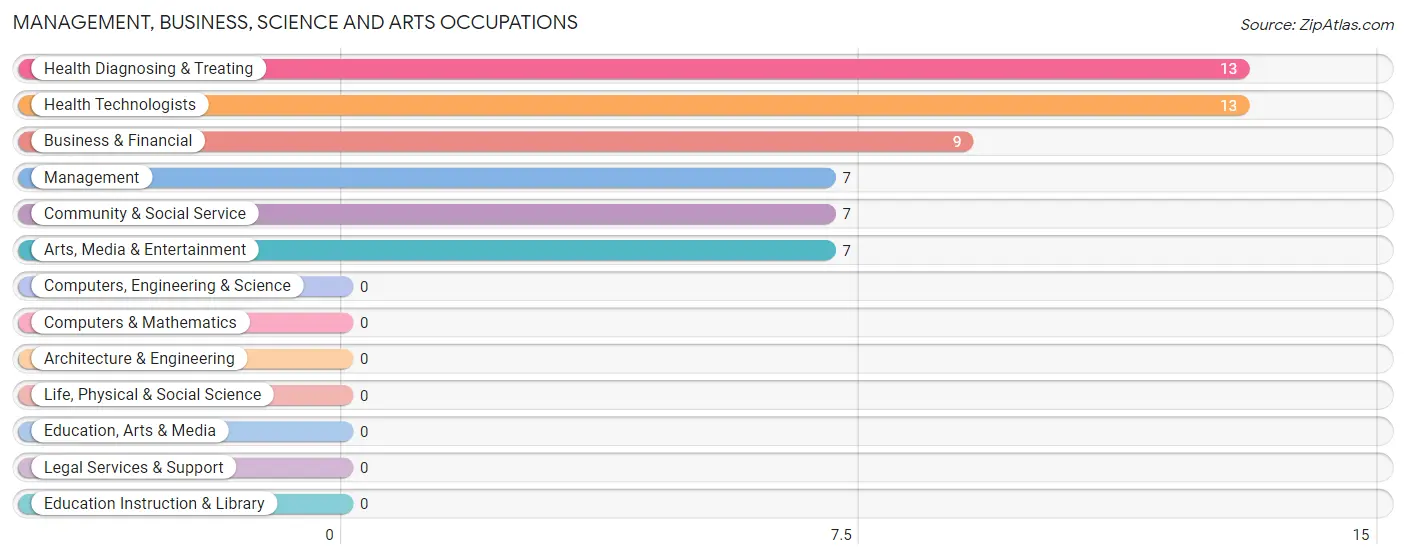
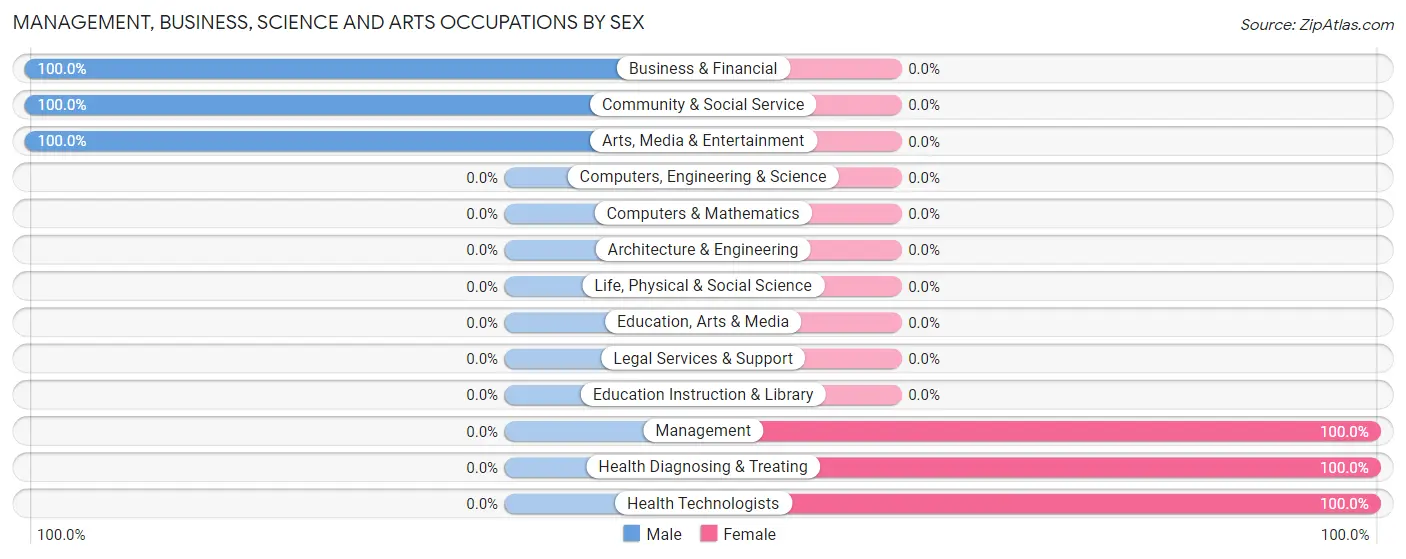
Management, Business, Science and Arts Occupations by Sex
Within the Management, Business, Science and Arts occupations in Peoa, the most male-oriented occupations are Business & Financial (100.0%), Community & Social Service (100.0%), and Arts, Media & Entertainment (100.0%), while the most female-oriented occupations are Management (100.0%), Health Diagnosing & Treating (100.0%), and Health Technologists (100.0%).
| Occupation | Male | Female |
| Management | 0 (0.0%) | 7 (100.0%) |
| Business & Financial | 9 (100.0%) | 0 (0.0%) |
| Computers, Engineering & Science | 0 (0.0%) | 0 (0.0%) |
| Computers & Mathematics | 0 (0.0%) | 0 (0.0%) |
| Architecture & Engineering | 0 (0.0%) | 0 (0.0%) |
| Life, Physical & Social Science | 0 (0.0%) | 0 (0.0%) |
| Community & Social Service | 7 (100.0%) | 0 (0.0%) |
| Education, Arts & Media | 0 (0.0%) | 0 (0.0%) |
| Legal Services & Support | 0 (0.0%) | 0 (0.0%) |
| Education Instruction & Library | 0 (0.0%) | 0 (0.0%) |
| Arts, Media & Entertainment | 7 (100.0%) | 0 (0.0%) |
| Health Diagnosing & Treating | 0 (0.0%) | 13 (100.0%) |
| Health Technologists | 0 (0.0%) | 13 (100.0%) |
| Total (Category) | 16 (44.4%) | 20 (55.6%) |
| Total (Overall) | 34 (48.6%) | 36 (51.4%) |
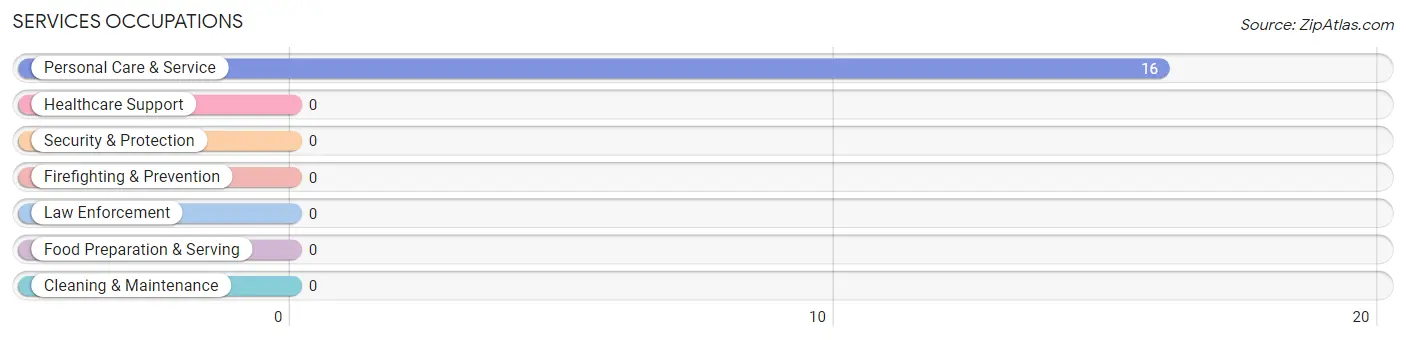
Services Occupations
The most common Services occupations in Peoa are , and Personal Care & Service (16 | 22.9%).
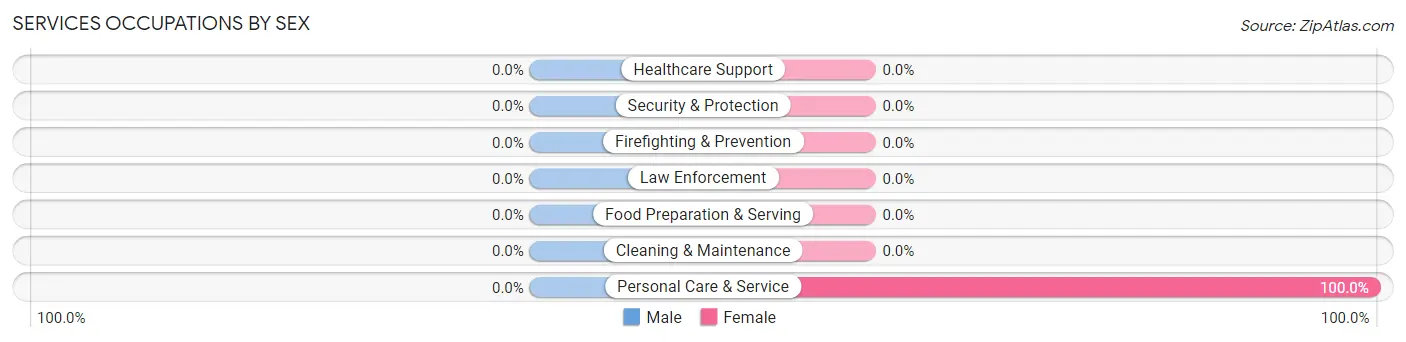
Services Occupations by Sex
| Occupation | Male | Female |
| Healthcare Support | 0 (0.0%) | 0 (0.0%) |
| Security & Protection | 0 (0.0%) | 0 (0.0%) |
| Firefighting & Prevention | 0 (0.0%) | 0 (0.0%) |
| Law Enforcement | 0 (0.0%) | 0 (0.0%) |
| Food Preparation & Serving | 0 (0.0%) | 0 (0.0%) |
| Cleaning & Maintenance | 0 (0.0%) | 0 (0.0%) |
| Personal Care & Service | 0 (0.0%) | 16 (100.0%) |
| Total (Category) | 0 (0.0%) | 16 (100.0%) |
| Total (Overall) | 34 (48.6%) | 36 (51.4%) |
Sales and Office Occupations

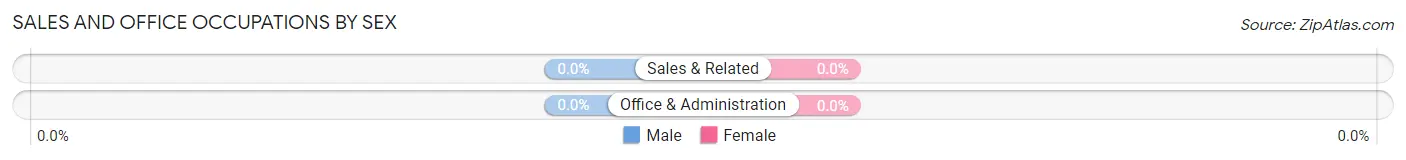
Sales and Office Occupations by Sex
| Occupation | Male | Female |
| Sales & Related | 0 (0.0%) | 0 (0.0%) |
| Office & Administration | 0 (0.0%) | 0 (0.0%) |
| Total (Category) | 0 (0.0%) | 0 (0.0%) |
| Total (Overall) | 34 (48.6%) | 36 (51.4%) |
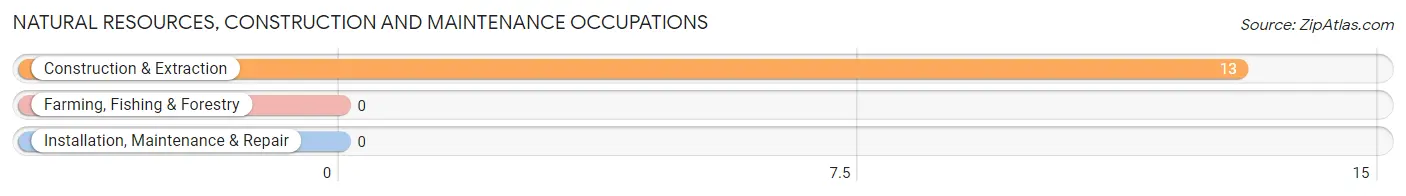
Natural Resources, Construction and Maintenance Occupations
The most common Natural Resources, Construction and Maintenance occupations in Peoa are , and Construction & Extraction (13 | 18.6%).
Natural Resources, Construction and Maintenance Occupations by Sex
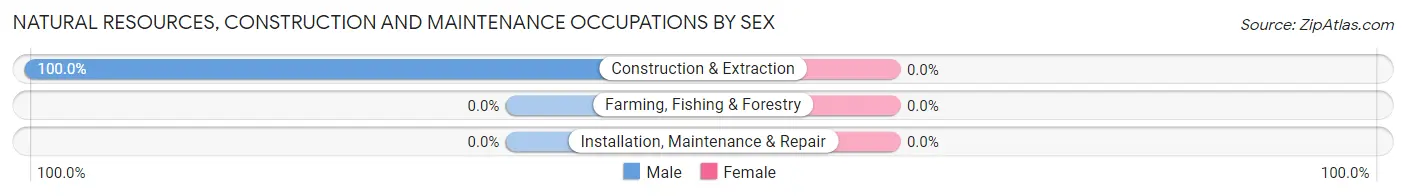
| Occupation | Male | Female |
| Farming, Fishing & Forestry | 0 (0.0%) | 0 (0.0%) |
| Construction & Extraction | 13 (100.0%) | 0 (0.0%) |
| Installation, Maintenance & Repair | 0 (0.0%) | 0 (0.0%) |
| Total (Category) | 13 (100.0%) | 0 (0.0%) |
| Total (Overall) | 34 (48.6%) | 36 (51.4%) |
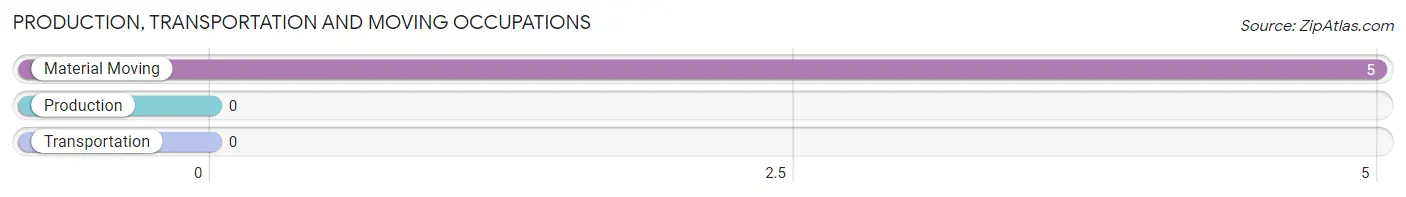
Production, Transportation and Moving Occupations
The most common Production, Transportation and Moving occupations in Peoa are , and Material Moving (5 | 7.1%).
Production, Transportation and Moving Occupations by Sex
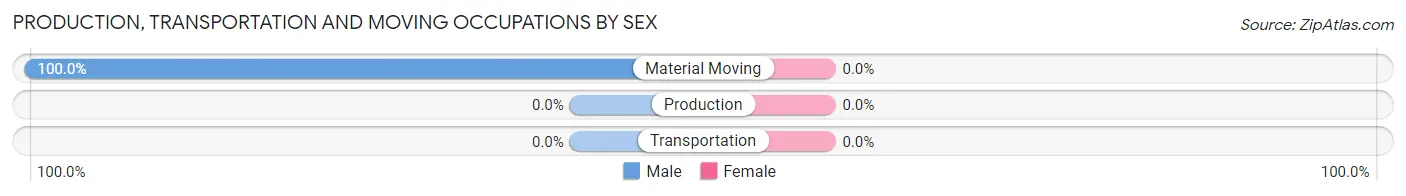
| Occupation | Male | Female |
| Production | 0 (0.0%) | 0 (0.0%) |
| Transportation | 0 (0.0%) | 0 (0.0%) |
| Material Moving | 5 (100.0%) | 0 (0.0%) |
| Total (Category) | 5 (100.0%) | 0 (0.0%) |
| Total (Overall) | 34 (48.6%) | 36 (51.4%) |
Employment Industries by Sex in Peoa
Employment Industries in Peoa
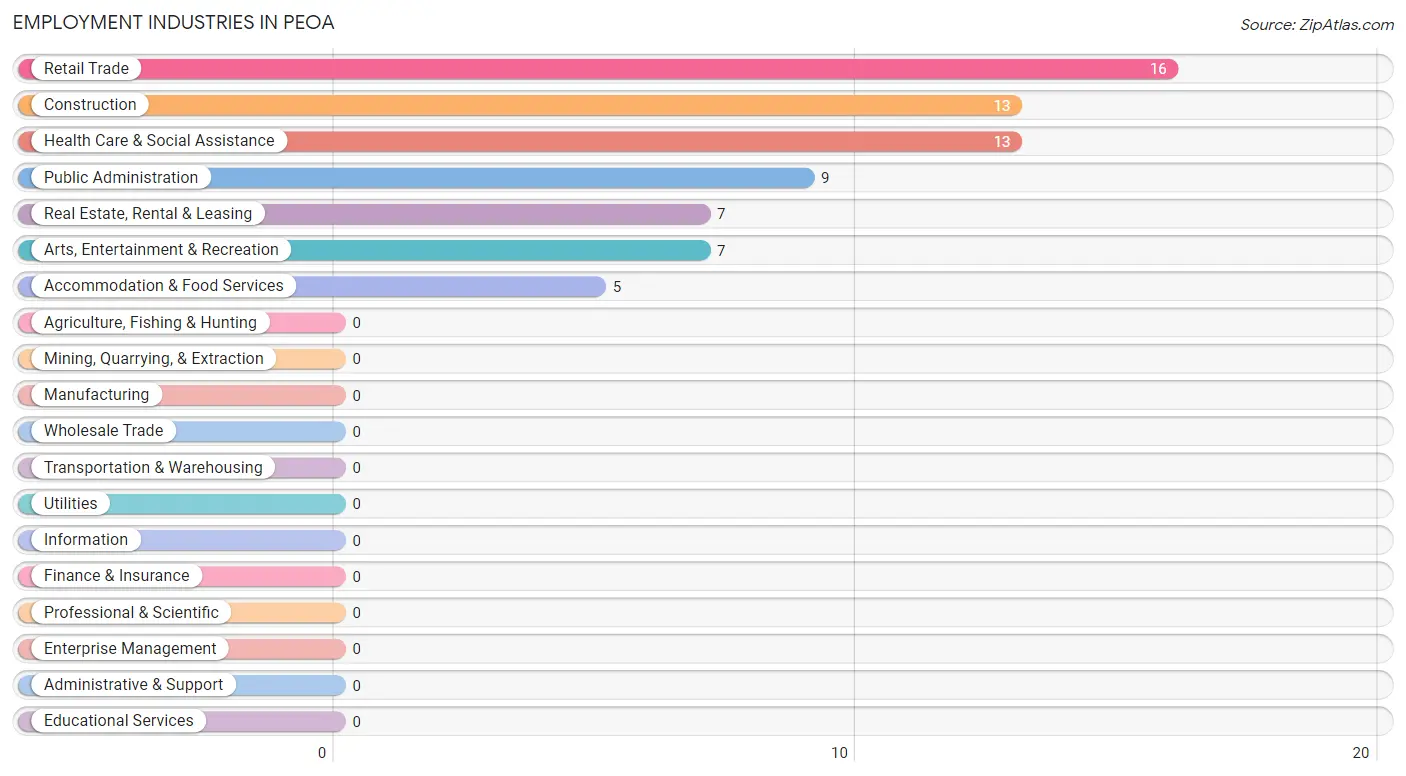
The major employment industries in Peoa include Retail Trade (16 | 22.9%), Construction (13 | 18.6%), Health Care & Social Assistance (13 | 18.6%), Public Administration (9 | 12.9%), and Real Estate, Rental & Leasing (7 | 10.0%).
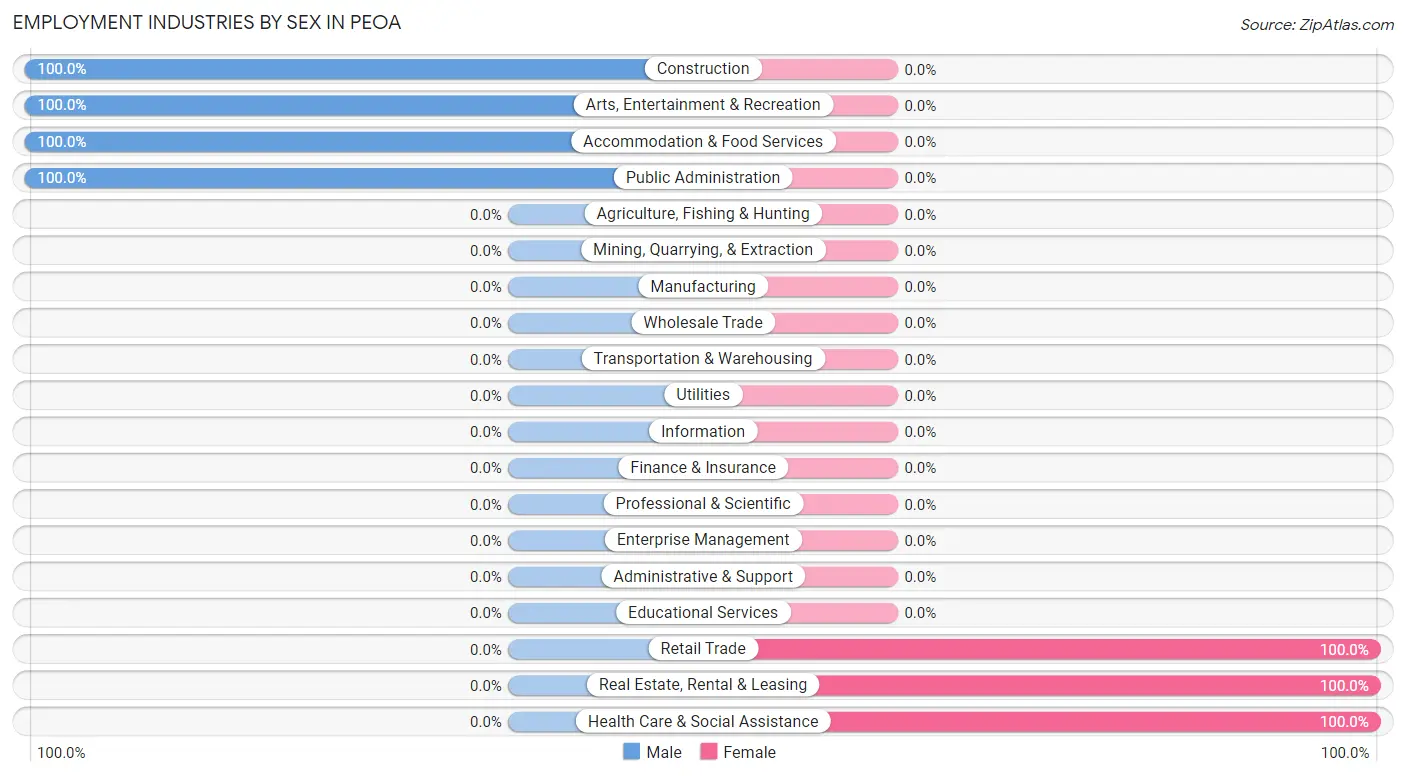
Employment Industries by Sex in Peoa
The Peoa industries that see more men than women are Construction (100.0%), Arts, Entertainment & Recreation (100.0%), and Accommodation & Food Services (100.0%), whereas the industries that tend to have a higher number of women are Retail Trade (100.0%), Real Estate, Rental & Leasing (100.0%), and Health Care & Social Assistance (100.0%).
| Industry | Male | Female |
| Agriculture, Fishing & Hunting | 0 (0.0%) | 0 (0.0%) |
| Mining, Quarrying, & Extraction | 0 (0.0%) | 0 (0.0%) |
| Construction | 13 (100.0%) | 0 (0.0%) |
| Manufacturing | 0 (0.0%) | 0 (0.0%) |
| Wholesale Trade | 0 (0.0%) | 0 (0.0%) |
| Retail Trade | 0 (0.0%) | 16 (100.0%) |
| Transportation & Warehousing | 0 (0.0%) | 0 (0.0%) |
| Utilities | 0 (0.0%) | 0 (0.0%) |
| Information | 0 (0.0%) | 0 (0.0%) |
| Finance & Insurance | 0 (0.0%) | 0 (0.0%) |
| Real Estate, Rental & Leasing | 0 (0.0%) | 7 (100.0%) |
| Professional & Scientific | 0 (0.0%) | 0 (0.0%) |
| Enterprise Management | 0 (0.0%) | 0 (0.0%) |
| Administrative & Support | 0 (0.0%) | 0 (0.0%) |
| Educational Services | 0 (0.0%) | 0 (0.0%) |
| Health Care & Social Assistance | 0 (0.0%) | 13 (100.0%) |
| Arts, Entertainment & Recreation | 7 (100.0%) | 0 (0.0%) |
| Accommodation & Food Services | 5 (100.0%) | 0 (0.0%) |
| Public Administration | 9 (100.0%) | 0 (0.0%) |
| Total | 34 (48.6%) | 36 (51.4%) |
Education in Peoa
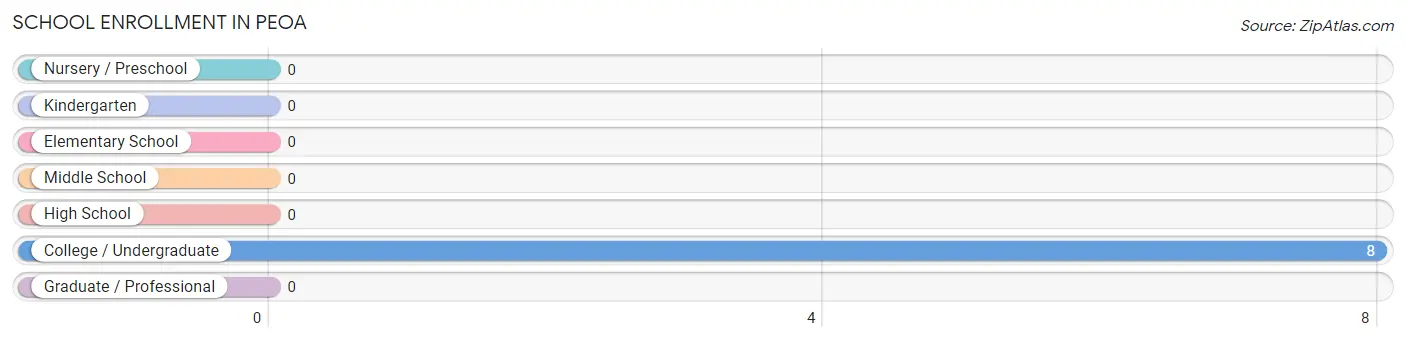
School Enrollment in Peoa
| School Level | # Students | % Students |
| Nursery / Preschool | 0 | 0.0% |
| Kindergarten | 0 | 0.0% |
| Elementary School | 0 | 0.0% |
| Middle School | 0 | 0.0% |
| High School | 0 | 0.0% |
| College / Undergraduate | 8 | 100.0% |
| Graduate / Professional | 0 | 0.0% |
| Total | 8 | 100.0% |
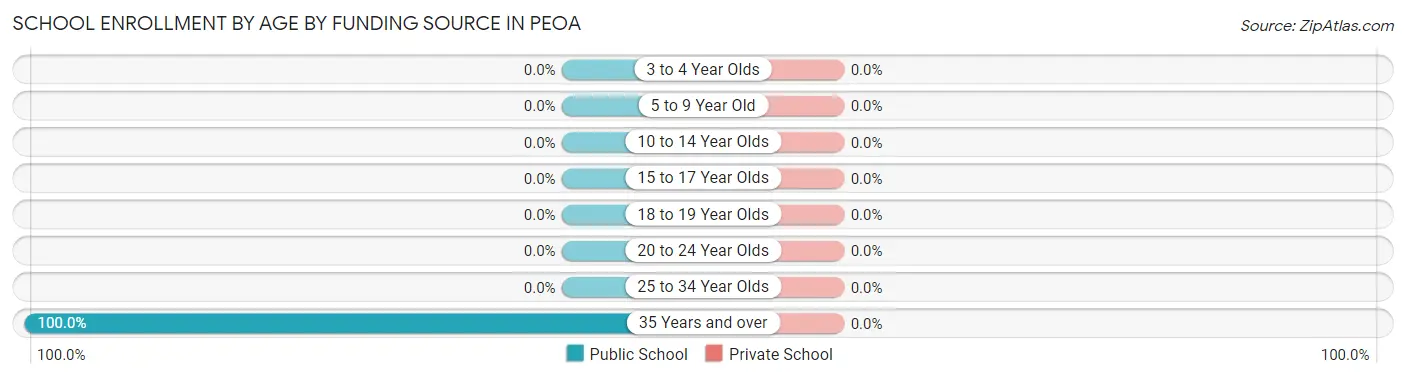
School Enrollment by Age by Funding Source in Peoa
| Age Bracket | Public School | Private School |
| 3 to 4 Year Olds | 0 (0.0%) | 0 (0.0%) |
| 5 to 9 Year Old | 0 (0.0%) | 0 (0.0%) |
| 10 to 14 Year Olds | 0 (0.0%) | 0 (0.0%) |
| 15 to 17 Year Olds | 0 (0.0%) | 0 (0.0%) |
| 18 to 19 Year Olds | 0 (0.0%) | 0 (0.0%) |
| 20 to 24 Year Olds | 0 (0.0%) | 0 (0.0%) |
| 25 to 34 Year Olds | 0 (0.0%) | 0 (0.0%) |
| 35 Years and over | 8 (100.0%) | 0 (0.0%) |
| Total | 8 (100.0%) | 0 (0.0%) |
Educational Attainment by Field of Study in Peoa
Engineering (8 | 40.0%), arts & humanities (7 | 35.0%), and science & technology (5 | 25.0%) are the most common fields of study among 20 individuals in Peoa who have obtained a bachelor's degree or higher.
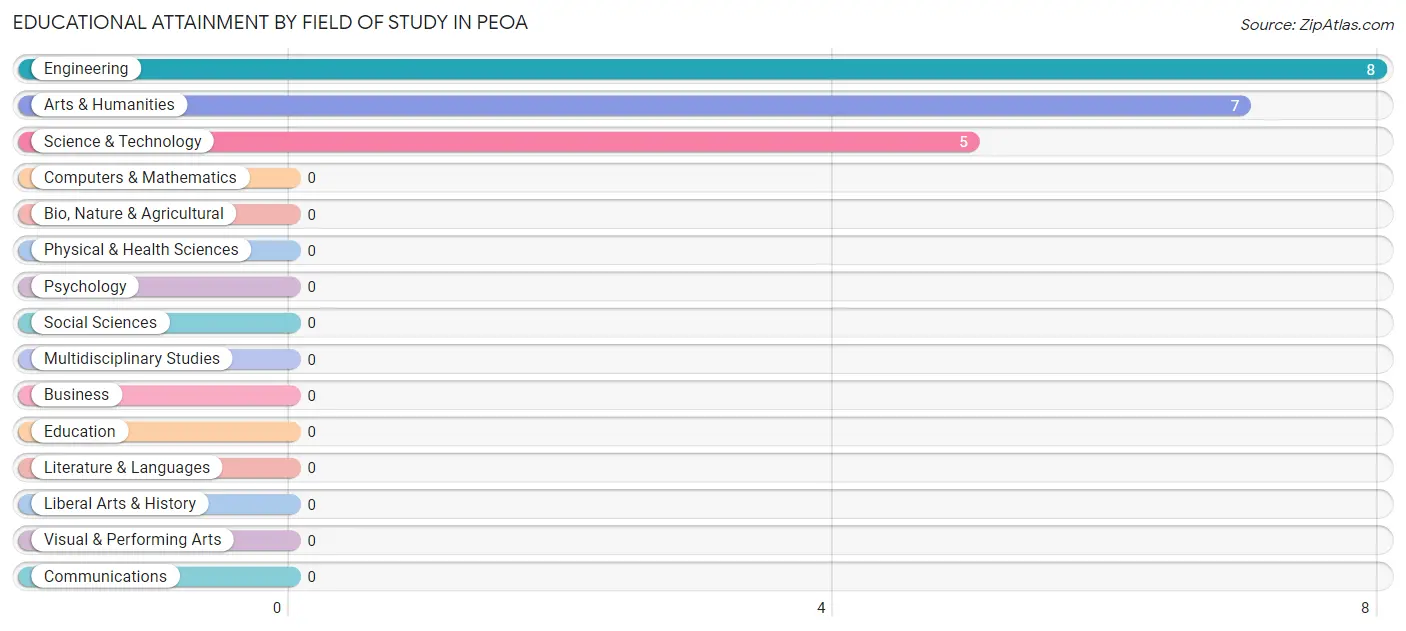
| Field of Study | # Graduates | % Graduates |
| Computers & Mathematics | 0 | 0.0% |
| Bio, Nature & Agricultural | 0 | 0.0% |
| Physical & Health Sciences | 0 | 0.0% |
| Psychology | 0 | 0.0% |
| Social Sciences | 0 | 0.0% |
| Engineering | 8 | 40.0% |
| Multidisciplinary Studies | 0 | 0.0% |
| Science & Technology | 5 | 25.0% |
| Business | 0 | 0.0% |
| Education | 0 | 0.0% |
| Literature & Languages | 0 | 0.0% |
| Liberal Arts & History | 0 | 0.0% |
| Visual & Performing Arts | 0 | 0.0% |
| Communications | 0 | 0.0% |
| Arts & Humanities | 7 | 35.0% |
| Total | 20 | 100.0% |
Transportation & Commute in Peoa
Vehicle Availability by Sex in Peoa
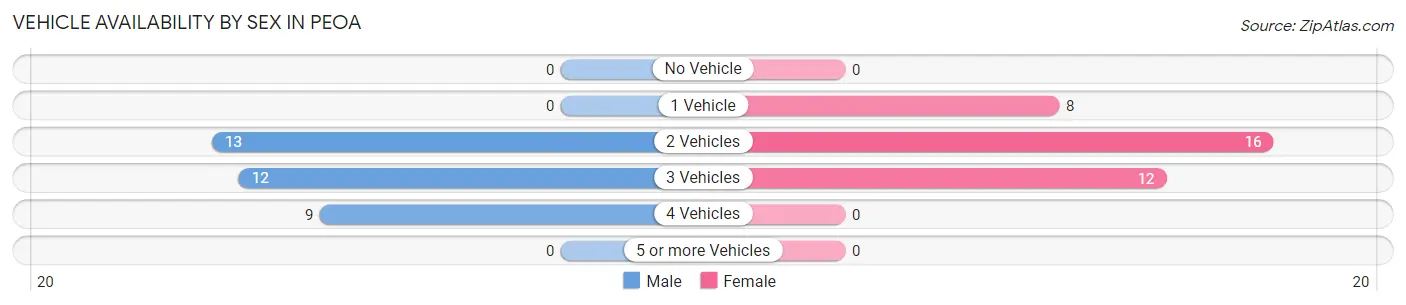
The most prevalent vehicle ownership categories in Peoa are males with 2 vehicles (13, accounting for 38.2%) and females with 2 vehicles (16, making up 36.1%).
| Vehicles Available | Male | Female |
| No Vehicle | 0 (0.0%) | 0 (0.0%) |
| 1 Vehicle | 0 (0.0%) | 8 (22.2%) |
| 2 Vehicles | 13 (38.2%) | 16 (44.4%) |
| 3 Vehicles | 12 (35.3%) | 12 (33.3%) |
| 4 Vehicles | 9 (26.5%) | 0 (0.0%) |
| 5 or more Vehicles | 0 (0.0%) | 0 (0.0%) |
| Total | 34 (100.0%) | 36 (100.0%) |
Commute Time in Peoa
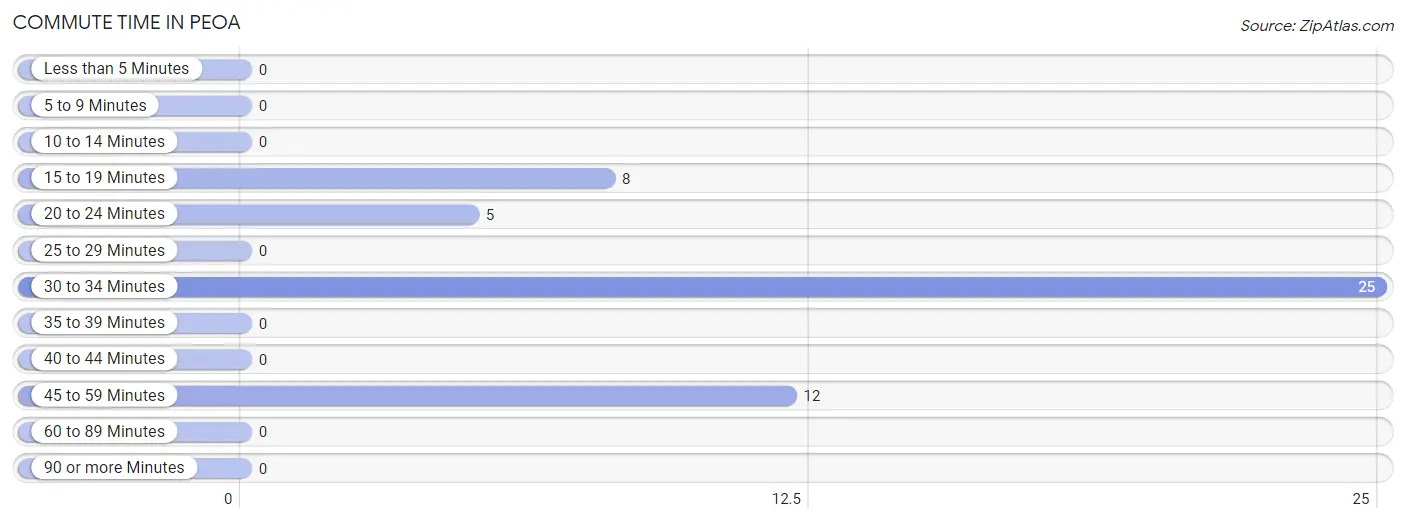
The most frequently occuring commute durations in Peoa are 30 to 34 minutes (25 commuters, 50.0%), 45 to 59 minutes (12 commuters, 24.0%), and 15 to 19 minutes (8 commuters, 16.0%).
| Commute Time | # Commuters | % Commuters |
| Less than 5 Minutes | 0 | 0.0% |
| 5 to 9 Minutes | 0 | 0.0% |
| 10 to 14 Minutes | 0 | 0.0% |
| 15 to 19 Minutes | 8 | 16.0% |
| 20 to 24 Minutes | 5 | 10.0% |
| 25 to 29 Minutes | 0 | 0.0% |
| 30 to 34 Minutes | 25 | 50.0% |
| 35 to 39 Minutes | 0 | 0.0% |
| 40 to 44 Minutes | 0 | 0.0% |
| 45 to 59 Minutes | 12 | 24.0% |
| 60 to 89 Minutes | 0 | 0.0% |
| 90 or more Minutes | 0 | 0.0% |
Commute Time by Sex in Peoa
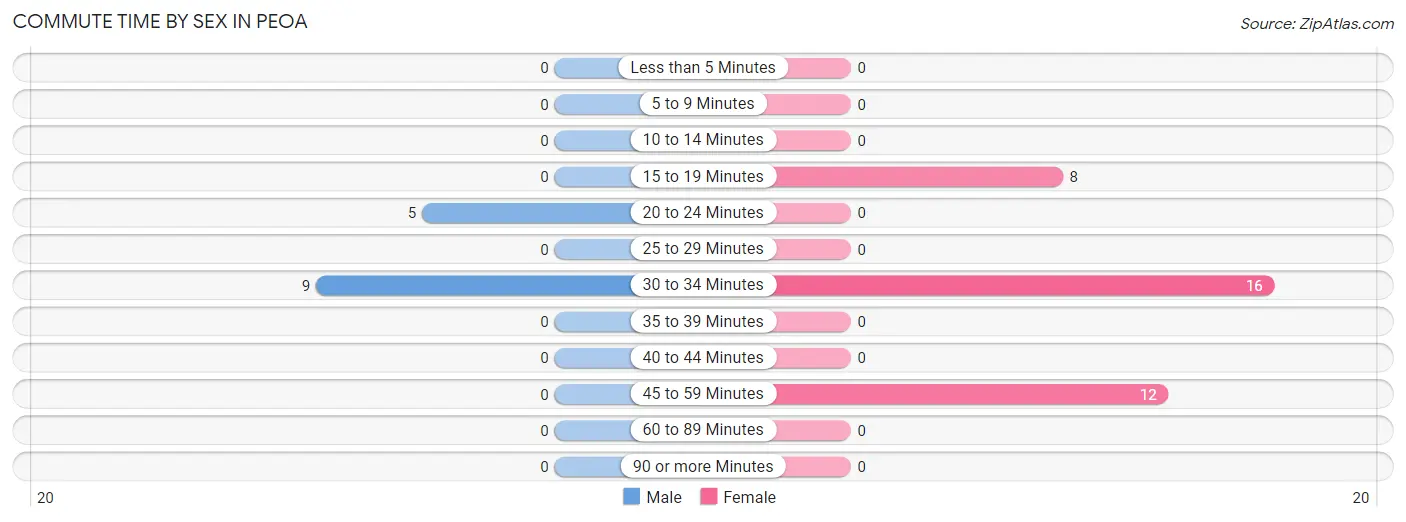
The most common commute times in Peoa are 30 to 34 minutes (9 commuters, 64.3%) for males and 30 to 34 minutes (16 commuters, 44.4%) for females.
| Commute Time | Male | Female |
| Less than 5 Minutes | 0 (0.0%) | 0 (0.0%) |
| 5 to 9 Minutes | 0 (0.0%) | 0 (0.0%) |
| 10 to 14 Minutes | 0 (0.0%) | 0 (0.0%) |
| 15 to 19 Minutes | 0 (0.0%) | 8 (22.2%) |
| 20 to 24 Minutes | 5 (35.7%) | 0 (0.0%) |
| 25 to 29 Minutes | 0 (0.0%) | 0 (0.0%) |
| 30 to 34 Minutes | 9 (64.3%) | 16 (44.4%) |
| 35 to 39 Minutes | 0 (0.0%) | 0 (0.0%) |
| 40 to 44 Minutes | 0 (0.0%) | 0 (0.0%) |
| 45 to 59 Minutes | 0 (0.0%) | 12 (33.3%) |
| 60 to 89 Minutes | 0 (0.0%) | 0 (0.0%) |
| 90 or more Minutes | 0 (0.0%) | 0 (0.0%) |
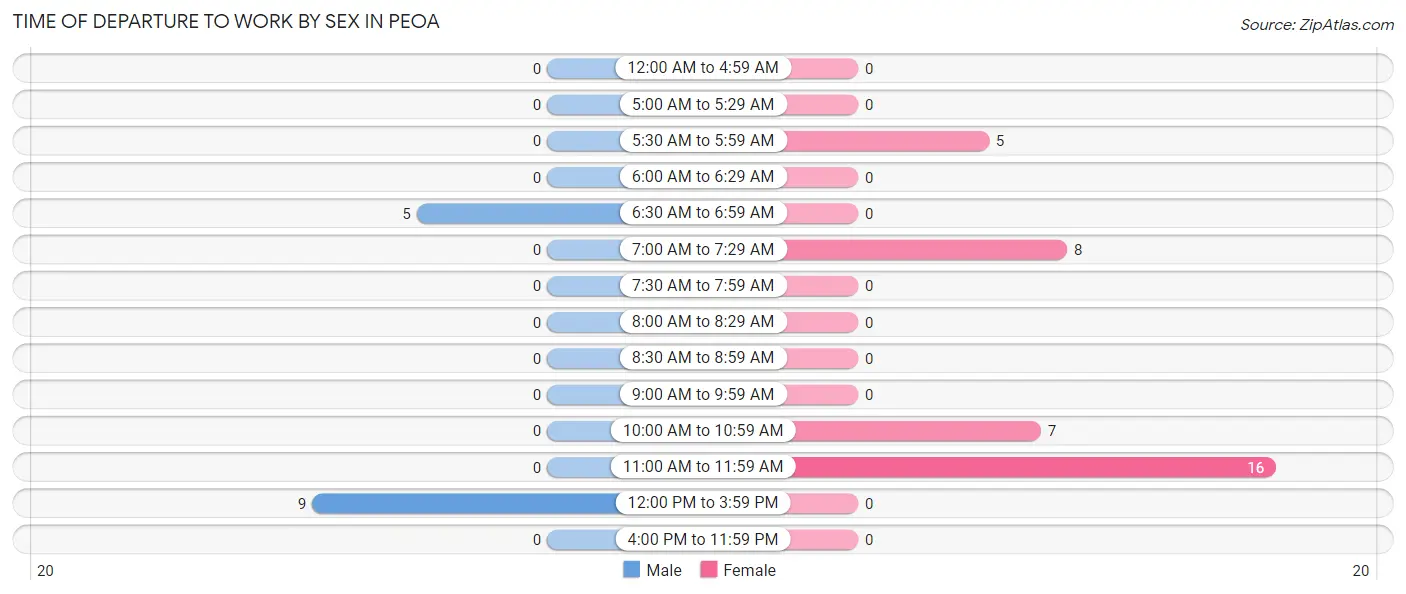
Time of Departure to Work by Sex in Peoa
The most frequent times of departure to work in Peoa are 12:00 PM to 3:59 PM (9, 64.3%) for males and 11:00 AM to 11:59 AM (16, 44.4%) for females.
| Time of Departure | Male | Female |
| 12:00 AM to 4:59 AM | 0 (0.0%) | 0 (0.0%) |
| 5:00 AM to 5:29 AM | 0 (0.0%) | 0 (0.0%) |
| 5:30 AM to 5:59 AM | 0 (0.0%) | 5 (13.9%) |
| 6:00 AM to 6:29 AM | 0 (0.0%) | 0 (0.0%) |
| 6:30 AM to 6:59 AM | 5 (35.7%) | 0 (0.0%) |
| 7:00 AM to 7:29 AM | 0 (0.0%) | 8 (22.2%) |
| 7:30 AM to 7:59 AM | 0 (0.0%) | 0 (0.0%) |
| 8:00 AM to 8:29 AM | 0 (0.0%) | 0 (0.0%) |
| 8:30 AM to 8:59 AM | 0 (0.0%) | 0 (0.0%) |
| 9:00 AM to 9:59 AM | 0 (0.0%) | 0 (0.0%) |
| 10:00 AM to 10:59 AM | 0 (0.0%) | 7 (19.4%) |
| 11:00 AM to 11:59 AM | 0 (0.0%) | 16 (44.4%) |
| 12:00 PM to 3:59 PM | 9 (64.3%) | 0 (0.0%) |
| 4:00 PM to 11:59 PM | 0 (0.0%) | 0 (0.0%) |
| Total | 14 (100.0%) | 36 (100.0%) |
Housing Occupancy in Peoa
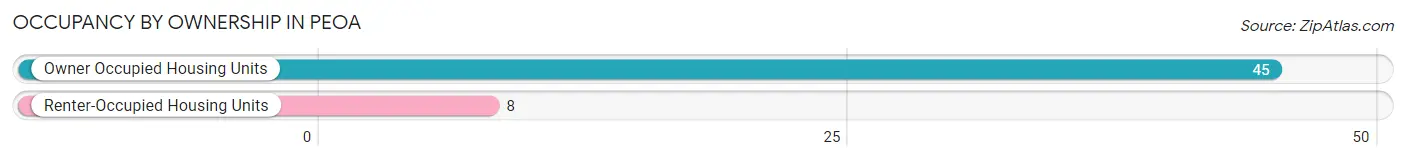
Occupancy by Ownership in Peoa
Of the total 53 dwellings in Peoa, owner-occupied units account for 45 (84.9%), while renter-occupied units make up 8 (15.1%).
| Occupancy | # Housing Units | % Housing Units |
| Owner Occupied Housing Units | 45 | 84.9% |
| Renter-Occupied Housing Units | 8 | 15.1% |
| Total Occupied Housing Units | 53 | 100.0% |
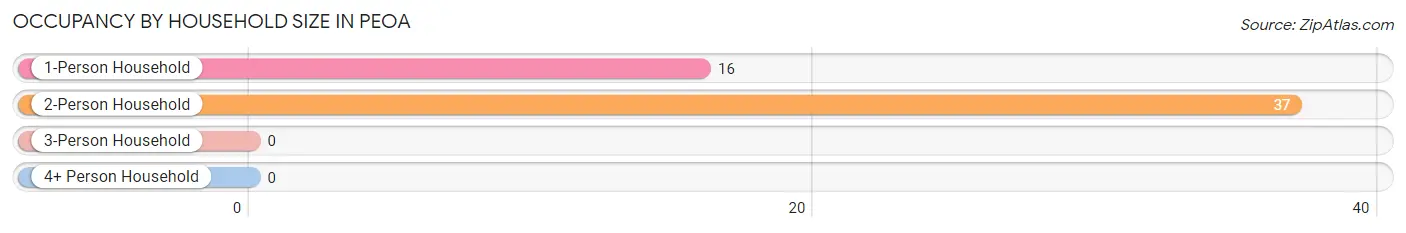
Occupancy by Household Size in Peoa
| Household Size | # Housing Units | % Housing Units |
| 1-Person Household | 16 | 30.2% |
| 2-Person Household | 37 | 69.8% |
| 3-Person Household | 0 | 0.0% |
| 4+ Person Household | 0 | 0.0% |
| Total Housing Units | 53 | 100.0% |
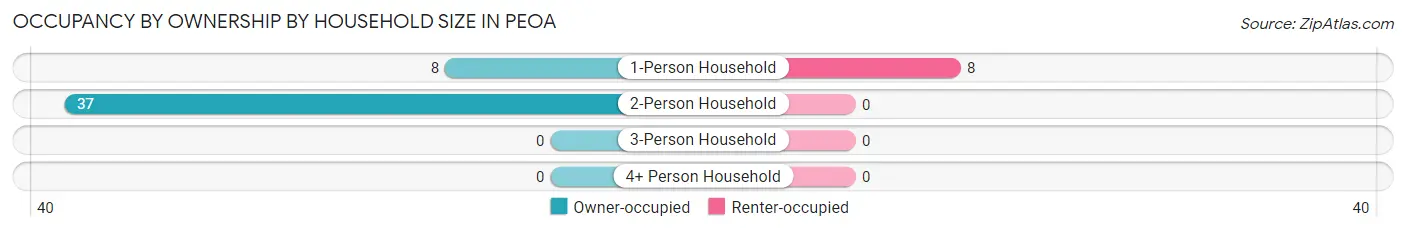
Occupancy by Ownership by Household Size in Peoa
| Household Size | Owner-occupied | Renter-occupied |
| 1-Person Household | 8 (50.0%) | 8 (50.0%) |
| 2-Person Household | 37 (100.0%) | 0 (0.0%) |
| 3-Person Household | 0 (0.0%) | 0 (0.0%) |
| 4+ Person Household | 0 (0.0%) | 0 (0.0%) |
| Total Housing Units | 45 (84.9%) | 8 (15.1%) |
Occupancy by Educational Attainment in Peoa
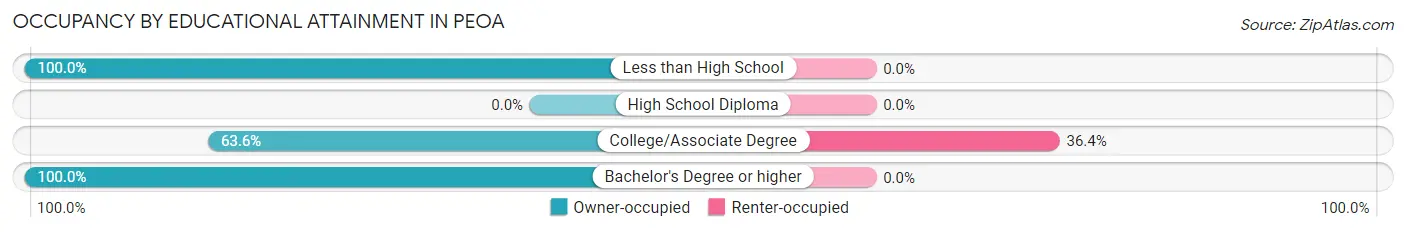
| Household Size | Owner-occupied | Renter-occupied |
| Less than High School | 16 (100.0%) | 0 (0.0%) |
| High School Diploma | 0 (0.0%) | 0 (0.0%) |
| College/Associate Degree | 14 (63.6%) | 8 (36.4%) |
| Bachelor's Degree or higher | 15 (100.0%) | 0 (0.0%) |
Occupancy by Age of Householder in Peoa
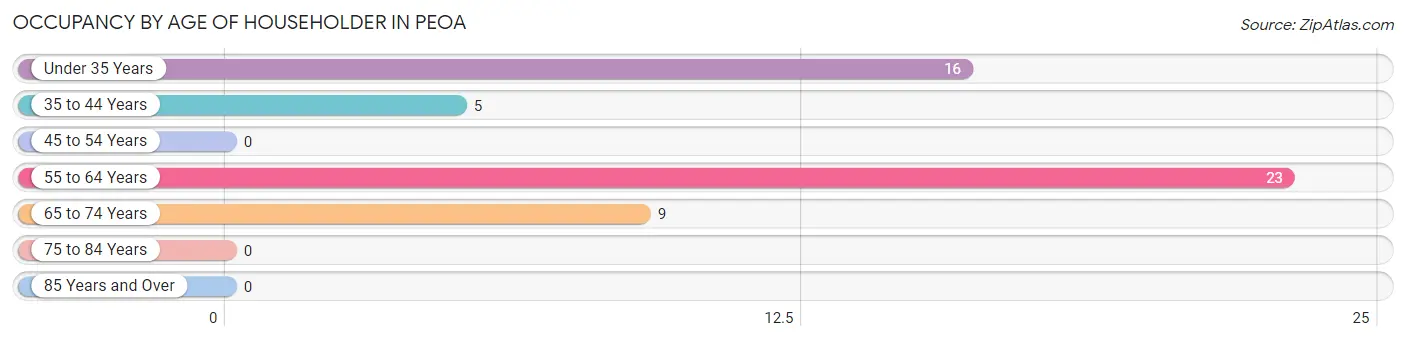
| Age Bracket | # Households | % Households |
| Under 35 Years | 16 | 30.2% |
| 35 to 44 Years | 5 | 9.4% |
| 45 to 54 Years | 0 | 0.0% |
| 55 to 64 Years | 23 | 43.4% |
| 65 to 74 Years | 9 | 17.0% |
| 75 to 84 Years | 0 | 0.0% |
| 85 Years and Over | 0 | 0.0% |
| Total | 53 | 100.0% |
Housing Finances in Peoa
Median Income by Occupancy in Peoa
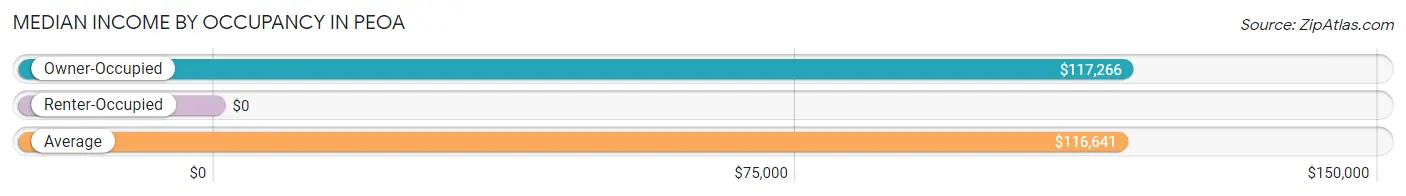
| Occupancy Type | # Households | Median Income |
| Owner-Occupied | 45 (84.9%) | $117,266 |
| Renter-Occupied | 8 (15.1%) | $0 |
| Average | 53 (100.0%) | $116,641 |
Occupancy by Householder Income Bracket in Peoa
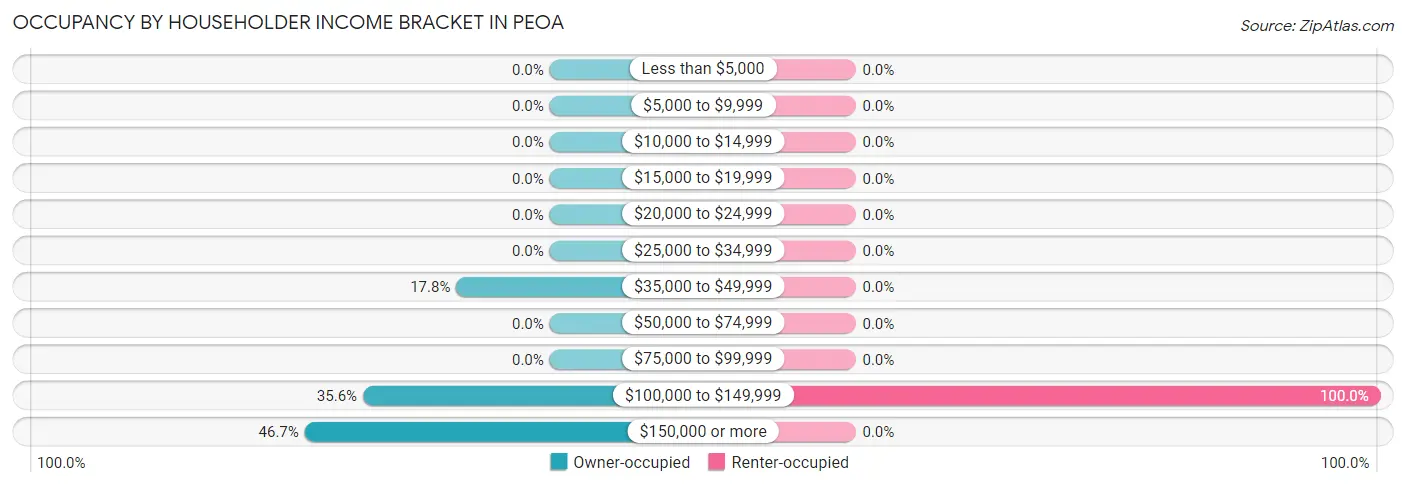
| Income Bracket | Owner-occupied | Renter-occupied |
| Less than $5,000 | 0 (0.0%) | 0 (0.0%) |
| $5,000 to $9,999 | 0 (0.0%) | 0 (0.0%) |
| $10,000 to $14,999 | 0 (0.0%) | 0 (0.0%) |
| $15,000 to $19,999 | 0 (0.0%) | 0 (0.0%) |
| $20,000 to $24,999 | 0 (0.0%) | 0 (0.0%) |
| $25,000 to $34,999 | 0 (0.0%) | 0 (0.0%) |
| $35,000 to $49,999 | 8 (17.8%) | 0 (0.0%) |
| $50,000 to $74,999 | 0 (0.0%) | 0 (0.0%) |
| $75,000 to $99,999 | 0 (0.0%) | 0 (0.0%) |
| $100,000 to $149,999 | 16 (35.6%) | 8 (100.0%) |
| $150,000 or more | 21 (46.7%) | 0 (0.0%) |
| Total | 45 (100.0%) | 8 (100.0%) |
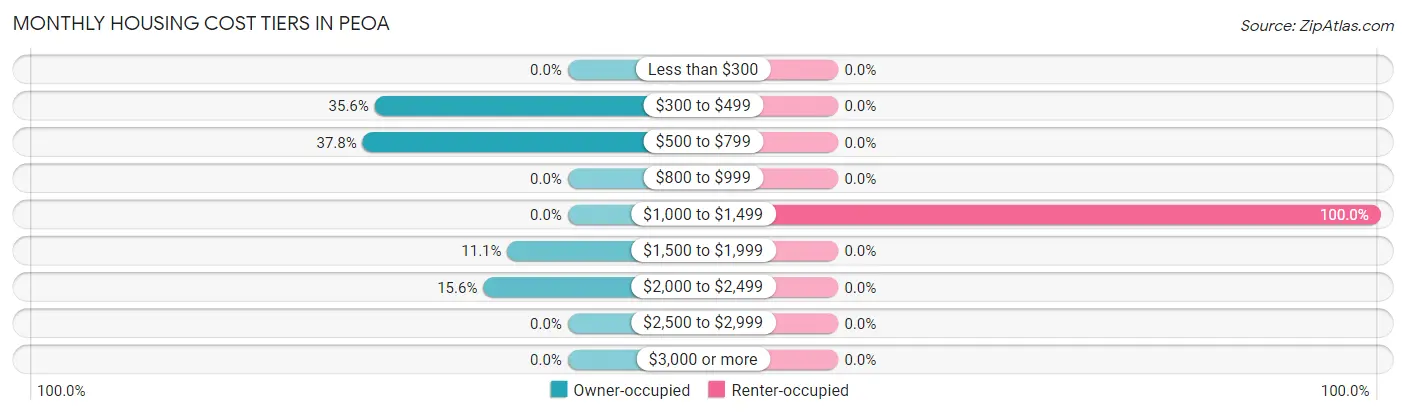
Monthly Housing Cost Tiers in Peoa
| Monthly Cost | Owner-occupied | Renter-occupied |
| Less than $300 | 0 (0.0%) | 0 (0.0%) |
| $300 to $499 | 16 (35.6%) | 0 (0.0%) |
| $500 to $799 | 17 (37.8%) | 0 (0.0%) |
| $800 to $999 | 0 (0.0%) | 0 (0.0%) |
| $1,000 to $1,499 | 0 (0.0%) | 8 (100.0%) |
| $1,500 to $1,999 | 5 (11.1%) | 0 (0.0%) |
| $2,000 to $2,499 | 7 (15.6%) | 0 (0.0%) |
| $2,500 to $2,999 | 0 (0.0%) | 0 (0.0%) |
| $3,000 or more | 0 (0.0%) | 0 (0.0%) |
| Total | 45 (100.0%) | 8 (100.0%) |
Physical Housing Characteristics in Peoa
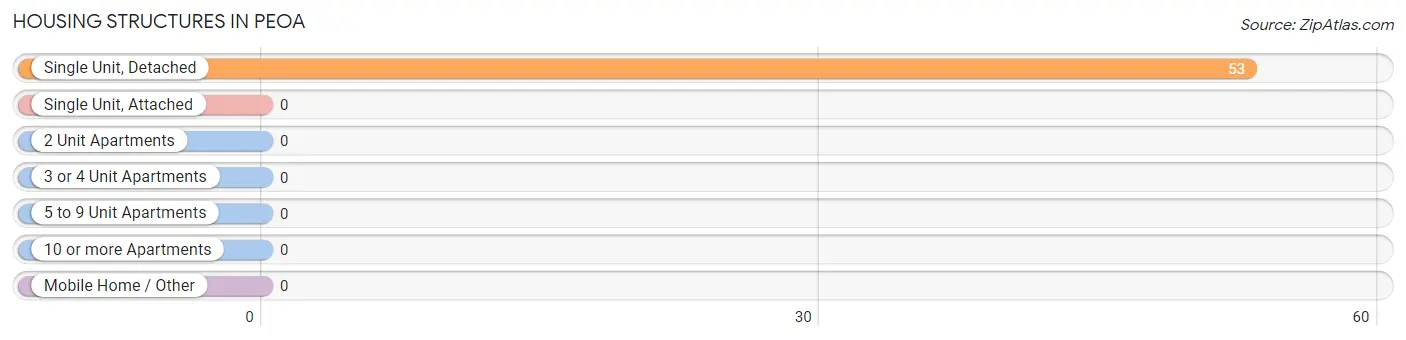
Housing Structures in Peoa
| Structure Type | # Housing Units | % Housing Units |
| Single Unit, Detached | 53 | 100.0% |
| Single Unit, Attached | 0 | 0.0% |
| 2 Unit Apartments | 0 | 0.0% |
| 3 or 4 Unit Apartments | 0 | 0.0% |
| 5 to 9 Unit Apartments | 0 | 0.0% |
| 10 or more Apartments | 0 | 0.0% |
| Mobile Home / Other | 0 | 0.0% |
| Total | 53 | 100.0% |
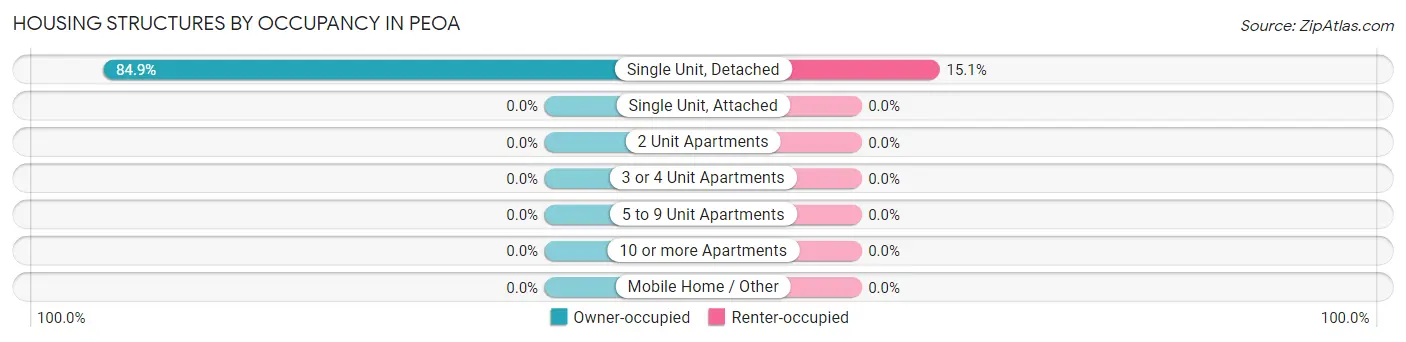
Housing Structures by Occupancy in Peoa
| Structure Type | Owner-occupied | Renter-occupied |
| Single Unit, Detached | 45 (84.9%) | 8 (15.1%) |
| Single Unit, Attached | 0 (0.0%) | 0 (0.0%) |
| 2 Unit Apartments | 0 (0.0%) | 0 (0.0%) |
| 3 or 4 Unit Apartments | 0 (0.0%) | 0 (0.0%) |
| 5 to 9 Unit Apartments | 0 (0.0%) | 0 (0.0%) |
| 10 or more Apartments | 0 (0.0%) | 0 (0.0%) |
| Mobile Home / Other | 0 (0.0%) | 0 (0.0%) |
| Total | 45 (84.9%) | 8 (15.1%) |
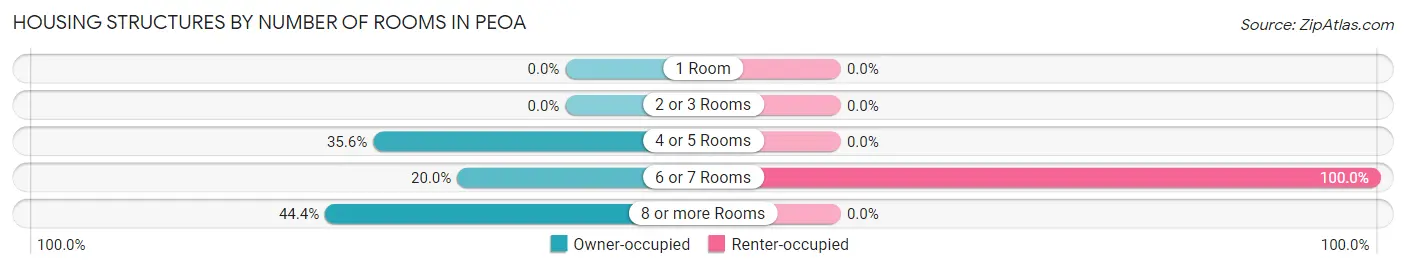
Housing Structures by Number of Rooms in Peoa
| Number of Rooms | Owner-occupied | Renter-occupied |
| 1 Room | 0 (0.0%) | 0 (0.0%) |
| 2 or 3 Rooms | 0 (0.0%) | 0 (0.0%) |
| 4 or 5 Rooms | 16 (35.6%) | 0 (0.0%) |
| 6 or 7 Rooms | 9 (20.0%) | 8 (100.0%) |
| 8 or more Rooms | 20 (44.4%) | 0 (0.0%) |
| Total | 45 (100.0%) | 8 (100.0%) |
Housing Structure by Heating Type in Peoa
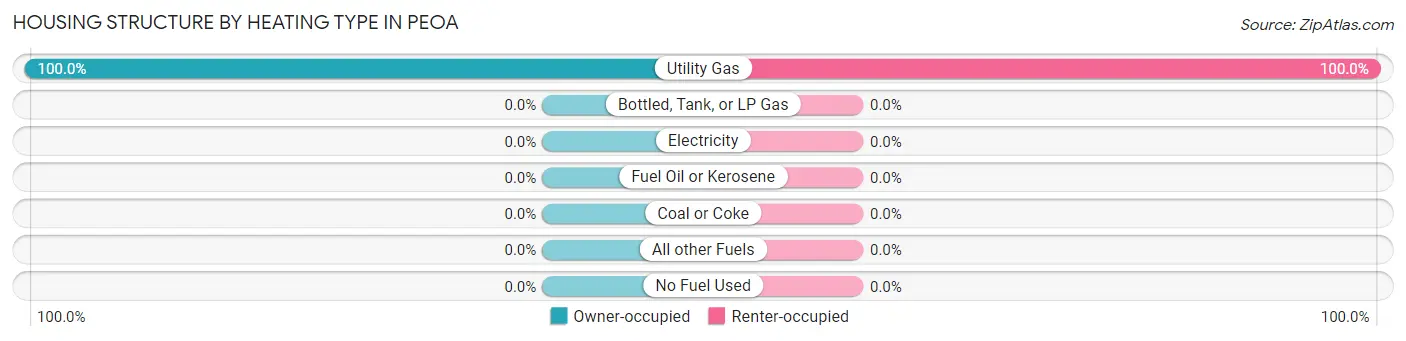
| Heating Type | Owner-occupied | Renter-occupied |
| Utility Gas | 45 (100.0%) | 8 (100.0%) |
| Bottled, Tank, or LP Gas | 0 (0.0%) | 0 (0.0%) |
| Electricity | 0 (0.0%) | 0 (0.0%) |
| Fuel Oil or Kerosene | 0 (0.0%) | 0 (0.0%) |
| Coal or Coke | 0 (0.0%) | 0 (0.0%) |
| All other Fuels | 0 (0.0%) | 0 (0.0%) |
| No Fuel Used | 0 (0.0%) | 0 (0.0%) |
| Total | 45 (100.0%) | 8 (100.0%) |
Household Vehicle Usage in Peoa
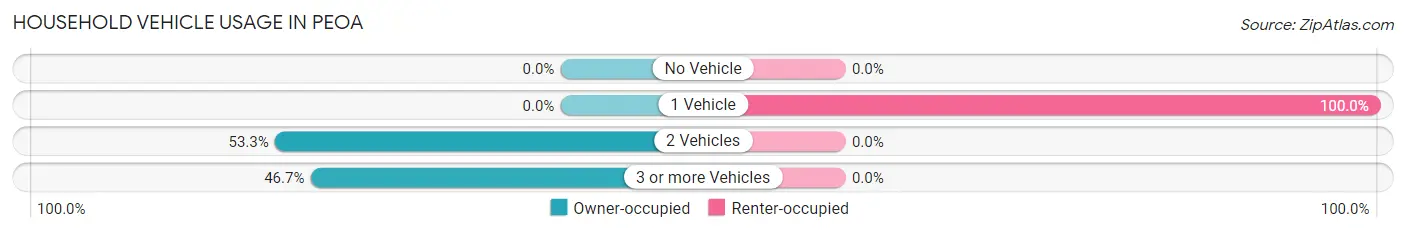
| Vehicles per Household | Owner-occupied | Renter-occupied |
| No Vehicle | 0 (0.0%) | 0 (0.0%) |
| 1 Vehicle | 0 (0.0%) | 8 (100.0%) |
| 2 Vehicles | 24 (53.3%) | 0 (0.0%) |
| 3 or more Vehicles | 21 (46.7%) | 0 (0.0%) |
| Total | 45 (100.0%) | 8 (100.0%) |
Real Estate & Mortgages in Peoa
Real Estate and Mortgage Overview in Peoa
| Characteristic | Without Mortgage | With Mortgage |
| Housing Units | 33 | 12 |
| Median Property Value | - | - |
| Median Household Income | $116,328 | $12 |
| Monthly Housing Costs | $506 | $0 |
| Real Estate Taxes | $2,056 | $0 |
Property Value by Mortgage Status in Peoa
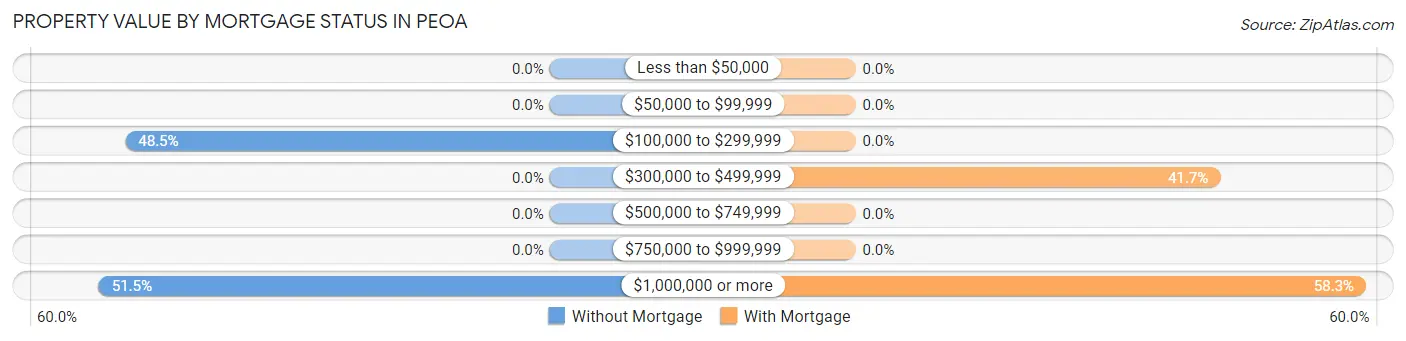
| Property Value | Without Mortgage | With Mortgage |
| Less than $50,000 | 0 (0.0%) | 0 (0.0%) |
| $50,000 to $99,999 | 0 (0.0%) | 0 (0.0%) |
| $100,000 to $299,999 | 16 (48.5%) | 0 (0.0%) |
| $300,000 to $499,999 | 0 (0.0%) | 5 (41.7%) |
| $500,000 to $749,999 | 0 (0.0%) | 0 (0.0%) |
| $750,000 to $999,999 | 0 (0.0%) | 0 (0.0%) |
| $1,000,000 or more | 17 (51.5%) | 7 (58.3%) |
| Total | 33 (100.0%) | 12 (100.0%) |
Household Income by Mortgage Status in Peoa
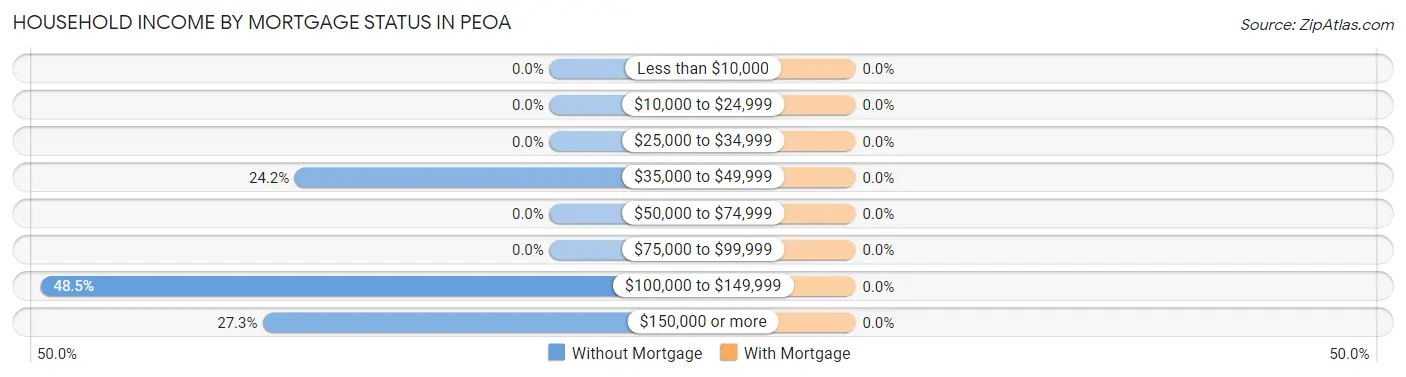
| Household Income | Without Mortgage | With Mortgage |
| Less than $10,000 | 0 (0.0%) | 0 (0.0%) |
| $10,000 to $24,999 | 0 (0.0%) | 0 (0.0%) |
| $25,000 to $34,999 | 0 (0.0%) | 0 (0.0%) |
| $35,000 to $49,999 | 8 (24.2%) | 0 (0.0%) |
| $50,000 to $74,999 | 0 (0.0%) | 0 (0.0%) |
| $75,000 to $99,999 | 0 (0.0%) | 0 (0.0%) |
| $100,000 to $149,999 | 16 (48.5%) | 0 (0.0%) |
| $150,000 or more | 9 (27.3%) | 0 (0.0%) |
| Total | 33 (100.0%) | 12 (100.0%) |
Property Value to Household Income Ratio in Peoa
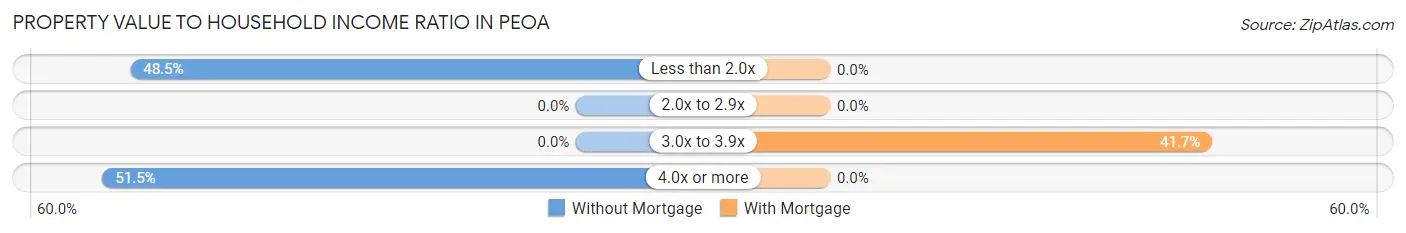
| Value-to-Income Ratio | Without Mortgage | With Mortgage |
| Less than 2.0x | 16 (48.5%) | 0 (0.0%) |
| 2.0x to 2.9x | 0 (0.0%) | 0 (0.0%) |
| 3.0x to 3.9x | 0 (0.0%) | 5 (41.7%) |
| 4.0x or more | 17 (51.5%) | 0 (0.0%) |
| Total | 33 (100.0%) | 12 (100.0%) |
Real Estate Taxes by Mortgage Status in Peoa
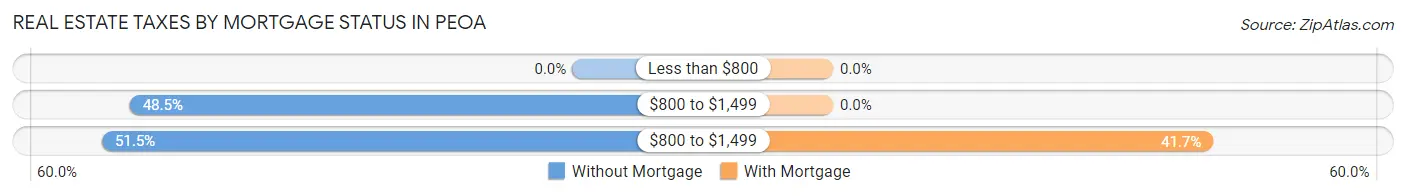
| Property Taxes | Without Mortgage | With Mortgage |
| Less than $800 | 0 (0.0%) | 0 (0.0%) |
| $800 to $1,499 | 16 (48.5%) | 0 (0.0%) |
| $800 to $1,499 | 17 (51.5%) | 5 (41.7%) |
| Total | 33 (100.0%) | 12 (100.0%) |
Health & Disability in Peoa
Health Insurance Coverage by Age in Peoa
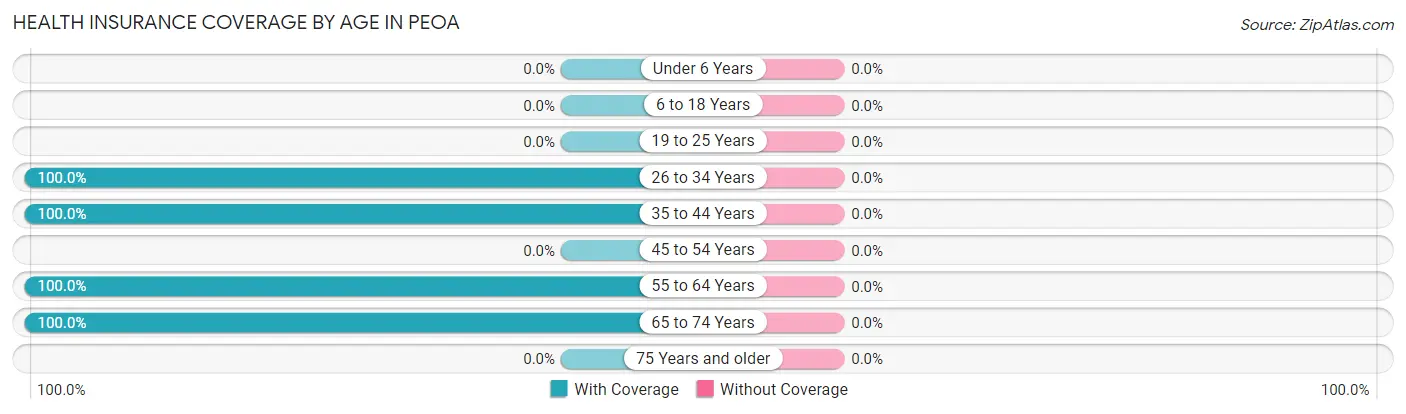
| Age Bracket | With Coverage | Without Coverage |
| Under 6 Years | 0 (0.0%) | 0 (0.0%) |
| 6 to 18 Years | 0 (0.0%) | 0 (0.0%) |
| 19 to 25 Years | 0 (0.0%) | 0 (0.0%) |
| 26 to 34 Years | 29 (100.0%) | 0 (0.0%) |
| 35 to 44 Years | 10 (100.0%) | 0 (0.0%) |
| 45 to 54 Years | 0 (0.0%) | 0 (0.0%) |
| 55 to 64 Years | 23 (100.0%) | 0 (0.0%) |
| 65 to 74 Years | 25 (100.0%) | 0 (0.0%) |
| 75 Years and older | 0 (0.0%) | 0 (0.0%) |
| Total | 87 (100.0%) | 0 (0.0%) |
Health Insurance Coverage by Citizenship Status in Peoa
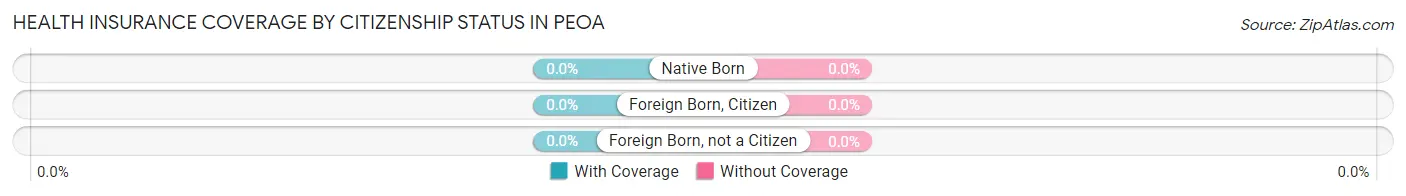
| Citizenship Status | With Coverage | Without Coverage |
| Native Born | 0 (0.0%) | 0 (0.0%) |
| Foreign Born, Citizen | 0 (0.0%) | 0 (0.0%) |
| Foreign Born, not a Citizen | 0 (0.0%) | 0 (0.0%) |
Health Insurance Coverage by Household Income in Peoa
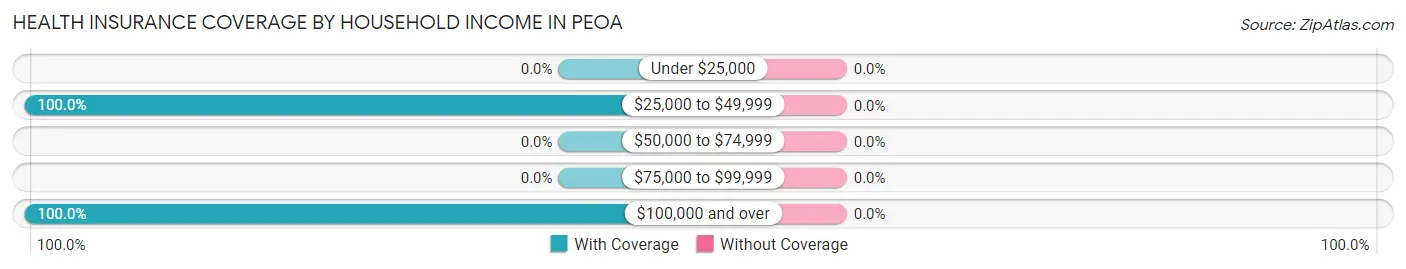
| Household Income | With Coverage | Without Coverage |
| Under $25,000 | 0 (0.0%) | 0 (0.0%) |
| $25,000 to $49,999 | 8 (100.0%) | 0 (0.0%) |
| $50,000 to $74,999 | 0 (0.0%) | 0 (0.0%) |
| $75,000 to $99,999 | 0 (0.0%) | 0 (0.0%) |
| $100,000 and over | 79 (100.0%) | 0 (0.0%) |
Public vs Private Health Insurance Coverage by Age in Peoa
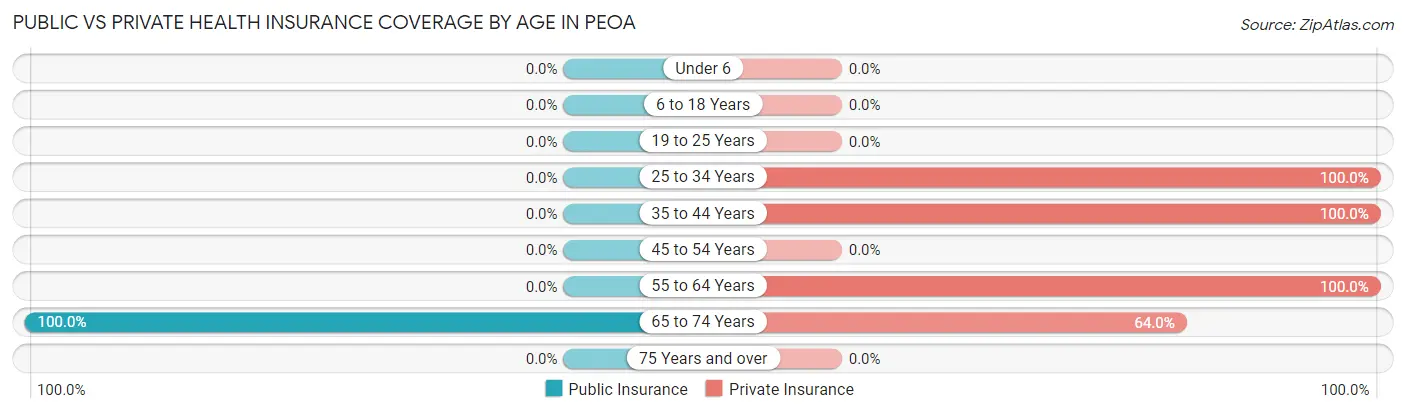
| Age Bracket | Public Insurance | Private Insurance |
| Under 6 | 0 (0.0%) | 0 (0.0%) |
| 6 to 18 Years | 0 (0.0%) | 0 (0.0%) |
| 19 to 25 Years | 0 (0.0%) | 0 (0.0%) |
| 25 to 34 Years | 0 (0.0%) | 29 (100.0%) |
| 35 to 44 Years | 0 (0.0%) | 10 (100.0%) |
| 45 to 54 Years | 0 (0.0%) | 0 (0.0%) |
| 55 to 64 Years | 0 (0.0%) | 23 (100.0%) |
| 65 to 74 Years | 25 (100.0%) | 16 (64.0%) |
| 75 Years and over | 0 (0.0%) | 0 (0.0%) |
| Total | 25 (28.7%) | 78 (89.7%) |
Disability Status by Sex by Age in Peoa
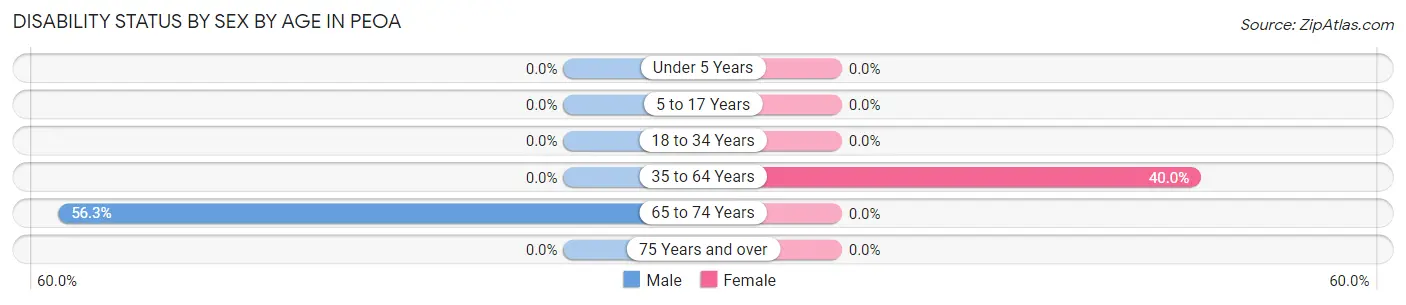
| Age Bracket | Male | Female |
| Under 5 Years | 0 (0.0%) | 0 (0.0%) |
| 5 to 17 Years | 0 (0.0%) | 0 (0.0%) |
| 18 to 34 Years | 0 (0.0%) | 0 (0.0%) |
| 35 to 64 Years | 0 (0.0%) | 8 (40.0%) |
| 65 to 74 Years | 9 (56.2%) | 0 (0.0%) |
| 75 Years and over | 0 (0.0%) | 0 (0.0%) |
Disability Class by Sex by Age in Peoa
Disability Class: Hearing Difficulty
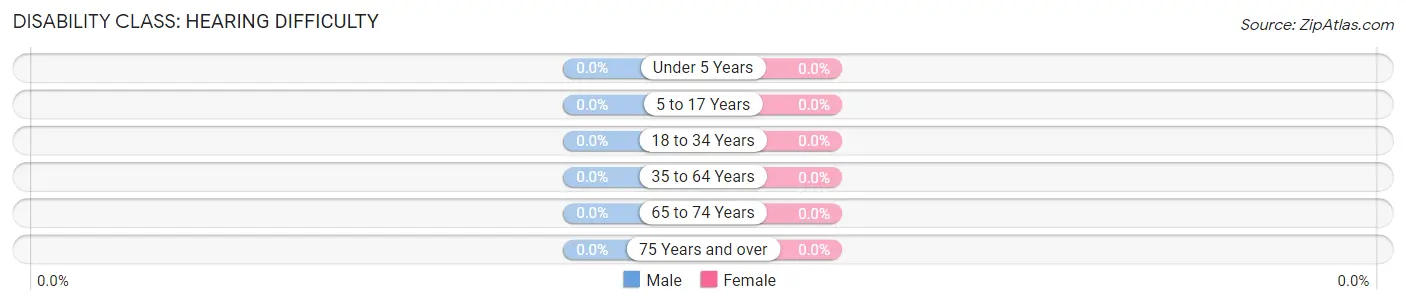
| Age Bracket | Male | Female |
| Under 5 Years | 0 (0.0%) | 0 (0.0%) |
| 5 to 17 Years | 0 (0.0%) | 0 (0.0%) |
| 18 to 34 Years | 0 (0.0%) | 0 (0.0%) |
| 35 to 64 Years | 0 (0.0%) | 0 (0.0%) |
| 65 to 74 Years | 0 (0.0%) | 0 (0.0%) |
| 75 Years and over | 0 (0.0%) | 0 (0.0%) |
Disability Class: Vision Difficulty
| Age Bracket | Male | Female |
| Under 5 Years | 0 (0.0%) | 0 (0.0%) |
| 5 to 17 Years | 0 (0.0%) | 0 (0.0%) |
| 18 to 34 Years | 0 (0.0%) | 0 (0.0%) |
| 35 to 64 Years | 0 (0.0%) | 0 (0.0%) |
| 65 to 74 Years | 0 (0.0%) | 0 (0.0%) |
| 75 Years and over | 0 (0.0%) | 0 (0.0%) |
Disability Class: Cognitive Difficulty
| Age Bracket | Male | Female |
| 5 to 17 Years | 0 (0.0%) | 0 (0.0%) |
| 18 to 34 Years | 0 (0.0%) | 0 (0.0%) |
| 35 to 64 Years | 0 (0.0%) | 8 (40.0%) |
| 65 to 74 Years | 0 (0.0%) | 0 (0.0%) |
| 75 Years and over | 0 (0.0%) | 0 (0.0%) |
Disability Class: Ambulatory Difficulty
| Age Bracket | Male | Female |
| 5 to 17 Years | 0 (0.0%) | 0 (0.0%) |
| 18 to 34 Years | 0 (0.0%) | 0 (0.0%) |
| 35 to 64 Years | 0 (0.0%) | 0 (0.0%) |
| 65 to 74 Years | 9 (56.2%) | 0 (0.0%) |
| 75 Years and over | 0 (0.0%) | 0 (0.0%) |
Disability Class: Self-Care Difficulty
| Age Bracket | Male | Female |
| 5 to 17 Years | 0 (0.0%) | 0 (0.0%) |
| 18 to 34 Years | 0 (0.0%) | 0 (0.0%) |
| 35 to 64 Years | 0 (0.0%) | 0 (0.0%) |
| 65 to 74 Years | 0 (0.0%) | 0 (0.0%) |
| 75 Years and over | 0 (0.0%) | 0 (0.0%) |
Technology Access in Peoa
Computing Device Access in Peoa
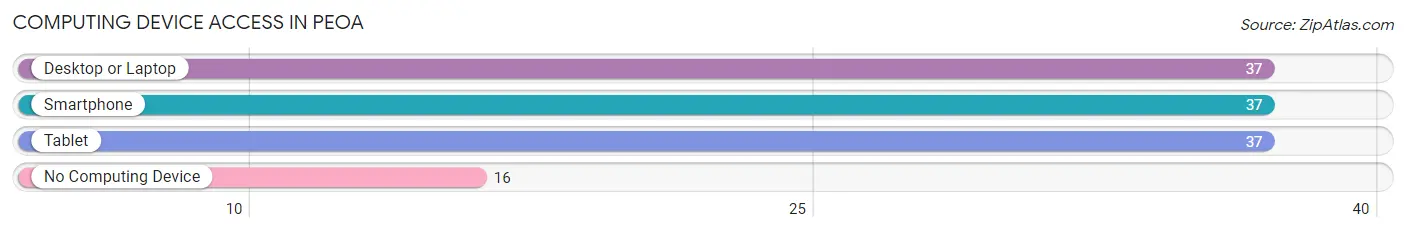
| Device Type | # Households | % Households |
| Desktop or Laptop | 37 | 69.8% |
| Smartphone | 37 | 69.8% |
| Tablet | 37 | 69.8% |
| No Computing Device | 16 | 30.2% |
| Total | 53 | 100.0% |
Internet Access in Peoa
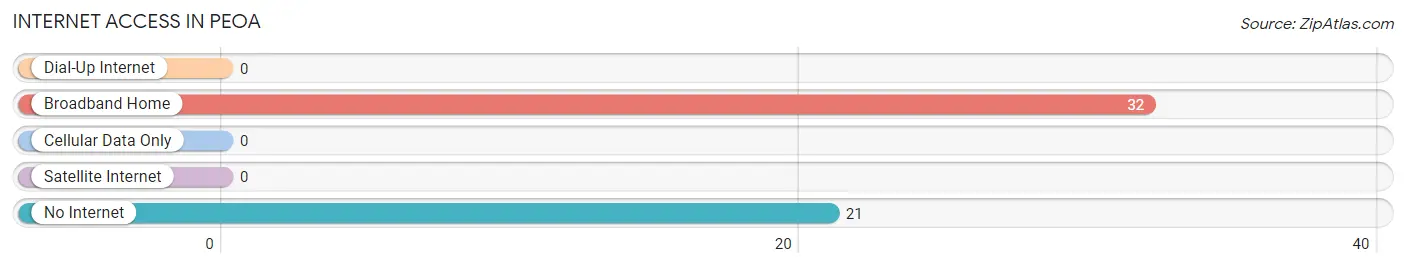
| Internet Type | # Households | % Households |
| Dial-Up Internet | 0 | 0.0% |
| Broadband Home | 32 | 60.4% |
| Cellular Data Only | 0 | 0.0% |
| Satellite Internet | 0 | 0.0% |
| No Internet | 21 | 39.6% |
| Total | 53 | 100.0% |
Peoa Summary
Peoa is a small unincorporated community located in Summit County, Utah, United States. It is situated in the Wasatch Mountains, approximately 20 miles east of Park City and 30 miles southeast of Salt Lake City. Peoa is a rural community with a population of approximately 500 people.
Geography
Peoa is located in the Wasatch Mountains, at an elevation of 6,400 feet. The area is characterized by rolling hills, meadows, and forests of pine and aspen. The climate is semi-arid, with cold winters and mild summers. The average annual precipitation is approximately 18 inches.
The community is situated along the Weber River, which flows through the area. The river is a popular destination for fishing, rafting, and kayaking. The area is also home to several small lakes, including Echo Lake, Rockport Lake, and Pineview Reservoir.
Economy
The economy of Peoa is largely based on tourism and recreation. The area is a popular destination for outdoor activities such as fishing, hunting, camping, hiking, and skiing. The nearby ski resorts of Park City and Deer Valley attract visitors from around the world.
The area is also home to several small businesses, including restaurants, lodging, and retail stores. The community is served by a post office, a library, and a volunteer fire department.
Demographics
As of the 2010 census, the population of Peoa was 498. The racial makeup of the community was 97.2% White, 0.2% African American, 0.4% Native American, 0.2% Asian, 0.2% Pacific Islander, 0.8% from other races, and 1.0% from two or more races. Hispanic or Latino of any race were 2.2% of the population.
The median household income in Peoa was $50,000, and the median family income was $54,000. The per capita income was $21,000. About 8.3% of families and 10.2% of the population were below the poverty line, including 11.3% of those under age 18 and none of those age 65 or over.
Conclusion
Peoa is a small unincorporated community located in Summit County, Utah. It is situated in the Wasatch Mountains, approximately 20 miles east of Park City and 30 miles southeast of Salt Lake City. The area is characterized by rolling hills, meadows, and forests of pine and aspen. The economy of Peoa is largely based on tourism and recreation, and the area is a popular destination for outdoor activities such as fishing, hunting, camping, hiking, and skiing. As of the 2010 census, the population of Peoa was 498. The median household income in Peoa was $50,000, and the median family income was $54,000. The per capita income was $21,000.
Common Questions
What is Per Capita Income in Peoa?
Per Capita income in Peoa is $77,384.
What is the Median Family Income in Peoa?
Median Family Income in Peoa is $186,528.
What is the Median Household income in Peoa?
Median Household Income in Peoa is $116,641.
What is Income or Wage Gap in Peoa?
Income or Wage Gap in Peoa is 10.1%.
Women in Peoa earn 89.9 cents for every dollar earned by a man.
What is Inequality or Gini Index in Peoa?
Inequality or Gini Index in Peoa is 0.21.
What is the Total Population of Peoa?
Total Population of Peoa is 87.
What is the Total Male Population of Peoa?
Total Male Population of Peoa is 42.
What is the Total Female Population of Peoa?
Total Female Population of Peoa is 45.
What is the Ratio of Males per 100 Females in Peoa?
There are 93.33 Males per 100 Females in Peoa.
What is the Ratio of Females per 100 Males in Peoa?
There are 107.14 Females per 100 Males in Peoa.
What is the Median Population Age in Peoa?
Median Population Age in Peoa is 58.6 Years.
What is the Average Family Size in Peoa
Average Family Size in Peoa is 2.0 People.
What is the Average Household Size in Peoa
Average Household Size in Peoa is 1.6 People.
How Large is the Labor Force in Peoa?
There are 70 People in the Labor Forcein in Peoa.
What is the Percentage of People in the Labor Force in Peoa?
80.5% of People are in the Labor Force in Peoa.