Immigrants from Philippines vs Immigrants from Belize Married-Couple Family Poverty

COMPARE

Immigrants from Philippines
Race
Ancestry
AfghanAfricanAlaska NativeAlaskan AthabascanAlbanianAleutAlsatianAmericanApacheArabArapahoArgentineanArmenianAssyrian/Chaldean/SyriacAustralianAustrianBahamianBangladeshiBarbadianBasqueBelgianBelizeanBermudanBhutaneseBlackfeetBolivianBrazilianBritishBritish West IndianBulgarianBurmeseCajunCambodianCanadianCape VerdeanCarpatho RusynCelticCentral AmericanCentral American IndianCherokeeCheyenneChickasawChileanChineseChippewaChoctawColombianColvilleComancheCosta RicanCreeCreekCroatianCrowCubanCypriotCzechCzechoslovakianDanishDelawareDominicanDutchDutch West IndianEastern EuropeanEcuadorianEgyptianEnglishEstonianEthiopianEuropeanFijianFilipinoFinnishFrenchFrench American IndianFrench CanadianGermanGerman RussianGhanaianGreekGuamanian/ChamorroGuatemalanGuyaneseHaitianHmongHonduranHopiHoumaHungarianIcelanderIndian (Asian)IndonesianInupiatIranianIraqiIrishIroquoisIsraeliItalianJamaicanJapaneseJordanianKenyanKiowaKoreanLaotianLatvianLebaneseLiberianLithuanianLumbeeLuxembourgerMacedonianMalaysianMalteseMarshalleseMenomineeMexicanMexican American IndianMongolianMoroccanNative HawaiianNavajoNepaleseNew ZealanderNicaraguanNigerianNorthern EuropeanNorwegianOkinawanOsageOttawaPaiutePakistaniPalestinianPanamanianParaguayanPennsylvania GermanPeruvianPimaPolishPortuguesePotawatomiPuebloPuerto RicanPuget Sound SalishRomanianRussianSalvadoranSamoanScandinavianScotch-IrishScottishSeminoleSenegaleseSerbianShoshoneSierra LeoneanSiouxSlavicSlovakSloveneSomaliSouth AfricanSouth AmericanSouth American IndianSoviet UnionSpaniardSpanishSpanish AmericanSpanish American IndianSri LankanSubsaharan AfricanSudaneseSwedishSwissSyrianTaiwaneseThaiTlingit-HaidaTohono O'OdhamTonganTrinidadian and TobagonianTsimshianTurkishU.S. Virgin IslanderUgandanUkrainianUruguayanUteVenezuelanVietnameseWelshWest IndianYakamaYaquiYugoslavianYumanYup'ikZimbabwean
Immigration
NonimmigrantsImmigrantsAfghanistanAfricaAlbaniaArgentinaArmeniaAsiaAustraliaAustriaBahamasBangladeshBarbadosBelarusBelgiumBoliviaBosnia and HerzegovinaBrazilBulgariaBurma/MyanmarCabo VerdeCambodiaCameroonCanadaCaribbeanCentral AmericaChileChinaColombiaCongoCosta RicaCroatiaCubaCzechoslovakiaDenmarkDominicaDominican RepublicEastern AfricaEastern AsiaEastern EuropeEcuadorEgyptEl SalvadorEnglandEritreaEthiopiaEuropeFijiFranceGermanyGhanaGreeceGrenadaGuatemalaGuyanaHaitiHondurasHong KongHungaryIndiaIndonesiaIranIraqIrelandIsraelItalyJamaicaJapanJordanKazakhstanKenyaKoreaKuwaitLaosLatin AmericaLatviaLebanonLiberiaLithuaniaMalaysiaMexicoMicronesiaMiddle AfricaMoldovaMoroccoNepalNetherlandsNicaraguaNigeriaNorth AmericaNorth MacedoniaNorthern AfricaNorthern EuropeNorwayOceaniaPakistanPanamaPeruPhilippinesPolandPortugalRomaniaRussiaSaudi ArabiaScotlandSenegalSerbiaSierra LeoneSingaporeSomaliaSouth AfricaSouth AmericaSouth Central AsiaSouth Eastern AsiaSouthern EuropeSpainSri LankaSt. Vincent and the GrenadinesSudanSwedenSwitzerlandSyriaTaiwanThailandTrinidad and TobagoTurkeyUgandaUkraineUruguayUzbekistanVenezuelaVietnamWest IndiesWestern AfricaWestern AsiaWestern EuropeYemenZaireZimbabweAzores
Immigrants from Belize
Race
Ancestry
AfghanAfricanAlaska NativeAlaskan AthabascanAlbanianAleutAlsatianAmericanApacheArabArapahoArgentineanArmenianAssyrian/Chaldean/SyriacAustralianAustrianBahamianBangladeshiBarbadianBasqueBelgianBelizeanBermudanBhutaneseBlackfeetBolivianBrazilianBritishBritish West IndianBulgarianBurmeseCajunCambodianCanadianCape VerdeanCarpatho RusynCelticCentral AmericanCentral American IndianCherokeeCheyenneChickasawChileanChineseChippewaChoctawColombianColvilleComancheCosta RicanCreeCreekCroatianCrowCubanCypriotCzechCzechoslovakianDanishDelawareDominicanDutchDutch West IndianEastern EuropeanEcuadorianEgyptianEnglishEstonianEthiopianEuropeanFijianFilipinoFinnishFrenchFrench American IndianFrench CanadianGermanGerman RussianGhanaianGreekGuamanian/ChamorroGuatemalanGuyaneseHaitianHmongHonduranHopiHoumaHungarianIcelanderIndian (Asian)IndonesianInupiatIranianIraqiIrishIroquoisIsraeliItalianJamaicanJapaneseJordanianKenyanKiowaKoreanLaotianLatvianLebaneseLiberianLithuanianLumbeeLuxembourgerMacedonianMalaysianMalteseMarshalleseMenomineeMexicanMexican American IndianMongolianMoroccanNative HawaiianNavajoNepaleseNew ZealanderNicaraguanNigerianNorthern EuropeanNorwegianOkinawanOsageOttawaPaiutePakistaniPalestinianPanamanianParaguayanPennsylvania GermanPeruvianPimaPolishPortuguesePotawatomiPuebloPuerto RicanPuget Sound SalishRomanianRussianSalvadoranSamoanScandinavianScotch-IrishScottishSeminoleSenegaleseSerbianShoshoneSierra LeoneanSiouxSlavicSlovakSloveneSomaliSouth AfricanSouth AmericanSouth American IndianSoviet UnionSpaniardSpanishSpanish AmericanSpanish American IndianSri LankanSubsaharan AfricanSudaneseSwedishSwissSyrianTaiwaneseThaiTlingit-HaidaTohono O'OdhamTonganTrinidadian and TobagonianTsimshianTurkishU.S. Virgin IslanderUgandanUkrainianUruguayanUteVenezuelanVietnameseWelshWest IndianYakamaYaquiYugoslavianYumanYup'ikZimbabwean
Immigration
NonimmigrantsImmigrantsAfghanistanAfricaAlbaniaArgentinaArmeniaAsiaAustraliaAustriaBahamasBangladeshBarbadosBelarusBelgiumBelizeBoliviaBosnia and HerzegovinaBrazilBulgariaBurma/MyanmarCabo VerdeCambodiaCameroonCanadaCaribbeanCentral AmericaChileChinaColombiaCongoCosta RicaCroatiaCubaCzechoslovakiaDenmarkDominicaDominican RepublicEastern AfricaEastern AsiaEastern EuropeEcuadorEgyptEl SalvadorEnglandEritreaEthiopiaEuropeFijiFranceGermanyGhanaGreeceGrenadaGuatemalaGuyanaHaitiHondurasHong KongHungaryIndiaIndonesiaIranIraqIrelandIsraelItalyJamaicaJapanJordanKazakhstanKenyaKoreaKuwaitLaosLatin AmericaLatviaLebanonLiberiaLithuaniaMalaysiaMexicoMicronesiaMiddle AfricaMoldovaMoroccoNepalNetherlandsNicaraguaNigeriaNorth AmericaNorth MacedoniaNorthern AfricaNorthern EuropeNorwayOceaniaPakistanPanamaPeruPolandPortugalRomaniaRussiaSaudi ArabiaScotlandSenegalSerbiaSierra LeoneSingaporeSomaliaSouth AfricaSouth AmericaSouth Central AsiaSouth Eastern AsiaSouthern EuropeSpainSri LankaSt. Vincent and the GrenadinesSudanSwedenSwitzerlandSyriaTaiwanThailandTrinidad and TobagoTurkeyUgandaUkraineUruguayUzbekistanVenezuelaVietnamWest IndiesWestern AfricaWestern AsiaWestern EuropeYemenZaireZimbabweAzores
Married-Couple Family Poverty
Income
Poverty
Unemployment
Labor Participation
Family Structure
Vehicle Availability
Education Level
Disability

Married-Couple Family Poverty Comparison

Immigrants from Philippines

Immigrants from Belize

Exceptional
Tragic
4.8%
MARRIED-COUPLE FAMILY POVERTY
94.6/ 100
METRIC RATING
118th/ 347
METRIC RANK
6.7%
MARRIED-COUPLE FAMILY POVERTY
0.0/ 100
METRIC RATING
300th/ 347
METRIC RANK

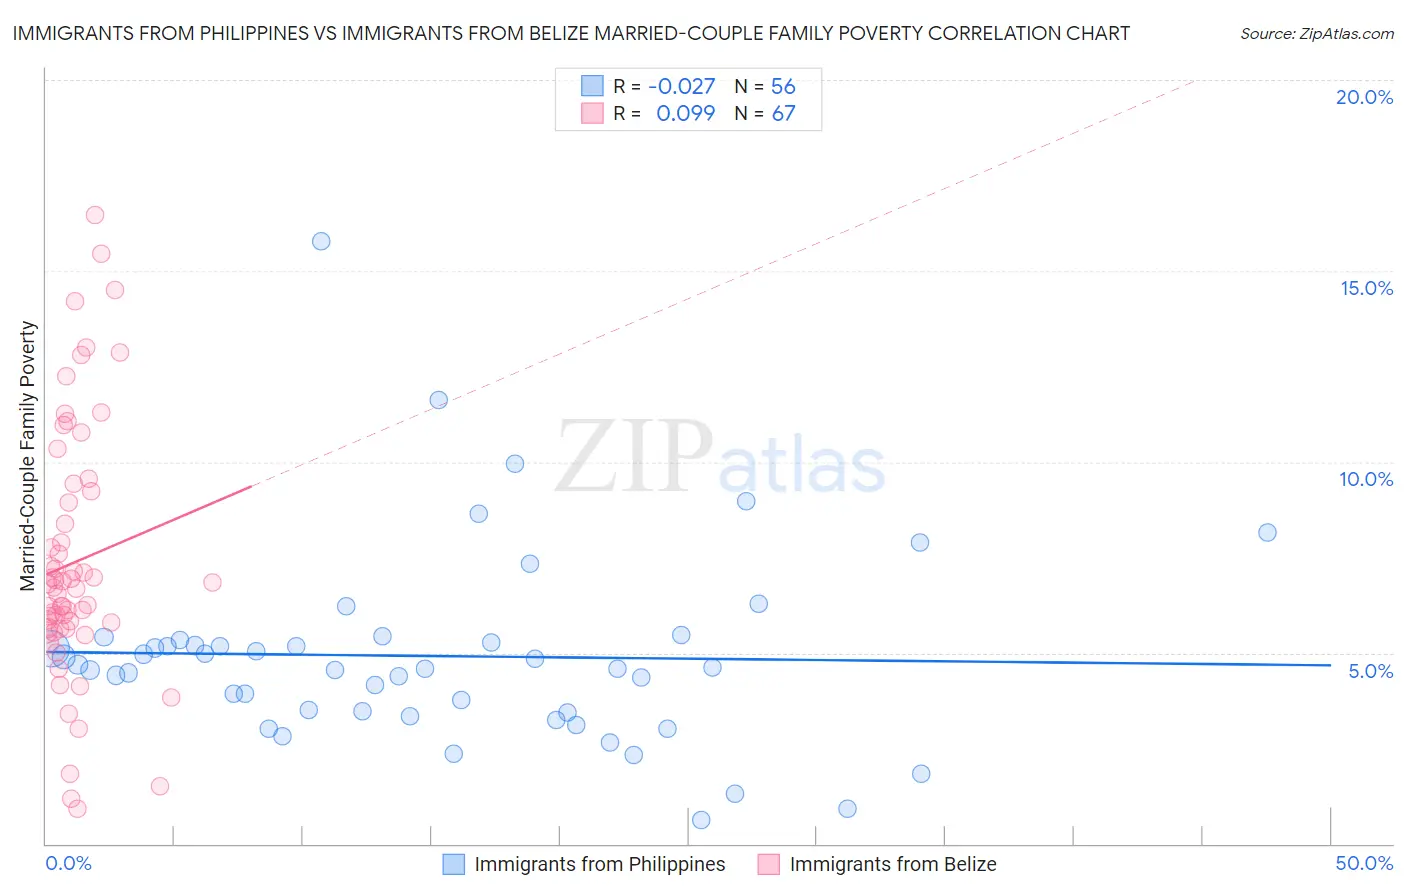
Immigrants from Philippines vs Immigrants from Belize Married-Couple Family Poverty Correlation Chart

The statistical analysis conducted on geographies consisting of 465,939,679 people shows no correlation between the proportion of Immigrants from Philippines and poverty level among married-couple families in the United States with a correlation coefficient (R) of -0.027 and weighted average of 4.8%. Similarly, the statistical analysis conducted on geographies consisting of 130,147,118 people shows a slight positive correlation between the proportion of Immigrants from Belize and poverty level among married-couple families in the United States with a correlation coefficient (R) of 0.099 and weighted average of 6.7%, a difference of 40.1%.
Immigrants from Philippines vs Immigrants from Belize Married-Couple Family Poverty

Married-Couple Family Poverty Correlation Summary

MeasurementImmigrants from PhilippinesImmigrants from Belize
Minimum0.63%0.90%
Maximum15.8%16.5%
Range15.2%15.6%
Mean4.9%7.4%
Median4.6%6.7%
Interquartile 25% (IQ1)3.5%5.6%
Interquartile 75% (IQ3)5.3%9.2%
Interquartile Range (IQR)1.8%3.6%
Standard Deviation (Sample)2.5%3.3%
Standard Deviation (Population)2.5%3.3%

Similar Demographics by Married-Couple Family Poverty

Demographics Similar to Immigrants from Philippines by Married-Couple Family Poverty

In terms of married-couple family poverty, the demographic groups most similar to Immigrants from Philippines are Kenyan (4.8%, a difference of 0.020%), Celtic (4.8%, a difference of 0.12%), Taiwanese (4.8%, a difference of 0.13%), Immigrants from Indonesia (4.8%, a difference of 0.28%), and Immigrants from Eastern Asia (4.8%, a difference of 0.37%).
DemographicsRating | RankMarried-Couple Family Poverty
Pakistanis
96.2
/100
|
#111
Exceptional
4.7%
Tongans
95.9
/100
|
#112
Exceptional
4.7%
Immigrants | Nepal
95.9
/100
|
#113
Exceptional
4.7%
Immigrants | Indonesia
95.1
/100
|
#114
Exceptional
4.8%
Taiwanese
94.8
/100
|
#115
Exceptional
4.8%
Celtics
94.8
/100
|
#116
Exceptional
4.8%
Kenyans
94.7
/100
|
#117
Exceptional
4.8%
Immigrants | Philippines
94.6
/100
|
#118
Exceptional
4.8%
Immigrants | Eastern Asia
94.0
/100
|
#119
Exceptional
4.8%
Immigrants | Southern Europe
93.4
/100
|
#120
Exceptional
4.8%
Indians (Asian)
93.2
/100
|
#121
Exceptional
4.8%
Whites/Caucasians
93.1
/100
|
#122
Exceptional
4.8%
Jordanians
93.1
/100
|
#123
Exceptional
4.8%
Romanians
92.5
/100
|
#124
Exceptional
4.8%
Immigrants | Bosnia and Herzegovina
92.5
/100
|
#125
Exceptional
4.8%

Demographics Similar to Immigrants from Belize by Married-Couple Family Poverty

In terms of married-couple family poverty, the demographic groups most similar to Immigrants from Belize are Nicaraguan (6.7%, a difference of 0.15%), Central American (6.7%, a difference of 0.60%), Immigrants from Guyana (6.7%, a difference of 0.69%), Immigrants from Ecuador (6.7%, a difference of 0.74%), and Kiowa (6.6%, a difference of 0.76%).
DemographicsRating | RankMarried-Couple Family Poverty
Arapaho
0.0
/100
|
#293
Tragic
6.6%
Bahamians
0.0
/100
|
#294
Tragic
6.6%
Immigrants | Uzbekistan
0.0
/100
|
#295
Tragic
6.6%
U.S. Virgin Islanders
0.0
/100
|
#296
Tragic
6.6%
Kiowa
0.0
/100
|
#297
Tragic
6.6%
Immigrants | Guyana
0.0
/100
|
#298
Tragic
6.7%
Nicaraguans
0.0
/100
|
#299
Tragic
6.7%
Immigrants | Belize
0.0
/100
|
#300
Tragic
6.7%
Central Americans
0.0
/100
|
#301
Tragic
6.7%
Immigrants | Ecuador
0.0
/100
|
#302
Tragic
6.7%
Immigrants | El Salvador
0.0
/100
|
#303
Tragic
6.8%
Cubans
0.0
/100
|
#304
Tragic
6.8%
Haitians
0.0
/100
|
#305
Tragic
6.8%
Immigrants | Haiti
0.0
/100
|
#306
Tragic
7.0%
Guatemalans
0.0
/100
|
#307
Tragic
7.0%