Immigrants from Philippines Self-Care Disability
COMPARE
Immigrants from Philippines
Select to Compare
Self-Care Disability
Immigrants from Philippines Self-Care Disability
2.6%
SELF-CARE DISABILITY
2.7/ 100
METRIC RATING
227th/ 347
METRIC RANK
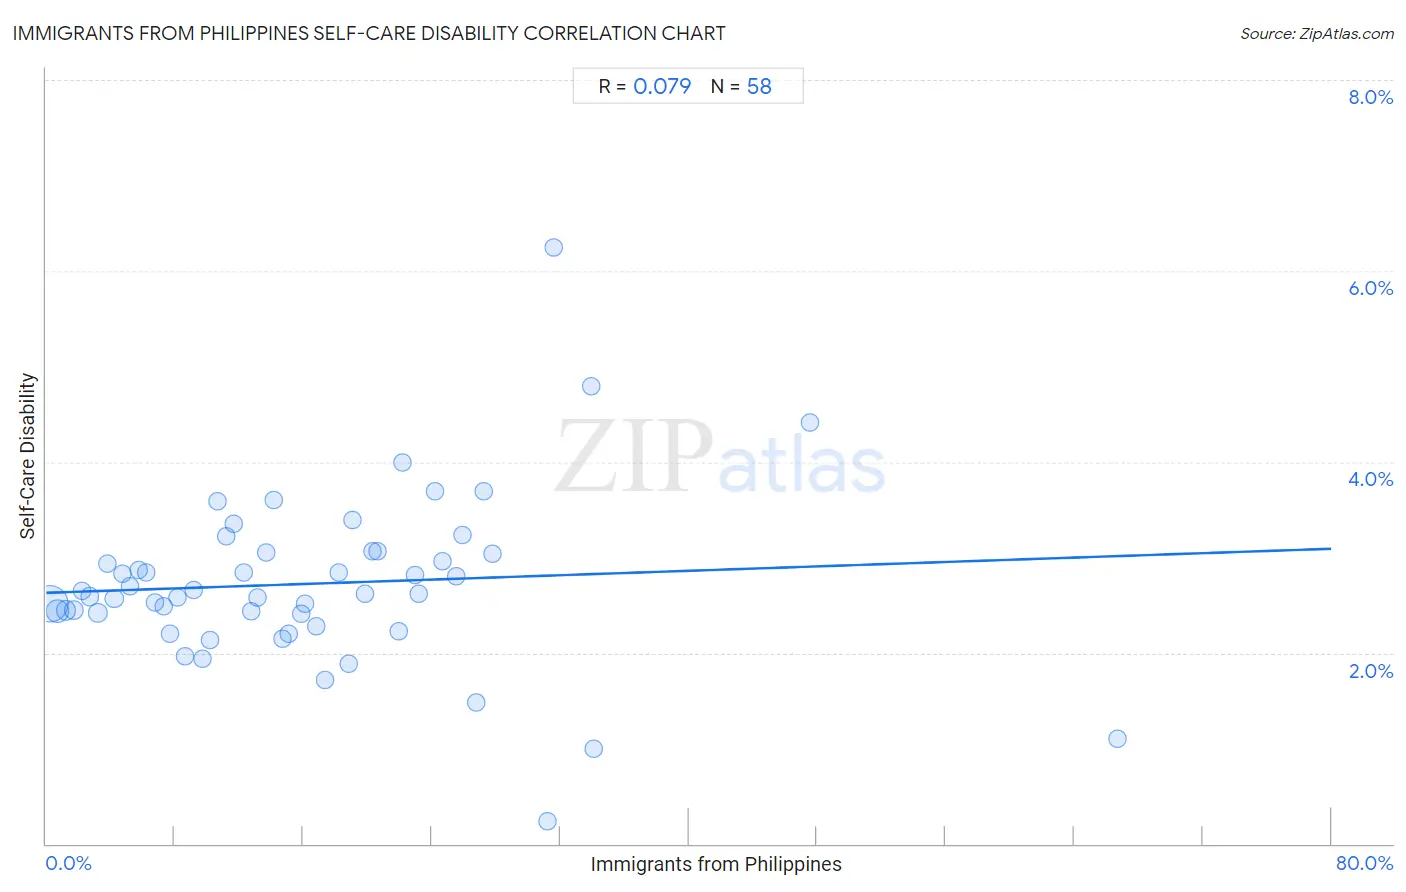
Immigrants from Philippines Self-Care Disability Correlation Chart
The statistical analysis conducted on geographies consisting of 470,541,015 people shows a slight positive correlation between the proportion of Immigrants from Philippines and percentage of population with self-care disability in the United States with a correlation coefficient (R) of 0.079 and weighted average of 2.6%. On average, for every 1% (one percent) increase in Immigrants from Philippines within a typical geography, there is an increase of 0.0058% in percentage of population with self-care disability.
It is essential to understand that the correlation between the percentage of Immigrants from Philippines and percentage of population with self-care disability does not imply a direct cause-and-effect relationship. It remains uncertain whether the presence of Immigrants from Philippines influences an upward or downward trend in the level of percentage of population with self-care disability within an area, or if Immigrants from Philippines simply ended up residing in those areas with higher or lower levels of percentage of population with self-care disability due to other factors.
Demographics Similar to Immigrants from Philippines by Self-Care Disability
In terms of self-care disability, the demographic groups most similar to Immigrants from Philippines are Guatemalan (2.6%, a difference of 0.010%), Chinese (2.6%, a difference of 0.080%), Guamanian/Chamorro (2.6%, a difference of 0.080%), Immigrants from Ecuador (2.6%, a difference of 0.080%), and Iraqi (2.6%, a difference of 0.18%).
| Demographics | Rating | Rank | Self-Care Disability |
| Sub-Saharan Africans | 4.0 /100 | #220 | Tragic 2.6% |
| Hondurans | 3.8 /100 | #221 | Tragic 2.6% |
| Spaniards | 3.8 /100 | #222 | Tragic 2.6% |
| French Canadians | 3.8 /100 | #223 | Tragic 2.6% |
| Osage | 3.6 /100 | #224 | Tragic 2.6% |
| Iraqis | 3.2 /100 | #225 | Tragic 2.6% |
| Chinese | 2.9 /100 | #226 | Tragic 2.6% |
| Immigrants from Philippines | 2.7 /100 | #227 | Tragic 2.6% |
| Guatemalans | 2.7 /100 | #228 | Tragic 2.6% |
| Guamanians/Chamorros | 2.5 /100 | #229 | Tragic 2.6% |
| Immigrants from Ecuador | 2.5 /100 | #230 | Tragic 2.6% |
| Immigrants from Guatemala | 2.2 /100 | #231 | Tragic 2.6% |
| Albanians | 2.2 /100 | #232 | Tragic 2.6% |
| Liberians | 2.1 /100 | #233 | Tragic 2.6% |
| Vietnamese | 2.1 /100 | #234 | Tragic 2.6% |
Immigrants from Philippines Self-Care Disability Correlation Summary
| Measurement | Immigrants from Philippines Data | Self-Care Disability Data |
| Minimum | 0.21% | 0.24% |
| Maximum | 66.7% | 6.2% |
| Range | 66.5% | 6.0% |
| Mean | 16.2% | 2.7% |
| Median | 14.4% | 2.6% |
| Interquartile 25% (IQ1) | 7.3% | 2.4% |
| Interquartile 75% (IQ3) | 22.9% | 3.0% |
| Interquartile Range (IQR) | 15.7% | 0.64% |
| Standard Deviation (Sample) | 12.1% | 0.89% |
| Standard Deviation (Population) | 12.0% | 0.88% |
Correlation Details
| Immigrants from Philippines Percentile | Sample Size | Self-Care Disability |
[ 0.0% - 0.5% ] 0.21% | 296,398,675 | 2.5% |
[ 0.5% - 1.0% ] 0.70% | 80,837,025 | 2.4% |
[ 1.0% - 1.5% ] 1.23% | 28,708,687 | 2.4% |
[ 1.5% - 2.0% ] 1.72% | 17,134,013 | 2.4% |
[ 2.0% - 2.5% ] 2.23% | 13,499,432 | 2.6% |
[ 2.5% - 3.0% ] 2.71% | 8,715,826 | 2.6% |
[ 3.0% - 3.5% ] 3.21% | 8,070,690 | 2.4% |
[ 3.5% - 4.0% ] 3.78% | 3,505,563 | 2.9% |
[ 4.0% - 4.5% ] 4.24% | 3,116,380 | 2.6% |
[ 4.5% - 5.0% ] 4.71% | 1,739,741 | 2.8% |
[ 5.0% - 5.5% ] 5.20% | 728,688 | 2.7% |
[ 5.5% - 6.0% ] 5.77% | 1,388,392 | 2.9% |
[ 6.0% - 6.5% ] 6.20% | 989,977 | 2.8% |
[ 6.5% - 7.0% ] 6.76% | 774,507 | 2.5% |
[ 7.0% - 7.5% ] 7.28% | 528,257 | 2.5% |
[ 7.5% - 8.0% ] 7.72% | 876,008 | 2.2% |
[ 8.0% - 8.5% ] 8.17% | 738,485 | 2.6% |
[ 8.5% - 9.0% ] 8.66% | 247,802 | 2.0% |
[ 9.0% - 9.5% ] 9.21% | 275,458 | 2.7% |
[ 9.5% - 10.0% ] 9.71% | 10,198 | 1.9% |
[ 10.0% - 10.5% ] 10.22% | 154,428 | 2.1% |
[ 10.5% - 11.0% ] 10.68% | 1,666 | 3.6% |
[ 11.0% - 11.5% ] 11.23% | 98,961 | 3.2% |
[ 11.5% - 12.0% ] 11.66% | 262,897 | 3.3% |
[ 12.0% - 12.5% ] 12.28% | 421,339 | 2.8% |
[ 12.5% - 13.0% ] 12.79% | 116,260 | 2.4% |
[ 13.0% - 13.5% ] 13.15% | 27,278 | 2.6% |
[ 13.5% - 14.0% ] 13.71% | 182,553 | 3.0% |
[ 14.0% - 14.5% ] 14.15% | 152,755 | 3.6% |
[ 14.5% - 15.0% ] 14.73% | 52,163 | 2.1% |
[ 15.0% - 15.5% ] 15.14% | 3,766 | 2.2% |
[ 15.5% - 16.0% ] 15.88% | 52,871 | 2.4% |
[ 16.0% - 16.5% ] 16.13% | 130,742 | 2.5% |
[ 16.5% - 17.0% ] 16.82% | 220 | 2.3% |
[ 17.0% - 17.5% ] 17.35% | 4,506 | 1.7% |
[ 18.0% - 18.5% ] 18.21% | 4,898 | 2.8% |
[ 18.5% - 19.0% ] 18.84% | 12,906 | 1.9% |
[ 19.0% - 19.5% ] 19.04% | 1,376 | 3.4% |
[ 19.5% - 20.0% ] 19.86% | 65,125 | 2.6% |
[ 20.0% - 20.5% ] 20.28% | 208,714 | 3.1% |
[ 20.5% - 21.0% ] 20.61% | 6,469 | 3.1% |
[ 21.5% - 22.0% ] 21.94% | 20,127 | 2.2% |
[ 22.0% - 22.5% ] 22.22% | 2,255 | 4.0% |
[ 22.5% - 23.0% ] 22.94% | 7,179 | 2.8% |
[ 23.0% - 23.5% ] 23.16% | 3,800 | 2.6% |
[ 24.0% - 24.5% ] 24.18% | 28,090 | 3.7% |
[ 24.5% - 25.0% ] 24.71% | 52,328 | 3.0% |
[ 25.0% - 25.5% ] 25.49% | 26,398 | 2.8% |
[ 25.5% - 26.0% ] 25.90% | 72,605 | 3.2% |
[ 26.5% - 27.0% ] 26.79% | 922 | 1.5% |
[ 27.0% - 27.5% ] 27.24% | 16,457 | 3.7% |
[ 27.5% - 28.0% ] 27.75% | 7,922 | 3.0% |
[ 31.0% - 31.5% ] 31.18% | 3,576 | 0.24% |
[ 31.5% - 32.0% ] 31.63% | 98 | 6.2% |
[ 33.5% - 34.0% ] 33.96% | 45,457 | 4.8% |
[ 34.0% - 34.5% ] 34.06% | 4,342 | 0.99% |
[ 47.5% - 48.0% ] 47.52% | 766 | 4.4% |
[ 66.5% - 67.0% ] 66.69% | 2,996 | 1.1% |