Immigrants from Philippines vs Immigrants from Italy Married-Couple Family Poverty
COMPARE
Immigrants from Philippines
Immigrants from Italy
Married-Couple Family Poverty
Married-Couple Family Poverty Comparison
Immigrants from Philippines
Immigrants from Italy
4.8%
MARRIED-COUPLE FAMILY POVERTY
94.6/ 100
METRIC RATING
118th/ 347
METRIC RANK
4.6%
MARRIED-COUPLE FAMILY POVERTY
98.3/ 100
METRIC RATING
94th/ 347
METRIC RANK
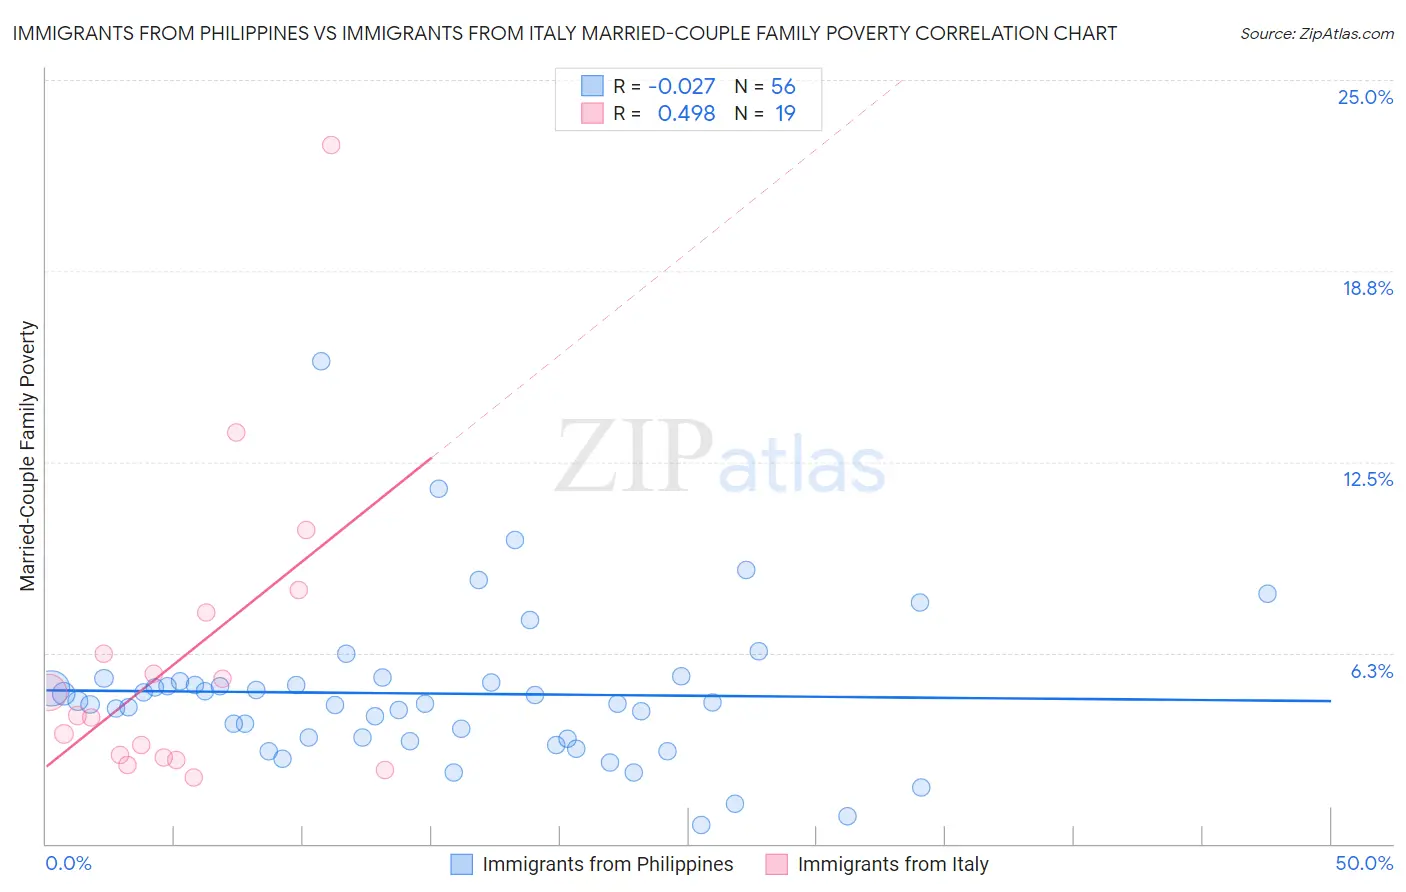
Immigrants from Philippines vs Immigrants from Italy Married-Couple Family Poverty Correlation Chart
The statistical analysis conducted on geographies consisting of 465,939,679 people shows no correlation between the proportion of Immigrants from Philippines and poverty level among married-couple families in the United States with a correlation coefficient (R) of -0.027 and weighted average of 4.8%. Similarly, the statistical analysis conducted on geographies consisting of 321,486,465 people shows a moderate positive correlation between the proportion of Immigrants from Italy and poverty level among married-couple families in the United States with a correlation coefficient (R) of 0.498 and weighted average of 4.6%, a difference of 3.9%.
Married-Couple Family Poverty Correlation Summary
| Measurement | Immigrants from Philippines | Immigrants from Italy |
| Minimum | 0.63% | 2.2% |
| Maximum | 15.8% | 22.9% |
| Range | 15.2% | 20.7% |
| Mean | 4.9% | 6.1% |
| Median | 4.6% | 4.2% |
| Interquartile 25% (IQ1) | 3.5% | 2.8% |
| Interquartile 75% (IQ3) | 5.3% | 7.6% |
| Interquartile Range (IQR) | 1.8% | 4.7% |
| Standard Deviation (Sample) | 2.5% | 5.0% |
| Standard Deviation (Population) | 2.5% | 4.9% |
Similar Demographics by Married-Couple Family Poverty
Demographics Similar to Immigrants from Philippines by Married-Couple Family Poverty
In terms of married-couple family poverty, the demographic groups most similar to Immigrants from Philippines are Kenyan (4.8%, a difference of 0.020%), Celtic (4.8%, a difference of 0.12%), Taiwanese (4.8%, a difference of 0.13%), Immigrants from Indonesia (4.8%, a difference of 0.28%), and Immigrants from Eastern Asia (4.8%, a difference of 0.37%).
| Demographics | Rating | Rank | Married-Couple Family Poverty |
| Pakistanis | 96.2 /100 | #111 | Exceptional 4.7% |
| Tongans | 95.9 /100 | #112 | Exceptional 4.7% |
| Immigrants | Nepal | 95.9 /100 | #113 | Exceptional 4.7% |
| Immigrants | Indonesia | 95.1 /100 | #114 | Exceptional 4.8% |
| Taiwanese | 94.8 /100 | #115 | Exceptional 4.8% |
| Celtics | 94.8 /100 | #116 | Exceptional 4.8% |
| Kenyans | 94.7 /100 | #117 | Exceptional 4.8% |
| Immigrants | Philippines | 94.6 /100 | #118 | Exceptional 4.8% |
| Immigrants | Eastern Asia | 94.0 /100 | #119 | Exceptional 4.8% |
| Immigrants | Southern Europe | 93.4 /100 | #120 | Exceptional 4.8% |
| Indians (Asian) | 93.2 /100 | #121 | Exceptional 4.8% |
| Whites/Caucasians | 93.1 /100 | #122 | Exceptional 4.8% |
| Jordanians | 93.1 /100 | #123 | Exceptional 4.8% |
| Romanians | 92.5 /100 | #124 | Exceptional 4.8% |
| Immigrants | Bosnia and Herzegovina | 92.5 /100 | #125 | Exceptional 4.8% |
Demographics Similar to Immigrants from Italy by Married-Couple Family Poverty
In terms of married-couple family poverty, the demographic groups most similar to Immigrants from Italy are Portuguese (4.6%, a difference of 0.040%), Korean (4.6%, a difference of 0.050%), Immigrants from Poland (4.6%, a difference of 0.12%), Immigrants from Belgium (4.6%, a difference of 0.17%), and Immigrants from Norway (4.6%, a difference of 0.23%).
| Demographics | Rating | Rank | Married-Couple Family Poverty |
| Immigrants | North Macedonia | 98.6 /100 | #87 | Exceptional 4.6% |
| Bolivians | 98.6 /100 | #88 | Exceptional 4.6% |
| Immigrants | Czechoslovakia | 98.5 /100 | #89 | Exceptional 4.6% |
| Immigrants | Switzerland | 98.5 /100 | #90 | Exceptional 4.6% |
| Basques | 98.5 /100 | #91 | Exceptional 4.6% |
| Immigrants | Norway | 98.4 /100 | #92 | Exceptional 4.6% |
| Koreans | 98.3 /100 | #93 | Exceptional 4.6% |
| Immigrants | Italy | 98.3 /100 | #94 | Exceptional 4.6% |
| Portuguese | 98.3 /100 | #95 | Exceptional 4.6% |
| Immigrants | Poland | 98.3 /100 | #96 | Exceptional 4.6% |
| Immigrants | Belgium | 98.2 /100 | #97 | Exceptional 4.6% |
| Native Hawaiians | 98.0 /100 | #98 | Exceptional 4.6% |
| Immigrants | Europe | 97.9 /100 | #99 | Exceptional 4.6% |
| Immigrants | Western Europe | 97.9 /100 | #100 | Exceptional 4.6% |
| Yugoslavians | 97.8 /100 | #101 | Exceptional 4.6% |