Immigrants from Philippines 3 or more Vehicles in Household
COMPARE
Immigrants from Philippines
Select to Compare
3 or more Vehicles in Household
Immigrants from Philippines 3 or more Vehicles in Household
23.8%
3+ VEHICLES AVAILABLE
100.0/ 100
METRIC RATING
22nd/ 347
METRIC RANK
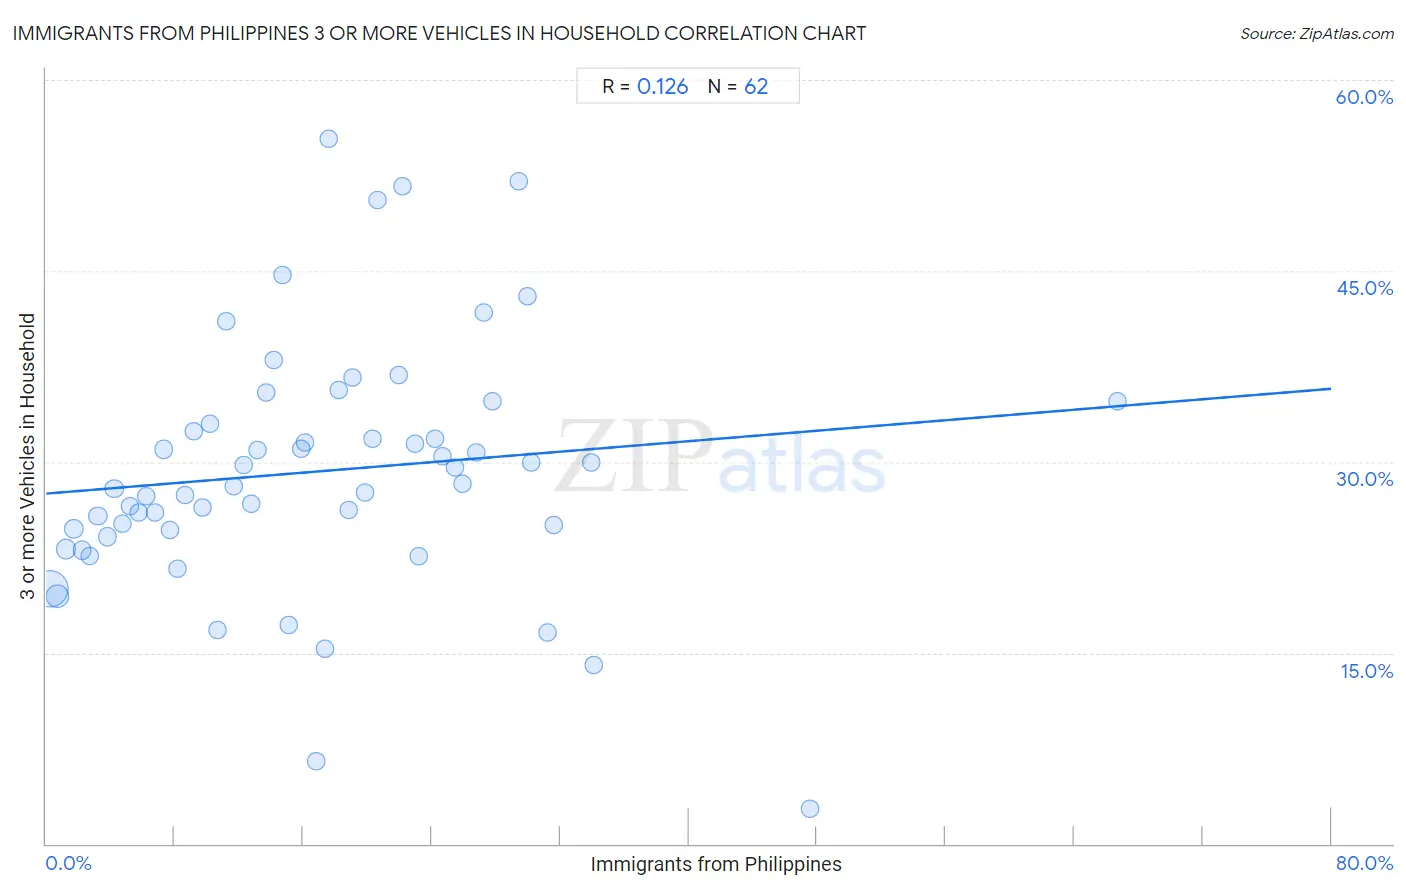
Immigrants from Philippines 3 or more Vehicles in Household Correlation Chart
The statistical analysis conducted on geographies consisting of 470,874,140 people shows a poor positive correlation between the proportion of Immigrants from Philippines and percentage of households with 3 or more vehicles available in the United States with a correlation coefficient (R) of 0.126 and weighted average of 23.8%. On average, for every 1% (one percent) increase in Immigrants from Philippines within a typical geography, there is an increase of 0.10% in percentage of households with 3 or more vehicles available.
It is essential to understand that the correlation between the percentage of Immigrants from Philippines and percentage of households with 3 or more vehicles available does not imply a direct cause-and-effect relationship. It remains uncertain whether the presence of Immigrants from Philippines influences an upward or downward trend in the level of percentage of households with 3 or more vehicles available within an area, or if Immigrants from Philippines simply ended up residing in those areas with higher or lower levels of percentage of households with 3 or more vehicles available due to other factors.
Demographics Similar to Immigrants from Philippines by 3 or more Vehicles in Household
In terms of 3 or more vehicles in household, the demographic groups most similar to Immigrants from Philippines are Immigrants from Vietnam (23.8%, a difference of 0.060%), Paiute (23.8%, a difference of 0.18%), Chinese (23.9%, a difference of 0.47%), Norwegian (23.9%, a difference of 0.51%), and Scandinavian (23.6%, a difference of 0.59%).
| Demographics | Rating | Rank | 3 or more Vehicles in Household |
| Hawaiians | 100.0 /100 | #15 | Exceptional 24.3% |
| Basques | 100.0 /100 | #16 | Exceptional 24.3% |
| Koreans | 100.0 /100 | #17 | Exceptional 24.1% |
| Norwegians | 100.0 /100 | #18 | Exceptional 23.9% |
| Chinese | 100.0 /100 | #19 | Exceptional 23.9% |
| Paiute | 100.0 /100 | #20 | Exceptional 23.8% |
| Immigrants from Vietnam | 100.0 /100 | #21 | Exceptional 23.8% |
| Immigrants from Philippines | 100.0 /100 | #22 | Exceptional 23.8% |
| Scandinavians | 100.0 /100 | #23 | Exceptional 23.6% |
| Sri Lankans | 100.0 /100 | #24 | Exceptional 23.6% |
| Immigrants from Central America | 100.0 /100 | #25 | Exceptional 23.4% |
| Mexican American Indians | 100.0 /100 | #26 | Exceptional 23.3% |
| Guamanians/Chamorros | 100.0 /100 | #27 | Exceptional 23.2% |
| Lumbee | 100.0 /100 | #28 | Exceptional 23.1% |
| Spanish | 100.0 /100 | #29 | Exceptional 23.1% |
Immigrants from Philippines 3 or more Vehicles in Household Correlation Summary
| Measurement | Immigrants from Philippines Data | 3 or more Vehicles in Household Data |
| Minimum | 0.21% | 2.7% |
| Maximum | 66.7% | 55.4% |
| Range | 66.5% | 52.7% |
| Mean | 16.9% | 29.2% |
| Median | 15.5% | 28.2% |
| Interquartile 25% (IQ1) | 7.7% | 24.6% |
| Interquartile 75% (IQ3) | 24.2% | 33.0% |
| Interquartile Range (IQR) | 16.5% | 8.4% |
| Standard Deviation (Sample) | 12.1% | 9.9% |
| Standard Deviation (Population) | 12.0% | 9.8% |
Correlation Details
| Immigrants from Philippines Percentile | Sample Size | 3 or more Vehicles in Household |
[ 0.0% - 0.5% ] 0.21% | 296,484,423 | 20.0% |
[ 0.5% - 1.0% ] 0.70% | 80,919,799 | 19.5% |
[ 1.0% - 1.5% ] 1.23% | 28,771,933 | 23.2% |
[ 1.5% - 2.0% ] 1.72% | 17,178,561 | 24.7% |
[ 2.0% - 2.5% ] 2.23% | 13,513,143 | 23.1% |
[ 2.5% - 3.0% ] 2.71% | 8,733,371 | 22.6% |
[ 3.0% - 3.5% ] 3.21% | 8,066,762 | 25.8% |
[ 3.5% - 4.0% ] 3.78% | 3,517,275 | 24.1% |
[ 4.0% - 4.5% ] 4.24% | 3,119,900 | 27.9% |
[ 4.5% - 5.0% ] 4.71% | 1,742,263 | 25.1% |
[ 5.0% - 5.5% ] 5.20% | 722,360 | 26.5% |
[ 5.5% - 6.0% ] 5.77% | 1,388,392 | 26.0% |
[ 6.0% - 6.5% ] 6.20% | 991,280 | 27.3% |
[ 6.5% - 7.0% ] 6.76% | 773,846 | 26.0% |
[ 7.0% - 7.5% ] 7.28% | 529,914 | 31.0% |
[ 7.5% - 8.0% ] 7.72% | 876,552 | 24.6% |
[ 8.0% - 8.5% ] 8.17% | 739,610 | 21.6% |
[ 8.5% - 9.0% ] 8.66% | 247,972 | 27.4% |
[ 9.0% - 9.5% ] 9.21% | 276,931 | 32.4% |
[ 9.5% - 10.0% ] 9.71% | 10,198 | 26.4% |
[ 10.0% - 10.5% ] 10.22% | 154,825 | 33.0% |
[ 10.5% - 11.0% ] 10.68% | 1,666 | 16.8% |
[ 11.0% - 11.5% ] 11.23% | 98,961 | 41.1% |
[ 11.5% - 12.0% ] 11.66% | 265,513 | 28.1% |
[ 12.0% - 12.5% ] 12.28% | 424,455 | 29.8% |
[ 12.5% - 13.0% ] 12.79% | 117,644 | 26.7% |
[ 13.0% - 13.5% ] 13.15% | 27,412 | 31.0% |
[ 13.5% - 14.0% ] 13.71% | 182,553 | 35.5% |
[ 14.0% - 14.5% ] 14.15% | 152,755 | 38.0% |
[ 14.5% - 15.0% ] 14.73% | 52,271 | 44.7% |
[ 15.0% - 15.5% ] 15.14% | 3,766 | 17.2% |
[ 15.5% - 16.0% ] 15.88% | 52,871 | 31.0% |
[ 16.0% - 16.5% ] 16.13% | 130,885 | 31.6% |
[ 16.5% - 17.0% ] 16.82% | 220 | 6.5% |
[ 17.0% - 17.5% ] 17.35% | 4,656 | 15.3% |
[ 17.5% - 18.0% ] 17.61% | 426 | 55.4% |
[ 18.0% - 18.5% ] 18.22% | 4,628 | 35.7% |
[ 18.5% - 19.0% ] 18.83% | 13,347 | 26.2% |
[ 19.0% - 19.5% ] 19.07% | 1,500 | 36.6% |
[ 19.5% - 20.0% ] 19.86% | 65,125 | 27.6% |
[ 20.0% - 20.5% ] 20.28% | 208,714 | 31.8% |
[ 20.5% - 21.0% ] 20.61% | 6,469 | 50.6% |
[ 21.5% - 22.0% ] 21.94% | 20,127 | 36.8% |
[ 22.0% - 22.5% ] 22.22% | 2,255 | 51.6% |
[ 22.5% - 23.0% ] 22.94% | 7,179 | 31.4% |
[ 23.0% - 23.5% ] 23.15% | 4,820 | 22.6% |
[ 24.0% - 24.5% ] 24.18% | 28,783 | 31.8% |
[ 24.5% - 25.0% ] 24.71% | 52,328 | 30.5% |
[ 25.0% - 25.5% ] 25.49% | 26,509 | 29.6% |
[ 25.5% - 26.0% ] 25.90% | 72,605 | 28.3% |
[ 26.5% - 27.0% ] 26.79% | 922 | 30.7% |
[ 27.0% - 27.5% ] 27.24% | 16,457 | 41.8% |
[ 27.5% - 28.0% ] 27.75% | 7,994 | 34.8% |
[ 29.0% - 29.5% ] 29.41% | 255 | 52.0% |
[ 29.5% - 30.0% ] 29.98% | 1,461 | 43.1% |
[ 30.0% - 30.5% ] 30.16% | 63 | 30.0% |
[ 31.0% - 31.5% ] 31.18% | 3,576 | 16.6% |
[ 31.5% - 32.0% ] 31.63% | 98 | 25.0% |
[ 33.5% - 34.0% ] 33.96% | 45,457 | 29.9% |
[ 34.0% - 34.5% ] 34.06% | 4,342 | 14.1% |
[ 47.5% - 48.0% ] 47.52% | 766 | 2.7% |
[ 66.5% - 67.0% ] 66.69% | 2,996 | 34.8% |