Immigrants from Philippines Married-couple Households
COMPARE
Immigrants from Philippines
Select to Compare
Married-couple Households
Immigrants from Philippines Married-couple Households
49.3%
MARRIED-COUPLE HOUSEHOLDS
99.9/ 100
METRIC RATING
25th/ 347
METRIC RANK
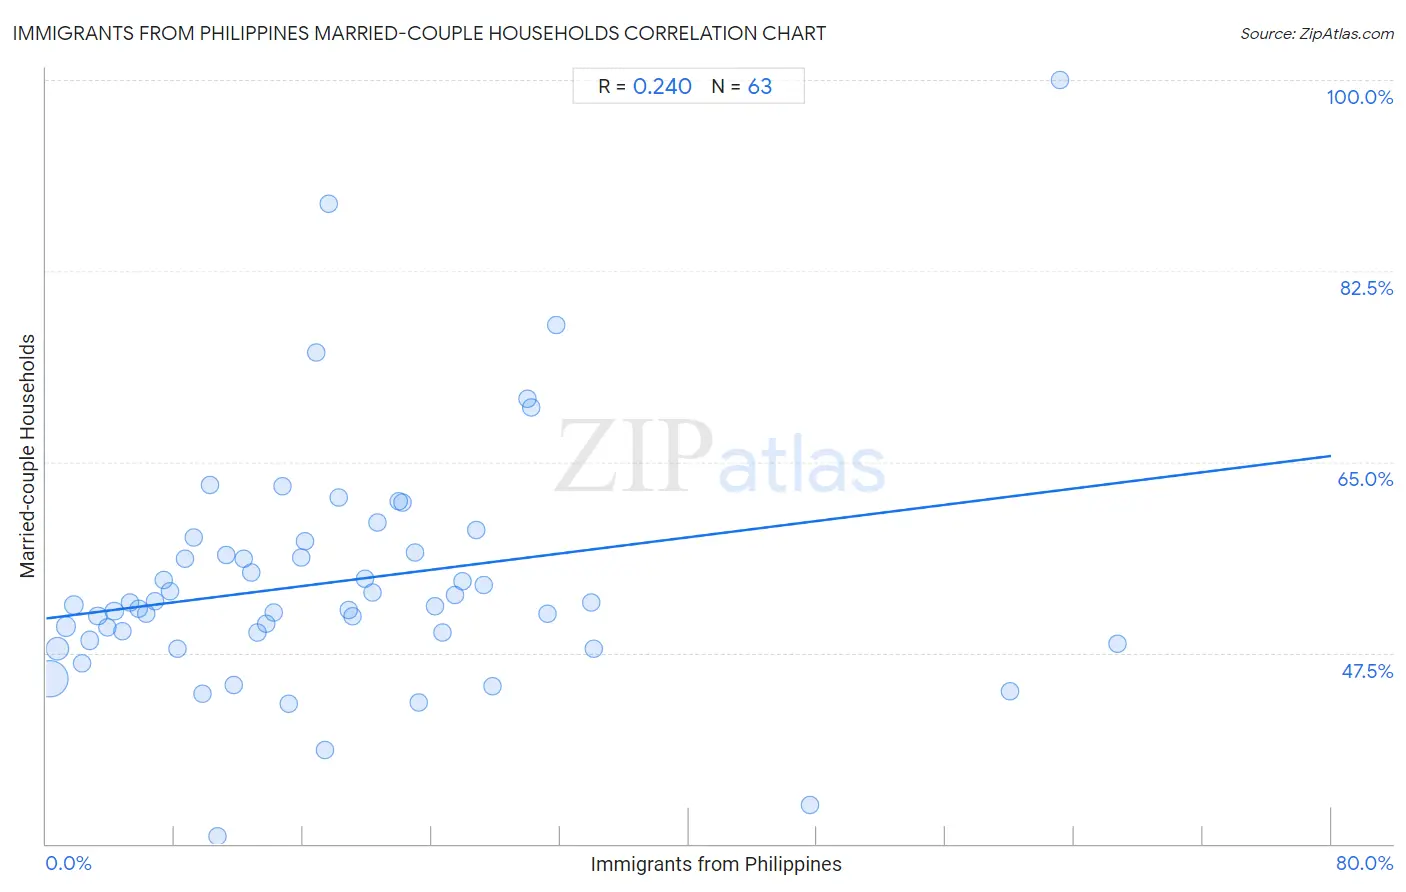
Immigrants from Philippines Married-couple Households Correlation Chart
The statistical analysis conducted on geographies consisting of 471,010,900 people shows a weak positive correlation between the proportion of Immigrants from Philippines and percentage of married-couple family households in the United States with a correlation coefficient (R) of 0.240 and weighted average of 49.3%. On average, for every 1% (one percent) increase in Immigrants from Philippines within a typical geography, there is an increase of 0.19% in percentage of married-couple family households.
It is essential to understand that the correlation between the percentage of Immigrants from Philippines and percentage of married-couple family households does not imply a direct cause-and-effect relationship. It remains uncertain whether the presence of Immigrants from Philippines influences an upward or downward trend in the level of percentage of married-couple family households within an area, or if Immigrants from Philippines simply ended up residing in those areas with higher or lower levels of percentage of married-couple family households due to other factors.
Demographics Similar to Immigrants from Philippines by Married-couple Households
In terms of married-couple households, the demographic groups most similar to Immigrants from Philippines are Immigrants from Scotland (49.3%, a difference of 0.13%), Bhutanese (49.3%, a difference of 0.15%), Czech (49.4%, a difference of 0.19%), Dutch (49.5%, a difference of 0.27%), and Asian (49.5%, a difference of 0.28%).
| Demographics | Rating | Rank | Married-couple Households |
| English | 99.9 /100 | #18 | Exceptional 49.6% |
| Europeans | 99.9 /100 | #19 | Exceptional 49.6% |
| Scandinavians | 99.9 /100 | #20 | Exceptional 49.6% |
| Norwegians | 99.9 /100 | #21 | Exceptional 49.5% |
| Asians | 99.9 /100 | #22 | Exceptional 49.5% |
| Dutch | 99.9 /100 | #23 | Exceptional 49.5% |
| Czechs | 99.9 /100 | #24 | Exceptional 49.4% |
| Immigrants from Philippines | 99.9 /100 | #25 | Exceptional 49.3% |
| Immigrants from Scotland | 99.8 /100 | #26 | Exceptional 49.3% |
| Bhutanese | 99.8 /100 | #27 | Exceptional 49.3% |
| Germans | 99.8 /100 | #28 | Exceptional 49.2% |
| Maltese | 99.8 /100 | #29 | Exceptional 49.2% |
| Bolivians | 99.8 /100 | #30 | Exceptional 49.2% |
| Native Hawaiians | 99.8 /100 | #31 | Exceptional 49.1% |
| Hungarians | 99.8 /100 | #32 | Exceptional 49.1% |
Immigrants from Philippines Married-couple Households Correlation Summary
| Measurement | Immigrants from Philippines Data | Married-couple Households Data |
| Minimum | 0.21% | 30.7% |
| Maximum | 66.7% | 100.0% |
| Range | 66.5% | 69.3% |
| Mean | 18.1% | 54.0% |
| Median | 15.9% | 51.9% |
| Interquartile 25% (IQ1) | 7.7% | 48.6% |
| Interquartile 75% (IQ3) | 24.7% | 56.6% |
| Interquartile Range (IQR) | 17.0% | 8.0% |
| Standard Deviation (Sample) | 14.3% | 11.1% |
| Standard Deviation (Population) | 14.2% | 11.0% |
Correlation Details
| Immigrants from Philippines Percentile | Sample Size | Married-couple Households |
[ 0.0% - 0.5% ] 0.21% | 296,561,945 | 45.1% |
[ 0.5% - 1.0% ] 0.70% | 80,943,269 | 47.9% |
[ 1.0% - 1.5% ] 1.23% | 28,778,638 | 49.9% |
[ 1.5% - 2.0% ] 1.72% | 17,181,005 | 51.9% |
[ 2.0% - 2.5% ] 2.23% | 13,514,848 | 46.5% |
[ 2.5% - 3.0% ] 2.71% | 8,733,445 | 48.6% |
[ 3.0% - 3.5% ] 3.21% | 8,074,244 | 50.9% |
[ 3.5% - 4.0% ] 3.78% | 3,517,550 | 49.8% |
[ 4.0% - 4.5% ] 4.24% | 3,123,273 | 51.3% |
[ 4.5% - 5.0% ] 4.71% | 1,742,619 | 49.5% |
[ 5.0% - 5.5% ] 5.20% | 729,927 | 52.2% |
[ 5.5% - 6.0% ] 5.77% | 1,389,285 | 51.5% |
[ 6.0% - 6.5% ] 6.20% | 992,525 | 51.1% |
[ 6.5% - 7.0% ] 6.76% | 774,924 | 52.2% |
[ 7.0% - 7.5% ] 7.28% | 529,914 | 54.2% |
[ 7.5% - 8.0% ] 7.72% | 876,959 | 53.1% |
[ 8.0% - 8.5% ] 8.17% | 739,884 | 47.8% |
[ 8.5% - 9.0% ] 8.66% | 247,972 | 56.1% |
[ 9.0% - 9.5% ] 9.21% | 276,931 | 58.0% |
[ 9.5% - 10.0% ] 9.71% | 10,198 | 43.8% |
[ 10.0% - 10.5% ] 10.22% | 154,825 | 62.8% |
[ 10.5% - 11.0% ] 10.68% | 1,666 | 30.7% |
[ 11.0% - 11.5% ] 11.23% | 98,961 | 56.5% |
[ 11.5% - 12.0% ] 11.66% | 265,513 | 44.5% |
[ 12.0% - 12.5% ] 12.28% | 424,455 | 56.1% |
[ 12.5% - 13.0% ] 12.79% | 117,644 | 54.9% |
[ 13.0% - 13.5% ] 13.15% | 27,412 | 49.3% |
[ 13.5% - 14.0% ] 13.71% | 184,375 | 50.1% |
[ 14.0% - 14.5% ] 14.15% | 152,755 | 51.2% |
[ 14.5% - 15.0% ] 14.73% | 52,271 | 62.8% |
[ 15.0% - 15.5% ] 15.14% | 3,766 | 42.8% |
[ 15.5% - 16.0% ] 15.88% | 52,871 | 56.3% |
[ 16.0% - 16.5% ] 16.13% | 130,885 | 57.8% |
[ 16.5% - 17.0% ] 16.82% | 220 | 75.0% |
[ 17.0% - 17.5% ] 17.35% | 4,748 | 38.6% |
[ 17.5% - 18.0% ] 17.61% | 426 | 88.7% |
[ 18.0% - 18.5% ] 18.22% | 4,628 | 61.7% |
[ 18.5% - 19.0% ] 18.83% | 13,120 | 51.4% |
[ 19.0% - 19.5% ] 19.07% | 1,500 | 50.8% |
[ 19.5% - 20.0% ] 19.86% | 65,125 | 54.3% |
[ 20.0% - 20.5% ] 20.28% | 208,714 | 53.0% |
[ 20.5% - 21.0% ] 20.61% | 6,531 | 59.4% |
[ 21.5% - 22.0% ] 21.94% | 20,127 | 61.4% |
[ 22.0% - 22.5% ] 22.22% | 2,255 | 61.3% |
[ 22.5% - 23.0% ] 22.94% | 7,179 | 56.6% |
[ 23.0% - 23.5% ] 23.15% | 4,820 | 43.0% |
[ 24.0% - 24.5% ] 24.18% | 28,783 | 51.8% |
[ 24.5% - 25.0% ] 24.71% | 52,328 | 49.4% |
[ 25.0% - 25.5% ] 25.49% | 26,509 | 52.8% |
[ 25.5% - 26.0% ] 25.90% | 72,605 | 54.0% |
[ 26.5% - 27.0% ] 26.79% | 922 | 58.8% |
[ 27.0% - 27.5% ] 27.24% | 16,457 | 53.7% |
[ 27.5% - 28.0% ] 27.75% | 7,994 | 44.4% |
[ 29.5% - 30.0% ] 29.98% | 1,461 | 70.8% |
[ 30.0% - 30.5% ] 30.16% | 63 | 70.0% |
[ 31.0% - 31.5% ] 31.18% | 3,576 | 51.1% |
[ 31.5% - 32.0% ] 31.73% | 375 | 77.6% |
[ 33.5% - 34.0% ] 33.96% | 45,457 | 52.1% |
[ 34.0% - 34.5% ] 34.06% | 4,342 | 47.9% |
[ 47.5% - 48.0% ] 47.52% | 766 | 33.6% |
[ 60.0% - 60.5% ] 60.00% | 35 | 44.0% |
[ 63.0% - 63.5% ] 63.10% | 84 | 100.0% |
[ 66.5% - 67.0% ] 66.69% | 2,996 | 48.3% |