Immigrants from Philippines vs Immigrants from Greece Married-Couple Family Poverty
COMPARE
Immigrants from Philippines
Immigrants from Greece
Married-Couple Family Poverty
Married-Couple Family Poverty Comparison
Immigrants from Philippines
Immigrants from Greece
4.8%
MARRIED-COUPLE FAMILY POVERTY
94.6/ 100
METRIC RATING
118th/ 347
METRIC RANK
4.5%
MARRIED-COUPLE FAMILY POVERTY
98.9/ 100
METRIC RATING
81st/ 347
METRIC RANK
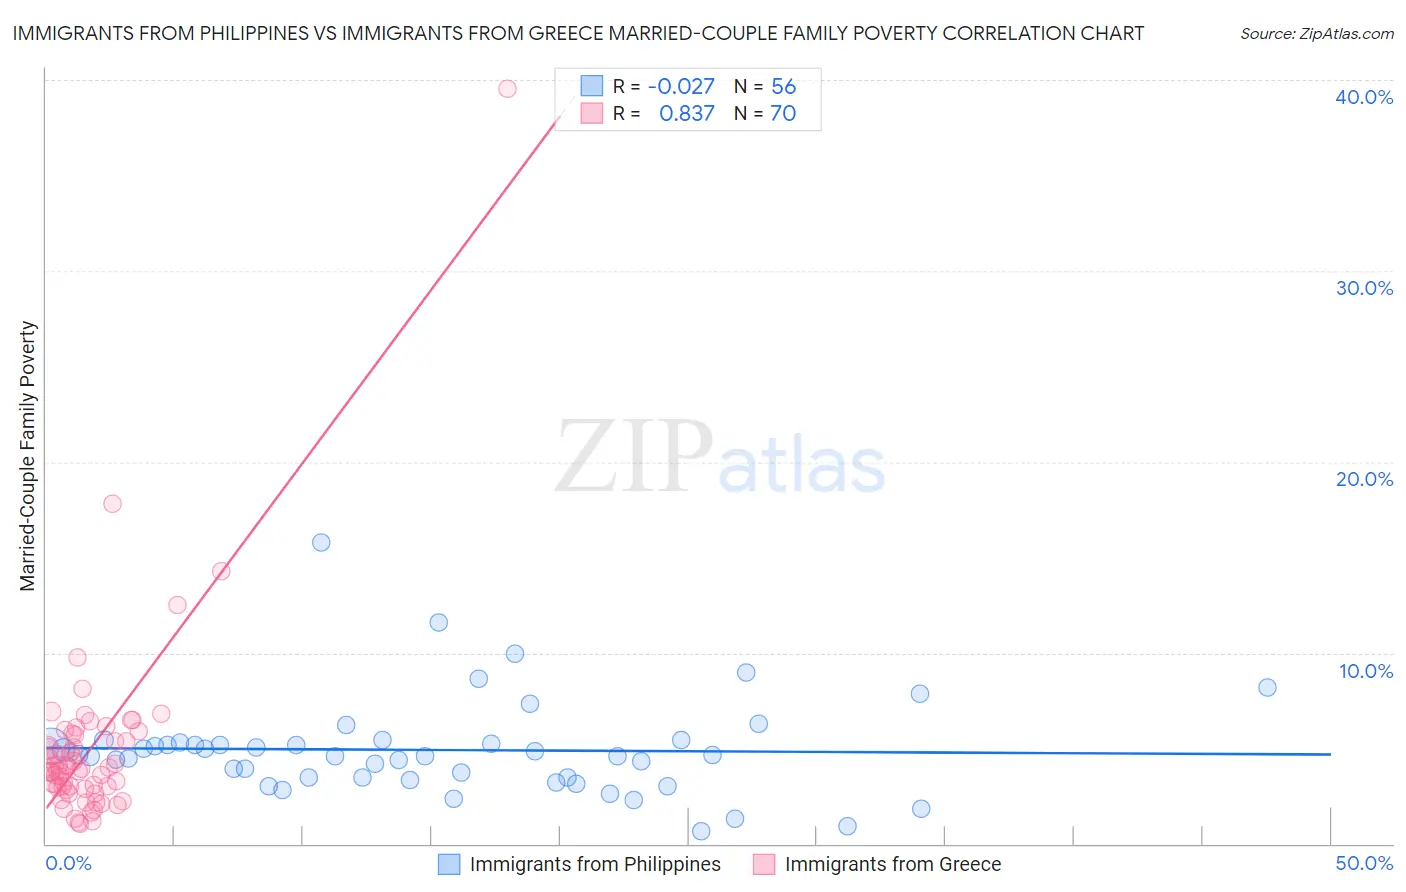
Immigrants from Philippines vs Immigrants from Greece Married-Couple Family Poverty Correlation Chart
The statistical analysis conducted on geographies consisting of 465,939,679 people shows no correlation between the proportion of Immigrants from Philippines and poverty level among married-couple families in the United States with a correlation coefficient (R) of -0.027 and weighted average of 4.8%. Similarly, the statistical analysis conducted on geographies consisting of 215,639,797 people shows a very strong positive correlation between the proportion of Immigrants from Greece and poverty level among married-couple families in the United States with a correlation coefficient (R) of 0.837 and weighted average of 4.5%, a difference of 5.5%.
Married-Couple Family Poverty Correlation Summary
| Measurement | Immigrants from Philippines | Immigrants from Greece |
| Minimum | 0.63% | 1.1% |
| Maximum | 15.8% | 39.5% |
| Range | 15.2% | 38.5% |
| Mean | 4.9% | 5.0% |
| Median | 4.6% | 3.9% |
| Interquartile 25% (IQ1) | 3.5% | 3.0% |
| Interquartile 75% (IQ3) | 5.3% | 5.7% |
| Interquartile Range (IQR) | 1.8% | 2.7% |
| Standard Deviation (Sample) | 2.5% | 5.1% |
| Standard Deviation (Population) | 2.5% | 5.0% |
Similar Demographics by Married-Couple Family Poverty
Demographics Similar to Immigrants from Philippines by Married-Couple Family Poverty
In terms of married-couple family poverty, the demographic groups most similar to Immigrants from Philippines are Kenyan (4.8%, a difference of 0.020%), Celtic (4.8%, a difference of 0.12%), Taiwanese (4.8%, a difference of 0.13%), Immigrants from Indonesia (4.8%, a difference of 0.28%), and Immigrants from Eastern Asia (4.8%, a difference of 0.37%).
| Demographics | Rating | Rank | Married-Couple Family Poverty |
| Pakistanis | 96.2 /100 | #111 | Exceptional 4.7% |
| Tongans | 95.9 /100 | #112 | Exceptional 4.7% |
| Immigrants | Nepal | 95.9 /100 | #113 | Exceptional 4.7% |
| Immigrants | Indonesia | 95.1 /100 | #114 | Exceptional 4.8% |
| Taiwanese | 94.8 /100 | #115 | Exceptional 4.8% |
| Celtics | 94.8 /100 | #116 | Exceptional 4.8% |
| Kenyans | 94.7 /100 | #117 | Exceptional 4.8% |
| Immigrants | Philippines | 94.6 /100 | #118 | Exceptional 4.8% |
| Immigrants | Eastern Asia | 94.0 /100 | #119 | Exceptional 4.8% |
| Immigrants | Southern Europe | 93.4 /100 | #120 | Exceptional 4.8% |
| Indians (Asian) | 93.2 /100 | #121 | Exceptional 4.8% |
| Whites/Caucasians | 93.1 /100 | #122 | Exceptional 4.8% |
| Jordanians | 93.1 /100 | #123 | Exceptional 4.8% |
| Romanians | 92.5 /100 | #124 | Exceptional 4.8% |
| Immigrants | Bosnia and Herzegovina | 92.5 /100 | #125 | Exceptional 4.8% |
Demographics Similar to Immigrants from Greece by Married-Couple Family Poverty
In terms of married-couple family poverty, the demographic groups most similar to Immigrants from Greece are Icelander (4.5%, a difference of 0.14%), Immigrants from Iran (4.5%, a difference of 0.20%), Canadian (4.5%, a difference of 0.25%), Immigrants from Denmark (4.6%, a difference of 0.41%), and Scotch-Irish (4.5%, a difference of 0.44%).
| Demographics | Rating | Rank | Married-Couple Family Poverty |
| Immigrants | Austria | 99.2 /100 | #74 | Exceptional 4.5% |
| Cambodians | 99.2 /100 | #75 | Exceptional 4.5% |
| Immigrants | South Africa | 99.1 /100 | #76 | Exceptional 4.5% |
| Immigrants | Latvia | 99.1 /100 | #77 | Exceptional 4.5% |
| Scotch-Irish | 99.1 /100 | #78 | Exceptional 4.5% |
| Immigrants | Iran | 99.0 /100 | #79 | Exceptional 4.5% |
| Icelanders | 99.0 /100 | #80 | Exceptional 4.5% |
| Immigrants | Greece | 98.9 /100 | #81 | Exceptional 4.5% |
| Canadians | 98.8 /100 | #82 | Exceptional 4.5% |
| Immigrants | Denmark | 98.8 /100 | #83 | Exceptional 4.6% |
| Immigrants | Croatia | 98.7 /100 | #84 | Exceptional 4.6% |
| South Africans | 98.7 /100 | #85 | Exceptional 4.6% |
| Immigrants | Turkey | 98.6 /100 | #86 | Exceptional 4.6% |
| Immigrants | North Macedonia | 98.6 /100 | #87 | Exceptional 4.6% |
| Bolivians | 98.6 /100 | #88 | Exceptional 4.6% |