Immigrants from Philippines GED/Equivalency
COMPARE
Immigrants from Philippines
Select to Compare
GED/Equivalency
Immigrants from Philippines GED/Equivalency
84.8%
GED/EQUIVALENCY
10.0/ 100
METRIC RATING
213th/ 347
METRIC RANK
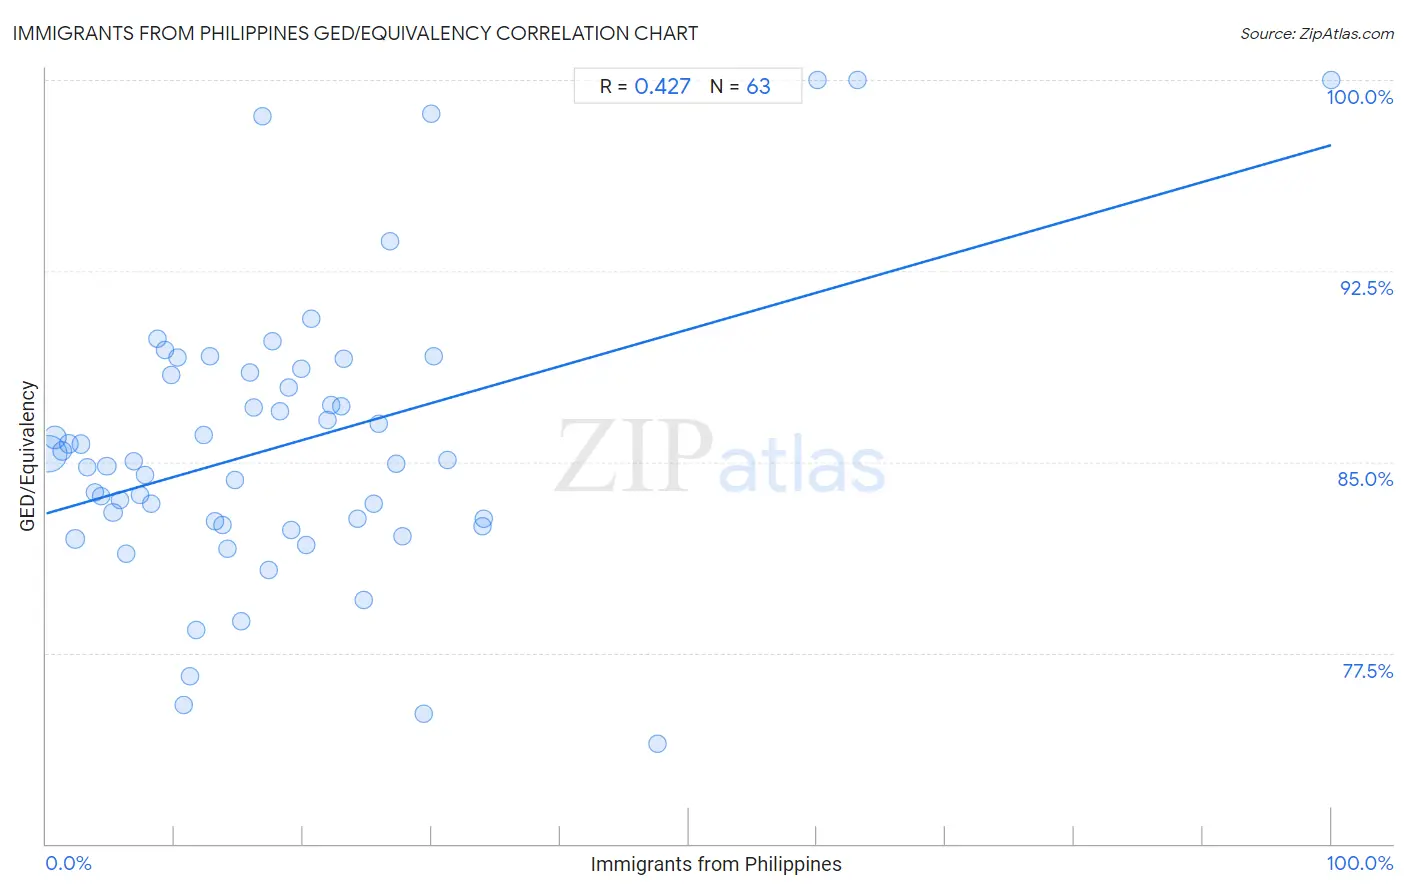
Immigrants from Philippines GED/Equivalency Correlation Chart
The statistical analysis conducted on geographies consisting of 471,300,535 people shows a moderate positive correlation between the proportion of Immigrants from Philippines and percentage of population with at least ged/equivalency education in the United States with a correlation coefficient (R) of 0.427 and weighted average of 84.8%. On average, for every 1% (one percent) increase in Immigrants from Philippines within a typical geography, there is an increase of 0.14% in percentage of population with at least ged/equivalency education.
It is essential to understand that the correlation between the percentage of Immigrants from Philippines and percentage of population with at least ged/equivalency education does not imply a direct cause-and-effect relationship. It remains uncertain whether the presence of Immigrants from Philippines influences an upward or downward trend in the level of percentage of population with at least ged/equivalency education within an area, or if Immigrants from Philippines simply ended up residing in those areas with higher or lower levels of percentage of population with at least ged/equivalency education due to other factors.
Demographics Similar to Immigrants from Philippines by GED/Equivalency
In terms of ged/equivalency, the demographic groups most similar to Immigrants from Philippines are Immigrants from Somalia (84.8%, a difference of 0.030%), Osage (84.8%, a difference of 0.030%), South American (84.8%, a difference of 0.050%), Peruvian (84.7%, a difference of 0.050%), and Immigrants from Micronesia (84.7%, a difference of 0.080%).
| Demographics | Rating | Rank | GED/Equivalency |
| Samoans | 13.7 /100 | #206 | Poor 84.9% |
| Hmong | 13.1 /100 | #207 | Poor 84.9% |
| Marshallese | 12.5 /100 | #208 | Poor 84.9% |
| Colombians | 12.3 /100 | #209 | Poor 84.9% |
| Immigrants from Cameroon | 12.1 /100 | #210 | Poor 84.9% |
| South Americans | 10.9 /100 | #211 | Poor 84.8% |
| Immigrants from Somalia | 10.6 /100 | #212 | Poor 84.8% |
| Immigrants from Philippines | 10.0 /100 | #213 | Poor 84.8% |
| Osage | 9.5 /100 | #214 | Tragic 84.8% |
| Peruvians | 9.2 /100 | #215 | Tragic 84.7% |
| Immigrants from Micronesia | 8.7 /100 | #216 | Tragic 84.7% |
| Nigerians | 8.6 /100 | #217 | Tragic 84.7% |
| Alaska Natives | 8.6 /100 | #218 | Tragic 84.7% |
| Potawatomi | 8.2 /100 | #219 | Tragic 84.7% |
| Americans | 8.2 /100 | #220 | Tragic 84.7% |
Immigrants from Philippines GED/Equivalency Correlation Summary
| Measurement | Immigrants from Philippines Data | GED/Equivalency Data |
| Minimum | 0.21% | 73.9% |
| Maximum | 100.0% | 100.0% |
| Range | 99.8% | 26.1% |
| Mean | 18.6% | 85.7% |
| Median | 15.9% | 85.0% |
| Interquartile 25% (IQ1) | 7.7% | 82.5% |
| Interquartile 75% (IQ3) | 24.7% | 88.5% |
| Interquartile Range (IQR) | 17.0% | 6.0% |
| Standard Deviation (Sample) | 16.5% | 5.6% |
| Standard Deviation (Population) | 16.4% | 5.6% |
Correlation Details
| Immigrants from Philippines Percentile | Sample Size | GED/Equivalency |
[ 0.0% - 0.5% ] 0.21% | 296,730,030 | 85.3% |
[ 0.5% - 1.0% ] 0.70% | 81,001,551 | 86.0% |
[ 1.0% - 1.5% ] 1.23% | 28,816,619 | 85.4% |
[ 1.5% - 2.0% ] 1.72% | 17,182,637 | 85.7% |
[ 2.0% - 2.5% ] 2.23% | 13,519,249 | 82.0% |
[ 2.5% - 3.0% ] 2.71% | 8,738,143 | 85.7% |
[ 3.0% - 3.5% ] 3.21% | 8,088,753 | 84.8% |
[ 3.5% - 4.0% ] 3.78% | 3,518,137 | 83.8% |
[ 4.0% - 4.5% ] 4.24% | 3,123,273 | 83.6% |
[ 4.5% - 5.0% ] 4.71% | 1,742,853 | 84.8% |
[ 5.0% - 5.5% ] 5.20% | 729,927 | 83.0% |
[ 5.5% - 6.0% ] 5.77% | 1,389,285 | 83.5% |
[ 6.0% - 6.5% ] 6.20% | 992,822 | 81.4% |
[ 6.5% - 7.0% ] 6.76% | 774,924 | 85.0% |
[ 7.0% - 7.5% ] 7.28% | 529,914 | 83.7% |
[ 7.5% - 8.0% ] 7.72% | 876,959 | 84.5% |
[ 8.0% - 8.5% ] 8.17% | 739,884 | 83.4% |
[ 8.5% - 9.0% ] 8.66% | 247,972 | 89.9% |
[ 9.0% - 9.5% ] 9.21% | 276,931 | 89.4% |
[ 9.5% - 10.0% ] 9.71% | 10,409 | 88.4% |
[ 10.0% - 10.5% ] 10.22% | 154,825 | 89.1% |
[ 10.5% - 11.0% ] 10.68% | 1,666 | 75.5% |
[ 11.0% - 11.5% ] 11.23% | 100,104 | 76.6% |
[ 11.5% - 12.0% ] 11.66% | 265,513 | 78.4% |
[ 12.0% - 12.5% ] 12.28% | 424,455 | 86.1% |
[ 12.5% - 13.0% ] 12.79% | 117,816 | 89.2% |
[ 13.0% - 13.5% ] 13.15% | 27,412 | 82.7% |
[ 13.5% - 14.0% ] 13.71% | 184,375 | 82.5% |
[ 14.0% - 14.5% ] 14.15% | 152,755 | 81.6% |
[ 14.5% - 15.0% ] 14.73% | 52,271 | 84.3% |
[ 15.0% - 15.5% ] 15.14% | 3,766 | 78.7% |
[ 15.5% - 16.0% ] 15.88% | 52,871 | 88.5% |
[ 16.0% - 16.5% ] 16.13% | 130,885 | 87.1% |
[ 16.5% - 17.0% ] 16.82% | 220 | 98.6% |
[ 17.0% - 17.5% ] 17.35% | 4,748 | 80.8% |
[ 17.5% - 18.0% ] 17.61% | 426 | 89.7% |
[ 18.0% - 18.5% ] 18.21% | 4,898 | 87.0% |
[ 18.5% - 19.0% ] 18.83% | 13,347 | 87.9% |
[ 19.0% - 19.5% ] 19.07% | 1,500 | 82.3% |
[ 19.5% - 20.0% ] 19.86% | 65,125 | 88.7% |
[ 20.0% - 20.5% ] 20.28% | 208,714 | 81.7% |
[ 20.5% - 21.0% ] 20.61% | 6,531 | 90.6% |
[ 21.5% - 22.0% ] 21.94% | 20,127 | 86.6% |
[ 22.0% - 22.5% ] 22.22% | 2,255 | 87.2% |
[ 22.5% - 23.0% ] 22.94% | 7,179 | 87.2% |
[ 23.0% - 23.5% ] 23.15% | 4,820 | 89.0% |
[ 24.0% - 24.5% ] 24.18% | 28,783 | 82.8% |
[ 24.5% - 25.0% ] 24.71% | 52,328 | 79.6% |
[ 25.0% - 25.5% ] 25.49% | 26,509 | 83.4% |
[ 25.5% - 26.0% ] 25.90% | 72,605 | 86.5% |
[ 26.5% - 27.0% ] 26.79% | 922 | 93.7% |
[ 27.0% - 27.5% ] 27.24% | 16,457 | 84.9% |
[ 27.5% - 28.0% ] 27.75% | 7,994 | 82.1% |
[ 29.0% - 29.5% ] 29.41% | 255 | 75.1% |
[ 29.5% - 30.0% ] 29.98% | 1,461 | 98.7% |
[ 30.0% - 30.5% ] 30.16% | 63 | 89.1% |
[ 31.0% - 31.5% ] 31.18% | 3,576 | 85.1% |
[ 33.5% - 34.0% ] 33.96% | 45,457 | 82.5% |
[ 34.0% - 34.5% ] 34.06% | 4,342 | 82.8% |
[ 47.5% - 48.0% ] 47.52% | 766 | 73.9% |
[ 60.0% - 60.5% ] 60.00% | 35 | 100.0% |
[ 63.0% - 63.5% ] 63.10% | 84 | 100.0% |
[ 99.5% - 100.0% ] 100.00% | 22 | 100.0% |