Immigrants from Philippines Wage/Income Gap
COMPARE
Immigrants from Philippines
Select to Compare
Wage/Income Gap
Immigrants from Philippines Wage/Income Gap
24.7%
WAGE/INCOME GAP
93.0/ 100
METRIC RATING
131st/ 347
METRIC RANK
Immigrants from Philippines Wage/Income Gap Correlation Chart
The statistical analysis conducted on geographies consisting of 470,842,100 people shows a slight positive correlation between the proportion of Immigrants from Philippines and wage/income gap percentage in the United States with a correlation coefficient (R) of 0.057 and weighted average of 24.7%. On average, for every 1% (one percent) increase in Immigrants from Philippines within a typical geography, there is an increase of 0.032% in wage/income gap percentage.
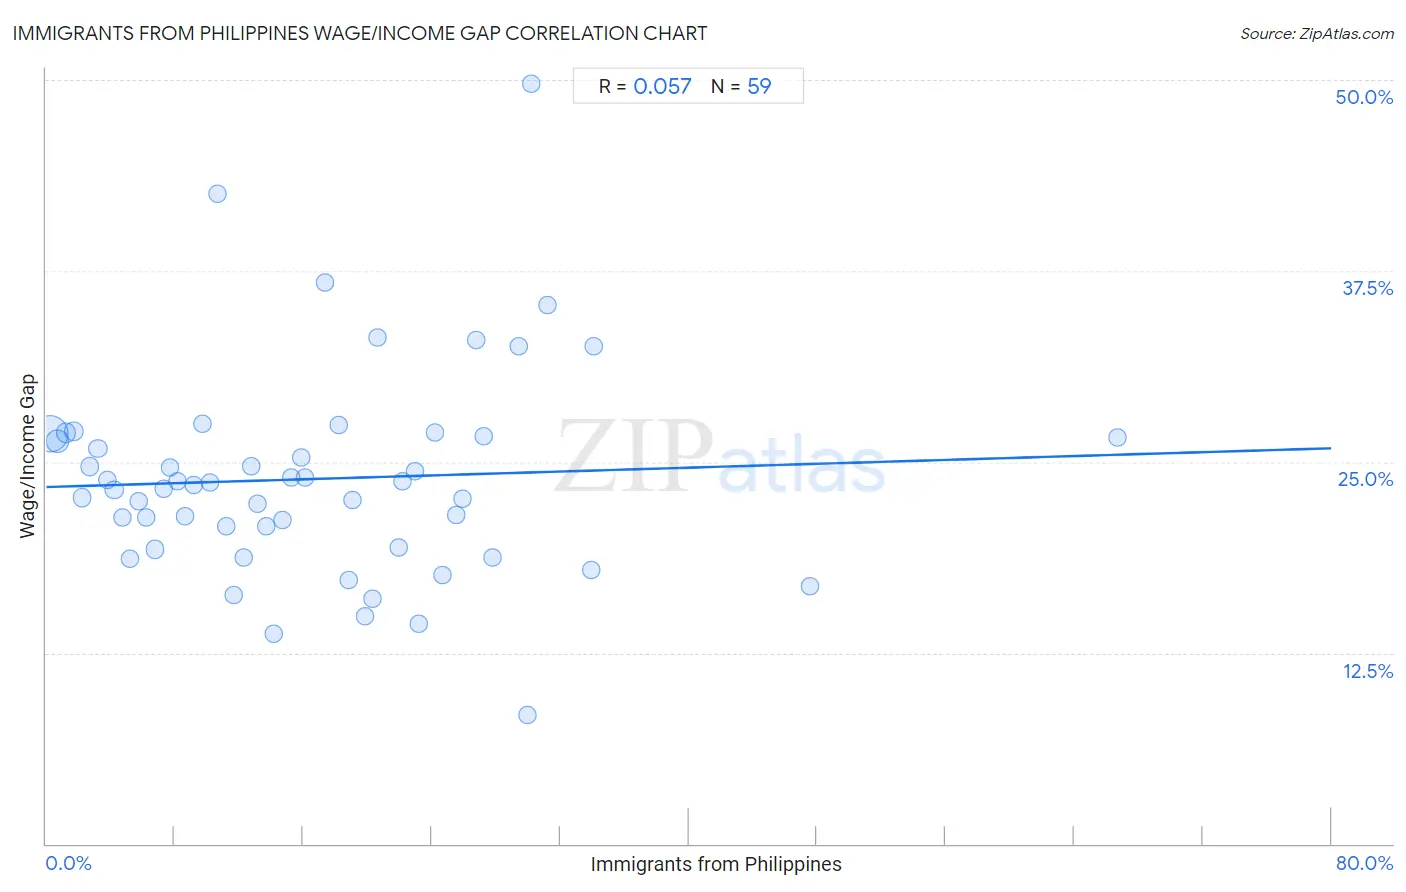
It is essential to understand that the correlation between the percentage of Immigrants from Philippines and wage/income gap percentage does not imply a direct cause-and-effect relationship. It remains uncertain whether the presence of Immigrants from Philippines influences an upward or downward trend in the level of wage/income gap percentage within an area, or if Immigrants from Philippines simply ended up residing in those areas with higher or lower levels of wage/income gap percentage due to other factors.
Demographics Similar to Immigrants from Philippines by Wage/Income Gap
In terms of wage/income gap, the demographic groups most similar to Immigrants from Philippines are Alsatian (24.7%, a difference of 0.070%), Yup'ik (24.7%, a difference of 0.090%), Immigrants from Central America (24.6%, a difference of 0.15%), Immigrants from Costa Rica (24.7%, a difference of 0.15%), and Colombian (24.7%, a difference of 0.15%).
| Demographics | Rating | Rank | Wage/Income Gap |
| Immigrants from South America | 93.9 /100 | #124 | Exceptional 24.6% |
| Spanish Americans | 93.8 /100 | #125 | Exceptional 24.6% |
| Immigrants from Uruguay | 93.8 /100 | #126 | Exceptional 24.6% |
| German Russians | 93.7 /100 | #127 | Exceptional 24.6% |
| Immigrants from Central America | 93.5 /100 | #128 | Exceptional 24.6% |
| Yup'ik | 93.3 /100 | #129 | Exceptional 24.7% |
| Alsatians | 93.2 /100 | #130 | Exceptional 24.7% |
| Immigrants from Philippines | 93.0 /100 | #131 | Exceptional 24.7% |
| Immigrants from Costa Rica | 92.4 /100 | #132 | Exceptional 24.7% |
| Colombians | 92.4 /100 | #133 | Exceptional 24.7% |
| Mexican American Indians | 92.2 /100 | #134 | Exceptional 24.7% |
| South American Indians | 92.0 /100 | #135 | Exceptional 24.7% |
| Armenians | 91.3 /100 | #136 | Exceptional 24.8% |
| Immigrants from South Eastern Asia | 90.9 /100 | #137 | Exceptional 24.8% |
| Immigrants from Bosnia and Herzegovina | 90.1 /100 | #138 | Exceptional 24.8% |
Immigrants from Philippines Wage/Income Gap Correlation Summary
| Measurement | Immigrants from Philippines Data | Wage/Income Gap Data |
| Minimum | 0.21% | 8.4% |
| Maximum | 66.7% | 49.7% |
| Range | 66.5% | 41.3% |
| Mean | 16.6% | 23.9% |
| Median | 14.7% | 23.5% |
| Interquartile 25% (IQ1) | 7.3% | 19.4% |
| Interquartile 75% (IQ3) | 24.2% | 26.6% |
| Interquartile Range (IQR) | 16.9% | 7.3% |
| Standard Deviation (Sample) | 12.3% | 6.8% |
| Standard Deviation (Population) | 12.1% | 6.8% |
Correlation Details
| Immigrants from Philippines Percentile | Sample Size | Wage/Income Gap |
[ 0.0% - 0.5% ] 0.21% | 296,564,786 | 26.9% |
[ 0.5% - 1.0% ] 0.70% | 80,907,281 | 26.3% |
[ 1.0% - 1.5% ] 1.23% | 28,763,119 | 26.9% |
[ 1.5% - 2.0% ] 1.72% | 17,135,073 | 27.0% |
[ 2.0% - 2.5% ] 2.23% | 13,493,823 | 22.6% |
[ 2.5% - 3.0% ] 2.71% | 8,720,701 | 24.7% |
[ 3.0% - 3.5% ] 3.21% | 8,076,596 | 25.9% |
[ 3.5% - 4.0% ] 3.78% | 3,512,259 | 23.8% |
[ 4.0% - 4.5% ] 4.24% | 3,115,668 | 23.2% |
[ 4.5% - 5.0% ] 4.71% | 1,738,513 | 21.4% |
[ 5.0% - 5.5% ] 5.20% | 726,662 | 18.6% |
[ 5.5% - 6.0% ] 5.77% | 1,384,530 | 22.4% |
[ 6.0% - 6.5% ] 6.20% | 990,292 | 21.4% |
[ 6.5% - 7.0% ] 6.76% | 774,880 | 19.3% |
[ 7.0% - 7.5% ] 7.28% | 528,269 | 23.2% |
[ 7.5% - 8.0% ] 7.72% | 874,838 | 24.6% |
[ 8.0% - 8.5% ] 8.17% | 738,462 | 23.7% |
[ 8.5% - 9.0% ] 8.66% | 247,711 | 21.5% |
[ 9.0% - 9.5% ] 9.21% | 276,616 | 23.5% |
[ 9.5% - 10.0% ] 9.71% | 10,198 | 27.5% |
[ 10.0% - 10.5% ] 10.22% | 153,025 | 23.6% |
[ 10.5% - 11.0% ] 10.68% | 1,666 | 42.6% |
[ 11.0% - 11.5% ] 11.23% | 100,104 | 20.8% |
[ 11.5% - 12.0% ] 11.66% | 265,513 | 16.3% |
[ 12.0% - 12.5% ] 12.28% | 423,749 | 18.7% |
[ 12.5% - 13.0% ] 12.79% | 117,644 | 24.7% |
[ 13.0% - 13.5% ] 13.15% | 27,278 | 22.2% |
[ 13.5% - 14.0% ] 13.71% | 184,375 | 20.8% |
[ 14.0% - 14.5% ] 14.15% | 152,755 | 13.7% |
[ 14.5% - 15.0% ] 14.73% | 52,271 | 21.2% |
[ 15.0% - 15.5% ] 15.25% | 1,462 | 23.9% |
[ 15.5% - 16.0% ] 15.88% | 52,871 | 25.2% |
[ 16.0% - 16.5% ] 16.13% | 130,052 | 24.0% |
[ 17.0% - 17.5% ] 17.36% | 4,598 | 36.7% |
[ 18.0% - 18.5% ] 18.22% | 4,628 | 27.4% |
[ 18.5% - 19.0% ] 18.84% | 12,906 | 17.3% |
[ 19.0% - 19.5% ] 19.04% | 1,376 | 22.5% |
[ 19.5% - 20.0% ] 19.86% | 65,125 | 14.9% |
[ 20.0% - 20.5% ] 20.28% | 208,714 | 16.0% |
[ 20.5% - 21.0% ] 20.61% | 6,469 | 33.2% |
[ 21.5% - 22.0% ] 21.94% | 20,127 | 19.4% |
[ 22.0% - 22.5% ] 22.22% | 2,255 | 23.7% |
[ 22.5% - 23.0% ] 22.94% | 7,179 | 24.4% |
[ 23.0% - 23.5% ] 23.16% | 3,800 | 14.4% |
[ 24.0% - 24.5% ] 24.18% | 28,090 | 27.0% |
[ 24.5% - 25.0% ] 24.71% | 52,328 | 17.6% |
[ 25.0% - 25.5% ] 25.49% | 26,013 | 21.5% |
[ 25.5% - 26.0% ] 25.90% | 72,605 | 22.6% |
[ 26.5% - 27.0% ] 26.79% | 922 | 33.0% |
[ 27.0% - 27.5% ] 27.24% | 16,457 | 26.6% |
[ 27.5% - 28.0% ] 27.79% | 6,550 | 18.7% |
[ 29.0% - 29.5% ] 29.41% | 255 | 32.6% |
[ 29.5% - 30.0% ] 29.98% | 1,461 | 8.4% |
[ 30.0% - 30.5% ] 30.16% | 63 | 49.7% |
[ 31.0% - 31.5% ] 31.18% | 3,576 | 35.3% |
[ 33.5% - 34.0% ] 33.96% | 45,457 | 17.9% |
[ 34.0% - 34.5% ] 34.06% | 4,342 | 32.6% |
[ 47.5% - 48.0% ] 47.52% | 766 | 16.8% |
[ 66.5% - 67.0% ] 66.69% | 2,996 | 26.6% |