Assyrian/Chaldean/Syriac Disability Age 5 to 17
COMPARE
Assyrian/Chaldean/Syriac
Select to Compare
Disability Age 5 to 17
Assyrian/Chaldean/Syriac Disability Age 5 to 17
5.0%
DISABILITY | AGE 5 TO 17
100.0/ 100
METRIC RATING
46th/ 347
METRIC RANK
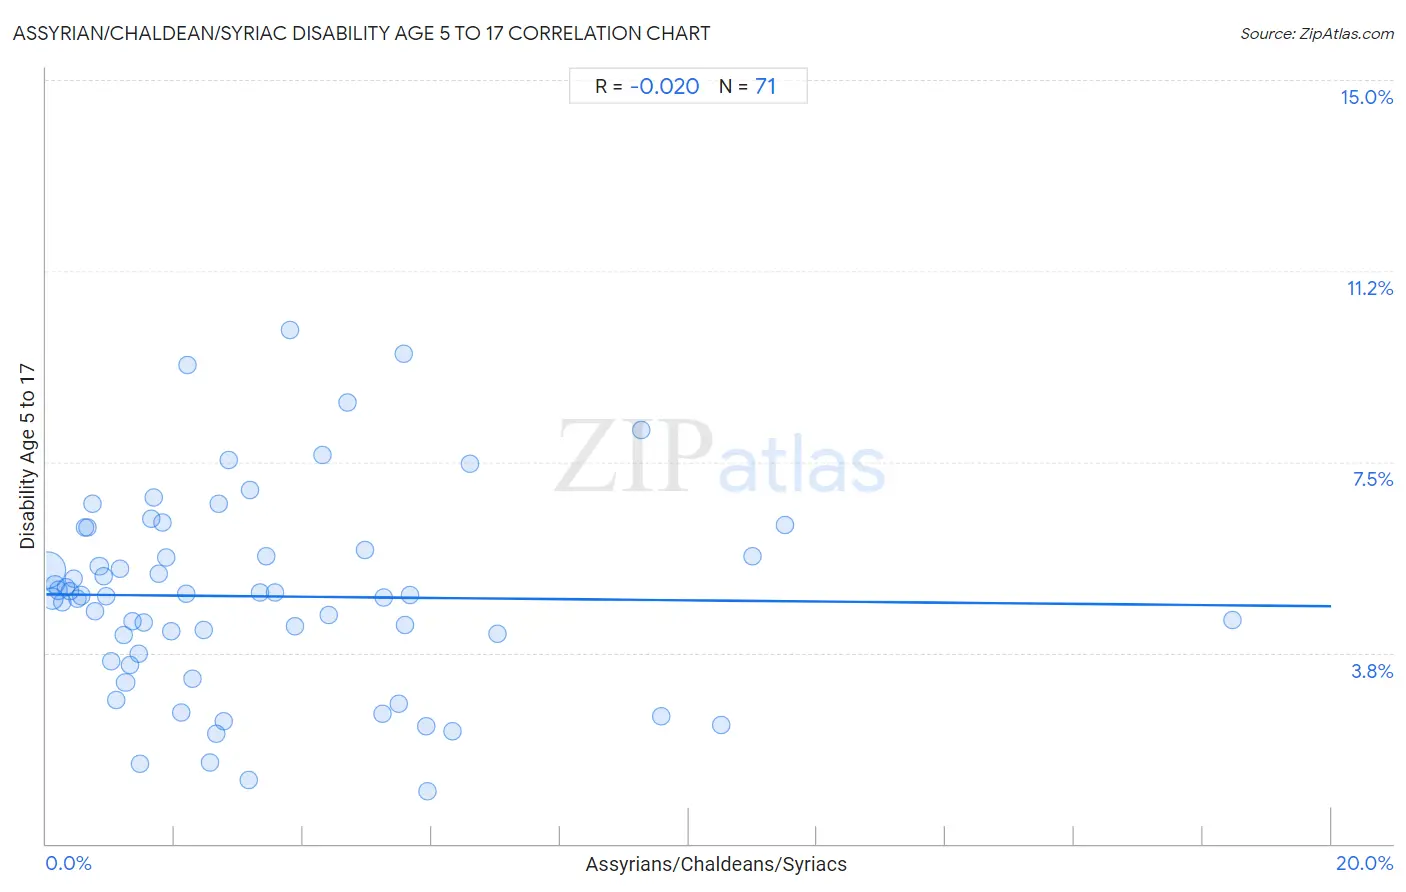
Assyrian/Chaldean/Syriac Disability Age 5 to 17 Correlation Chart
The statistical analysis conducted on geographies consisting of 110,004,122 people shows no correlation between the proportion of Assyrians/Chaldeans/Syriacs and percentage of population with a disability between the ages 5 and 17 in the United States with a correlation coefficient (R) of -0.020 and weighted average of 5.0%. On average, for every 1% (one percent) increase in Assyrians/Chaldeans/Syriacs within a typical geography, there is a decrease of 0.012% in percentage of population with a disability between the ages 5 and 17.
It is essential to understand that the correlation between the percentage of Assyrians/Chaldeans/Syriacs and percentage of population with a disability between the ages 5 and 17 does not imply a direct cause-and-effect relationship. It remains uncertain whether the presence of Assyrians/Chaldeans/Syriacs influences an upward or downward trend in the level of percentage of population with a disability between the ages 5 and 17 within an area, or if Assyrians/Chaldeans/Syriacs simply ended up residing in those areas with higher or lower levels of percentage of population with a disability between the ages 5 and 17 due to other factors.
Demographics Similar to Assyrians/Chaldeans/Syriacs by Disability Age 5 to 17
In terms of disability age 5 to 17, the demographic groups most similar to Assyrians/Chaldeans/Syriacs are Tongan (5.0%, a difference of 0.070%), Vietnamese (5.1%, a difference of 0.13%), Egyptian (5.0%, a difference of 0.14%), Immigrants from Russia (5.0%, a difference of 0.18%), and Korean (5.1%, a difference of 0.31%).
| Demographics | Rating | Rank | Disability Age 5 to 17 |
| Immigrants from Argentina | 100.0 /100 | #39 | Exceptional 5.0% |
| Okinawans | 100.0 /100 | #40 | Exceptional 5.0% |
| Immigrants from Australia | 100.0 /100 | #41 | Exceptional 5.0% |
| Immigrants from Sri Lanka | 100.0 /100 | #42 | Exceptional 5.0% |
| Immigrants from Russia | 100.0 /100 | #43 | Exceptional 5.0% |
| Egyptians | 100.0 /100 | #44 | Exceptional 5.0% |
| Tongans | 100.0 /100 | #45 | Exceptional 5.0% |
| Assyrians/Chaldeans/Syriacs | 100.0 /100 | #46 | Exceptional 5.0% |
| Vietnamese | 100.0 /100 | #47 | Exceptional 5.1% |
| Koreans | 100.0 /100 | #48 | Exceptional 5.1% |
| Immigrants from Western Asia | 100.0 /100 | #49 | Exceptional 5.1% |
| Argentineans | 99.9 /100 | #50 | Exceptional 5.1% |
| Turks | 99.9 /100 | #51 | Exceptional 5.1% |
| Immigrants from Fiji | 99.9 /100 | #52 | Exceptional 5.1% |
| Immigrants from Lithuania | 99.9 /100 | #53 | Exceptional 5.1% |
Assyrian/Chaldean/Syriac Disability Age 5 to 17 Correlation Summary
| Measurement | Assyrian/Chaldean/Syriac Data | Disability Age 5 to 17 Data |
| Minimum | 0.017% | 1.0% |
| Maximum | 18.5% | 10.1% |
| Range | 18.5% | 9.0% |
| Mean | 3.3% | 4.9% |
| Median | 2.2% | 4.9% |
| Interquartile 25% (IQ1) | 1.0% | 3.6% |
| Interquartile 75% (IQ3) | 5.0% | 5.8% |
| Interquartile Range (IQR) | 3.9% | 2.2% |
| Standard Deviation (Sample) | 3.3% | 2.0% |
| Standard Deviation (Population) | 3.3% | 1.9% |
Correlation Details
| Assyrian/Chaldean/Syriac Percentile | Sample Size | Disability Age 5 to 17 |
[ 0.0% - 0.5% ] 0.017% | 76,528,372 | 5.4% |
[ 0.0% - 0.5% ] 0.088% | 15,722,424 | 4.8% |
[ 0.0% - 0.5% ] 0.14% | 4,930,017 | 5.1% |
[ 0.0% - 0.5% ] 0.19% | 2,664,651 | 5.0% |
[ 0.0% - 0.5% ] 0.25% | 1,561,302 | 4.7% |
[ 0.0% - 0.5% ] 0.31% | 2,269,591 | 5.0% |
[ 0.0% - 0.5% ] 0.38% | 419,262 | 5.0% |
[ 0.0% - 0.5% ] 0.43% | 711,221 | 5.2% |
[ 0.0% - 0.5% ] 0.49% | 410,879 | 4.8% |
[ 0.5% - 1.0% ] 0.54% | 363,225 | 4.9% |
[ 0.5% - 1.0% ] 0.61% | 222,035 | 6.2% |
[ 0.5% - 1.0% ] 0.65% | 153,305 | 6.2% |
[ 0.5% - 1.0% ] 0.71% | 158,089 | 6.7% |
[ 0.5% - 1.0% ] 0.76% | 92,151 | 4.6% |
[ 0.5% - 1.0% ] 0.83% | 252,842 | 5.4% |
[ 0.5% - 1.0% ] 0.89% | 448,550 | 5.3% |
[ 0.5% - 1.0% ] 0.94% | 355,589 | 4.9% |
[ 1.0% - 1.5% ] 1.01% | 121,482 | 3.6% |
[ 1.0% - 1.5% ] 1.09% | 67,216 | 2.8% |
[ 1.0% - 1.5% ] 1.14% | 55,734 | 5.4% |
[ 1.0% - 1.5% ] 1.20% | 24,044 | 4.1% |
[ 1.0% - 1.5% ] 1.24% | 112,686 | 3.2% |
[ 1.0% - 1.5% ] 1.31% | 65,237 | 3.5% |
[ 1.0% - 1.5% ] 1.35% | 148,615 | 4.4% |
[ 1.0% - 1.5% ] 1.43% | 43,921 | 3.7% |
[ 1.0% - 1.5% ] 1.45% | 79,187 | 1.6% |
[ 1.5% - 2.0% ] 1.52% | 106,355 | 4.4% |
[ 1.5% - 2.0% ] 1.64% | 53,590 | 6.4% |
[ 1.5% - 2.0% ] 1.68% | 105,302 | 6.8% |
[ 1.5% - 2.0% ] 1.75% | 24,626 | 5.3% |
[ 1.5% - 2.0% ] 1.82% | 16,823 | 6.3% |
[ 1.5% - 2.0% ] 1.87% | 197,840 | 5.6% |
[ 1.5% - 2.0% ] 1.94% | 30,626 | 4.2% |
[ 2.0% - 2.5% ] 2.10% | 27,827 | 2.6% |
[ 2.0% - 2.5% ] 2.18% | 83,562 | 4.9% |
[ 2.0% - 2.5% ] 2.19% | 6,248 | 9.4% |
[ 2.0% - 2.5% ] 2.28% | 33,033 | 3.2% |
[ 2.0% - 2.5% ] 2.46% | 57,042 | 4.2% |
[ 2.5% - 3.0% ] 2.55% | 61,494 | 1.6% |
[ 2.5% - 3.0% ] 2.64% | 4,400 | 2.2% |
[ 2.5% - 3.0% ] 2.68% | 78,068 | 6.7% |
[ 2.5% - 3.0% ] 2.76% | 38,003 | 2.4% |
[ 2.5% - 3.0% ] 2.85% | 3,864 | 7.5% |
[ 3.0% - 3.5% ] 3.16% | 19,083 | 1.3% |
[ 3.0% - 3.5% ] 3.17% | 14,403 | 6.9% |
[ 3.0% - 3.5% ] 3.32% | 59,225 | 4.9% |
[ 3.0% - 3.5% ] 3.43% | 19,135 | 5.7% |
[ 3.5% - 4.0% ] 3.55% | 23,765 | 4.9% |
[ 3.5% - 4.0% ] 3.79% | 2,771 | 10.1% |
[ 3.5% - 4.0% ] 3.87% | 45,266 | 4.3% |
[ 4.0% - 4.5% ] 4.29% | 128,151 | 7.6% |
[ 4.0% - 4.5% ] 4.40% | 96,358 | 4.5% |
[ 4.5% - 5.0% ] 4.69% | 59,775 | 8.7% |
[ 4.5% - 5.0% ] 4.96% | 26,536 | 5.8% |
[ 5.0% - 5.5% ] 5.23% | 45,937 | 2.6% |
[ 5.0% - 5.5% ] 5.25% | 27,848 | 4.8% |
[ 5.0% - 5.5% ] 5.48% | 67,076 | 2.7% |
[ 5.5% - 6.0% ] 5.56% | 34,004 | 9.6% |
[ 5.5% - 6.0% ] 5.58% | 9,320 | 4.3% |
[ 5.5% - 6.0% ] 5.66% | 29,330 | 4.9% |
[ 5.5% - 6.0% ] 5.91% | 22,152 | 2.3% |
[ 5.5% - 6.0% ] 5.94% | 33,170 | 1.0% |
[ 6.0% - 6.5% ] 6.32% | 2,342 | 2.2% |
[ 6.5% - 7.0% ] 6.60% | 16,742 | 7.5% |
[ 7.0% - 7.5% ] 7.02% | 38,727 | 4.1% |
[ 9.0% - 9.5% ] 9.27% | 34,921 | 8.1% |
[ 9.5% - 10.0% ] 9.58% | 33,174 | 2.5% |
[ 10.5% - 11.0% ] 10.51% | 21,587 | 2.3% |
[ 11.0% - 11.5% ] 11.00% | 6,018 | 5.6% |
[ 11.0% - 11.5% ] 11.50% | 133,744 | 6.3% |
[ 18.0% - 18.5% ] 18.47% | 43,232 | 4.4% |