Assyrian/Chaldean/Syriac Median Male Earnings
COMPARE
Assyrian/Chaldean/Syriac
Select to Compare
Median Male Earnings
Assyrian/Chaldean/Syriac Median Male Earnings
$58,437
EARNINGS | MALES
97.9/ 100
METRIC RATING
100th/ 347
METRIC RANK
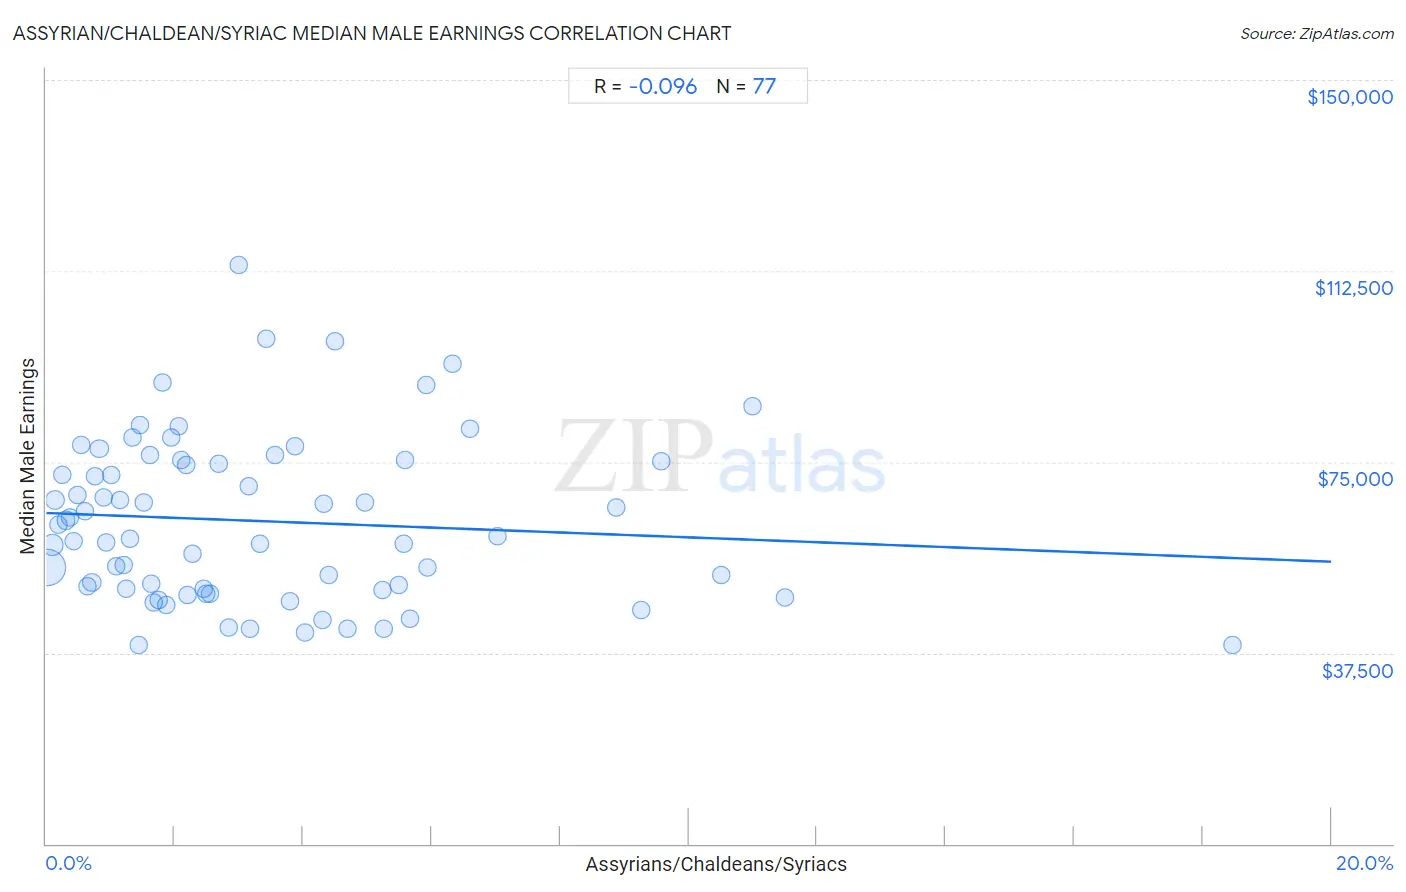
Assyrian/Chaldean/Syriac Median Male Earnings Correlation Chart
The statistical analysis conducted on geographies consisting of 110,268,457 people shows a slight negative correlation between the proportion of Assyrians/Chaldeans/Syriacs and median male earnings in the United States with a correlation coefficient (R) of -0.096 and weighted average of $58,437. On average, for every 1% (one percent) increase in Assyrians/Chaldeans/Syriacs within a typical geography, there is a decrease of $478 in median male earnings.
It is essential to understand that the correlation between the percentage of Assyrians/Chaldeans/Syriacs and median male earnings does not imply a direct cause-and-effect relationship. It remains uncertain whether the presence of Assyrians/Chaldeans/Syriacs influences an upward or downward trend in the level of median male earnings within an area, or if Assyrians/Chaldeans/Syriacs simply ended up residing in those areas with higher or lower levels of median male earnings due to other factors.
Demographics Similar to Assyrians/Chaldeans/Syriacs by Median Male Earnings
In terms of median male earnings, the demographic groups most similar to Assyrians/Chaldeans/Syriacs are Immigrants from Poland ($58,452, a difference of 0.030%), Jordanian ($58,500, a difference of 0.11%), Immigrants from Brazil ($58,324, a difference of 0.19%), Northern European ($58,588, a difference of 0.26%), and Albanian ($58,680, a difference of 0.42%).
| Demographics | Rating | Rank | Median Male Earnings |
| Immigrants from Southern Europe | 99.0 /100 | #93 | Exceptional $59,217 |
| Immigrants from North Macedonia | 99.0 /100 | #94 | Exceptional $59,189 |
| Immigrants from Lebanon | 98.6 /100 | #95 | Exceptional $58,835 |
| Albanians | 98.4 /100 | #96 | Exceptional $58,680 |
| Northern Europeans | 98.2 /100 | #97 | Exceptional $58,588 |
| Jordanians | 98.1 /100 | #98 | Exceptional $58,500 |
| Immigrants from Poland | 98.0 /100 | #99 | Exceptional $58,452 |
| Assyrians/Chaldeans/Syriacs | 97.9 /100 | #100 | Exceptional $58,437 |
| Immigrants from Brazil | 97.7 /100 | #101 | Exceptional $58,324 |
| Syrians | 97.4 /100 | #102 | Exceptional $58,187 |
| Poles | 97.3 /100 | #103 | Exceptional $58,139 |
| Armenians | 97.3 /100 | #104 | Exceptional $58,134 |
| Immigrants from Western Asia | 97.3 /100 | #105 | Exceptional $58,131 |
| Immigrants from Northern Africa | 96.9 /100 | #106 | Exceptional $58,008 |
| Serbians | 96.8 /100 | #107 | Exceptional $57,975 |
Assyrian/Chaldean/Syriac Median Male Earnings Correlation Summary
| Measurement | Assyrian/Chaldean/Syriac Data | Median Male Earnings Data |
| Minimum | 0.017% | $38,990 |
| Maximum | 18.5% | $113,676 |
| Range | 18.5% | $74,686 |
| Mean | 3.4% | $63,347 |
| Median | 2.3% | $60,406 |
| Interquartile 25% (IQ1) | 1.1% | $49,882 |
| Interquartile 75% (IQ3) | 4.8% | $75,136 |
| Interquartile Range (IQR) | 3.7% | $25,254 |
| Standard Deviation (Sample) | 3.3% | $16,152 |
| Standard Deviation (Population) | 3.2% | $16,047 |
Correlation Details
| Assyrian/Chaldean/Syriac Percentile | Sample Size | Median Male Earnings |
[ 0.0% - 0.5% ] 0.017% | 76,608,505 | $54,317 |
[ 0.0% - 0.5% ] 0.088% | 15,761,987 | $58,656 |
[ 0.0% - 0.5% ] 0.14% | 4,987,029 | $67,436 |
[ 0.0% - 0.5% ] 0.19% | 2,667,713 | $62,671 |
[ 0.0% - 0.5% ] 0.25% | 1,580,204 | $72,482 |
[ 0.0% - 0.5% ] 0.31% | 2,274,746 | $63,539 |
[ 0.0% - 0.5% ] 0.38% | 427,498 | $64,149 |
[ 0.0% - 0.5% ] 0.43% | 735,126 | $59,464 |
[ 0.0% - 0.5% ] 0.49% | 414,769 | $68,425 |
[ 0.5% - 1.0% ] 0.54% | 371,348 | $78,345 |
[ 0.5% - 1.0% ] 0.61% | 223,333 | $65,371 |
[ 0.5% - 1.0% ] 0.65% | 153,305 | $50,676 |
[ 0.5% - 1.0% ] 0.71% | 161,276 | $51,422 |
[ 0.5% - 1.0% ] 0.76% | 100,899 | $72,168 |
[ 0.5% - 1.0% ] 0.83% | 254,310 | $77,572 |
[ 0.5% - 1.0% ] 0.89% | 451,360 | $67,949 |
[ 0.5% - 1.0% ] 0.94% | 357,524 | $59,283 |
[ 1.0% - 1.5% ] 1.01% | 121,482 | $72,519 |
[ 1.0% - 1.5% ] 1.09% | 67,503 | $54,508 |
[ 1.0% - 1.5% ] 1.14% | 55,734 | $67,448 |
[ 1.0% - 1.5% ] 1.20% | 25,085 | $54,663 |
[ 1.0% - 1.5% ] 1.24% | 116,462 | $50,013 |
[ 1.0% - 1.5% ] 1.31% | 65,393 | $59,961 |
[ 1.0% - 1.5% ] 1.35% | 148,615 | $79,884 |
[ 1.0% - 1.5% ] 1.43% | 43,921 | $39,001 |
[ 1.0% - 1.5% ] 1.45% | 79,187 | $82,241 |
[ 1.5% - 2.0% ] 1.52% | 106,355 | $66,998 |
[ 1.5% - 2.0% ] 1.61% | 747 | $76,389 |
[ 1.5% - 2.0% ] 1.64% | 53,590 | $50,951 |
[ 1.5% - 2.0% ] 1.68% | 105,302 | $47,270 |
[ 1.5% - 2.0% ] 1.75% | 28,483 | $47,763 |
[ 1.5% - 2.0% ] 1.82% | 16,823 | $90,710 |
[ 1.5% - 2.0% ] 1.87% | 197,840 | $46,926 |
[ 1.5% - 2.0% ] 1.94% | 37,785 | $79,784 |
[ 2.0% - 2.5% ] 2.07% | 5,704 | $82,083 |
[ 2.0% - 2.5% ] 2.10% | 27,827 | $75,261 |
[ 2.0% - 2.5% ] 2.18% | 83,562 | $74,301 |
[ 2.0% - 2.5% ] 2.21% | 9,329 | $48,924 |
[ 2.0% - 2.5% ] 2.28% | 33,033 | $56,976 |
[ 2.0% - 2.5% ] 2.46% | 57,042 | $50,131 |
[ 2.0% - 2.5% ] 2.49% | 1,729 | $48,988 |
[ 2.5% - 3.0% ] 2.55% | 61,494 | $49,174 |
[ 2.5% - 3.0% ] 2.68% | 78,068 | $74,580 |
[ 2.5% - 3.0% ] 2.85% | 3,864 | $42,370 |
[ 2.5% - 3.0% ] 3.00% | 1,567 | $113,676 |
[ 3.0% - 3.5% ] 3.16% | 19,083 | $70,277 |
[ 3.0% - 3.5% ] 3.17% | 14,403 | $42,202 |
[ 3.0% - 3.5% ] 3.32% | 59,225 | $59,042 |
[ 3.0% - 3.5% ] 3.43% | 19,135 | $99,217 |
[ 3.5% - 4.0% ] 3.55% | 23,765 | $76,268 |
[ 3.5% - 4.0% ] 3.79% | 2,771 | $47,604 |
[ 3.5% - 4.0% ] 3.87% | 45,266 | $78,144 |
[ 4.0% - 4.5% ] 4.02% | 448 | $41,500 |
[ 4.0% - 4.5% ] 4.29% | 128,151 | $44,009 |
[ 4.0% - 4.5% ] 4.33% | 3,698 | $66,668 |
[ 4.0% - 4.5% ] 4.40% | 96,358 | $52,746 |
[ 4.0% - 4.5% ] 4.49% | 1,536 | $98,618 |
[ 4.5% - 5.0% ] 4.69% | 59,775 | $42,232 |
[ 4.5% - 5.0% ] 4.96% | 26,536 | $67,093 |
[ 5.0% - 5.5% ] 5.23% | 45,937 | $49,751 |
[ 5.0% - 5.5% ] 5.25% | 27,848 | $42,308 |
[ 5.0% - 5.5% ] 5.48% | 67,076 | $50,696 |
[ 5.5% - 6.0% ] 5.56% | 34,004 | $58,879 |
[ 5.5% - 6.0% ] 5.58% | 9,320 | $75,287 |
[ 5.5% - 6.0% ] 5.66% | 29,330 | $44,288 |
[ 5.5% - 6.0% ] 5.91% | 22,152 | $90,129 |
[ 5.5% - 6.0% ] 5.94% | 33,170 | $54,342 |
[ 6.0% - 6.5% ] 6.32% | 2,342 | $94,191 |
[ 6.5% - 7.0% ] 6.60% | 16,742 | $81,530 |
[ 7.0% - 7.5% ] 7.02% | 38,727 | $60,406 |
[ 8.5% - 9.0% ] 8.86% | 4,525 | $65,938 |
[ 9.0% - 9.5% ] 9.27% | 34,921 | $45,915 |
[ 9.5% - 10.0% ] 9.58% | 33,174 | $75,011 |
[ 10.5% - 11.0% ] 10.51% | 21,587 | $52,790 |
[ 11.0% - 11.5% ] 11.00% | 6,018 | $85,833 |
[ 11.0% - 11.5% ] 11.50% | 133,744 | $48,395 |
[ 18.0% - 18.5% ] 18.47% | 43,232 | $38,990 |