Assyrian/Chaldean/Syriac Child Poverty Under the Age of 5
COMPARE
Assyrian/Chaldean/Syriac
Select to Compare
Child Poverty Under the Age of 5
Assyrian/Chaldean/Syriac Child Poverty Under the Age of 5
13.6%
POVERTY | CHILDREN < 5
100.0/ 100
METRIC RATING
17th/ 347
METRIC RANK
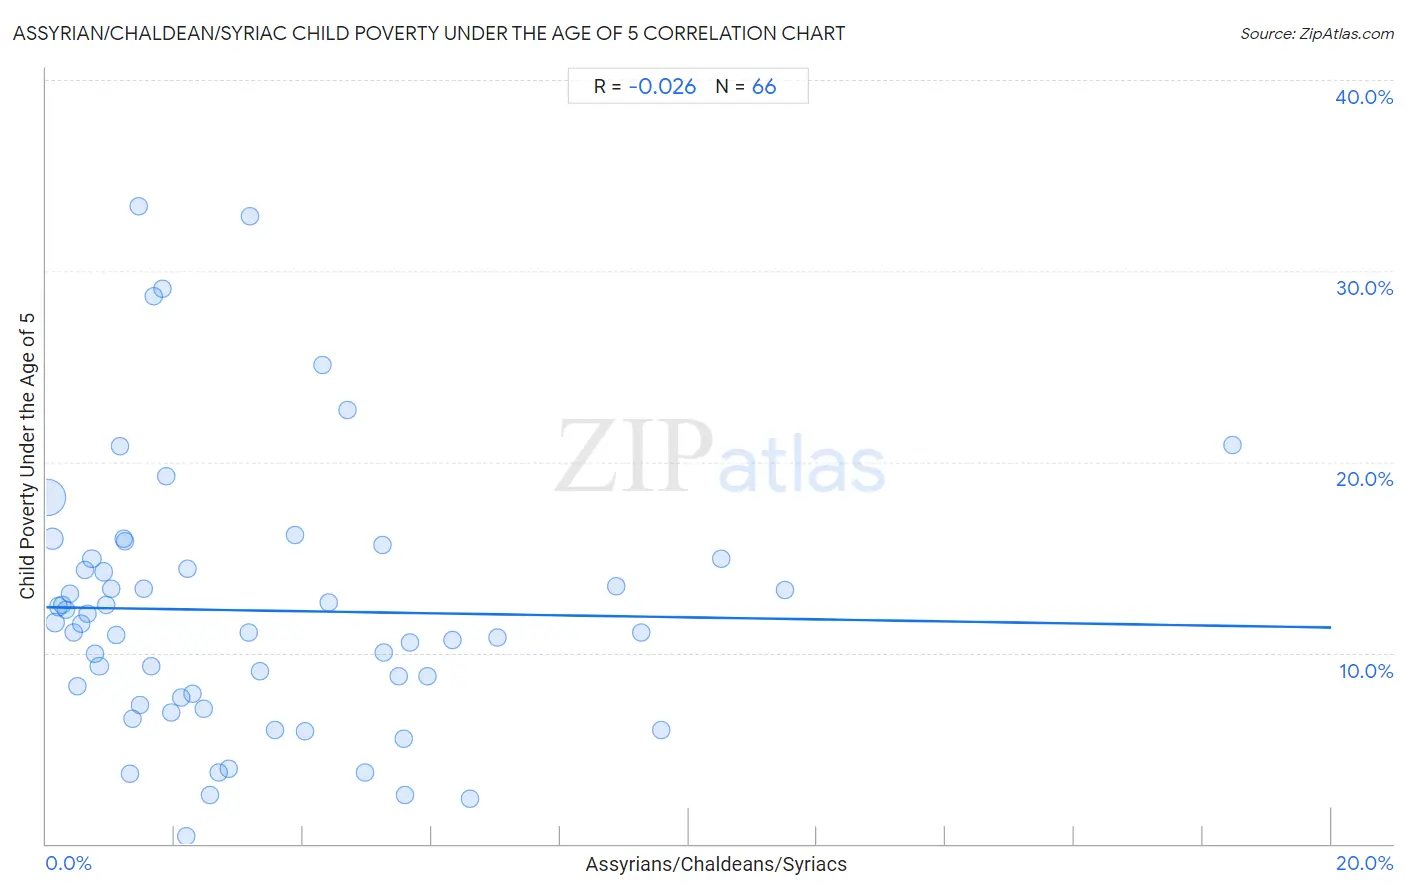
Assyrian/Chaldean/Syriac Child Poverty Under the Age of 5 Correlation Chart
The statistical analysis conducted on geographies consisting of 107,938,330 people shows no correlation between the proportion of Assyrians/Chaldeans/Syriacs and poverty level among children under the age of 5 in the United States with a correlation coefficient (R) of -0.026 and weighted average of 13.6%. On average, for every 1% (one percent) increase in Assyrians/Chaldeans/Syriacs within a typical geography, there is a decrease of 0.053% in poverty level among children under the age of 5.
It is essential to understand that the correlation between the percentage of Assyrians/Chaldeans/Syriacs and poverty level among children under the age of 5 does not imply a direct cause-and-effect relationship. It remains uncertain whether the presence of Assyrians/Chaldeans/Syriacs influences an upward or downward trend in the level of poverty level among children under the age of 5 within an area, or if Assyrians/Chaldeans/Syriacs simply ended up residing in those areas with higher or lower levels of poverty level among children under the age of 5 due to other factors.
Demographics Similar to Assyrians/Chaldeans/Syriacs by Child Poverty Under the Age of 5
In terms of child poverty under the age of 5, the demographic groups most similar to Assyrians/Chaldeans/Syriacs are Immigrants from China (13.6%, a difference of 0.29%), Immigrants from Eastern Asia (13.5%, a difference of 0.34%), Indian (Asian) (13.4%, a difference of 0.86%), Okinawan (13.4%, a difference of 0.91%), and Immigrants from Ireland (13.7%, a difference of 1.2%).
| Demographics | Rating | Rank | Child Poverty Under the Age of 5 |
| Burmese | 100.0 /100 | #10 | Exceptional 13.2% |
| Immigrants from Korea | 100.0 /100 | #11 | Exceptional 13.2% |
| Immigrants from South Central Asia | 100.0 /100 | #12 | Exceptional 13.3% |
| Bhutanese | 100.0 /100 | #13 | Exceptional 13.4% |
| Okinawans | 100.0 /100 | #14 | Exceptional 13.4% |
| Indians (Asian) | 100.0 /100 | #15 | Exceptional 13.4% |
| Immigrants from Eastern Asia | 100.0 /100 | #16 | Exceptional 13.5% |
| Assyrians/Chaldeans/Syriacs | 100.0 /100 | #17 | Exceptional 13.6% |
| Immigrants from China | 100.0 /100 | #18 | Exceptional 13.6% |
| Immigrants from Ireland | 100.0 /100 | #19 | Exceptional 13.7% |
| Immigrants from Japan | 100.0 /100 | #20 | Exceptional 13.8% |
| Bolivians | 100.0 /100 | #21 | Exceptional 13.8% |
| Immigrants from Bolivia | 100.0 /100 | #22 | Exceptional 13.8% |
| Bulgarians | 99.9 /100 | #23 | Exceptional 13.9% |
| Asians | 99.9 /100 | #24 | Exceptional 14.0% |
Assyrian/Chaldean/Syriac Child Poverty Under the Age of 5 Correlation Summary
| Measurement | Assyrian/Chaldean/Syriac Data | Child Poverty Under the Age of 5 Data |
| Minimum | 0.017% | 0.41% |
| Maximum | 18.5% | 33.4% |
| Range | 18.5% | 33.0% |
| Mean | 3.3% | 12.2% |
| Median | 2.1% | 11.3% |
| Interquartile 25% (IQ1) | 0.94% | 7.7% |
| Interquartile 75% (IQ3) | 5.0% | 14.9% |
| Interquartile Range (IQR) | 4.0% | 7.2% |
| Standard Deviation (Sample) | 3.3% | 7.0% |
| Standard Deviation (Population) | 3.3% | 6.9% |
Correlation Details
| Assyrian/Chaldean/Syriac Percentile | Sample Size | Child Poverty Under the Age of 5 |
[ 0.0% - 0.5% ] 0.017% | 76,039,387 | 18.1% |
[ 0.0% - 0.5% ] 0.088% | 15,296,625 | 16.0% |
[ 0.0% - 0.5% ] 0.14% | 4,629,041 | 11.6% |
[ 0.0% - 0.5% ] 0.19% | 2,463,328 | 12.4% |
[ 0.0% - 0.5% ] 0.25% | 1,400,948 | 12.5% |
[ 0.0% - 0.5% ] 0.31% | 2,229,390 | 12.3% |
[ 0.0% - 0.5% ] 0.37% | 358,723 | 13.1% |
[ 0.0% - 0.5% ] 0.43% | 694,860 | 11.1% |
[ 0.0% - 0.5% ] 0.49% | 387,501 | 8.2% |
[ 0.5% - 1.0% ] 0.54% | 296,977 | 11.5% |
[ 0.5% - 1.0% ] 0.61% | 202,472 | 14.4% |
[ 0.5% - 1.0% ] 0.64% | 125,747 | 12.0% |
[ 0.5% - 1.0% ] 0.71% | 161,276 | 14.9% |
[ 0.5% - 1.0% ] 0.76% | 100,899 | 9.9% |
[ 0.5% - 1.0% ] 0.83% | 254,310 | 9.3% |
[ 0.5% - 1.0% ] 0.89% | 445,431 | 14.2% |
[ 0.5% - 1.0% ] 0.94% | 351,049 | 12.5% |
[ 1.0% - 1.5% ] 1.01% | 121,482 | 13.4% |
[ 1.0% - 1.5% ] 1.09% | 67,216 | 10.9% |
[ 1.0% - 1.5% ] 1.14% | 55,734 | 20.8% |
[ 1.0% - 1.5% ] 1.20% | 24,044 | 16.0% |
[ 1.0% - 1.5% ] 1.23% | 88,670 | 15.9% |
[ 1.0% - 1.5% ] 1.30% | 33,910 | 3.7% |
[ 1.0% - 1.5% ] 1.34% | 121,340 | 6.5% |
[ 1.0% - 1.5% ] 1.43% | 42,621 | 33.4% |
[ 1.0% - 1.5% ] 1.45% | 79,187 | 7.2% |
[ 1.5% - 2.0% ] 1.51% | 88,230 | 13.3% |
[ 1.5% - 2.0% ] 1.64% | 53,590 | 9.3% |
[ 1.5% - 2.0% ] 1.67% | 86,488 | 28.7% |
[ 1.5% - 2.0% ] 1.82% | 16,823 | 29.1% |
[ 1.5% - 2.0% ] 1.86% | 190,578 | 19.2% |
[ 1.5% - 2.0% ] 1.94% | 30,626 | 6.9% |
[ 2.0% - 2.5% ] 2.10% | 27,827 | 7.7% |
[ 2.0% - 2.5% ] 2.18% | 83,562 | 0.41% |
[ 2.0% - 2.5% ] 2.19% | 6,248 | 14.4% |
[ 2.0% - 2.5% ] 2.28% | 33,033 | 7.8% |
[ 2.0% - 2.5% ] 2.46% | 57,042 | 7.1% |
[ 2.5% - 3.0% ] 2.55% | 61,494 | 2.6% |
[ 2.5% - 3.0% ] 2.68% | 78,068 | 3.7% |
[ 2.5% - 3.0% ] 2.85% | 3,864 | 4.0% |
[ 3.0% - 3.5% ] 3.16% | 19,083 | 11.1% |
[ 3.0% - 3.5% ] 3.17% | 14,403 | 32.9% |
[ 3.0% - 3.5% ] 3.32% | 59,225 | 9.0% |
[ 3.5% - 4.0% ] 3.55% | 23,765 | 6.0% |
[ 3.5% - 4.0% ] 3.87% | 45,266 | 16.2% |
[ 4.0% - 4.5% ] 4.02% | 448 | 5.9% |
[ 4.0% - 4.5% ] 4.29% | 128,151 | 25.1% |
[ 4.0% - 4.5% ] 4.40% | 96,358 | 12.7% |
[ 4.5% - 5.0% ] 4.69% | 59,775 | 22.7% |
[ 4.5% - 5.0% ] 4.96% | 26,536 | 3.7% |
[ 5.0% - 5.5% ] 5.23% | 45,937 | 15.6% |
[ 5.0% - 5.5% ] 5.25% | 27,848 | 10.0% |
[ 5.0% - 5.5% ] 5.48% | 67,076 | 8.8% |
[ 5.5% - 6.0% ] 5.56% | 34,004 | 5.5% |
[ 5.5% - 6.0% ] 5.58% | 9,320 | 2.5% |
[ 5.5% - 6.0% ] 5.66% | 29,330 | 10.5% |
[ 5.5% - 6.0% ] 5.94% | 33,170 | 8.7% |
[ 6.0% - 6.5% ] 6.32% | 2,342 | 10.7% |
[ 6.5% - 7.0% ] 6.60% | 16,742 | 2.4% |
[ 7.0% - 7.5% ] 7.02% | 38,727 | 10.8% |
[ 8.5% - 9.0% ] 8.86% | 4,525 | 13.5% |
[ 9.0% - 9.5% ] 9.27% | 34,921 | 11.1% |
[ 9.5% - 10.0% ] 9.58% | 33,174 | 6.0% |
[ 10.5% - 11.0% ] 10.51% | 21,587 | 14.9% |
[ 11.0% - 11.5% ] 11.50% | 133,744 | 13.3% |
[ 18.0% - 18.5% ] 18.47% | 43,232 | 20.9% |