Assyrian/Chaldean/Syriac Single Father Households
COMPARE
Assyrian/Chaldean/Syriac
Select to Compare
Single Father Households
Assyrian/Chaldean/Syriac Single Father Households
2.0%
SINGLE FATHER HOUSEHOLDS
100.0/ 100
METRIC RATING
26th/ 347
METRIC RANK
Assyrian/Chaldean/Syriac Single Father Households Correlation Chart
The statistical analysis conducted on geographies consisting of 110,024,022 people shows a weak negative correlation between the proportion of Assyrians/Chaldeans/Syriacs and percentage of single father households in the United States with a correlation coefficient (R) of -0.243 and weighted average of 2.0%. On average, for every 1% (one percent) increase in Assyrians/Chaldeans/Syriacs within a typical geography, there is a decrease of 0.067% in percentage of single father households.
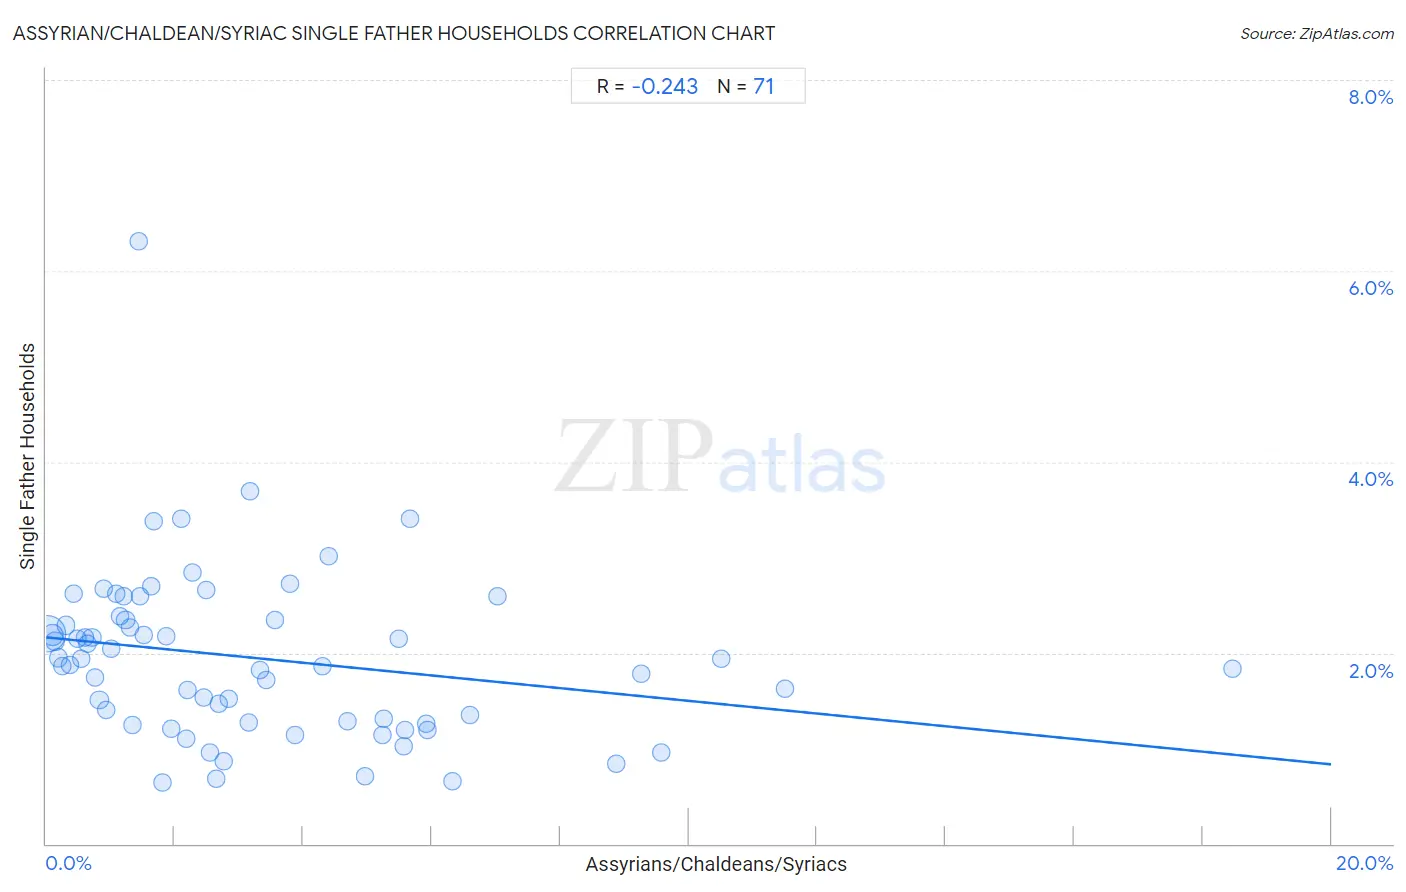
It is essential to understand that the correlation between the percentage of Assyrians/Chaldeans/Syriacs and percentage of single father households does not imply a direct cause-and-effect relationship. It remains uncertain whether the presence of Assyrians/Chaldeans/Syriacs influences an upward or downward trend in the level of percentage of single father households within an area, or if Assyrians/Chaldeans/Syriacs simply ended up residing in those areas with higher or lower levels of percentage of single father households due to other factors.
Demographics Similar to Assyrians/Chaldeans/Syriacs by Single Father Households
In terms of single father households, the demographic groups most similar to Assyrians/Chaldeans/Syriacs are Eastern European (2.0%, a difference of 0.14%), Immigrants from Croatia (2.0%, a difference of 0.15%), Immigrants from Russia (2.0%, a difference of 0.15%), Immigrants from South Central Asia (2.0%, a difference of 0.28%), and Immigrants from Japan (2.0%, a difference of 0.47%).
| Demographics | Rating | Rank | Single Father Households |
| Iranians | 100.0 /100 | #19 | Exceptional 1.9% |
| Thais | 100.0 /100 | #20 | Exceptional 1.9% |
| Immigrants from Albania | 100.0 /100 | #21 | Exceptional 1.9% |
| Immigrants from Latvia | 100.0 /100 | #22 | Exceptional 1.9% |
| Immigrants from Croatia | 100.0 /100 | #23 | Exceptional 2.0% |
| Immigrants from Russia | 100.0 /100 | #24 | Exceptional 2.0% |
| Eastern Europeans | 100.0 /100 | #25 | Exceptional 2.0% |
| Assyrians/Chaldeans/Syriacs | 100.0 /100 | #26 | Exceptional 2.0% |
| Immigrants from South Central Asia | 100.0 /100 | #27 | Exceptional 2.0% |
| Immigrants from Japan | 100.0 /100 | #28 | Exceptional 2.0% |
| Bulgarians | 100.0 /100 | #29 | Exceptional 2.0% |
| Cambodians | 100.0 /100 | #30 | Exceptional 2.0% |
| Israelis | 100.0 /100 | #31 | Exceptional 2.0% |
| Chinese | 100.0 /100 | #32 | Exceptional 2.0% |
| Turks | 100.0 /100 | #33 | Exceptional 2.0% |
Assyrian/Chaldean/Syriac Single Father Households Correlation Summary
| Measurement | Assyrian/Chaldean/Syriac Data | Single Father Households Data |
| Minimum | 0.017% | 0.64% |
| Maximum | 18.5% | 6.3% |
| Range | 18.5% | 5.7% |
| Mean | 3.3% | 1.9% |
| Median | 2.3% | 1.9% |
| Interquartile 25% (IQ1) | 1.0% | 1.3% |
| Interquartile 75% (IQ3) | 5.0% | 2.3% |
| Interquartile Range (IQR) | 3.9% | 1.1% |
| Standard Deviation (Sample) | 3.2% | 0.89% |
| Standard Deviation (Population) | 3.2% | 0.88% |
Correlation Details
| Assyrian/Chaldean/Syriac Percentile | Sample Size | Single Father Households |
[ 0.0% - 0.5% ] 0.017% | 76,584,484 | 2.2% |
[ 0.0% - 0.5% ] 0.088% | 15,716,518 | 2.2% |
[ 0.0% - 0.5% ] 0.14% | 4,978,066 | 2.1% |
[ 0.0% - 0.5% ] 0.19% | 2,644,842 | 1.9% |
[ 0.0% - 0.5% ] 0.25% | 1,558,271 | 1.9% |
[ 0.0% - 0.5% ] 0.31% | 2,263,172 | 2.3% |
[ 0.0% - 0.5% ] 0.38% | 416,881 | 1.9% |
[ 0.0% - 0.5% ] 0.43% | 718,637 | 2.6% |
[ 0.0% - 0.5% ] 0.49% | 400,239 | 2.1% |
[ 0.5% - 1.0% ] 0.54% | 332,462 | 1.9% |
[ 0.5% - 1.0% ] 0.61% | 218,718 | 2.2% |
[ 0.5% - 1.0% ] 0.65% | 151,629 | 2.1% |
[ 0.5% - 1.0% ] 0.71% | 161,276 | 2.2% |
[ 0.5% - 1.0% ] 0.76% | 100,899 | 1.7% |
[ 0.5% - 1.0% ] 0.83% | 252,842 | 1.5% |
[ 0.5% - 1.0% ] 0.89% | 448,550 | 2.7% |
[ 0.5% - 1.0% ] 0.94% | 355,589 | 1.4% |
[ 1.0% - 1.5% ] 1.01% | 121,482 | 2.0% |
[ 1.0% - 1.5% ] 1.09% | 67,503 | 2.6% |
[ 1.0% - 1.5% ] 1.14% | 55,734 | 2.4% |
[ 1.0% - 1.5% ] 1.20% | 24,044 | 2.6% |
[ 1.0% - 1.5% ] 1.24% | 112,930 | 2.3% |
[ 1.0% - 1.5% ] 1.31% | 65,237 | 2.3% |
[ 1.0% - 1.5% ] 1.34% | 146,945 | 1.2% |
[ 1.0% - 1.5% ] 1.43% | 42,621 | 6.3% |
[ 1.0% - 1.5% ] 1.45% | 79,187 | 2.6% |
[ 1.5% - 2.0% ] 1.52% | 106,355 | 2.2% |
[ 1.5% - 2.0% ] 1.64% | 53,590 | 2.7% |
[ 1.5% - 2.0% ] 1.68% | 105,302 | 3.4% |
[ 1.5% - 2.0% ] 1.82% | 16,823 | 0.64% |
[ 1.5% - 2.0% ] 1.87% | 197,840 | 2.2% |
[ 1.5% - 2.0% ] 1.94% | 37,785 | 1.2% |
[ 2.0% - 2.5% ] 2.10% | 27,827 | 3.4% |
[ 2.0% - 2.5% ] 2.18% | 83,562 | 1.1% |
[ 2.0% - 2.5% ] 2.19% | 6,248 | 1.6% |
[ 2.0% - 2.5% ] 2.28% | 33,033 | 2.8% |
[ 2.0% - 2.5% ] 2.46% | 57,042 | 1.5% |
[ 2.0% - 2.5% ] 2.49% | 1,729 | 2.7% |
[ 2.5% - 3.0% ] 2.55% | 61,494 | 0.96% |
[ 2.5% - 3.0% ] 2.64% | 4,400 | 0.68% |
[ 2.5% - 3.0% ] 2.68% | 78,068 | 1.5% |
[ 2.5% - 3.0% ] 2.76% | 38,003 | 0.87% |
[ 2.5% - 3.0% ] 2.85% | 3,864 | 1.5% |
[ 3.0% - 3.5% ] 3.16% | 19,083 | 1.3% |
[ 3.0% - 3.5% ] 3.17% | 14,403 | 3.7% |
[ 3.0% - 3.5% ] 3.32% | 59,225 | 1.8% |
[ 3.0% - 3.5% ] 3.43% | 19,135 | 1.7% |
[ 3.5% - 4.0% ] 3.55% | 23,765 | 2.3% |
[ 3.5% - 4.0% ] 3.79% | 2,771 | 2.7% |
[ 3.5% - 4.0% ] 3.87% | 45,266 | 1.1% |
[ 4.0% - 4.5% ] 4.29% | 128,151 | 1.9% |
[ 4.0% - 4.5% ] 4.40% | 96,358 | 3.0% |
[ 4.5% - 5.0% ] 4.69% | 59,775 | 1.3% |
[ 4.5% - 5.0% ] 4.96% | 26,536 | 0.71% |
[ 5.0% - 5.5% ] 5.23% | 45,937 | 1.1% |
[ 5.0% - 5.5% ] 5.25% | 27,848 | 1.3% |
[ 5.0% - 5.5% ] 5.48% | 67,076 | 2.1% |
[ 5.5% - 6.0% ] 5.56% | 34,004 | 1.0% |
[ 5.5% - 6.0% ] 5.58% | 9,320 | 1.2% |
[ 5.5% - 6.0% ] 5.66% | 29,330 | 3.4% |
[ 5.5% - 6.0% ] 5.91% | 22,152 | 1.3% |
[ 5.5% - 6.0% ] 5.94% | 33,170 | 1.2% |
[ 6.0% - 6.5% ] 6.32% | 2,342 | 0.65% |
[ 6.5% - 7.0% ] 6.60% | 16,742 | 1.3% |
[ 7.0% - 7.5% ] 7.02% | 38,727 | 2.6% |
[ 8.5% - 9.0% ] 8.86% | 4,525 | 0.84% |
[ 9.0% - 9.5% ] 9.27% | 34,921 | 1.8% |
[ 9.5% - 10.0% ] 9.58% | 33,174 | 0.95% |
[ 10.5% - 11.0% ] 10.51% | 21,587 | 1.9% |
[ 11.0% - 11.5% ] 11.50% | 133,744 | 1.6% |
[ 18.0% - 18.5% ] 18.47% | 43,232 | 1.8% |