Assyrian/Chaldean/Syriac Single Male Poverty
COMPARE
Assyrian/Chaldean/Syriac
Select to Compare
Single Male Poverty
Assyrian/Chaldean/Syriac Single Male Poverty
9.8%
POVERTY | SINGLE MALES
100.0/ 100
METRIC RATING
1st/ 347
METRIC RANK
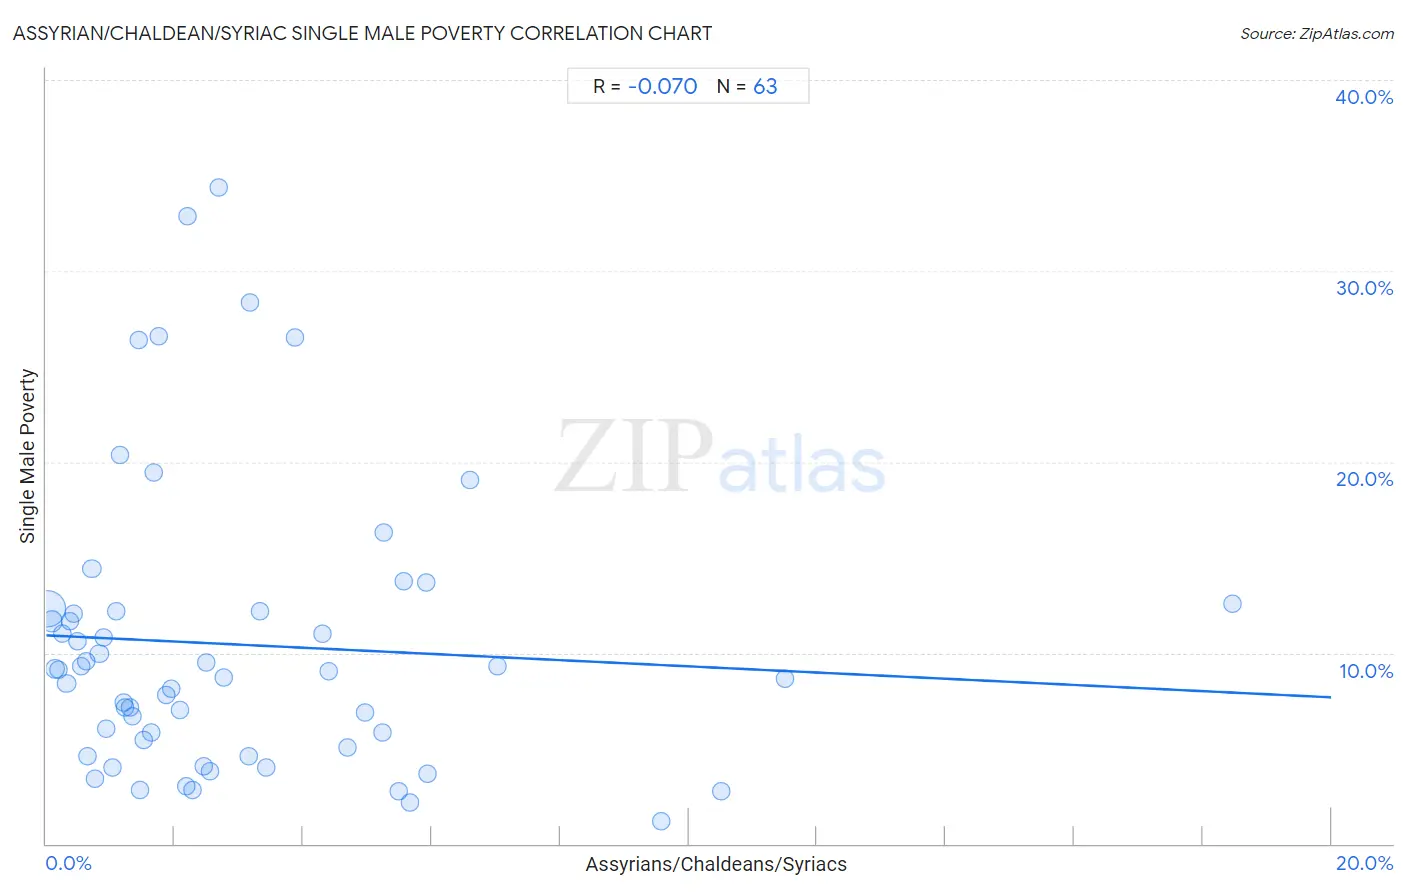
Assyrian/Chaldean/Syriac Single Male Poverty Correlation Chart
The statistical analysis conducted on geographies consisting of 104,209,222 people shows a slight negative correlation between the proportion of Assyrians/Chaldeans/Syriacs and poverty level among single males in the United States with a correlation coefficient (R) of -0.070 and weighted average of 9.8%. On average, for every 1% (one percent) increase in Assyrians/Chaldeans/Syriacs within a typical geography, there is a decrease of 0.16% in poverty level among single males.
It is essential to understand that the correlation between the percentage of Assyrians/Chaldeans/Syriacs and poverty level among single males does not imply a direct cause-and-effect relationship. It remains uncertain whether the presence of Assyrians/Chaldeans/Syriacs influences an upward or downward trend in the level of poverty level among single males within an area, or if Assyrians/Chaldeans/Syriacs simply ended up residing in those areas with higher or lower levels of poverty level among single males due to other factors.
Demographics Similar to Assyrians/Chaldeans/Syriacs by Single Male Poverty
In terms of single male poverty, the demographic groups most similar to Assyrians/Chaldeans/Syriacs are Immigrants from Taiwan (10.3%, a difference of 5.3%), Immigrants from India (10.3%, a difference of 6.0%), Immigrants from Hong Kong (10.4%, a difference of 7.0%), Tongan (10.5%, a difference of 7.1%), and Filipino (10.6%, a difference of 8.9%).
| Demographics | Rating | Rank | Single Male Poverty |
| Assyrians/Chaldeans/Syriacs | 100.0 /100 | #1 | Exceptional 9.8% |
| Immigrants from Taiwan | 100.0 /100 | #2 | Exceptional 10.3% |
| Immigrants from India | 100.0 /100 | #3 | Exceptional 10.3% |
| Immigrants from Hong Kong | 100.0 /100 | #4 | Exceptional 10.4% |
| Tongans | 100.0 /100 | #5 | Exceptional 10.5% |
| Filipinos | 100.0 /100 | #6 | Exceptional 10.6% |
| Afghans | 100.0 /100 | #7 | Exceptional 10.7% |
| Thais | 100.0 /100 | #8 | Exceptional 10.8% |
| Taiwanese | 100.0 /100 | #9 | Exceptional 10.9% |
| Immigrants from Fiji | 100.0 /100 | #10 | Exceptional 10.9% |
| Immigrants from Philippines | 100.0 /100 | #11 | Exceptional 10.9% |
| Immigrants from Afghanistan | 100.0 /100 | #12 | Exceptional 10.9% |
| Immigrants from South Central Asia | 100.0 /100 | #13 | Exceptional 10.9% |
| Chinese | 100.0 /100 | #14 | Exceptional 11.0% |
| Koreans | 100.0 /100 | #15 | Exceptional 11.0% |
Assyrian/Chaldean/Syriac Single Male Poverty Correlation Summary
| Measurement | Assyrian/Chaldean/Syriac Data | Single Male Poverty Data |
| Minimum | 0.017% | 1.2% |
| Maximum | 18.5% | 34.4% |
| Range | 18.5% | 33.2% |
| Mean | 3.0% | 10.4% |
| Median | 1.9% | 9.1% |
| Interquartile 25% (IQ1) | 0.89% | 5.0% |
| Interquartile 75% (IQ3) | 4.4% | 12.2% |
| Interquartile Range (IQR) | 3.5% | 7.2% |
| Standard Deviation (Sample) | 3.2% | 7.5% |
| Standard Deviation (Population) | 3.2% | 7.5% |
Correlation Details
| Assyrian/Chaldean/Syriac Percentile | Sample Size | Single Male Poverty |
[ 0.0% - 0.5% ] 0.017% | 74,521,175 | 12.3% |
[ 0.0% - 0.5% ] 0.088% | 14,296,653 | 11.7% |
[ 0.0% - 0.5% ] 0.14% | 4,298,953 | 9.2% |
[ 0.0% - 0.5% ] 0.19% | 2,256,524 | 9.1% |
[ 0.0% - 0.5% ] 0.25% | 1,253,813 | 11.0% |
[ 0.0% - 0.5% ] 0.31% | 2,191,003 | 8.4% |
[ 0.0% - 0.5% ] 0.38% | 367,243 | 11.6% |
[ 0.0% - 0.5% ] 0.43% | 611,302 | 12.1% |
[ 0.0% - 0.5% ] 0.48% | 216,379 | 10.6% |
[ 0.5% - 1.0% ] 0.54% | 268,978 | 9.3% |
[ 0.5% - 1.0% ] 0.61% | 170,640 | 9.6% |
[ 0.5% - 1.0% ] 0.64% | 108,362 | 4.6% |
[ 0.5% - 1.0% ] 0.71% | 161,276 | 14.4% |
[ 0.5% - 1.0% ] 0.76% | 100,899 | 3.4% |
[ 0.5% - 1.0% ] 0.83% | 252,842 | 9.9% |
[ 0.5% - 1.0% ] 0.89% | 415,762 | 10.8% |
[ 0.5% - 1.0% ] 0.94% | 329,261 | 6.0% |
[ 1.0% - 1.5% ] 1.02% | 68,627 | 4.0% |
[ 1.0% - 1.5% ] 1.09% | 67,216 | 12.2% |
[ 1.0% - 1.5% ] 1.14% | 55,734 | 20.4% |
[ 1.0% - 1.5% ] 1.21% | 20,878 | 7.4% |
[ 1.0% - 1.5% ] 1.23% | 88,670 | 7.1% |
[ 1.0% - 1.5% ] 1.30% | 33,910 | 7.1% |
[ 1.0% - 1.5% ] 1.34% | 115,225 | 6.7% |
[ 1.0% - 1.5% ] 1.43% | 42,621 | 26.4% |
[ 1.0% - 1.5% ] 1.45% | 79,187 | 2.8% |
[ 1.5% - 2.0% ] 1.51% | 88,230 | 5.4% |
[ 1.5% - 2.0% ] 1.64% | 53,590 | 5.8% |
[ 1.5% - 2.0% ] 1.67% | 86,488 | 19.5% |
[ 1.5% - 2.0% ] 1.75% | 24,626 | 26.6% |
[ 1.5% - 2.0% ] 1.87% | 169,577 | 7.8% |
[ 1.5% - 2.0% ] 1.94% | 30,626 | 8.1% |
[ 2.0% - 2.5% ] 2.08% | 17,366 | 7.0% |
[ 2.0% - 2.5% ] 2.18% | 83,562 | 3.0% |
[ 2.0% - 2.5% ] 2.19% | 6,248 | 32.9% |
[ 2.0% - 2.5% ] 2.28% | 33,033 | 2.8% |
[ 2.0% - 2.5% ] 2.46% | 57,042 | 4.0% |
[ 2.0% - 2.5% ] 2.49% | 1,729 | 9.5% |
[ 2.5% - 3.0% ] 2.55% | 61,494 | 3.8% |
[ 2.5% - 3.0% ] 2.68% | 49,820 | 34.4% |
[ 2.5% - 3.0% ] 2.76% | 38,003 | 8.7% |
[ 3.0% - 3.5% ] 3.16% | 19,083 | 4.6% |
[ 3.0% - 3.5% ] 3.17% | 14,403 | 28.4% |
[ 3.0% - 3.5% ] 3.32% | 59,225 | 12.2% |
[ 3.0% - 3.5% ] 3.43% | 19,135 | 4.0% |
[ 3.5% - 4.0% ] 3.87% | 45,266 | 26.5% |
[ 4.0% - 4.5% ] 4.29% | 128,151 | 11.0% |
[ 4.0% - 4.5% ] 4.40% | 96,358 | 9.1% |
[ 4.5% - 5.0% ] 4.69% | 59,775 | 5.0% |
[ 4.5% - 5.0% ] 4.96% | 26,536 | 6.9% |
[ 5.0% - 5.5% ] 5.23% | 45,937 | 5.8% |
[ 5.0% - 5.5% ] 5.25% | 27,848 | 16.3% |
[ 5.0% - 5.5% ] 5.48% | 67,076 | 2.7% |
[ 5.5% - 6.0% ] 5.56% | 34,004 | 13.8% |
[ 5.5% - 6.0% ] 5.66% | 29,330 | 2.1% |
[ 5.5% - 6.0% ] 5.91% | 22,152 | 13.7% |
[ 5.5% - 6.0% ] 5.94% | 33,170 | 3.7% |
[ 6.5% - 7.0% ] 6.60% | 16,742 | 19.0% |
[ 7.0% - 7.5% ] 7.02% | 38,727 | 9.3% |
[ 9.5% - 10.0% ] 9.58% | 33,174 | 1.2% |
[ 10.5% - 11.0% ] 10.51% | 21,587 | 2.8% |
[ 11.0% - 11.5% ] 11.50% | 133,744 | 8.7% |
[ 18.0% - 18.5% ] 18.47% | 43,232 | 12.5% |