Assyrian/Chaldean/Syriac Median Household Income
COMPARE
Assyrian/Chaldean/Syriac
Select to Compare
Median Household Income
Assyrian/Chaldean/Syriac Median Household Income
$91,991
HOUSEHOLD INCOME
98.8/ 100
METRIC RATING
90th/ 347
METRIC RANK
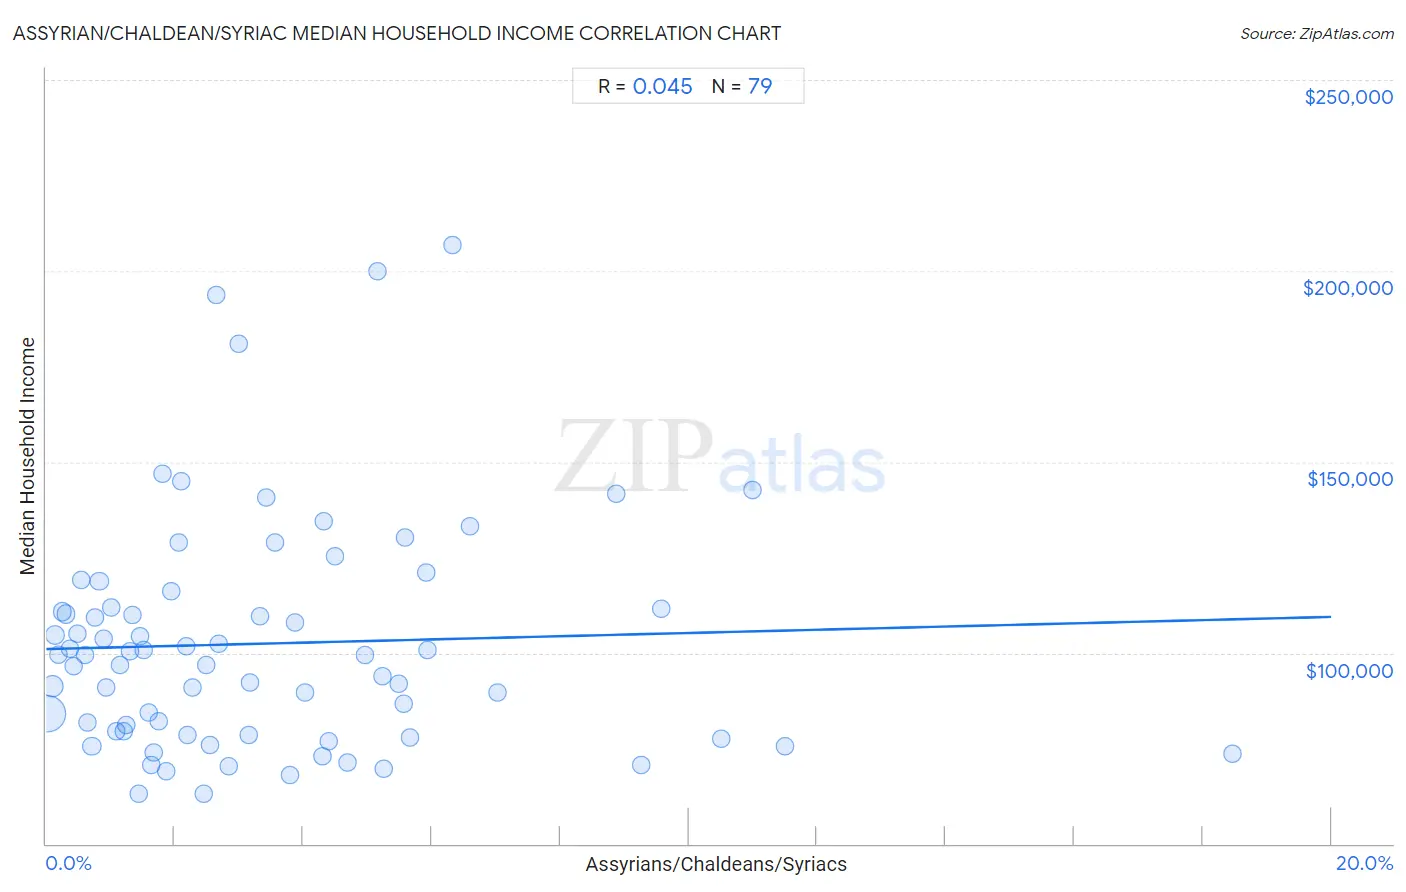
Assyrian/Chaldean/Syriac Median Household Income Correlation Chart
The statistical analysis conducted on geographies consisting of 110,256,349 people shows no correlation between the proportion of Assyrians/Chaldeans/Syriacs and median household income in the United States with a correlation coefficient (R) of 0.045 and weighted average of $91,991. On average, for every 1% (one percent) increase in Assyrians/Chaldeans/Syriacs within a typical geography, there is an increase of $423 in median household income.
It is essential to understand that the correlation between the percentage of Assyrians/Chaldeans/Syriacs and median household income does not imply a direct cause-and-effect relationship. It remains uncertain whether the presence of Assyrians/Chaldeans/Syriacs influences an upward or downward trend in the level of median household income within an area, or if Assyrians/Chaldeans/Syriacs simply ended up residing in those areas with higher or lower levels of median household income due to other factors.
Demographics Similar to Assyrians/Chaldeans/Syriacs by Median Household Income
In terms of median household income, the demographic groups most similar to Assyrians/Chaldeans/Syriacs are Romanian ($91,994, a difference of 0.0%), Immigrants from Vietnam ($91,987, a difference of 0.0%), Immigrants from Canada ($92,029, a difference of 0.040%), Immigrants from Western Europe ($91,936, a difference of 0.060%), and Immigrants from Hungary ($92,094, a difference of 0.11%).
| Demographics | Rating | Rank | Median Household Income |
| Italians | 99.1 /100 | #83 | Exceptional $92,475 |
| Immigrants from Argentina | 99.1 /100 | #84 | Exceptional $92,417 |
| Immigrants from Croatia | 99.0 /100 | #85 | Exceptional $92,225 |
| Immigrants from England | 98.9 /100 | #86 | Exceptional $92,098 |
| Immigrants from Hungary | 98.9 /100 | #87 | Exceptional $92,094 |
| Immigrants from Canada | 98.8 /100 | #88 | Exceptional $92,029 |
| Romanians | 98.8 /100 | #89 | Exceptional $91,994 |
| Assyrians/Chaldeans/Syriacs | 98.8 /100 | #90 | Exceptional $91,991 |
| Immigrants from Vietnam | 98.8 /100 | #91 | Exceptional $91,987 |
| Immigrants from Western Europe | 98.8 /100 | #92 | Exceptional $91,936 |
| Immigrants from Lebanon | 98.7 /100 | #93 | Exceptional $91,887 |
| Immigrants from North America | 98.7 /100 | #94 | Exceptional $91,860 |
| Armenians | 98.7 /100 | #95 | Exceptional $91,807 |
| Jordanians | 98.7 /100 | #96 | Exceptional $91,794 |
| Immigrants from Serbia | 98.6 /100 | #97 | Exceptional $91,730 |
Assyrian/Chaldean/Syriac Median Household Income Correlation Summary
| Measurement | Assyrian/Chaldean/Syriac Data | Median Household Income Data |
| Minimum | 0.017% | $63,036 |
| Maximum | 18.5% | $206,750 |
| Range | 18.5% | $143,714 |
| Mean | 3.4% | $102,405 |
| Median | 2.5% | $99,390 |
| Interquartile 25% (IQ1) | 1.1% | $78,587 |
| Interquartile 75% (IQ3) | 5.0% | $111,848 |
| Interquartile Range (IQR) | 3.8% | $33,262 |
| Standard Deviation (Sample) | 3.2% | $30,418 |
| Standard Deviation (Population) | 3.2% | $30,225 |
Correlation Details
| Assyrian/Chaldean/Syriac Percentile | Sample Size | Median Household Income |
[ 0.0% - 0.5% ] 0.017% | 76,595,606 | $84,166 |
[ 0.0% - 0.5% ] 0.088% | 15,761,987 | $91,256 |
[ 0.0% - 0.5% ] 0.14% | 4,987,029 | $104,812 |
[ 0.0% - 0.5% ] 0.19% | 2,667,713 | $99,457 |
[ 0.0% - 0.5% ] 0.25% | 1,580,204 | $110,731 |
[ 0.0% - 0.5% ] 0.31% | 2,272,114 | $110,107 |
[ 0.0% - 0.5% ] 0.38% | 427,498 | $101,107 |
[ 0.0% - 0.5% ] 0.43% | 730,632 | $96,565 |
[ 0.0% - 0.5% ] 0.49% | 414,769 | $104,911 |
[ 0.5% - 1.0% ] 0.54% | 371,348 | $119,105 |
[ 0.5% - 1.0% ] 0.61% | 223,333 | $99,566 |
[ 0.5% - 1.0% ] 0.65% | 153,305 | $81,765 |
[ 0.5% - 1.0% ] 0.71% | 161,276 | $75,643 |
[ 0.5% - 1.0% ] 0.76% | 100,899 | $109,235 |
[ 0.5% - 1.0% ] 0.83% | 254,310 | $118,710 |
[ 0.5% - 1.0% ] 0.89% | 448,550 | $103,790 |
[ 0.5% - 1.0% ] 0.94% | 357,524 | $90,805 |
[ 1.0% - 1.5% ] 1.01% | 121,482 | $111,848 |
[ 1.0% - 1.5% ] 1.09% | 67,503 | $79,374 |
[ 1.0% - 1.5% ] 1.14% | 55,734 | $96,805 |
[ 1.0% - 1.5% ] 1.20% | 25,085 | $79,439 |
[ 1.0% - 1.5% ] 1.24% | 117,360 | $81,115 |
[ 1.0% - 1.5% ] 1.31% | 65,393 | $100,361 |
[ 1.0% - 1.5% ] 1.35% | 148,615 | $109,882 |
[ 1.0% - 1.5% ] 1.43% | 43,921 | $63,036 |
[ 1.0% - 1.5% ] 1.45% | 79,187 | $104,235 |
[ 1.5% - 2.0% ] 1.52% | 106,355 | $100,819 |
[ 1.5% - 2.0% ] 1.60% | 2,004 | $84,449 |
[ 1.5% - 2.0% ] 1.64% | 53,590 | $70,584 |
[ 1.5% - 2.0% ] 1.68% | 105,302 | $73,842 |
[ 1.5% - 2.0% ] 1.75% | 28,253 | $82,018 |
[ 1.5% - 2.0% ] 1.82% | 16,823 | $146,982 |
[ 1.5% - 2.0% ] 1.87% | 197,840 | $68,972 |
[ 1.5% - 2.0% ] 1.94% | 37,785 | $116,266 |
[ 2.0% - 2.5% ] 2.07% | 5,704 | $128,790 |
[ 2.0% - 2.5% ] 2.10% | 27,827 | $144,789 |
[ 2.0% - 2.5% ] 2.18% | 83,562 | $101,728 |
[ 2.0% - 2.5% ] 2.21% | 9,329 | $78,587 |
[ 2.0% - 2.5% ] 2.28% | 33,033 | $91,034 |
[ 2.0% - 2.5% ] 2.46% | 57,042 | $63,224 |
[ 2.0% - 2.5% ] 2.49% | 1,729 | $96,900 |
[ 2.5% - 3.0% ] 2.55% | 61,494 | $75,918 |
[ 2.5% - 3.0% ] 2.64% | 4,400 | $193,750 |
[ 2.5% - 3.0% ] 2.68% | 78,068 | $102,433 |
[ 2.5% - 3.0% ] 2.85% | 3,864 | $70,455 |
[ 2.5% - 3.0% ] 3.00% | 1,567 | $180,967 |
[ 3.0% - 3.5% ] 3.16% | 19,083 | $78,433 |
[ 3.0% - 3.5% ] 3.17% | 14,403 | $92,372 |
[ 3.0% - 3.5% ] 3.32% | 59,225 | $109,664 |
[ 3.0% - 3.5% ] 3.43% | 19,135 | $140,581 |
[ 3.5% - 4.0% ] 3.55% | 23,765 | $129,000 |
[ 3.5% - 4.0% ] 3.79% | 2,771 | $67,841 |
[ 3.5% - 4.0% ] 3.87% | 45,266 | $107,879 |
[ 4.0% - 4.5% ] 4.02% | 448 | $89,688 |
[ 4.0% - 4.5% ] 4.29% | 128,151 | $73,059 |
[ 4.0% - 4.5% ] 4.33% | 3,698 | $134,519 |
[ 4.0% - 4.5% ] 4.40% | 96,358 | $76,939 |
[ 4.0% - 4.5% ] 4.49% | 1,536 | $125,144 |
[ 4.5% - 5.0% ] 4.69% | 59,775 | $71,400 |
[ 4.5% - 5.0% ] 4.96% | 26,536 | $99,390 |
[ 5.0% - 5.5% ] 5.16% | 4,402 | $200,054 |
[ 5.0% - 5.5% ] 5.23% | 45,937 | $93,732 |
[ 5.0% - 5.5% ] 5.25% | 27,848 | $69,547 |
[ 5.0% - 5.5% ] 5.48% | 67,076 | $91,892 |
[ 5.5% - 6.0% ] 5.56% | 34,004 | $86,560 |
[ 5.5% - 6.0% ] 5.58% | 9,320 | $130,290 |
[ 5.5% - 6.0% ] 5.66% | 29,330 | $77,826 |
[ 5.5% - 6.0% ] 5.91% | 22,152 | $120,929 |
[ 5.5% - 6.0% ] 5.94% | 33,170 | $100,786 |
[ 6.0% - 6.5% ] 6.32% | 2,342 | $206,750 |
[ 6.5% - 7.0% ] 6.60% | 16,742 | $133,019 |
[ 7.0% - 7.5% ] 7.02% | 38,727 | $89,600 |
[ 8.5% - 9.0% ] 8.86% | 4,525 | $141,774 |
[ 9.0% - 9.5% ] 9.27% | 34,921 | $70,549 |
[ 9.5% - 10.0% ] 9.58% | 33,174 | $111,447 |
[ 10.5% - 11.0% ] 10.51% | 21,587 | $77,463 |
[ 11.0% - 11.5% ] 11.00% | 6,018 | $142,768 |
[ 11.0% - 11.5% ] 11.50% | 133,744 | $75,381 |
[ 18.0% - 18.5% ] 18.47% | 43,232 | $73,422 |