Assyrian/Chaldean/Syriac Single Father Poverty

COMPARE

Assyrian/Chaldean/Syriac
Race
Ancestry
AfghanAfricanAlaska NativeAlaskan AthabascanAlbanianAleutAlsatianAmericanApacheArabArapahoArgentineanArmenianAssyrian/Chaldean/SyriacAustralianAustrianBahamianBangladeshiBarbadianBasqueBelgianBelizeanBermudanBhutaneseBlackfeetBolivianBrazilianBritishBritish West IndianBulgarianBurmeseCajunCambodianCanadianCape VerdeanCarpatho RusynCelticCentral AmericanCentral American IndianCherokeeCheyenneChickasawChileanChineseChippewaChoctawColombianColvilleComancheCosta RicanCreeCreekCroatianCrowCubanCypriotCzechCzechoslovakianDanishDelawareDominicanDutchDutch West IndianEastern EuropeanEcuadorianEgyptianEnglishEstonianEthiopianEuropeanFijianFilipinoFinnishFrenchFrench American IndianFrench CanadianGermanGerman RussianGhanaianGreekGuamanian/ChamorroGuatemalanGuyaneseHaitianHmongHonduranHopiHoumaHungarianIcelanderIndian (Asian)IndonesianInupiatIranianIraqiIrishIroquoisIsraeliItalianJamaicanJapaneseJordanianKenyanKiowaKoreanLaotianLatvianLebaneseLiberianLithuanianLumbeeLuxembourgerMacedonianMalaysianMalteseMarshalleseMenomineeMexicanMexican American IndianMongolianMoroccanNative HawaiianNavajoNepaleseNew ZealanderNicaraguanNigerianNorthern EuropeanNorwegianOkinawanOsageOttawaPaiutePakistaniPalestinianPanamanianParaguayanPennsylvania GermanPeruvianPimaPolishPortuguesePotawatomiPuebloPuerto RicanPuget Sound SalishRomanianRussianSalvadoranSamoanScandinavianScotch-IrishScottishSeminoleSenegaleseSerbianShoshoneSierra LeoneanSiouxSlavicSlovakSloveneSomaliSouth AfricanSouth AmericanSouth American IndianSoviet UnionSpaniardSpanishSpanish AmericanSpanish American IndianSri LankanSubsaharan AfricanSudaneseSwedishSwissSyrianTaiwaneseThaiTlingit-HaidaTohono O'OdhamTonganTrinidadian and TobagonianTsimshianTurkishU.S. Virgin IslanderUgandanUkrainianUruguayanUteVenezuelanVietnameseWelshWest IndianYakamaYaquiYugoslavianYumanYup'ikZimbabwean
Immigration
NonimmigrantsImmigrantsAfghanistanAfricaAlbaniaArgentinaArmeniaAsiaAustraliaAustriaBahamasBangladeshBarbadosBelarusBelgiumBelizeBoliviaBosnia and HerzegovinaBrazilBulgariaBurma/MyanmarCabo VerdeCambodiaCameroonCanadaCaribbeanCentral AmericaChileChinaColombiaCongoCosta RicaCroatiaCubaCzechoslovakiaDenmarkDominicaDominican RepublicEastern AfricaEastern AsiaEastern EuropeEcuadorEgyptEl SalvadorEnglandEritreaEthiopiaEuropeFijiFranceGermanyGhanaGreeceGrenadaGuatemalaGuyanaHaitiHondurasHong KongHungaryIndiaIndonesiaIranIraqIrelandIsraelItalyJamaicaJapanJordanKazakhstanKenyaKoreaKuwaitLaosLatin AmericaLatviaLebanonLiberiaLithuaniaMalaysiaMexicoMicronesiaMiddle AfricaMoldovaMoroccoNepalNetherlandsNicaraguaNigeriaNorth AmericaNorth MacedoniaNorthern AfricaNorthern EuropeNorwayOceaniaPakistanPanamaPeruPhilippinesPolandPortugalRomaniaRussiaSaudi ArabiaScotlandSenegalSerbiaSierra LeoneSingaporeSomaliaSouth AfricaSouth AmericaSouth Central AsiaSouth Eastern AsiaSouthern EuropeSpainSri LankaSt. Vincent and the GrenadinesSudanSwedenSwitzerlandSyriaTaiwanThailandTrinidad and TobagoTurkeyUgandaUkraineUruguayUzbekistanVenezuelaVietnamWest IndiesWestern AfricaWestern AsiaWestern EuropeYemenZaireZimbabweAzores
Select to Compare
Race
Ancestry
AfghanAfricanAlaska NativeAlaskan AthabascanAlbanianAleutAlsatianAmericanApacheArabArapahoArgentineanArmenianAustralianAustrianBahamianBangladeshiBarbadianBasqueBelgianBelizeanBermudanBhutaneseBlackfeetBolivianBrazilianBritishBritish West IndianBulgarianBurmeseCajunCambodianCanadianCape VerdeanCarpatho RusynCelticCentral AmericanCentral American IndianCherokeeCheyenneChickasawChileanChineseChippewaChoctawColombianColvilleComancheCosta RicanCreeCreekCroatianCrowCubanCypriotCzechCzechoslovakianDanishDelawareDominicanDutchDutch West IndianEastern EuropeanEcuadorianEgyptianEnglishEstonianEthiopianEuropeanFijianFilipinoFinnishFrenchFrench American IndianFrench CanadianGermanGerman RussianGhanaianGreekGuamanian/ChamorroGuatemalanGuyaneseHaitianHmongHonduranHopiHoumaHungarianIcelanderIndian (Asian)IndonesianInupiatIranianIraqiIrishIroquoisIsraeliItalianJamaicanJapaneseJordanianKenyanKiowaKoreanLaotianLatvianLebaneseLiberianLithuanianLumbeeLuxembourgerMacedonianMalaysianMalteseMarshalleseMenomineeMexicanMexican American IndianMongolianMoroccanNative HawaiianNavajoNepaleseNew ZealanderNicaraguanNigerianNorthern EuropeanNorwegianOkinawanOsageOttawaPaiutePakistaniPalestinianPanamanianParaguayanPennsylvania GermanPeruvianPimaPolishPortuguesePotawatomiPuebloPuerto RicanPuget Sound SalishRomanianRussianSalvadoranSamoanScandinavianScotch-IrishScottishSeminoleSenegaleseSerbianShoshoneSierra LeoneanSiouxSlavicSlovakSloveneSomaliSouth AfricanSouth AmericanSouth American IndianSoviet UnionSpaniardSpanishSpanish AmericanSpanish American IndianSri LankanSubsaharan AfricanSudaneseSwedishSwissSyrianTaiwaneseThaiTlingit-HaidaTohono O'OdhamTonganTrinidadian and TobagonianTsimshianTurkishU.S. Virgin IslanderUgandanUkrainianUruguayanUteVenezuelanVietnameseWelshWest IndianYakamaYaquiYugoslavianYumanYup'ikZimbabwean
Immigration
NonimmigrantsImmigrantsAfghanistanAfricaAlbaniaArgentinaArmeniaAsiaAustraliaAustriaBahamasBangladeshBarbadosBelarusBelgiumBelizeBoliviaBosnia and HerzegovinaBrazilBulgariaBurma/MyanmarCabo VerdeCambodiaCameroonCanadaCaribbeanCentral AmericaChileChinaColombiaCongoCosta RicaCroatiaCubaCzechoslovakiaDenmarkDominicaDominican RepublicEastern AfricaEastern AsiaEastern EuropeEcuadorEgyptEl SalvadorEnglandEritreaEthiopiaEuropeFijiFranceGermanyGhanaGreeceGrenadaGuatemalaGuyanaHaitiHondurasHong KongHungaryIndiaIndonesiaIranIraqIrelandIsraelItalyJamaicaJapanJordanKazakhstanKenyaKoreaKuwaitLaosLatin AmericaLatviaLebanonLiberiaLithuaniaMalaysiaMexicoMicronesiaMiddle AfricaMoldovaMoroccoNepalNetherlandsNicaraguaNigeriaNorth AmericaNorth MacedoniaNorthern AfricaNorthern EuropeNorwayOceaniaPakistanPanamaPeruPhilippinesPolandPortugalRomaniaRussiaSaudi ArabiaScotlandSenegalSerbiaSierra LeoneSingaporeSomaliaSouth AfricaSouth AmericaSouth Central AsiaSouth Eastern AsiaSouthern EuropeSpainSri LankaSt. Vincent and the GrenadinesSudanSwedenSwitzerlandSyriaTaiwanThailandTrinidad and TobagoTurkeyUgandaUkraineUruguayUzbekistanVenezuelaVietnamWest IndiesWestern AfricaWestern AsiaWestern EuropeYemenZaireZimbabweAzores
Single Father Poverty
Income
Poverty
Unemployment
Labor Participation
Family Structure
Vehicle Availability
Education Level
Disability

Assyrian/Chaldean/Syriac Single Father Poverty
Exceptional

11.7%
POVERTY | SINGLE FATHERS
100.0/ 100
METRIC RATING
1st/ 347
METRIC RANK

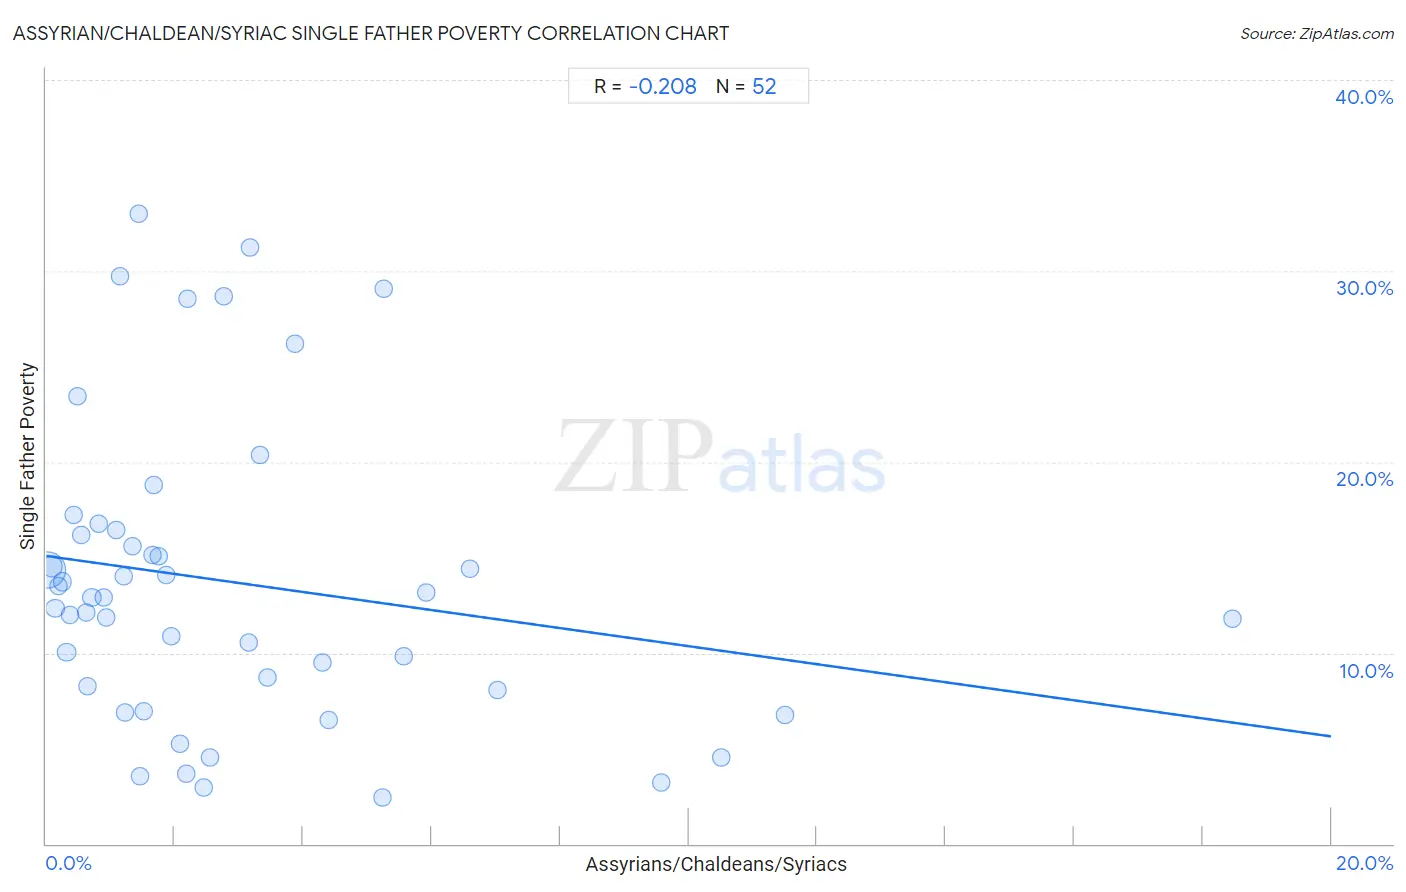
Assyrian/Chaldean/Syriac Single Father Poverty Correlation Chart

The statistical analysis conducted on geographies consisting of 96,953,976 people shows a weak negative correlation between the proportion of Assyrians/Chaldeans/Syriacs and poverty level among single fathers in the United States with a correlation coefficient (R) of -0.208 and weighted average of 11.7%. On average, for every 1% (one percent) increase in Assyrians/Chaldeans/Syriacs within a typical geography, there is a decrease of 0.47% in poverty level among single fathers.
Assyrian/Chaldean/Syriac Single Father Poverty
It is essential to understand that the correlation between the percentage of Assyrians/Chaldeans/Syriacs and poverty level among single fathers does not imply a direct cause-and-effect relationship. It remains uncertain whether the presence of Assyrians/Chaldeans/Syriacs influences an upward or downward trend in the level of poverty level among single fathers within an area, or if Assyrians/Chaldeans/Syriacs simply ended up residing in those areas with higher or lower levels of poverty level among single fathers due to other factors.

Demographics Similar to Assyrians/Chaldeans/Syriacs by Single Father Poverty

In terms of single father poverty, the demographic groups most similar to Assyrians/Chaldeans/Syriacs are Tongan (12.2%, a difference of 4.2%), Tsimshian (12.7%, a difference of 8.3%), Immigrants from Fiji (13.2%, a difference of 12.8%), Immigrants from Ethiopia (13.4%, a difference of 14.6%), and Ethiopian (13.5%, a difference of 15.5%).
DemographicsRating | RankSingle Father Poverty
Assyrians/Chaldeans/Syriacs
100.0
/100
|
#1
Exceptional
11.7%
Tongans
100.0
/100
|
#2
Exceptional
12.2%
Tsimshian
100.0
/100
|
#3
Exceptional
12.7%
Immigrants from Fiji
100.0
/100
|
#4
Exceptional
13.2%
Immigrants from Ethiopia
100.0
/100
|
#5
Exceptional
13.4%
Ethiopians
100.0
/100
|
#6
Exceptional
13.5%
Immigrants from Taiwan
100.0
/100
|
#7
Exceptional
13.7%
Samoans
100.0
/100
|
#8
Exceptional
13.8%
Afghans
100.0
/100
|
#9
Exceptional
14.0%
Koreans
100.0
/100
|
#10
Exceptional
14.0%
Filipinos
100.0
/100
|
#11
Exceptional
14.0%
Immigrants from India
100.0
/100
|
#12
Exceptional
14.0%
Immigrants from Philippines
100.0
/100
|
#13
Exceptional
14.0%
Immigrants from Vietnam
100.0
/100
|
#14
Exceptional
14.1%
Sri Lankans
100.0
/100
|
#15
Exceptional
14.2%

Assyrian/Chaldean/Syriac Single Father Poverty Correlation Summary

MeasurementAssyrian/Chaldean/Syriac DataSingle Father Poverty Data
Minimum0.016%2.4%
Maximum18.5%33.0%
Range18.5%30.5%
Mean2.9%13.7%
Median1.7%12.9%
Interquartile 25% (IQ1)0.76%8.2%
Interquartile 75% (IQ3)3.7%16.3%
Interquartile Range (IQR)2.9%8.1%
Standard Deviation (Sample)3.5%7.8%
Standard Deviation (Population)3.4%7.8%

Correlation Details

Assyrian/Chaldean/Syriac PercentileSample SizeSingle Father Poverty
[
0.0%
-
0.5%
]
0.016%
71,520,13314.4%
[
0.0%
-
0.5%
]
0.089%
13,024,78314.5%
[
0.0%
-
0.5%
]
0.14%
3,494,00812.3%
[
0.0%
-
0.5%
]
0.19%
1,795,40813.5%
[
0.0%
-
0.5%
]
0.25%
988,13713.7%
[
0.0%
-
0.5%
]
0.31%
2,059,52110.0%
[
0.0%
-
0.5%
]
0.38%
290,95912.0%
[
0.0%
-
0.5%
]
0.43%
495,88217.2%
[
0.0%
-
0.5%
]
0.49%
86,31423.4%
[
0.5%
-
1.0%
]
0.54%
187,67016.2%
[
0.5%
-
1.0%
]
0.61%
170,64012.1%
[
0.5%
-
1.0%
]
0.64%
45,9068.3%
[
0.5%
-
1.0%
]
0.71%
161,27612.9%
[
0.5%
-
1.0%
]
0.82%
143,74416.8%
[
0.5%
-
1.0%
]
0.89%
364,01812.9%
[
0.5%
-
1.0%
]
0.93%
211,54311.8%
[
1.0%
-
1.5%
]
1.09%
61,98816.4%
[
1.0%
-
1.5%
]
1.14%
50,67529.7%
[
1.0%
-
1.5%
]
1.21%
20,87814.0%
[
1.0%
-
1.5%
]
1.23%
88,6706.9%
[
1.0%
-
1.5%
]
1.34%
115,22515.6%
[
1.0%
-
1.5%
]
1.43%
42,62133.0%
[
1.0%
-
1.5%
]
1.45%
79,1873.6%
[
1.5%
-
2.0%
]
1.51%
63,7896.9%
[
1.5%
-
2.0%
]
1.65%
24,25415.1%
[
1.5%
-
2.0%
]
1.67%
86,48818.8%
[
1.5%
-
2.0%
]
1.75%
21,90215.0%
[
1.5%
-
2.0%
]
1.87%
169,57714.1%
[
1.5%
-
2.0%
]
1.94%
30,62610.9%
[
2.0%
-
2.5%
]
2.08%
17,3665.3%
[
2.0%
-
2.5%
]
2.18%
83,5623.7%
[
2.0%
-
2.5%
]
2.19%
6,24828.6%
[
2.0%
-
2.5%
]
2.46%
57,0422.9%
[
2.5%
-
3.0%
]
2.55%
61,4944.5%
[
2.5%
-
3.0%
]
2.76%
38,00328.7%
[
3.0%
-
3.5%
]
3.16%
19,08310.5%
[
3.0%
-
3.5%
]
3.17%
14,40331.2%
[
3.0%
-
3.5%
]
3.32%
59,22520.3%
[
3.0%
-
3.5%
]
3.44%
14,8068.7%
[
3.5%
-
4.0%
]
3.87%
45,26626.2%
[
4.0%
-
4.5%
]
4.29%
128,1519.5%
[
4.0%
-
4.5%
]
4.40%
96,3586.5%
[
5.0%
-
5.5%
]
5.23%
45,9372.4%
[
5.0%
-
5.5%
]
5.25%
27,84829.1%
[
5.5%
-
6.0%
]
5.56%
34,0049.8%
[
5.5%
-
6.0%
]
5.91%
22,15213.2%
[
6.5%
-
7.0%
]
6.60%
16,74214.4%
[
7.0%
-
7.5%
]
7.02%
38,7278.1%
[
9.5%
-
10.0%
]
9.58%
33,1743.2%
[
10.5%
-
11.0%
]
10.51%
21,5874.5%
[
11.0%
-
11.5%
]
11.50%
133,7446.7%
[
18.0%
-
18.5%
]
18.47%
43,23211.8%