Assyrian/Chaldean/Syriac Births to Unmarried Women
COMPARE
Assyrian/Chaldean/Syriac
Select to Compare
Births to Unmarried Women
Assyrian/Chaldean/Syriac Births to Unmarried Women
22.0%
BIRTHS TO UNMARRIED WOMEN
100.0/ 100
METRIC RATING
1st/ 347
METRIC RANK
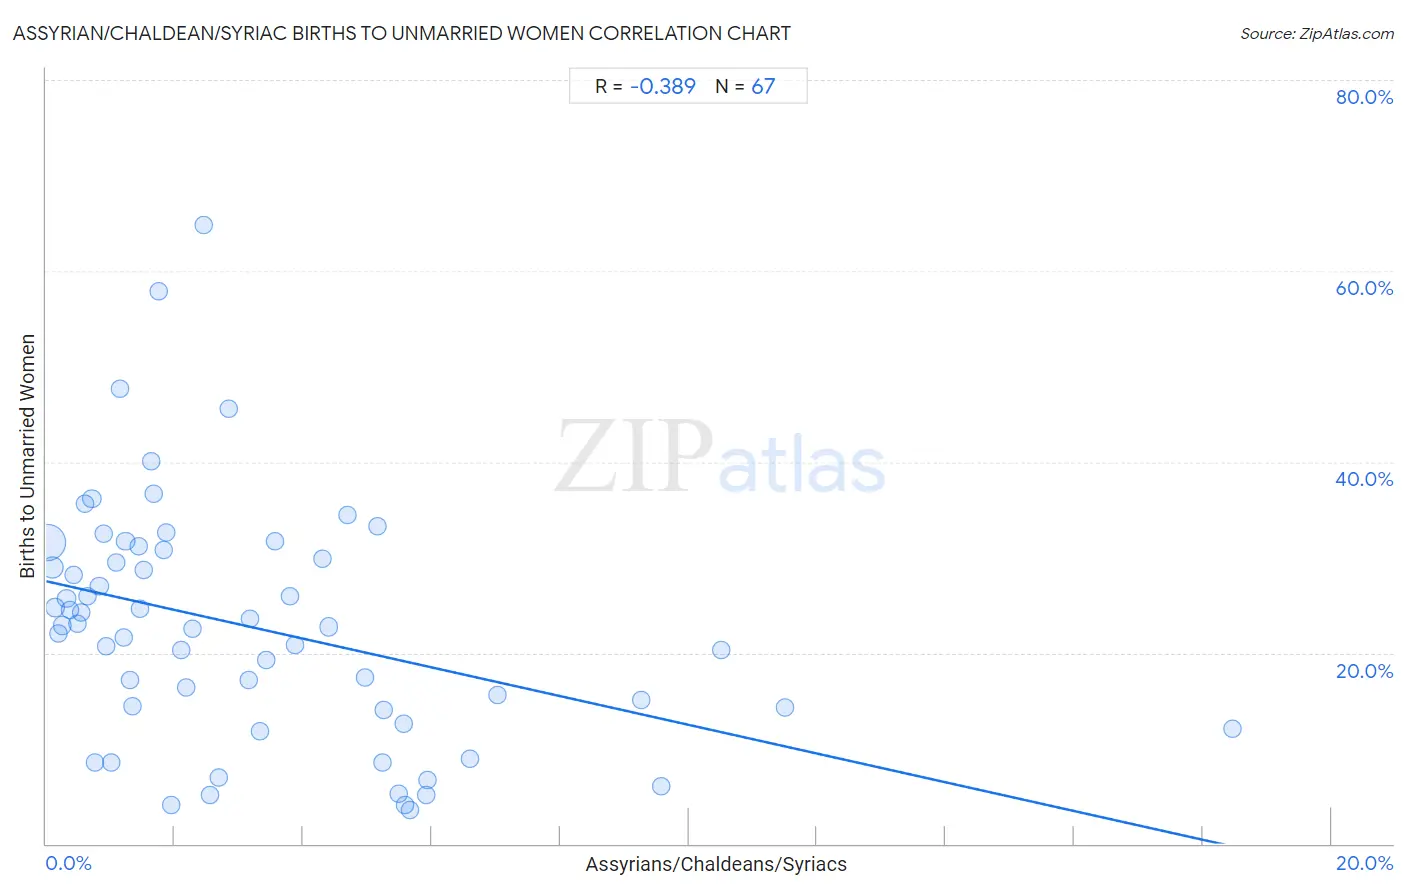
Assyrian/Chaldean/Syriac Births to Unmarried Women Correlation Chart
The statistical analysis conducted on geographies consisting of 106,724,446 people shows a mild negative correlation between the proportion of Assyrians/Chaldeans/Syriacs and percentage of births to unmarried women in the United States with a correlation coefficient (R) of -0.389 and weighted average of 22.0%. On average, for every 1% (one percent) increase in Assyrians/Chaldeans/Syriacs within a typical geography, there is a decrease of 1.5% in percentage of births to unmarried women.
It is essential to understand that the correlation between the percentage of Assyrians/Chaldeans/Syriacs and percentage of births to unmarried women does not imply a direct cause-and-effect relationship. It remains uncertain whether the presence of Assyrians/Chaldeans/Syriacs influences an upward or downward trend in the level of percentage of births to unmarried women within an area, or if Assyrians/Chaldeans/Syriacs simply ended up residing in those areas with higher or lower levels of percentage of births to unmarried women due to other factors.
Demographics Similar to Assyrians/Chaldeans/Syriacs by Births to Unmarried Women
In terms of births to unmarried women, the demographic groups most similar to Assyrians/Chaldeans/Syriacs are Immigrants from India (22.9%, a difference of 4.2%), Filipino (23.0%, a difference of 4.6%), Immigrants from Taiwan (23.0%, a difference of 4.7%), Immigrants from Hong Kong (23.6%, a difference of 7.3%), and Immigrants from Iran (24.0%, a difference of 9.0%).
| Demographics | Rating | Rank | Births to Unmarried Women |
| Assyrians/Chaldeans/Syriacs | 100.0 /100 | #1 | Exceptional 22.0% |
| Immigrants from India | 100.0 /100 | #2 | Exceptional 22.9% |
| Filipinos | 100.0 /100 | #3 | Exceptional 23.0% |
| Immigrants from Taiwan | 100.0 /100 | #4 | Exceptional 23.0% |
| Immigrants from Hong Kong | 100.0 /100 | #5 | Exceptional 23.6% |
| Immigrants from Iran | 100.0 /100 | #6 | Exceptional 24.0% |
| Thais | 100.0 /100 | #7 | Exceptional 24.0% |
| Immigrants from China | 100.0 /100 | #8 | Exceptional 24.7% |
| Immigrants from South Central Asia | 100.0 /100 | #9 | Exceptional 24.7% |
| Immigrants from Eastern Asia | 100.0 /100 | #10 | Exceptional 25.0% |
| Immigrants from Israel | 100.0 /100 | #11 | Exceptional 25.1% |
| Indians (Asian) | 100.0 /100 | #12 | Exceptional 25.3% |
| Iranians | 100.0 /100 | #13 | Exceptional 25.3% |
| Immigrants from Lebanon | 100.0 /100 | #14 | Exceptional 25.3% |
| Immigrants from Singapore | 100.0 /100 | #15 | Exceptional 25.6% |
Assyrian/Chaldean/Syriac Births to Unmarried Women Correlation Summary
| Measurement | Assyrian/Chaldean/Syriac Data | Births to Unmarried Women Data |
| Minimum | 0.017% | 3.5% |
| Maximum | 18.5% | 64.8% |
| Range | 18.5% | 61.3% |
| Mean | 3.2% | 22.7% |
| Median | 2.1% | 22.7% |
| Interquartile 25% (IQ1) | 0.94% | 14.0% |
| Interquartile 75% (IQ3) | 5.0% | 30.8% |
| Interquartile Range (IQR) | 4.0% | 16.8% |
| Standard Deviation (Sample) | 3.3% | 12.6% |
| Standard Deviation (Population) | 3.2% | 12.5% |
Correlation Details
| Assyrian/Chaldean/Syriac Percentile | Sample Size | Births to Unmarried Women |
[ 0.0% - 0.5% ] 0.017% | 75,412,060 | 31.6% |
[ 0.0% - 0.5% ] 0.088% | 15,098,380 | 28.9% |
[ 0.0% - 0.5% ] 0.14% | 4,415,540 | 24.7% |
[ 0.0% - 0.5% ] 0.19% | 2,358,058 | 22.0% |
[ 0.0% - 0.5% ] 0.25% | 1,414,241 | 22.9% |
[ 0.0% - 0.5% ] 0.31% | 2,218,383 | 25.7% |
[ 0.0% - 0.5% ] 0.38% | 395,098 | 24.5% |
[ 0.0% - 0.5% ] 0.43% | 644,788 | 28.2% |
[ 0.0% - 0.5% ] 0.49% | 313,648 | 23.0% |
[ 0.5% - 1.0% ] 0.54% | 330,778 | 24.2% |
[ 0.5% - 1.0% ] 0.61% | 200,438 | 35.6% |
[ 0.5% - 1.0% ] 0.65% | 145,987 | 25.9% |
[ 0.5% - 1.0% ] 0.71% | 161,276 | 36.1% |
[ 0.5% - 1.0% ] 0.76% | 100,899 | 8.5% |
[ 0.5% - 1.0% ] 0.83% | 245,688 | 26.9% |
[ 0.5% - 1.0% ] 0.89% | 415,762 | 32.5% |
[ 0.5% - 1.0% ] 0.94% | 351,049 | 20.7% |
[ 1.0% - 1.5% ] 1.01% | 20,662 | 8.5% |
[ 1.0% - 1.5% ] 1.09% | 67,216 | 29.5% |
[ 1.0% - 1.5% ] 1.14% | 55,734 | 47.6% |
[ 1.0% - 1.5% ] 1.21% | 20,878 | 21.6% |
[ 1.0% - 1.5% ] 1.24% | 112,685 | 31.7% |
[ 1.0% - 1.5% ] 1.31% | 56,756 | 17.2% |
[ 1.0% - 1.5% ] 1.34% | 138,765 | 14.4% |
[ 1.0% - 1.5% ] 1.43% | 42,621 | 31.1% |
[ 1.0% - 1.5% ] 1.45% | 79,187 | 24.6% |
[ 1.5% - 2.0% ] 1.52% | 106,355 | 28.7% |
[ 1.5% - 2.0% ] 1.64% | 53,590 | 40.1% |
[ 1.5% - 2.0% ] 1.68% | 105,302 | 36.6% |
[ 1.5% - 2.0% ] 1.75% | 25,759 | 57.9% |
[ 1.5% - 2.0% ] 1.82% | 11,628 | 30.8% |
[ 1.5% - 2.0% ] 1.87% | 162,315 | 32.6% |
[ 1.5% - 2.0% ] 1.94% | 30,626 | 4.1% |
[ 2.0% - 2.5% ] 2.10% | 27,827 | 20.4% |
[ 2.0% - 2.5% ] 2.18% | 83,562 | 16.4% |
[ 2.0% - 2.5% ] 2.28% | 33,033 | 22.5% |
[ 2.0% - 2.5% ] 2.46% | 57,042 | 64.8% |
[ 2.5% - 3.0% ] 2.55% | 61,494 | 5.1% |
[ 2.5% - 3.0% ] 2.68% | 78,068 | 6.9% |
[ 2.5% - 3.0% ] 2.85% | 3,864 | 45.5% |
[ 3.0% - 3.5% ] 3.16% | 19,083 | 17.2% |
[ 3.0% - 3.5% ] 3.17% | 14,403 | 23.6% |
[ 3.0% - 3.5% ] 3.32% | 59,225 | 11.8% |
[ 3.0% - 3.5% ] 3.43% | 19,135 | 19.2% |
[ 3.5% - 4.0% ] 3.55% | 23,765 | 31.7% |
[ 3.5% - 4.0% ] 3.79% | 2,771 | 25.9% |
[ 3.5% - 4.0% ] 3.87% | 45,266 | 20.8% |
[ 4.0% - 4.5% ] 4.30% | 105,721 | 29.8% |
[ 4.0% - 4.5% ] 4.40% | 96,358 | 22.7% |
[ 4.5% - 5.0% ] 4.69% | 59,775 | 34.4% |
[ 4.5% - 5.0% ] 4.96% | 26,536 | 17.4% |
[ 5.0% - 5.5% ] 5.16% | 4,402 | 33.3% |
[ 5.0% - 5.5% ] 5.23% | 45,937 | 8.5% |
[ 5.0% - 5.5% ] 5.25% | 27,848 | 14.0% |
[ 5.0% - 5.5% ] 5.48% | 67,076 | 5.3% |
[ 5.5% - 6.0% ] 5.56% | 34,004 | 12.6% |
[ 5.5% - 6.0% ] 5.58% | 9,320 | 4.0% |
[ 5.5% - 6.0% ] 5.66% | 29,330 | 3.5% |
[ 5.5% - 6.0% ] 5.91% | 22,152 | 5.1% |
[ 5.5% - 6.0% ] 5.94% | 33,170 | 6.7% |
[ 6.5% - 7.0% ] 6.60% | 16,742 | 8.9% |
[ 7.0% - 7.5% ] 7.02% | 38,727 | 15.6% |
[ 9.0% - 9.5% ] 9.27% | 34,921 | 15.0% |
[ 9.5% - 10.0% ] 9.58% | 33,174 | 6.0% |
[ 10.5% - 11.0% ] 10.51% | 21,587 | 20.3% |
[ 11.0% - 11.5% ] 11.50% | 133,744 | 14.3% |
[ 18.0% - 18.5% ] 18.47% | 43,232 | 12.0% |