Assyrian/Chaldean/Syriac Median Family Income
COMPARE
Assyrian/Chaldean/Syriac
Select to Compare
Median Family Income
Assyrian/Chaldean/Syriac Median Family Income
$109,622
FAMILY INCOME
97.2/ 100
METRIC RATING
102nd/ 347
METRIC RANK
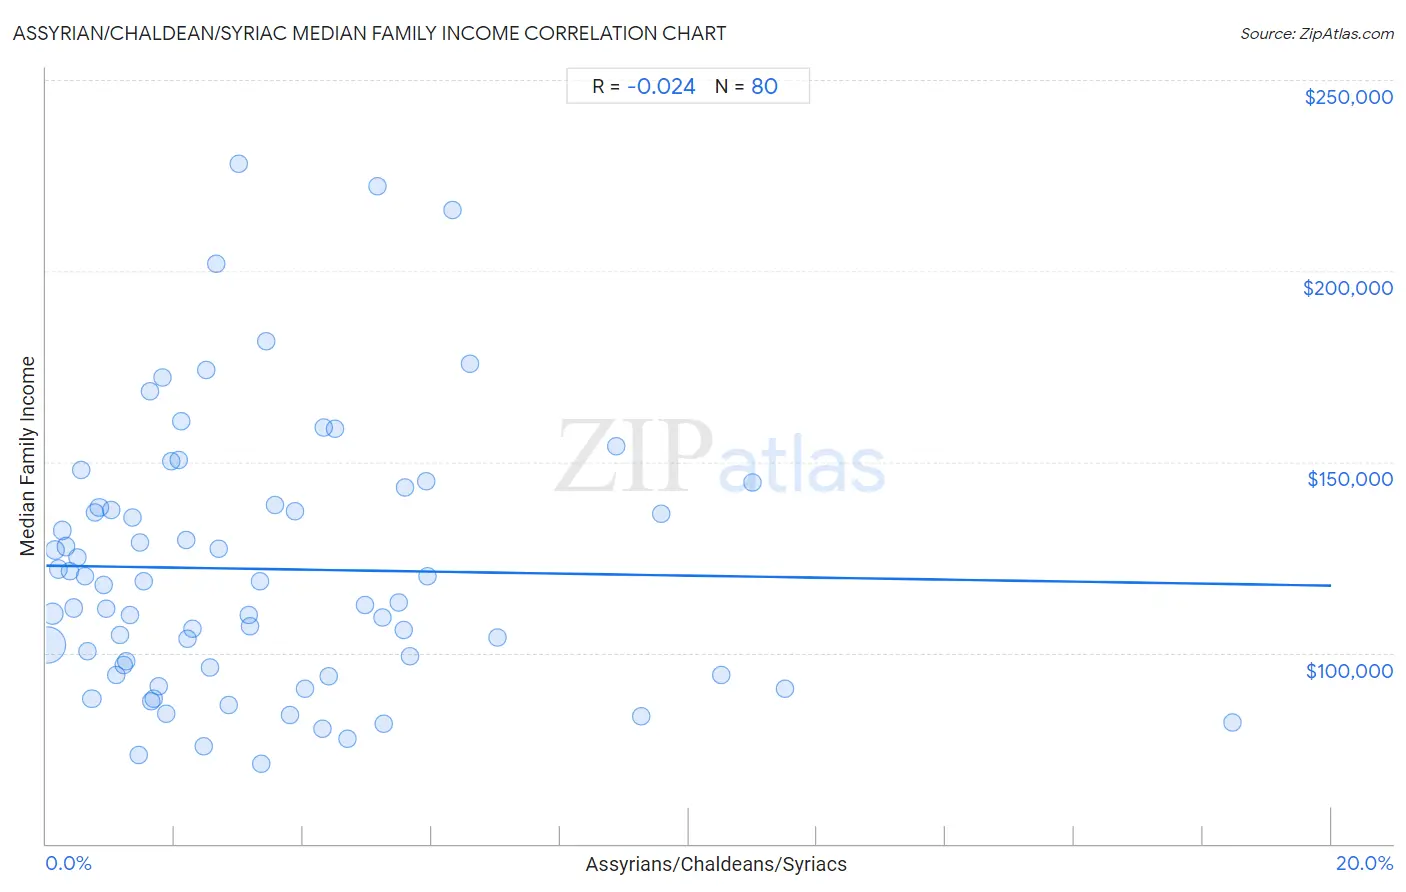
Assyrian/Chaldean/Syriac Median Family Income Correlation Chart
The statistical analysis conducted on geographies consisting of 110,249,217 people shows no correlation between the proportion of Assyrians/Chaldeans/Syriacs and median family income in the United States with a correlation coefficient (R) of -0.024 and weighted average of $109,622. On average, for every 1% (one percent) increase in Assyrians/Chaldeans/Syriacs within a typical geography, there is a decrease of $262 in median family income.
It is essential to understand that the correlation between the percentage of Assyrians/Chaldeans/Syriacs and median family income does not imply a direct cause-and-effect relationship. It remains uncertain whether the presence of Assyrians/Chaldeans/Syriacs influences an upward or downward trend in the level of median family income within an area, or if Assyrians/Chaldeans/Syriacs simply ended up residing in those areas with higher or lower levels of median family income due to other factors.
Demographics Similar to Assyrians/Chaldeans/Syriacs by Median Family Income
In terms of median family income, the demographic groups most similar to Assyrians/Chaldeans/Syriacs are Immigrants from Ukraine ($109,645, a difference of 0.020%), Macedonian ($109,668, a difference of 0.040%), Armenian ($109,692, a difference of 0.060%), Immigrants from Kuwait ($109,731, a difference of 0.10%), and Immigrants from Brazil ($109,418, a difference of 0.19%).
| Demographics | Rating | Rank | Median Family Income |
| Zimbabweans | 97.7 /100 | #95 | Exceptional $110,011 |
| Immigrants from Moldova | 97.7 /100 | #96 | Exceptional $109,975 |
| Jordanians | 97.5 /100 | #97 | Exceptional $109,865 |
| Immigrants from Kuwait | 97.4 /100 | #98 | Exceptional $109,731 |
| Armenians | 97.3 /100 | #99 | Exceptional $109,692 |
| Macedonians | 97.3 /100 | #100 | Exceptional $109,668 |
| Immigrants from Ukraine | 97.2 /100 | #101 | Exceptional $109,645 |
| Assyrians/Chaldeans/Syriacs | 97.2 /100 | #102 | Exceptional $109,622 |
| Immigrants from Brazil | 96.9 /100 | #103 | Exceptional $109,418 |
| Palestinians | 96.9 /100 | #104 | Exceptional $109,413 |
| Syrians | 96.7 /100 | #105 | Exceptional $109,299 |
| Albanians | 96.4 /100 | #106 | Exceptional $109,136 |
| Immigrants from North Macedonia | 96.4 /100 | #107 | Exceptional $109,136 |
| Immigrants from Zimbabwe | 95.9 /100 | #108 | Exceptional $108,830 |
| Immigrants from Afghanistan | 95.6 /100 | #109 | Exceptional $108,709 |
Assyrian/Chaldean/Syriac Median Family Income Correlation Summary
| Measurement | Assyrian/Chaldean/Syriac Data | Median Family Income Data |
| Minimum | 0.017% | $71,012 |
| Maximum | 18.5% | $228,043 |
| Range | 18.5% | $157,031 |
| Mean | 3.4% | $121,955 |
| Median | 2.5% | $115,499 |
| Interquartile 25% (IQ1) | 1.2% | $95,222 |
| Interquartile 75% (IQ3) | 4.8% | $138,288 |
| Interquartile Range (IQR) | 3.7% | $43,065 |
| Standard Deviation (Sample) | 3.2% | $34,820 |
| Standard Deviation (Population) | 3.2% | $34,602 |
Correlation Details
| Assyrian/Chaldean/Syriac Percentile | Sample Size | Median Family Income |
[ 0.0% - 0.5% ] 0.017% | 76,591,466 | $101,959 |
[ 0.0% - 0.5% ] 0.088% | 15,761,987 | $110,317 |
[ 0.0% - 0.5% ] 0.14% | 4,987,029 | $126,914 |
[ 0.0% - 0.5% ] 0.19% | 2,667,713 | $121,909 |
[ 0.0% - 0.5% ] 0.25% | 1,580,204 | $132,055 |
[ 0.0% - 0.5% ] 0.31% | 2,272,114 | $127,877 |
[ 0.0% - 0.5% ] 0.38% | 427,498 | $121,411 |
[ 0.0% - 0.5% ] 0.43% | 730,632 | $111,738 |
[ 0.0% - 0.5% ] 0.49% | 414,769 | $124,888 |
[ 0.5% - 1.0% ] 0.54% | 371,348 | $147,863 |
[ 0.5% - 1.0% ] 0.61% | 223,333 | $120,024 |
[ 0.5% - 1.0% ] 0.65% | 153,305 | $100,298 |
[ 0.5% - 1.0% ] 0.71% | 161,276 | $87,846 |
[ 0.5% - 1.0% ] 0.76% | 100,899 | $136,651 |
[ 0.5% - 1.0% ] 0.83% | 254,310 | $137,997 |
[ 0.5% - 1.0% ] 0.89% | 448,550 | $117,678 |
[ 0.5% - 1.0% ] 0.94% | 357,524 | $111,471 |
[ 1.0% - 1.5% ] 1.01% | 121,482 | $137,445 |
[ 1.0% - 1.5% ] 1.09% | 67,503 | $94,276 |
[ 1.0% - 1.5% ] 1.14% | 55,734 | $104,778 |
[ 1.0% - 1.5% ] 1.20% | 25,085 | $96,657 |
[ 1.0% - 1.5% ] 1.24% | 117,116 | $97,896 |
[ 1.0% - 1.5% ] 1.31% | 65,393 | $109,984 |
[ 1.0% - 1.5% ] 1.34% | 146,945 | $135,494 |
[ 1.0% - 1.5% ] 1.43% | 43,921 | $73,389 |
[ 1.0% - 1.5% ] 1.45% | 79,187 | $128,756 |
[ 1.5% - 2.0% ] 1.52% | 106,355 | $118,598 |
[ 1.5% - 2.0% ] 1.61% | 747 | $168,571 |
[ 1.5% - 2.0% ] 1.64% | 53,590 | $87,257 |
[ 1.5% - 2.0% ] 1.68% | 105,302 | $88,018 |
[ 1.5% - 2.0% ] 1.75% | 28,253 | $91,362 |
[ 1.5% - 2.0% ] 1.82% | 16,823 | $171,977 |
[ 1.5% - 2.0% ] 1.87% | 197,840 | $83,899 |
[ 1.5% - 2.0% ] 1.94% | 37,785 | $150,000 |
[ 2.0% - 2.5% ] 2.07% | 5,704 | $150,435 |
[ 2.0% - 2.5% ] 2.10% | 27,827 | $160,616 |
[ 2.0% - 2.5% ] 2.18% | 83,562 | $129,403 |
[ 2.0% - 2.5% ] 2.21% | 9,329 | $103,656 |
[ 2.0% - 2.5% ] 2.28% | 33,033 | $106,347 |
[ 2.0% - 2.5% ] 2.46% | 57,042 | $75,505 |
[ 2.0% - 2.5% ] 2.49% | 1,729 | $174,063 |
[ 2.5% - 3.0% ] 2.55% | 61,494 | $96,166 |
[ 2.5% - 3.0% ] 2.64% | 4,400 | $201,848 |
[ 2.5% - 3.0% ] 2.68% | 78,068 | $127,332 |
[ 2.5% - 3.0% ] 2.85% | 3,864 | $86,291 |
[ 2.5% - 3.0% ] 3.00% | 1,567 | $228,043 |
[ 3.0% - 3.5% ] 3.16% | 19,083 | $109,899 |
[ 3.0% - 3.5% ] 3.17% | 14,403 | $106,972 |
[ 3.0% - 3.5% ] 3.32% | 59,225 | $118,600 |
[ 3.0% - 3.5% ] 3.35% | 179 | $71,012 |
[ 3.0% - 3.5% ] 3.43% | 19,135 | $181,520 |
[ 3.5% - 4.0% ] 3.55% | 23,765 | $138,579 |
[ 3.5% - 4.0% ] 3.79% | 2,771 | $83,661 |
[ 3.5% - 4.0% ] 3.87% | 45,266 | $137,117 |
[ 4.0% - 4.5% ] 4.02% | 448 | $90,714 |
[ 4.0% - 4.5% ] 4.29% | 128,151 | $80,230 |
[ 4.0% - 4.5% ] 4.33% | 3,698 | $159,023 |
[ 4.0% - 4.5% ] 4.40% | 96,358 | $94,008 |
[ 4.0% - 4.5% ] 4.49% | 1,536 | $158,750 |
[ 4.5% - 5.0% ] 4.69% | 59,775 | $77,576 |
[ 4.5% - 5.0% ] 4.96% | 26,536 | $112,446 |
[ 5.0% - 5.5% ] 5.16% | 4,402 | $222,283 |
[ 5.0% - 5.5% ] 5.23% | 45,937 | $109,249 |
[ 5.0% - 5.5% ] 5.25% | 27,848 | $81,310 |
[ 5.0% - 5.5% ] 5.48% | 67,076 | $113,320 |
[ 5.5% - 6.0% ] 5.56% | 34,004 | $105,845 |
[ 5.5% - 6.0% ] 5.58% | 9,320 | $143,231 |
[ 5.5% - 6.0% ] 5.66% | 29,330 | $98,941 |
[ 5.5% - 6.0% ] 5.91% | 22,152 | $144,796 |
[ 5.5% - 6.0% ] 5.94% | 33,170 | $120,015 |
[ 6.0% - 6.5% ] 6.32% | 2,342 | $216,000 |
[ 6.5% - 7.0% ] 6.60% | 16,742 | $175,800 |
[ 7.0% - 7.5% ] 7.02% | 38,727 | $103,890 |
[ 8.5% - 9.0% ] 8.86% | 4,525 | $154,107 |
[ 9.0% - 9.5% ] 9.27% | 34,921 | $83,239 |
[ 9.5% - 10.0% ] 9.58% | 33,174 | $136,288 |
[ 10.5% - 11.0% ] 10.51% | 21,587 | $94,279 |
[ 11.0% - 11.5% ] 11.00% | 6,018 | $144,455 |
[ 11.0% - 11.5% ] 11.50% | 133,744 | $90,488 |
[ 18.0% - 18.5% ] 18.47% | 43,232 | $81,823 |