Assyrian/Chaldean/Syriac Per Capita Income
COMPARE
Assyrian/Chaldean/Syriac
Select to Compare
Per Capita Income
Assyrian/Chaldean/Syriac Per Capita Income
$45,195
PER CAPITA INCOME
84.8/ 100
METRIC RATING
138th/ 347
METRIC RANK
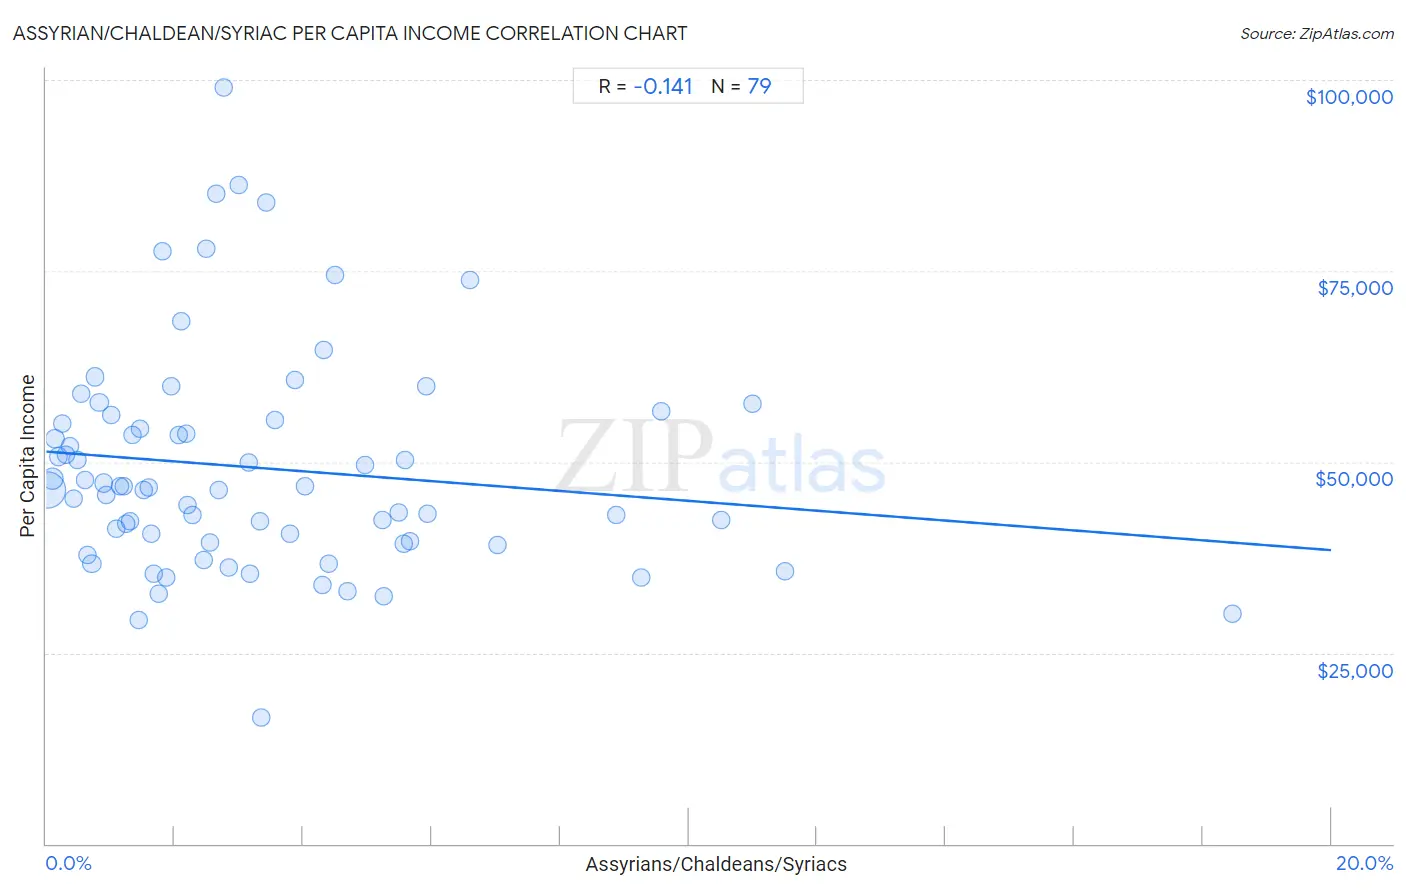
Assyrian/Chaldean/Syriac Per Capita Income Correlation Chart
The statistical analysis conducted on geographies consisting of 110,311,560 people shows a poor negative correlation between the proportion of Assyrians/Chaldeans/Syriacs and per capita income in the United States with a correlation coefficient (R) of -0.141 and weighted average of $45,195. On average, for every 1% (one percent) increase in Assyrians/Chaldeans/Syriacs within a typical geography, there is a decrease of $645 in per capita income.
It is essential to understand that the correlation between the percentage of Assyrians/Chaldeans/Syriacs and per capita income does not imply a direct cause-and-effect relationship. It remains uncertain whether the presence of Assyrians/Chaldeans/Syriacs influences an upward or downward trend in the level of per capita income within an area, or if Assyrians/Chaldeans/Syriacs simply ended up residing in those areas with higher or lower levels of per capita income due to other factors.
Demographics Similar to Assyrians/Chaldeans/Syriacs by Per Capita Income
In terms of per capita income, the demographic groups most similar to Assyrians/Chaldeans/Syriacs are Immigrants from Syria ($45,218, a difference of 0.050%), Immigrants from Oceania ($45,220, a difference of 0.060%), Basque ($45,086, a difference of 0.24%), Immigrants from Jordan ($45,066, a difference of 0.29%), and Slavic ($45,049, a difference of 0.32%).
| Demographics | Rating | Rank | Per Capita Income |
| Immigrants from North Macedonia | 90.0 /100 | #131 | Exceptional $45,622 |
| Jordanians | 89.9 /100 | #132 | Excellent $45,605 |
| Pakistanis | 89.7 /100 | #133 | Excellent $45,587 |
| Slovenes | 89.6 /100 | #134 | Excellent $45,581 |
| Hungarians | 87.9 /100 | #135 | Excellent $45,426 |
| Immigrants from Oceania | 85.2 /100 | #136 | Excellent $45,220 |
| Immigrants from Syria | 85.2 /100 | #137 | Excellent $45,218 |
| Assyrians/Chaldeans/Syriacs | 84.8 /100 | #138 | Excellent $45,195 |
| Basques | 83.2 /100 | #139 | Excellent $45,086 |
| Immigrants from Jordan | 82.9 /100 | #140 | Excellent $45,066 |
| Slavs | 82.6 /100 | #141 | Excellent $45,049 |
| Ugandans | 82.6 /100 | #142 | Excellent $45,047 |
| Immigrants from Uganda | 82.5 /100 | #143 | Excellent $45,043 |
| Icelanders | 81.6 /100 | #144 | Excellent $44,987 |
| Immigrants from Afghanistan | 78.0 /100 | #145 | Good $44,790 |
Assyrian/Chaldean/Syriac Per Capita Income Correlation Summary
| Measurement | Assyrian/Chaldean/Syriac Data | Per Capita Income Data |
| Minimum | 0.017% | $16,468 |
| Maximum | 18.5% | $99,080 |
| Range | 18.5% | $82,612 |
| Mean | 3.3% | $49,218 |
| Median | 2.5% | $46,715 |
| Interquartile 25% (IQ1) | 1.1% | $39,451 |
| Interquartile 75% (IQ3) | 4.5% | $55,554 |
| Interquartile Range (IQR) | 3.3% | $16,103 |
| Standard Deviation (Sample) | 3.2% | $14,590 |
| Standard Deviation (Population) | 3.2% | $14,497 |
Correlation Details
| Assyrian/Chaldean/Syriac Percentile | Sample Size | Per Capita Income |
[ 0.0% - 0.5% ] 0.017% | 76,608,505 | $46,349 |
[ 0.0% - 0.5% ] 0.088% | 15,761,987 | $47,857 |
[ 0.0% - 0.5% ] 0.14% | 4,987,029 | $52,983 |
[ 0.0% - 0.5% ] 0.19% | 2,667,713 | $50,693 |
[ 0.0% - 0.5% ] 0.25% | 1,580,204 | $54,969 |
[ 0.0% - 0.5% ] 0.31% | 2,274,746 | $50,957 |
[ 0.0% - 0.5% ] 0.38% | 427,498 | $52,032 |
[ 0.0% - 0.5% ] 0.43% | 735,834 | $45,250 |
[ 0.0% - 0.5% ] 0.49% | 414,769 | $50,296 |
[ 0.5% - 1.0% ] 0.54% | 371,348 | $58,978 |
[ 0.5% - 1.0% ] 0.61% | 223,333 | $47,658 |
[ 0.5% - 1.0% ] 0.65% | 153,305 | $37,871 |
[ 0.5% - 1.0% ] 0.71% | 161,276 | $36,634 |
[ 0.5% - 1.0% ] 0.76% | 100,899 | $61,131 |
[ 0.5% - 1.0% ] 0.83% | 254,310 | $57,749 |
[ 0.5% - 1.0% ] 0.89% | 451,360 | $47,227 |
[ 0.5% - 1.0% ] 0.94% | 357,524 | $45,645 |
[ 1.0% - 1.5% ] 1.01% | 121,482 | $56,123 |
[ 1.0% - 1.5% ] 1.09% | 67,503 | $41,304 |
[ 1.0% - 1.5% ] 1.14% | 55,734 | $46,745 |
[ 1.0% - 1.5% ] 1.20% | 25,085 | $46,777 |
[ 1.0% - 1.5% ] 1.24% | 117,360 | $41,891 |
[ 1.0% - 1.5% ] 1.31% | 65,393 | $42,226 |
[ 1.0% - 1.5% ] 1.35% | 148,615 | $53,537 |
[ 1.0% - 1.5% ] 1.43% | 43,921 | $29,220 |
[ 1.0% - 1.5% ] 1.45% | 79,187 | $54,361 |
[ 1.5% - 2.0% ] 1.52% | 106,355 | $46,342 |
[ 1.5% - 2.0% ] 1.60% | 2,004 | $46,715 |
[ 1.5% - 2.0% ] 1.64% | 53,590 | $40,613 |
[ 1.5% - 2.0% ] 1.68% | 105,302 | $35,276 |
[ 1.5% - 2.0% ] 1.75% | 28,483 | $32,662 |
[ 1.5% - 2.0% ] 1.82% | 16,823 | $77,538 |
[ 1.5% - 2.0% ] 1.87% | 197,840 | $34,871 |
[ 1.5% - 2.0% ] 1.94% | 37,785 | $59,899 |
[ 2.0% - 2.5% ] 2.07% | 5,704 | $53,561 |
[ 2.0% - 2.5% ] 2.10% | 27,827 | $68,356 |
[ 2.0% - 2.5% ] 2.18% | 83,562 | $53,661 |
[ 2.0% - 2.5% ] 2.21% | 9,329 | $44,426 |
[ 2.0% - 2.5% ] 2.28% | 33,033 | $43,030 |
[ 2.0% - 2.5% ] 2.46% | 57,042 | $37,113 |
[ 2.0% - 2.5% ] 2.49% | 1,729 | $77,967 |
[ 2.5% - 3.0% ] 2.55% | 61,494 | $39,451 |
[ 2.5% - 3.0% ] 2.64% | 4,400 | $85,172 |
[ 2.5% - 3.0% ] 2.68% | 78,068 | $46,329 |
[ 2.5% - 3.0% ] 2.76% | 38,003 | $99,080 |
[ 2.5% - 3.0% ] 2.85% | 3,864 | $36,230 |
[ 2.5% - 3.0% ] 3.00% | 1,567 | $86,206 |
[ 3.0% - 3.5% ] 3.16% | 19,083 | $49,880 |
[ 3.0% - 3.5% ] 3.17% | 14,403 | $35,373 |
[ 3.0% - 3.5% ] 3.32% | 59,225 | $42,274 |
[ 3.0% - 3.5% ] 3.35% | 179 | $16,468 |
[ 3.0% - 3.5% ] 3.43% | 19,135 | $84,040 |
[ 3.5% - 4.0% ] 3.55% | 23,765 | $55,554 |
[ 3.5% - 4.0% ] 3.79% | 2,771 | $40,560 |
[ 3.5% - 4.0% ] 3.87% | 45,266 | $60,708 |
[ 4.0% - 4.5% ] 4.02% | 448 | $46,866 |
[ 4.0% - 4.5% ] 4.29% | 128,151 | $33,912 |
[ 4.0% - 4.5% ] 4.33% | 3,698 | $64,708 |
[ 4.0% - 4.5% ] 4.40% | 96,358 | $36,730 |
[ 4.0% - 4.5% ] 4.49% | 1,536 | $74,389 |
[ 4.5% - 5.0% ] 4.69% | 59,775 | $33,011 |
[ 4.5% - 5.0% ] 4.96% | 26,536 | $49,609 |
[ 5.0% - 5.5% ] 5.23% | 45,937 | $42,311 |
[ 5.0% - 5.5% ] 5.25% | 27,848 | $32,361 |
[ 5.0% - 5.5% ] 5.48% | 67,076 | $43,338 |
[ 5.5% - 6.0% ] 5.56% | 34,004 | $39,210 |
[ 5.5% - 6.0% ] 5.58% | 9,320 | $50,180 |
[ 5.5% - 6.0% ] 5.66% | 29,330 | $39,535 |
[ 5.5% - 6.0% ] 5.91% | 22,152 | $59,872 |
[ 5.5% - 6.0% ] 5.94% | 33,170 | $43,261 |
[ 6.5% - 7.0% ] 6.60% | 16,742 | $73,810 |
[ 7.0% - 7.5% ] 7.02% | 38,727 | $39,060 |
[ 8.5% - 9.0% ] 8.86% | 4,525 | $43,104 |
[ 9.0% - 9.5% ] 9.27% | 34,921 | $34,788 |
[ 9.5% - 10.0% ] 9.58% | 33,174 | $56,694 |
[ 10.5% - 11.0% ] 10.51% | 21,587 | $42,412 |
[ 11.0% - 11.5% ] 11.00% | 6,018 | $57,569 |
[ 11.0% - 11.5% ] 11.50% | 133,744 | $35,615 |
[ 18.0% - 18.5% ] 18.47% | 43,232 | $30,063 |