Assyrian/Chaldean/Syriac 4 or more Vehicles in Household
COMPARE
Assyrian/Chaldean/Syriac
Select to Compare
4 or more Vehicles in Household
Assyrian/Chaldean/Syriac 4 or more Vehicles in Household
7.2%
4+ VEHICLES AVAILABLE
99.4/ 100
METRIC RATING
91st/ 347
METRIC RANK
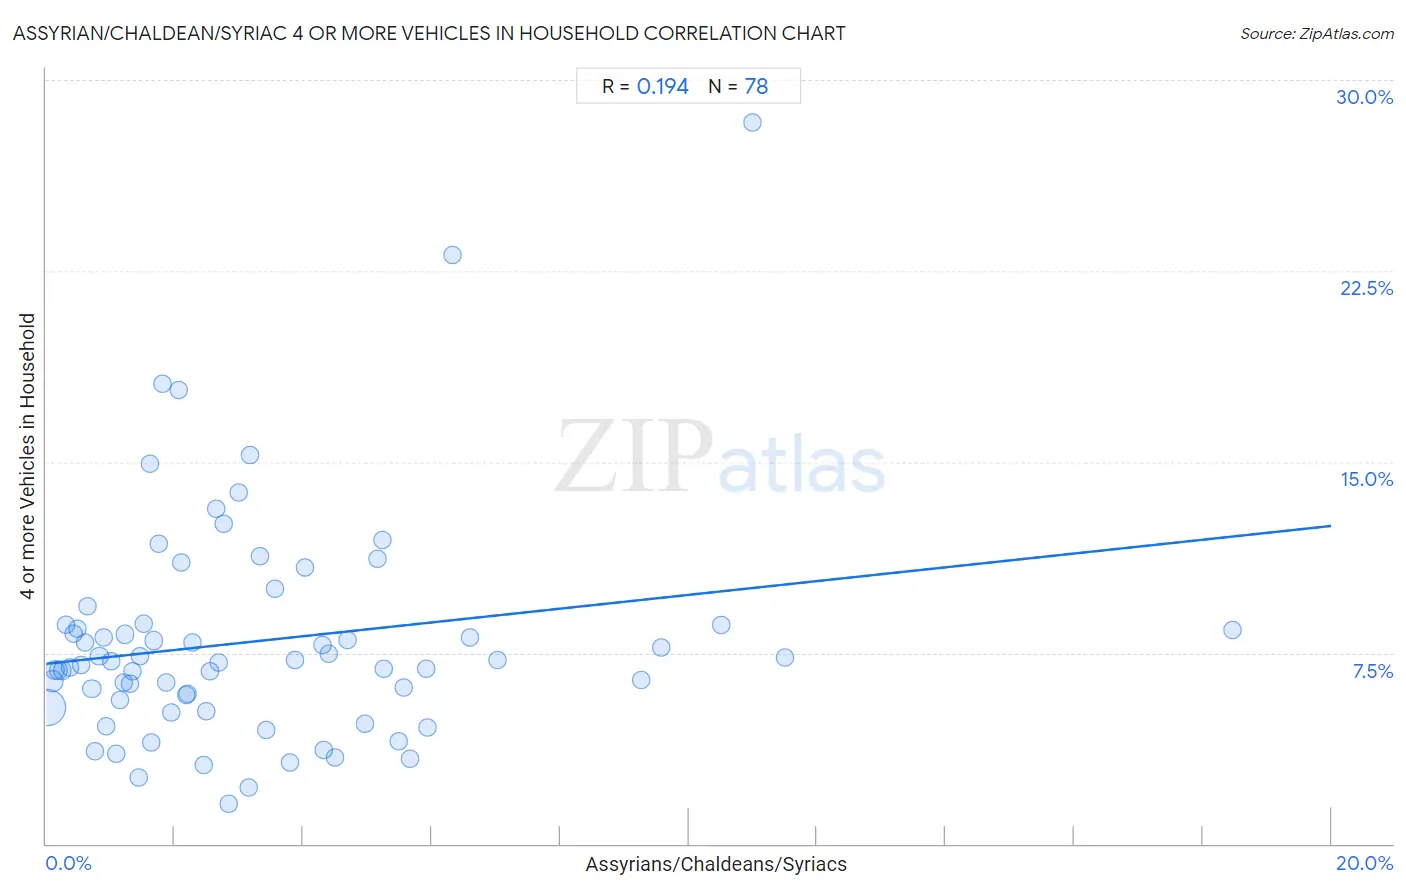
Assyrian/Chaldean/Syriac 4 or more Vehicles in Household Correlation Chart
The statistical analysis conducted on geographies consisting of 110,163,446 people shows a poor positive correlation between the proportion of Assyrians/Chaldeans/Syriacs and percentage of households with 4 or more vehicles available in the United States with a correlation coefficient (R) of 0.194 and weighted average of 7.2%. On average, for every 1% (one percent) increase in Assyrians/Chaldeans/Syriacs within a typical geography, there is an increase of 0.27% in percentage of households with 4 or more vehicles available.
It is essential to understand that the correlation between the percentage of Assyrians/Chaldeans/Syriacs and percentage of households with 4 or more vehicles available does not imply a direct cause-and-effect relationship. It remains uncertain whether the presence of Assyrians/Chaldeans/Syriacs influences an upward or downward trend in the level of percentage of households with 4 or more vehicles available within an area, or if Assyrians/Chaldeans/Syriacs simply ended up residing in those areas with higher or lower levels of percentage of households with 4 or more vehicles available due to other factors.
Demographics Similar to Assyrians/Chaldeans/Syriacs by 4 or more Vehicles in Household
In terms of 4 or more vehicles in household, the demographic groups most similar to Assyrians/Chaldeans/Syriacs are Immigrants from Latin America (7.1%, a difference of 0.16%), Immigrants from Afghanistan (7.1%, a difference of 0.33%), Dutch West Indian (7.1%, a difference of 0.34%), Czechoslovakian (7.1%, a difference of 0.55%), and Creek (7.2%, a difference of 0.56%).
| Demographics | Rating | Rank | 4 or more Vehicles in Household |
| Afghans | 99.7 /100 | #84 | Exceptional 7.3% |
| Cree | 99.7 /100 | #85 | Exceptional 7.2% |
| Immigrants from Indonesia | 99.6 /100 | #86 | Exceptional 7.2% |
| Delaware | 99.6 /100 | #87 | Exceptional 7.2% |
| Nonimmigrants | 99.6 /100 | #88 | Exceptional 7.2% |
| British | 99.6 /100 | #89 | Exceptional 7.2% |
| Creek | 99.6 /100 | #90 | Exceptional 7.2% |
| Assyrians/Chaldeans/Syriacs | 99.4 /100 | #91 | Exceptional 7.2% |
| Immigrants from Latin America | 99.4 /100 | #92 | Exceptional 7.1% |
| Immigrants from Afghanistan | 99.3 /100 | #93 | Exceptional 7.1% |
| Dutch West Indians | 99.3 /100 | #94 | Exceptional 7.1% |
| Czechoslovakians | 99.3 /100 | #95 | Exceptional 7.1% |
| Central Americans | 99.3 /100 | #96 | Exceptional 7.1% |
| Celtics | 99.1 /100 | #97 | Exceptional 7.1% |
| Irish | 99.0 /100 | #98 | Exceptional 7.1% |
Assyrian/Chaldean/Syriac 4 or more Vehicles in Household Correlation Summary
| Measurement | Assyrian/Chaldean/Syriac Data | 4 or more Vehicles in Household Data |
| Minimum | 0.017% | 1.6% |
| Maximum | 18.5% | 28.3% |
| Range | 18.5% | 26.7% |
| Mean | 3.3% | 8.0% |
| Median | 2.4% | 7.1% |
| Interquartile 25% (IQ1) | 1.1% | 5.6% |
| Interquartile 75% (IQ3) | 4.5% | 8.6% |
| Interquartile Range (IQR) | 3.3% | 2.9% |
| Standard Deviation (Sample) | 3.2% | 4.4% |
| Standard Deviation (Population) | 3.1% | 4.4% |
Correlation Details
| Assyrian/Chaldean/Syriac Percentile | Sample Size | 4 or more Vehicles in Household |
[ 0.0% - 0.5% ] 0.017% | 76,561,923 | 5.4% |
[ 0.0% - 0.5% ] 0.088% | 15,698,766 | 6.4% |
[ 0.0% - 0.5% ] 0.14% | 4,987,029 | 6.8% |
[ 0.0% - 0.5% ] 0.19% | 2,657,881 | 6.8% |
[ 0.0% - 0.5% ] 0.25% | 1,580,204 | 6.8% |
[ 0.0% - 0.5% ] 0.31% | 2,272,114 | 8.6% |
[ 0.0% - 0.5% ] 0.38% | 425,223 | 6.9% |
[ 0.0% - 0.5% ] 0.43% | 733,027 | 8.3% |
[ 0.0% - 0.5% ] 0.49% | 414,769 | 8.4% |
[ 0.5% - 1.0% ] 0.54% | 366,614 | 7.0% |
[ 0.5% - 1.0% ] 0.61% | 223,333 | 7.9% |
[ 0.5% - 1.0% ] 0.65% | 151,629 | 9.3% |
[ 0.5% - 1.0% ] 0.71% | 161,276 | 6.1% |
[ 0.5% - 1.0% ] 0.76% | 100,899 | 3.6% |
[ 0.5% - 1.0% ] 0.83% | 254,310 | 7.4% |
[ 0.5% - 1.0% ] 0.89% | 448,550 | 8.1% |
[ 0.5% - 1.0% ] 0.94% | 357,524 | 4.6% |
[ 1.0% - 1.5% ] 1.01% | 121,482 | 7.2% |
[ 1.0% - 1.5% ] 1.09% | 67,503 | 3.5% |
[ 1.0% - 1.5% ] 1.14% | 55,734 | 5.6% |
[ 1.0% - 1.5% ] 1.20% | 25,085 | 6.4% |
[ 1.0% - 1.5% ] 1.23% | 114,738 | 8.2% |
[ 1.0% - 1.5% ] 1.31% | 65,237 | 6.3% |
[ 1.0% - 1.5% ] 1.35% | 148,615 | 6.8% |
[ 1.0% - 1.5% ] 1.43% | 43,921 | 2.6% |
[ 1.0% - 1.5% ] 1.45% | 79,187 | 7.3% |
[ 1.5% - 2.0% ] 1.52% | 106,355 | 8.6% |
[ 1.5% - 2.0% ] 1.61% | 747 | 14.9% |
[ 1.5% - 2.0% ] 1.64% | 53,590 | 4.0% |
[ 1.5% - 2.0% ] 1.68% | 105,302 | 8.0% |
[ 1.5% - 2.0% ] 1.75% | 28,253 | 11.8% |
[ 1.5% - 2.0% ] 1.82% | 16,823 | 18.1% |
[ 1.5% - 2.0% ] 1.87% | 197,840 | 6.3% |
[ 1.5% - 2.0% ] 1.94% | 37,785 | 5.2% |
[ 2.0% - 2.5% ] 2.07% | 5,704 | 17.8% |
[ 2.0% - 2.5% ] 2.10% | 27,827 | 11.0% |
[ 2.0% - 2.5% ] 2.18% | 83,562 | 5.8% |
[ 2.0% - 2.5% ] 2.21% | 9,329 | 5.9% |
[ 2.0% - 2.5% ] 2.28% | 33,033 | 7.9% |
[ 2.0% - 2.5% ] 2.46% | 57,042 | 3.1% |
[ 2.0% - 2.5% ] 2.49% | 1,729 | 5.2% |
[ 2.5% - 3.0% ] 2.55% | 61,494 | 6.8% |
[ 2.5% - 3.0% ] 2.64% | 4,400 | 13.1% |
[ 2.5% - 3.0% ] 2.68% | 78,068 | 7.1% |
[ 2.5% - 3.0% ] 2.76% | 38,003 | 12.6% |
[ 2.5% - 3.0% ] 2.85% | 3,864 | 1.6% |
[ 2.5% - 3.0% ] 3.00% | 1,567 | 13.8% |
[ 3.0% - 3.5% ] 3.16% | 19,083 | 2.2% |
[ 3.0% - 3.5% ] 3.17% | 14,403 | 15.3% |
[ 3.0% - 3.5% ] 3.32% | 59,225 | 11.3% |
[ 3.0% - 3.5% ] 3.43% | 19,135 | 4.5% |
[ 3.5% - 4.0% ] 3.55% | 23,765 | 10.0% |
[ 3.5% - 4.0% ] 3.79% | 2,771 | 3.2% |
[ 3.5% - 4.0% ] 3.87% | 45,266 | 7.2% |
[ 4.0% - 4.5% ] 4.02% | 448 | 10.9% |
[ 4.0% - 4.5% ] 4.29% | 128,151 | 7.8% |
[ 4.0% - 4.5% ] 4.33% | 3,698 | 3.7% |
[ 4.0% - 4.5% ] 4.40% | 96,358 | 7.5% |
[ 4.0% - 4.5% ] 4.49% | 1,536 | 3.4% |
[ 4.5% - 5.0% ] 4.69% | 59,775 | 8.0% |
[ 4.5% - 5.0% ] 4.96% | 26,536 | 4.7% |
[ 5.0% - 5.5% ] 5.16% | 4,402 | 11.2% |
[ 5.0% - 5.5% ] 5.23% | 45,937 | 11.9% |
[ 5.0% - 5.5% ] 5.25% | 27,848 | 6.9% |
[ 5.0% - 5.5% ] 5.48% | 67,076 | 4.0% |
[ 5.5% - 6.0% ] 5.56% | 34,004 | 6.1% |
[ 5.5% - 6.0% ] 5.66% | 29,330 | 3.4% |
[ 5.5% - 6.0% ] 5.91% | 22,152 | 6.9% |
[ 5.5% - 6.0% ] 5.94% | 33,170 | 4.6% |
[ 6.0% - 6.5% ] 6.32% | 2,342 | 23.1% |
[ 6.5% - 7.0% ] 6.60% | 16,742 | 8.1% |
[ 7.0% - 7.5% ] 7.02% | 38,727 | 7.2% |
[ 9.0% - 9.5% ] 9.27% | 34,921 | 6.4% |
[ 9.5% - 10.0% ] 9.58% | 33,174 | 7.7% |
[ 10.5% - 11.0% ] 10.51% | 21,587 | 8.6% |
[ 11.0% - 11.5% ] 11.00% | 6,018 | 28.3% |
[ 11.0% - 11.5% ] 11.50% | 133,744 | 7.3% |
[ 18.0% - 18.5% ] 18.47% | 43,232 | 8.4% |