Lyons Switch, OK Map & Demographics
Lyons Switch Map
Lyons Switch Overview
$22,240
PER CAPITA INCOME
$68,750
AVG FAMILY INCOME
$64,167
AVG HOUSEHOLD INCOME
13.7%
WAGE / INCOME GAP [ % ]
86.3¢/ $1
WAGE / INCOME GAP [ $ ]
0.32
INEQUALITY / GINI INDEX
570
TOTAL POPULATION
256
MALE POPULATION
314
FEMALE POPULATION
81.53
MALES / 100 FEMALES
122.66
FEMALES / 100 MALES
39.5
MEDIAN AGE
3.7
AVG FAMILY SIZE
3.4
AVG HOUSEHOLD SIZE
273
LABOR FORCE [ PEOPLE ]
58.5%
PERCENT IN LABOR FORCE
11.0%
UNEMPLOYMENT RATE
Income in Lyons Switch
Income Overview in Lyons Switch
Per Capita Income in Lyons Switch is $22,240, while median incomes of families and households are $68,750 and $64,167 respectively.
| Characteristic | Number | Measure |
| Per Capita Income | 570 | $22,240 |
| Median Family Income | 137 | $68,750 |
| Mean Family Income | 137 | $69,253 |
| Median Household Income | 170 | $64,167 |
| Mean Household Income | 170 | $67,912 |
| Income Deficit | 137 | $0 |
| Wage / Income Gap (%) | 570 | 13.73% |
| Wage / Income Gap ($) | 570 | 86.27¢ per $1 |
| Gini / Inequality Index | 570 | 0.32 |
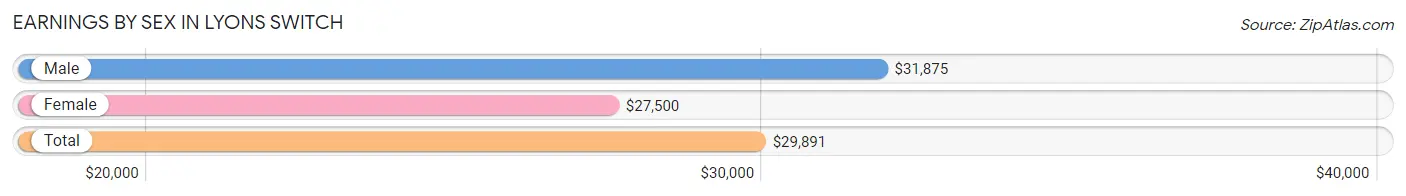
Earnings by Sex in Lyons Switch
Average Earnings in Lyons Switch are $29,891, $31,875 for men and $27,500 for women, a difference of 13.7%.
| Sex | Number | Average Earnings |
| Male | 126 (45.3%) | $31,875 |
| Female | 152 (54.7%) | $27,500 |
| Total | 278 (100.0%) | $29,891 |
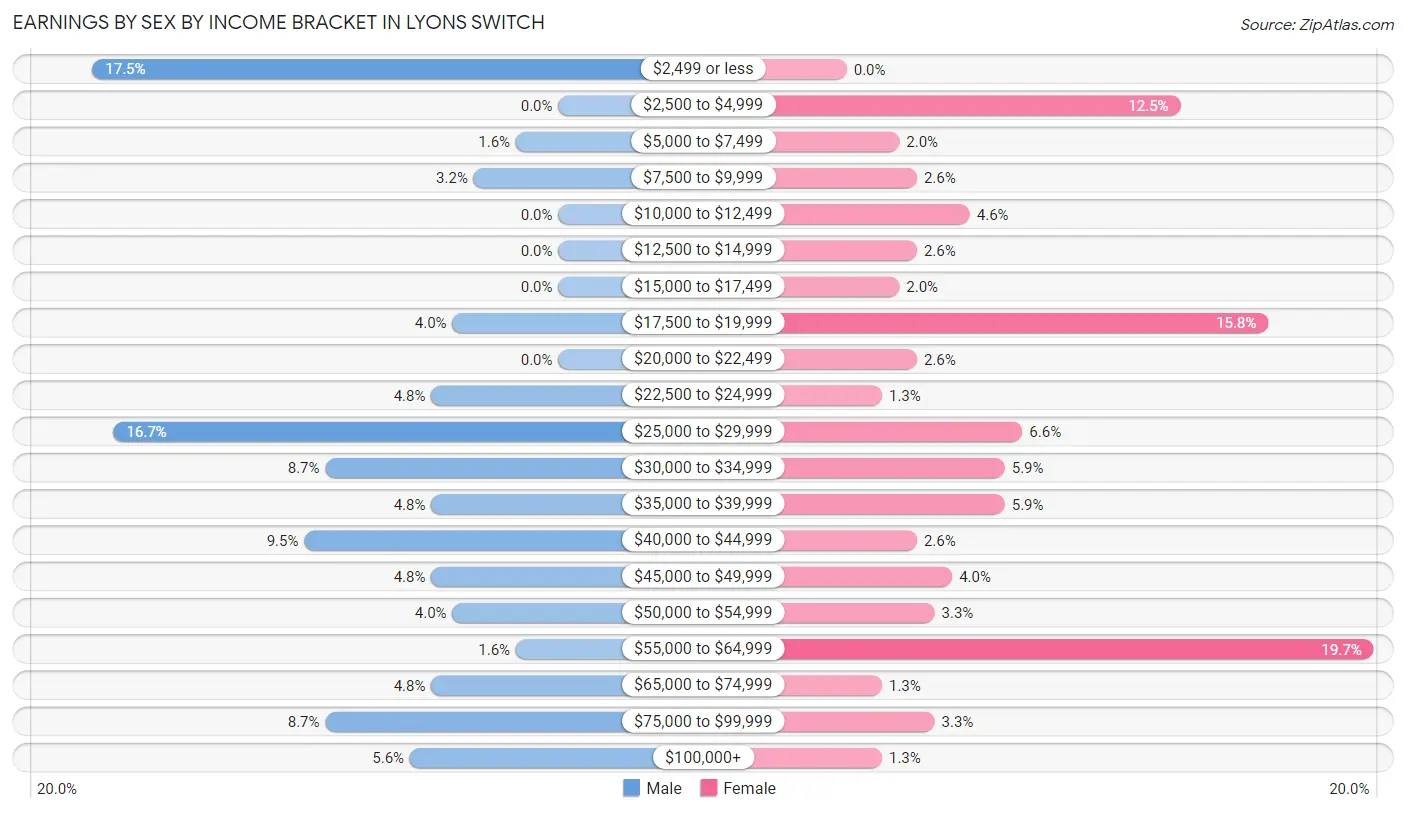
Earnings by Sex by Income Bracket in Lyons Switch
The most common earnings brackets in Lyons Switch are $2,499 or less for men (22 | 17.5%) and $55,000 to $64,999 for women (30 | 19.7%).
| Income | Male | Female |
| $2,499 or less | 22 (17.5%) | 0 (0.0%) |
| $2,500 to $4,999 | 0 (0.0%) | 19 (12.5%) |
| $5,000 to $7,499 | 2 (1.6%) | 3 (2.0%) |
| $7,500 to $9,999 | 4 (3.2%) | 4 (2.6%) |
| $10,000 to $12,499 | 0 (0.0%) | 7 (4.6%) |
| $12,500 to $14,999 | 0 (0.0%) | 4 (2.6%) |
| $15,000 to $17,499 | 0 (0.0%) | 3 (2.0%) |
| $17,500 to $19,999 | 5 (4.0%) | 24 (15.8%) |
| $20,000 to $22,499 | 0 (0.0%) | 4 (2.6%) |
| $22,500 to $24,999 | 6 (4.8%) | 2 (1.3%) |
| $25,000 to $29,999 | 21 (16.7%) | 10 (6.6%) |
| $30,000 to $34,999 | 11 (8.7%) | 9 (5.9%) |
| $35,000 to $39,999 | 6 (4.8%) | 9 (5.9%) |
| $40,000 to $44,999 | 12 (9.5%) | 4 (2.6%) |
| $45,000 to $49,999 | 6 (4.8%) | 6 (4.0%) |
| $50,000 to $54,999 | 5 (4.0%) | 5 (3.3%) |
| $55,000 to $64,999 | 2 (1.6%) | 30 (19.7%) |
| $65,000 to $74,999 | 6 (4.8%) | 2 (1.3%) |
| $75,000 to $99,999 | 11 (8.7%) | 5 (3.3%) |
| $100,000+ | 7 (5.6%) | 2 (1.3%) |
| Total | 126 (100.0%) | 152 (100.0%) |
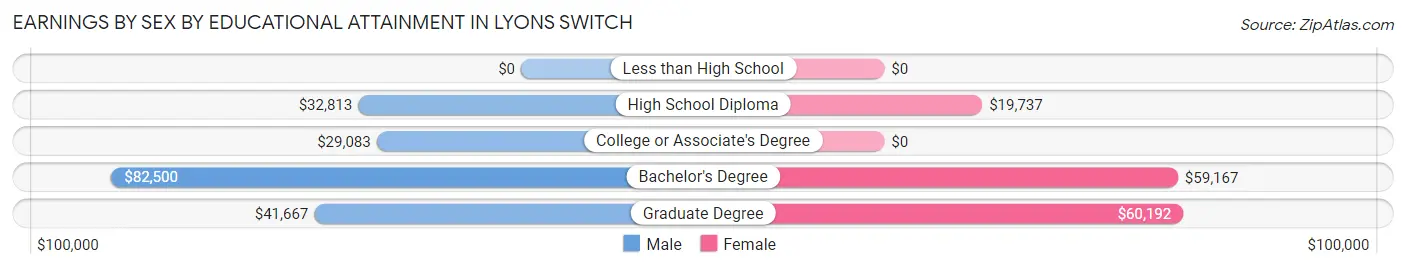
Earnings by Sex by Educational Attainment in Lyons Switch
Average earnings in Lyons Switch are $32,188 for men and $30,500 for women, a difference of 5.2%. Men with an educational attainment of bachelor's degree enjoy the highest average annual earnings of $82,500, while those with college or associate's degree education earn the least with $29,083. Women with an educational attainment of graduate degree earn the most with the average annual earnings of $60,192, while those with high school diploma education have the smallest earnings of $19,737.
| Educational Attainment | Male Income | Female Income |
| Less than High School | - | - |
| High School Diploma | $32,813 | $19,737 |
| College or Associate's Degree | $29,083 | $0 |
| Bachelor's Degree | $82,500 | $59,167 |
| Graduate Degree | $41,667 | $60,192 |
| Total | $32,188 | $30,500 |
Family Income in Lyons Switch
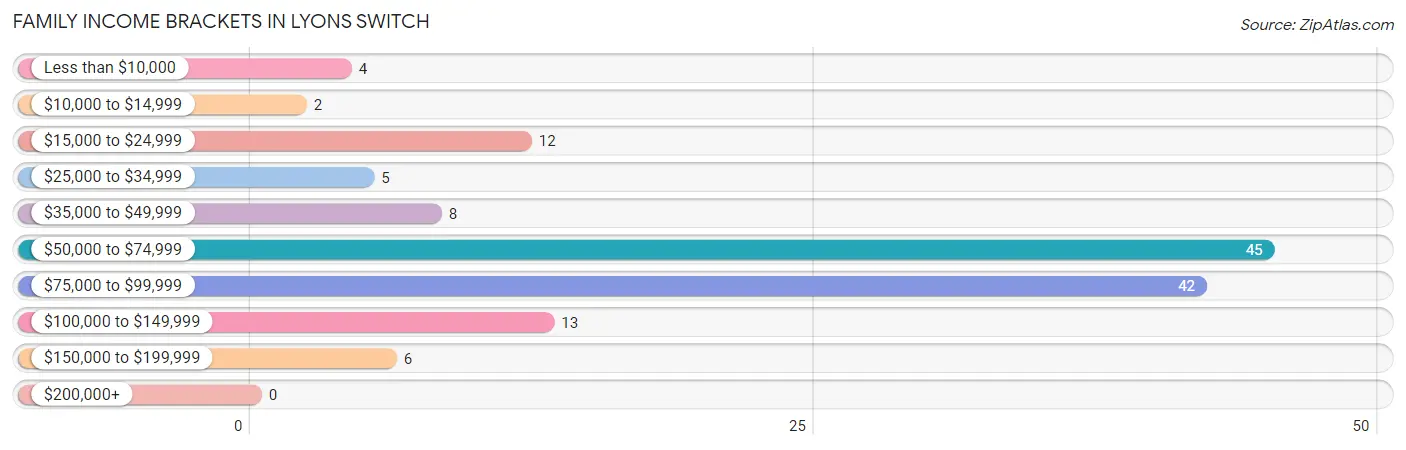
Family Income Brackets in Lyons Switch
According to the Lyons Switch family income data, there are 45 families falling into the $50,000 to $74,999 income range, which is the most common income bracket and makes up 32.9% of all families.
| Income Bracket | # Families | % Families |
| Less than $10,000 | 4 | 2.9% |
| $10,000 to $14,999 | 2 | 1.5% |
| $15,000 to $24,999 | 12 | 8.8% |
| $25,000 to $34,999 | 5 | 3.6% |
| $35,000 to $49,999 | 8 | 5.8% |
| $50,000 to $74,999 | 45 | 32.8% |
| $75,000 to $99,999 | 42 | 30.7% |
| $100,000 to $149,999 | 13 | 9.5% |
| $150,000 to $199,999 | 6 | 4.4% |
| $200,000+ | 0 | 0.0% |
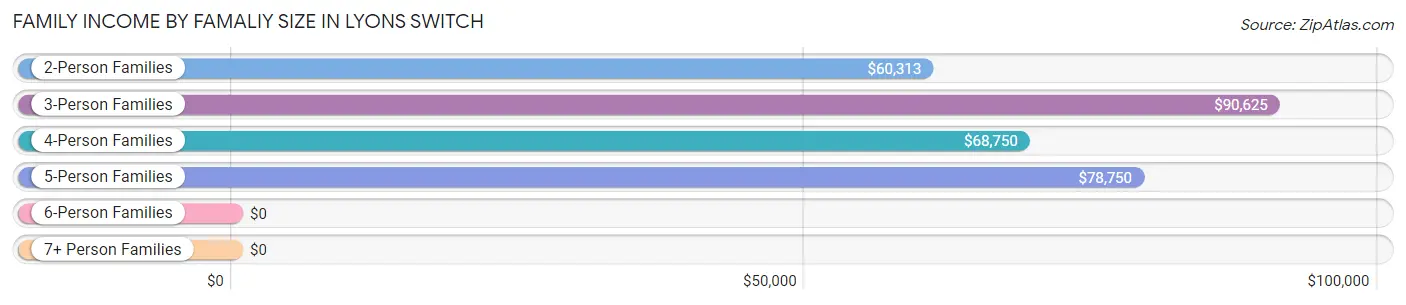
Family Income by Famaliy Size in Lyons Switch
3-person families (24 | 17.5%) account for the highest median family income in Lyons Switch with $90,625 per family, while 3-person families (24 | 17.5%) have the highest median income of $30,208 per family member.
| Income Bracket | # Families | Median Income |
| 2-Person Families | 69 (50.4%) | $60,313 |
| 3-Person Families | 24 (17.5%) | $90,625 |
| 4-Person Families | 34 (24.8%) | $68,750 |
| 5-Person Families | 7 (5.1%) | $78,750 |
| 6-Person Families | 2 (1.5%) | $0 |
| 7+ Person Families | 1 (0.7%) | $0 |
| Total | 137 (100.0%) | $68,750 |
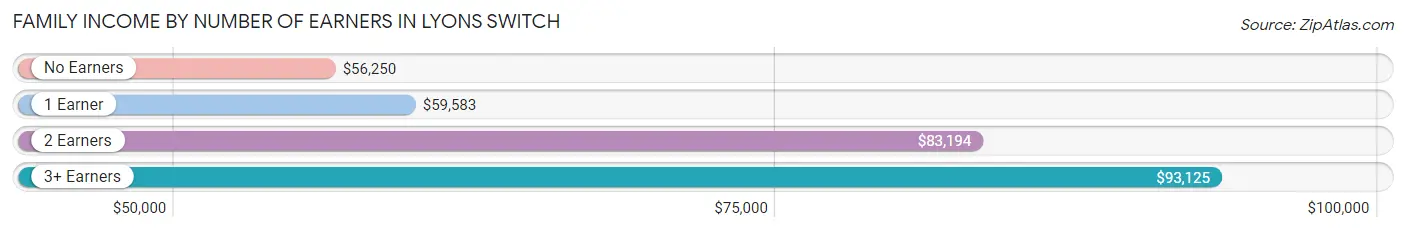
Family Income by Number of Earners in Lyons Switch
The median family income in Lyons Switch is $68,750, with families comprising 3+ earners (9) having the highest median family income of $93,125, while families with no earners (22) have the lowest median family income of $56,250, accounting for 6.6% and 16.1% of families, respectively.
| Number of Earners | # Families | Median Income |
| No Earners | 22 (16.1%) | $56,250 |
| 1 Earner | 53 (38.7%) | $59,583 |
| 2 Earners | 53 (38.7%) | $83,194 |
| 3+ Earners | 9 (6.6%) | $93,125 |
| Total | 137 (100.0%) | $68,750 |
Household Income in Lyons Switch
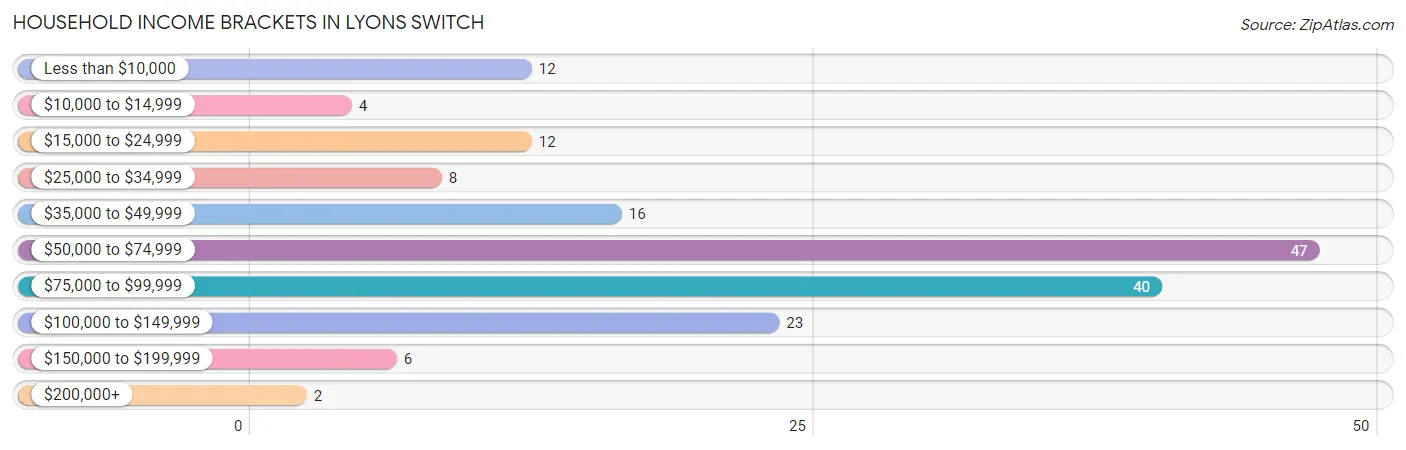
Household Income Brackets in Lyons Switch
With 47 households falling in the category, the $50,000 to $74,999 income range is the most frequent in Lyons Switch, accounting for 27.7% of all households. In contrast, only 2 households (1.2%) fall into the $200,000+ income bracket, making it the least populous group.
| Income Bracket | # Households | % Households |
| Less than $10,000 | 12 | 7.1% |
| $10,000 to $14,999 | 4 | 2.4% |
| $15,000 to $24,999 | 12 | 7.1% |
| $25,000 to $34,999 | 8 | 4.7% |
| $35,000 to $49,999 | 16 | 9.4% |
| $50,000 to $74,999 | 47 | 27.6% |
| $75,000 to $99,999 | 40 | 23.5% |
| $100,000 to $149,999 | 23 | 13.5% |
| $150,000 to $199,999 | 6 | 3.5% |
| $200,000+ | 2 | 1.2% |
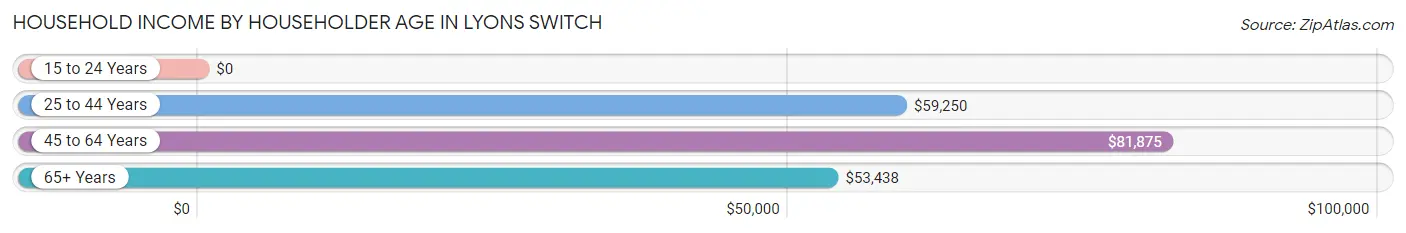
Household Income by Householder Age in Lyons Switch
The median household income in Lyons Switch is $64,167, with the highest median household income of $81,875 found in the 45 to 64 years age bracket for the primary householder. A total of 66 households (38.8%) fall into this category. Meanwhile, the 15 to 24 years age bracket for the primary householder has the lowest median household income of $0, with 2 households (1.2%) in this group.
| Income Bracket | # Households | Median Income |
| 15 to 24 Years | 2 (1.2%) | $0 |
| 25 to 44 Years | 45 (26.5%) | $59,250 |
| 45 to 64 Years | 66 (38.8%) | $81,875 |
| 65+ Years | 57 (33.5%) | $53,438 |
| Total | 170 (100.0%) | $64,167 |
Poverty in Lyons Switch
Income Below Poverty by Sex and Age in Lyons Switch
With 17.2% poverty level for males and 12.4% for females among the residents of Lyons Switch, 16 and 17 year old males and 75 year old and over females are the most vulnerable to poverty, with 3 males (60.0%) and 3 females (75.0%) in their respective age groups living below the poverty level.
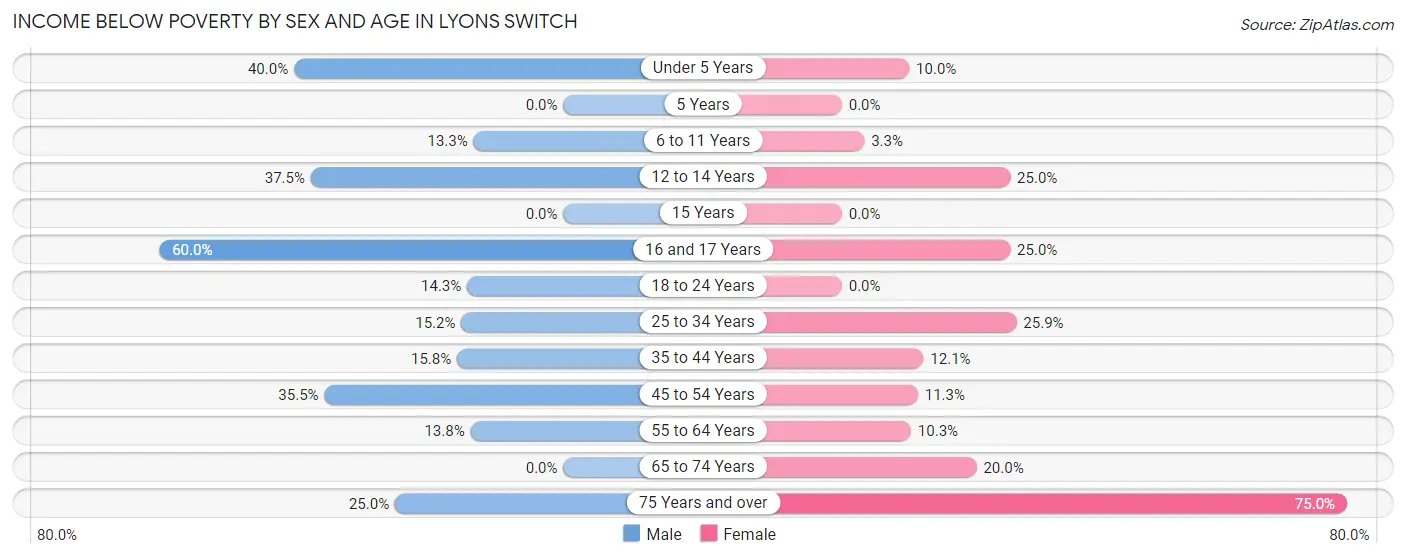
| Age Bracket | Male | Female |
| Under 5 Years | 2 (40.0%) | 2 (10.0%) |
| 5 Years | 0 (0.0%) | 0 (0.0%) |
| 6 to 11 Years | 2 (13.3%) | 1 (3.3%) |
| 12 to 14 Years | 3 (37.5%) | 2 (25.0%) |
| 15 Years | 0 (0.0%) | 0 (0.0%) |
| 16 and 17 Years | 3 (60.0%) | 2 (25.0%) |
| 18 to 24 Years | 2 (14.3%) | 0 (0.0%) |
| 25 to 34 Years | 10 (15.1%) | 7 (25.9%) |
| 35 to 44 Years | 3 (15.8%) | 4 (12.1%) |
| 45 to 54 Years | 11 (35.5%) | 7 (11.3%) |
| 55 to 64 Years | 4 (13.8%) | 4 (10.3%) |
| 65 to 74 Years | 0 (0.0%) | 7 (20.0%) |
| 75 Years and over | 4 (25.0%) | 3 (75.0%) |
| Total | 44 (17.2%) | 39 (12.4%) |
Income Above Poverty by Sex and Age in Lyons Switch
According to the poverty statistics in Lyons Switch, males aged 5 years and females aged 5 years are the age groups that are most secure financially, with 100.0% of males and 100.0% of females in these age groups living above the poverty line.
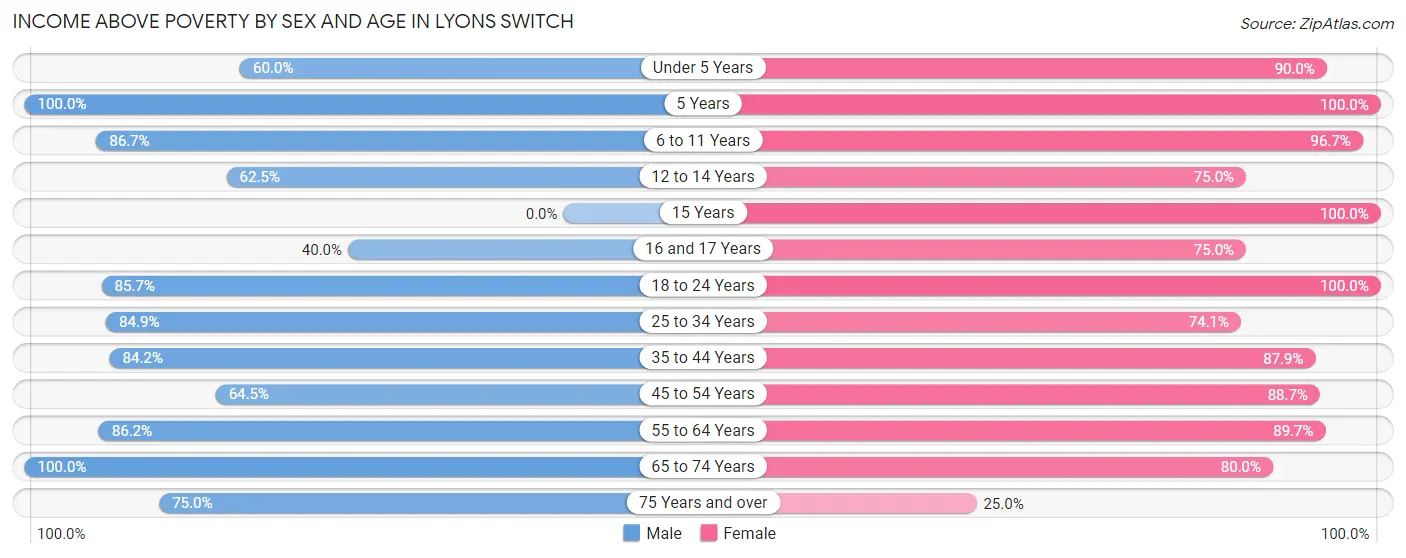
| Age Bracket | Male | Female |
| Under 5 Years | 3 (60.0%) | 18 (90.0%) |
| 5 Years | 13 (100.0%) | 1 (100.0%) |
| 6 to 11 Years | 13 (86.7%) | 29 (96.7%) |
| 12 to 14 Years | 5 (62.5%) | 6 (75.0%) |
| 15 Years | 0 (0.0%) | 3 (100.0%) |
| 16 and 17 Years | 2 (40.0%) | 6 (75.0%) |
| 18 to 24 Years | 12 (85.7%) | 44 (100.0%) |
| 25 to 34 Years | 56 (84.9%) | 20 (74.1%) |
| 35 to 44 Years | 16 (84.2%) | 29 (87.9%) |
| 45 to 54 Years | 20 (64.5%) | 55 (88.7%) |
| 55 to 64 Years | 25 (86.2%) | 35 (89.7%) |
| 65 to 74 Years | 35 (100.0%) | 28 (80.0%) |
| 75 Years and over | 12 (75.0%) | 1 (25.0%) |
| Total | 212 (82.8%) | 275 (87.6%) |
Income Below Poverty Among Married-Couple Families in Lyons Switch
The poverty statistics for married-couple families in Lyons Switch show that 8.9% or 10 of the total 112 families live below the poverty line. Families with 1 or 2 children have the highest poverty rate of 15.1%, comprising of 5 families. On the other hand, families with 3 or 4 children have the lowest poverty rate of 0.0%, which includes 0 families.
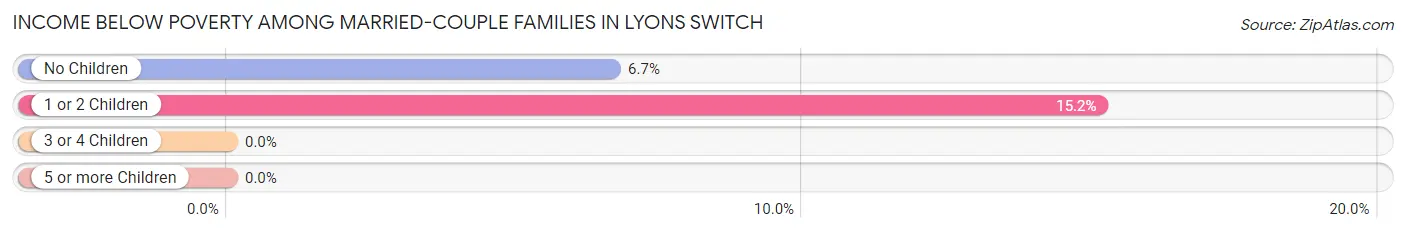
| Children | Above Poverty | Below Poverty |
| No Children | 70 (93.3%) | 5 (6.7%) |
| 1 or 2 Children | 28 (84.9%) | 5 (15.1%) |
| 3 or 4 Children | 4 (100.0%) | 0 (0.0%) |
| 5 or more Children | 0 (0.0%) | 0 (0.0%) |
| Total | 102 (91.1%) | 10 (8.9%) |
Income Below Poverty Among Single-Parent Households in Lyons Switch
According to the poverty data in Lyons Switch, 8.3% or 1 single-father households and 23.1% or 3 single-mother households are living below the poverty line. Among single-father households, those with no children have the highest poverty rate, with 1 households (25.0%) experiencing poverty. Likewise, among single-mother households, those with 1 or 2 children have the highest poverty rate, with 1 households (100.0%) falling below the poverty line.
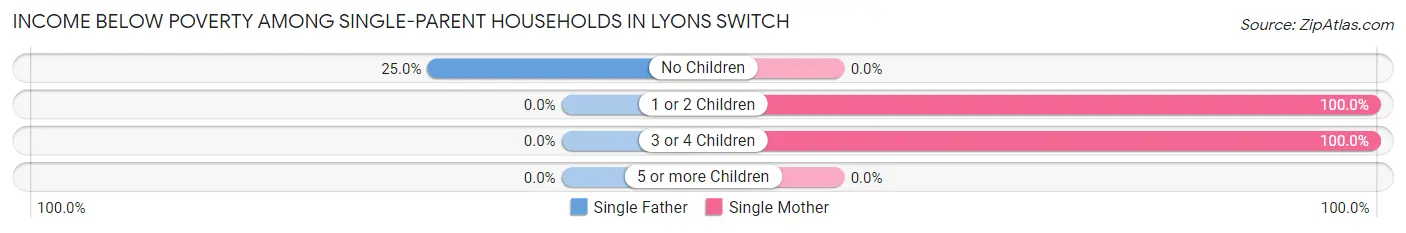
| Children | Single Father | Single Mother |
| No Children | 1 (25.0%) | 0 (0.0%) |
| 1 or 2 Children | 0 (0.0%) | 1 (100.0%) |
| 3 or 4 Children | 0 (0.0%) | 2 (100.0%) |
| 5 or more Children | 0 (0.0%) | 0 (0.0%) |
| Total | 1 (8.3%) | 3 (23.1%) |
Income Below Poverty Among Married-Couple vs Single-Parent Households in Lyons Switch
The poverty data for Lyons Switch shows that 10 of the married-couple family households (8.9%) and 4 of the single-parent households (16.0%) are living below the poverty level. Within the married-couple family households, those with 1 or 2 children have the highest poverty rate, with 5 households (15.1%) falling below the poverty line. Among the single-parent households, those with 3 or 4 children have the highest poverty rate, with 2 household (40.0%) living below poverty.
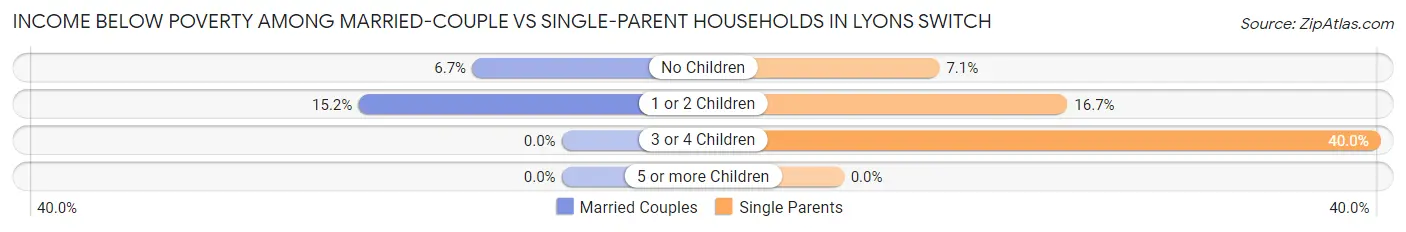
| Children | Married-Couple Families | Single-Parent Households |
| No Children | 5 (6.7%) | 1 (7.1%) |
| 1 or 2 Children | 5 (15.1%) | 1 (16.7%) |
| 3 or 4 Children | 0 (0.0%) | 2 (40.0%) |
| 5 or more Children | 0 (0.0%) | 0 (0.0%) |
| Total | 10 (8.9%) | 4 (16.0%) |
Race in Lyons Switch
The most populous races in Lyons Switch are Native / Alaskan (312 | 54.7%), White / Caucasian (149 | 26.1%), and Two or more Races (102 | 17.9%).
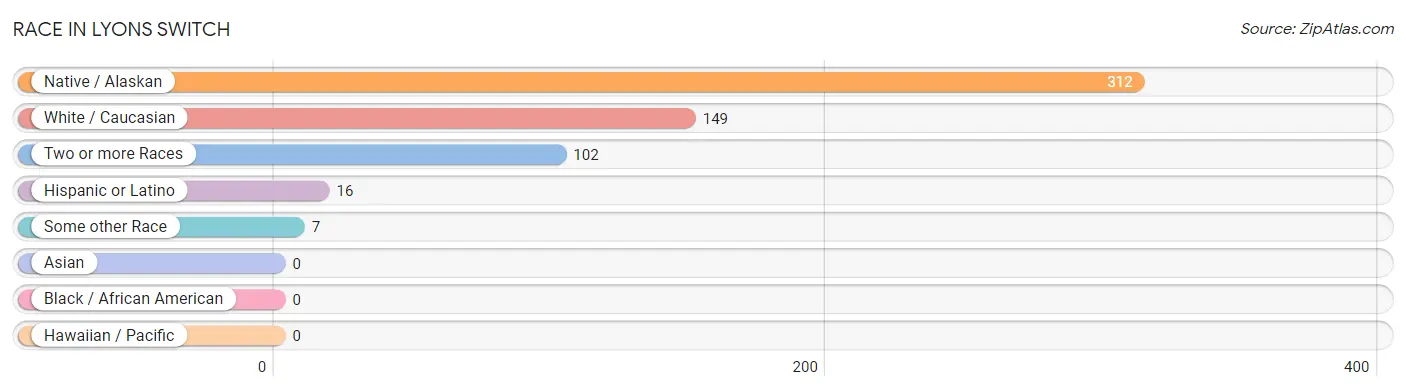
| Race | # Population | % Population |
| Asian | 0 | 0.0% |
| Black / African American | 0 | 0.0% |
| Hawaiian / Pacific | 0 | 0.0% |
| Hispanic or Latino | 16 | 2.8% |
| Native / Alaskan | 312 | 54.7% |
| White / Caucasian | 149 | 26.1% |
| Two or more Races | 102 | 17.9% |
| Some other Race | 7 | 1.2% |
| Total | 570 | 100.0% |
Ancestry in Lyons Switch
The most populous ancestries reported in Lyons Switch are Cherokee (388 | 68.1%), Irish (56 | 9.8%), English (18 | 3.2%), Mexican (14 | 2.5%), and American (9 | 1.6%), together accounting for 85.1% of all Lyons Switch residents.
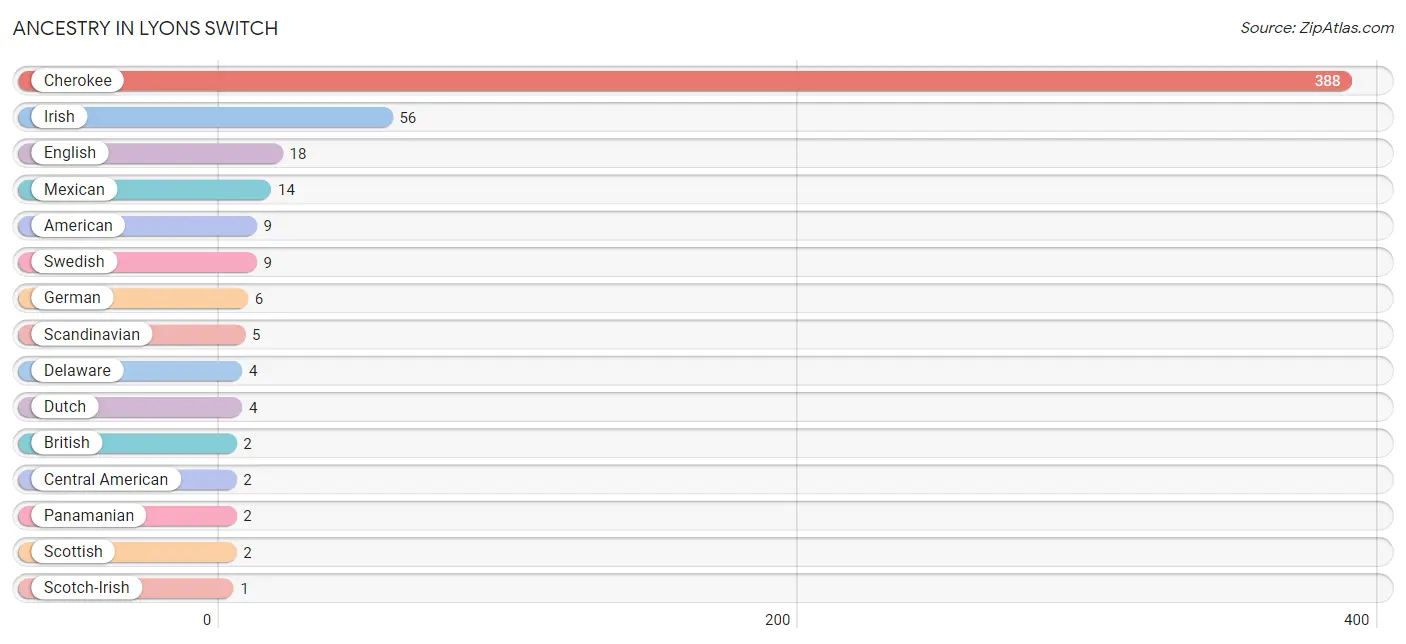
| Ancestry | # Population | % Population |
| American | 9 | 1.6% |
| British | 2 | 0.4% |
| Central American | 2 | 0.4% |
| Cherokee | 388 | 68.1% |
| Delaware | 4 | 0.7% |
| Dutch | 4 | 0.7% |
| English | 18 | 3.2% |
| German | 6 | 1.1% |
| Irish | 56 | 9.8% |
| Mexican | 14 | 2.5% |
| Panamanian | 2 | 0.4% |
| Scandinavian | 5 | 0.9% |
| Scotch-Irish | 1 | 0.2% |
| Scottish | 2 | 0.4% |
| Swedish | 9 | 1.6% | View All 15 Rows |
Immigrants in Lyons Switch

| Immigration Origin | # Population | % Population | View All 0 Rows |
Sex and Age in Lyons Switch
Sex and Age in Lyons Switch
The most populous age groups in Lyons Switch are 25 to 29 Years (37 | 14.4%) for men and 45 to 49 Years (35 | 11.2%) for women.
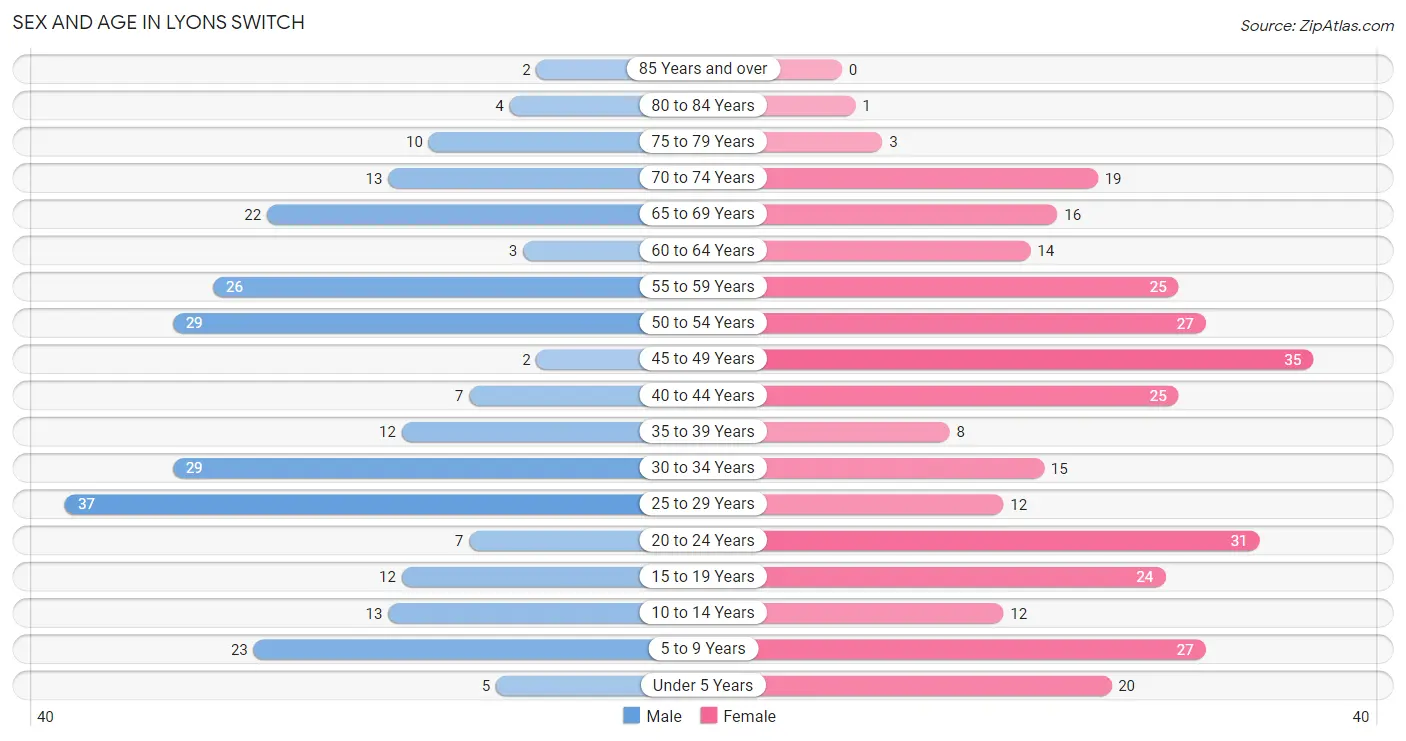
| Age Bracket | Male | Female |
| Under 5 Years | 5 (1.9%) | 20 (6.4%) |
| 5 to 9 Years | 23 (9.0%) | 27 (8.6%) |
| 10 to 14 Years | 13 (5.1%) | 12 (3.8%) |
| 15 to 19 Years | 12 (4.7%) | 24 (7.6%) |
| 20 to 24 Years | 7 (2.7%) | 31 (9.9%) |
| 25 to 29 Years | 37 (14.4%) | 12 (3.8%) |
| 30 to 34 Years | 29 (11.3%) | 15 (4.8%) |
| 35 to 39 Years | 12 (4.7%) | 8 (2.5%) |
| 40 to 44 Years | 7 (2.7%) | 25 (8.0%) |
| 45 to 49 Years | 2 (0.8%) | 35 (11.2%) |
| 50 to 54 Years | 29 (11.3%) | 27 (8.6%) |
| 55 to 59 Years | 26 (10.2%) | 25 (8.0%) |
| 60 to 64 Years | 3 (1.2%) | 14 (4.5%) |
| 65 to 69 Years | 22 (8.6%) | 16 (5.1%) |
| 70 to 74 Years | 13 (5.1%) | 19 (6.0%) |
| 75 to 79 Years | 10 (3.9%) | 3 (1.0%) |
| 80 to 84 Years | 4 (1.6%) | 1 (0.3%) |
| 85 Years and over | 2 (0.8%) | 0 (0.0%) |
| Total | 256 (100.0%) | 314 (100.0%) |
Families and Households in Lyons Switch
Median Family Size in Lyons Switch
The median family size in Lyons Switch is 3.73 persons per family, with single female/mother families (13 | 9.5%) accounting for the largest median family size of 3.85 persons per family. On the other hand, single male/father families (12 | 8.8%) represent the smallest median family size with 3.00 persons per family.
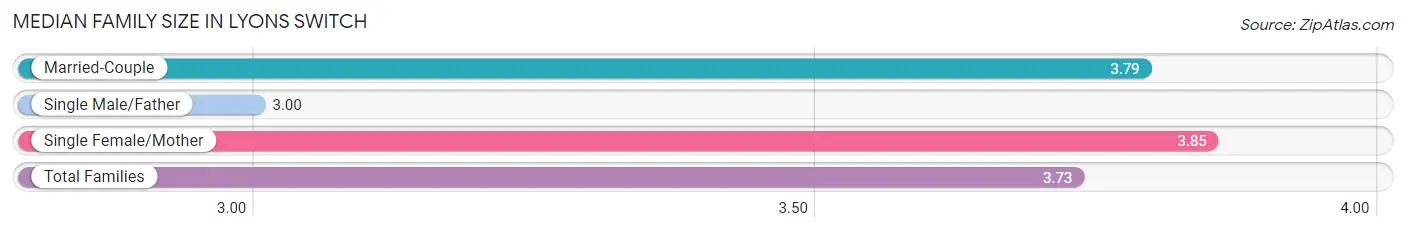
| Family Type | # Families | Family Size |
| Married-Couple | 112 (81.8%) | 3.79 |
| Single Male/Father | 12 (8.8%) | 3.00 |
| Single Female/Mother | 13 (9.5%) | 3.85 |
| Total Families | 137 (100.0%) | 3.73 |
Median Household Size in Lyons Switch
The median household size in Lyons Switch is 3.35 persons per household, with single female/mother households (13 | 7.6%) accounting for the largest median household size of 4.08 persons per household. non-family households (33 | 19.4%) represent the smallest median household size with 1.39 persons per household.
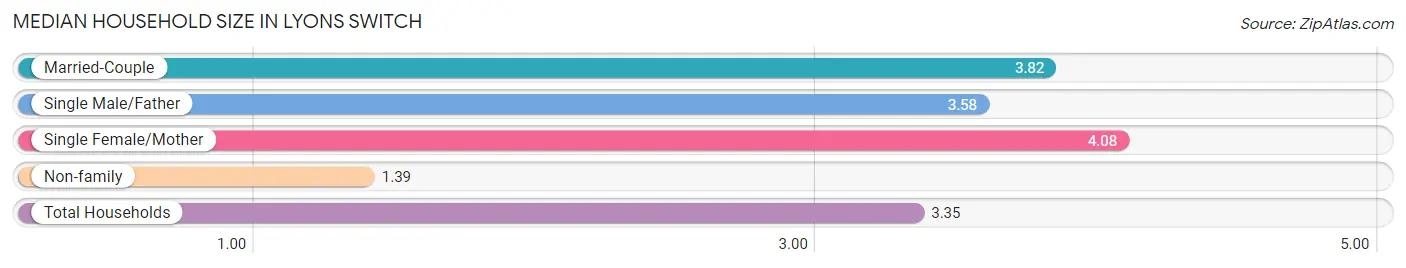
| Household Type | # Households | Household Size |
| Married-Couple | 112 (65.9%) | 3.82 |
| Single Male/Father | 12 (7.1%) | 3.58 |
| Single Female/Mother | 13 (7.6%) | 4.08 |
| Non-family | 33 (19.4%) | 1.39 |
| Total Households | 170 (100.0%) | 3.35 |
Household Size by Marriage Status in Lyons Switch
Out of a total of 170 households in Lyons Switch, 137 (80.6%) are family households, while 33 (19.4%) are nonfamily households. The most numerous type of family households are 2-person households, comprising 65, and the most common type of nonfamily households are 1-person households, comprising 27.
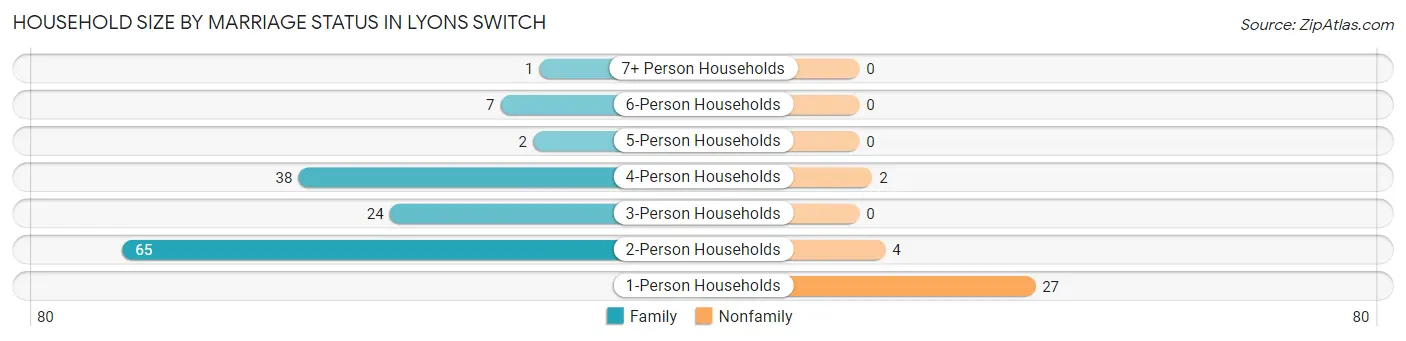
| Household Size | Family Households | Nonfamily Households |
| 1-Person Households | - | 27 (15.9%) |
| 2-Person Households | 65 (38.2%) | 4 (2.4%) |
| 3-Person Households | 24 (14.1%) | 0 (0.0%) |
| 4-Person Households | 38 (22.4%) | 2 (1.2%) |
| 5-Person Households | 2 (1.2%) | 0 (0.0%) |
| 6-Person Households | 7 (4.1%) | 0 (0.0%) |
| 7+ Person Households | 1 (0.6%) | 0 (0.0%) |
| Total | 137 (80.6%) | 33 (19.4%) |
Female Fertility in Lyons Switch
Fertility by Age in Lyons Switch
Average fertility rate in Lyons Switch is 25.0 births per 1,000 women. Women in the age bracket of 20 to 34 years have the highest fertility rate with 69.0 births per 1,000 women. Women in the age bracket of 20 to 34 years acount for 100.0% of all women with births.
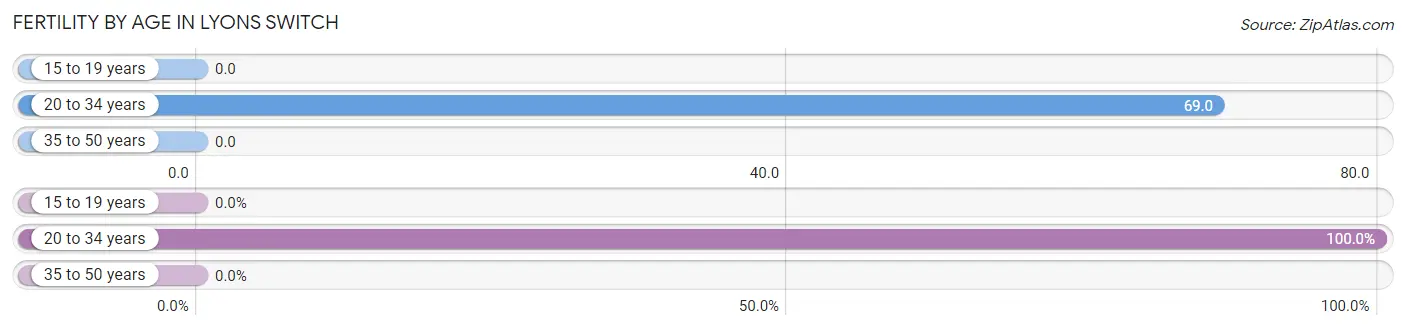
| Age Bracket | Women with Births | Births / 1,000 Women |
| 15 to 19 years | 0 (0.0%) | 0.0 |
| 20 to 34 years | 4 (100.0%) | 69.0 |
| 35 to 50 years | 0 (0.0%) | 0.0 |
| Total | 4 (100.0%) | 25.0 |
Fertility by Age by Marriage Status in Lyons Switch
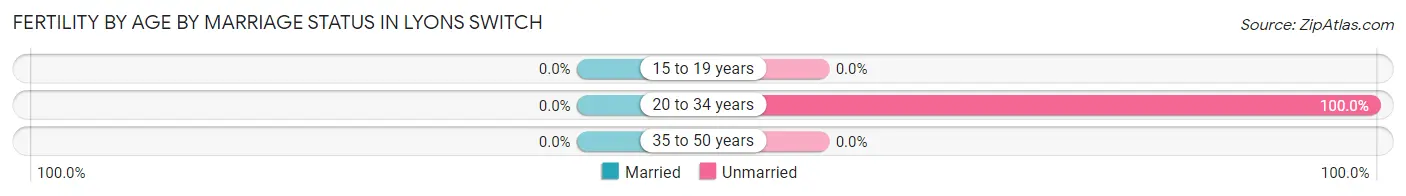
| Age Bracket | Married | Unmarried |
| 15 to 19 years | 0 (0.0%) | 0 (0.0%) |
| 20 to 34 years | 0 (0.0%) | 4 (100.0%) |
| 35 to 50 years | 0 (0.0%) | 0 (0.0%) |
| Total | 0 (0.0%) | 4 (100.0%) |
Fertility by Education in Lyons Switch
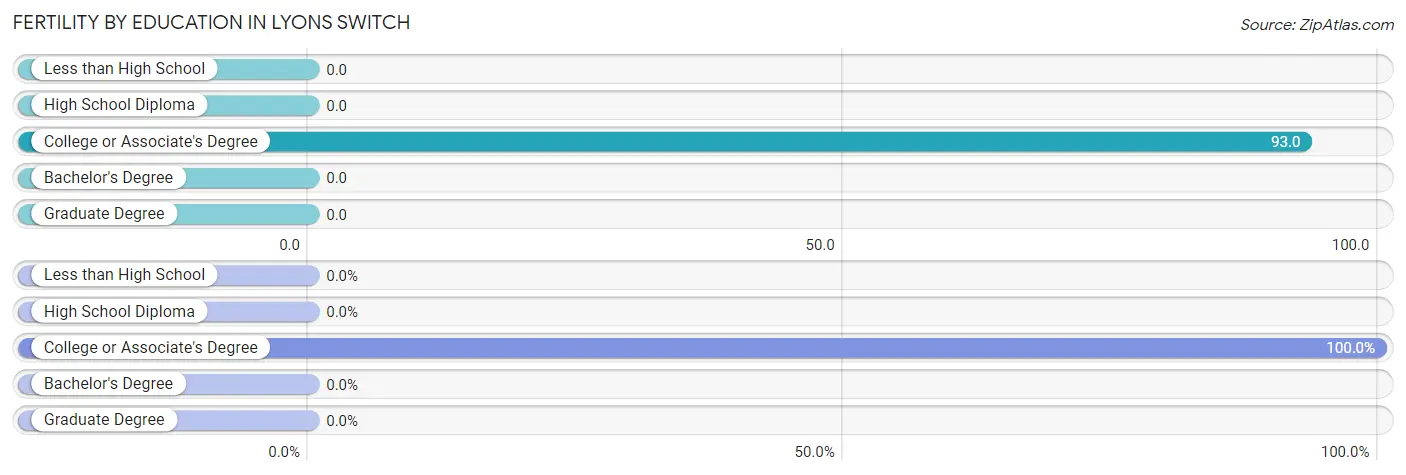
| Educational Attainment | Women with Births | Births / 1,000 Women |
| Less than High School | 0 (0.0%) | 0.0 |
| High School Diploma | 0 (0.0%) | 0.0 |
| College or Associate's Degree | 4 (100.0%) | 93.0 |
| Bachelor's Degree | 0 (0.0%) | 0.0 |
| Graduate Degree | 0 (0.0%) | 0.0 |
| Total | 4 (100.0%) | 25.0 |
Fertility by Education by Marriage Status in Lyons Switch
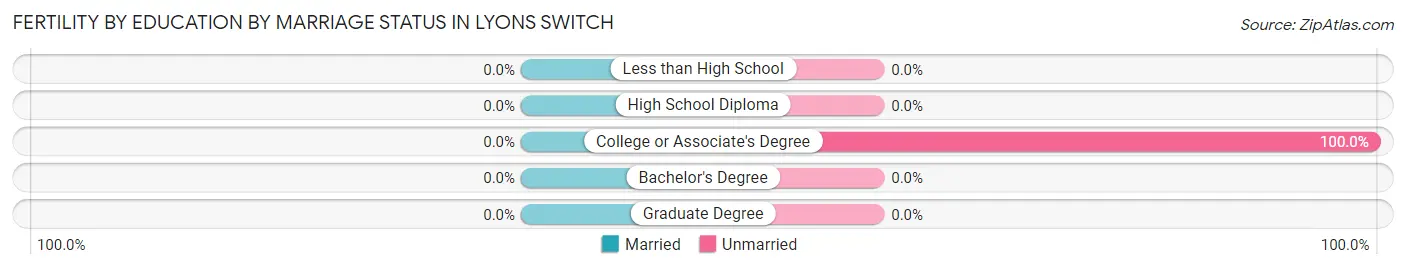
| Educational Attainment | Married | Unmarried |
| Less than High School | 0 (0.0%) | 0 (0.0%) |
| High School Diploma | 0 (0.0%) | 0 (0.0%) |
| College or Associate's Degree | 0 (0.0%) | 4 (100.0%) |
| Bachelor's Degree | 0 (0.0%) | 0 (0.0%) |
| Graduate Degree | 0 (0.0%) | 0 (0.0%) |
| Total | 0 (0.0%) | 4 (100.0%) |
Employment Characteristics in Lyons Switch
Employment by Class of Employer in Lyons Switch
Among the 239 employed individuals in Lyons Switch, private company employees (105 | 43.9%), local government employees (35 | 14.6%), and self-employed (not incorporated) (28 | 11.7%) make up the most common classes of employment.
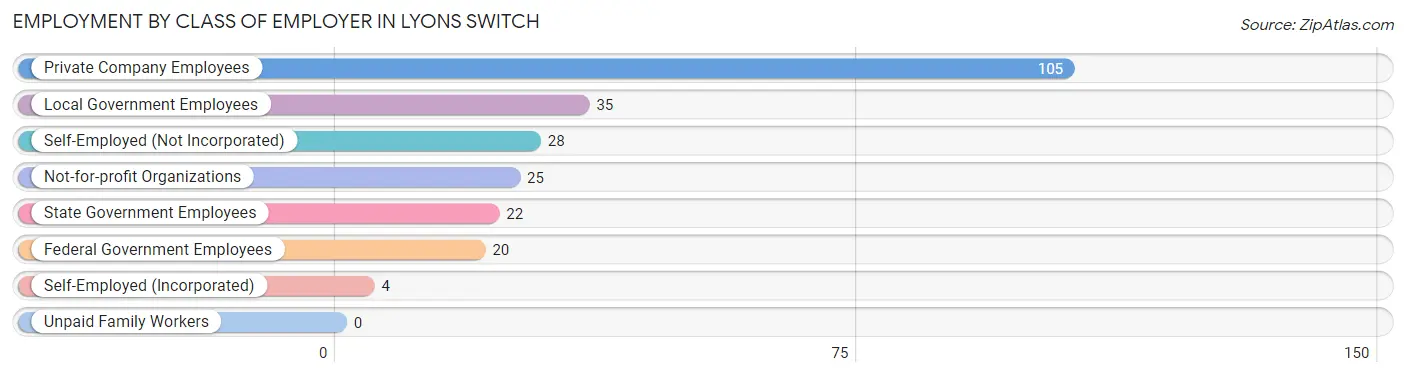
| Employer Class | # Employees | % Employees |
| Private Company Employees | 105 | 43.9% |
| Self-Employed (Incorporated) | 4 | 1.7% |
| Self-Employed (Not Incorporated) | 28 | 11.7% |
| Not-for-profit Organizations | 25 | 10.5% |
| Local Government Employees | 35 | 14.6% |
| State Government Employees | 22 | 9.2% |
| Federal Government Employees | 20 | 8.4% |
| Unpaid Family Workers | 0 | 0.0% |
| Total | 239 | 100.0% |
Employment Status by Age in Lyons Switch
According to the labor force statistics for Lyons Switch, out of the total population over 16 years of age (467), 58.5% or 273 individuals are in the labor force, with 11.0% or 30 of them unemployed. The age group with the highest labor force participation rate is 30 to 34 years, with 93.2% or 41 individuals in the labor force. Within the labor force, the 16 to 19 years age range has the highest percentage of unemployed individuals, with 100.0% or 5 of them being unemployed.
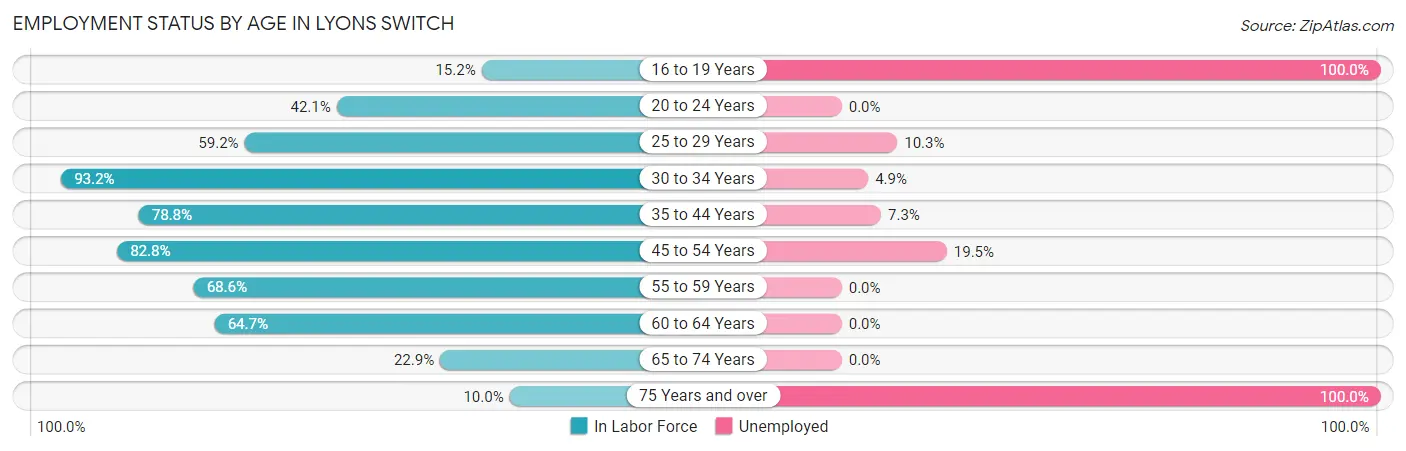
| Age Bracket | In Labor Force | Unemployed |
| 16 to 19 Years | 5 (15.2%) | 5 (100.0%) |
| 20 to 24 Years | 16 (42.1%) | 0 (0.0%) |
| 25 to 29 Years | 29 (59.2%) | 3 (10.3%) |
| 30 to 34 Years | 41 (93.2%) | 2 (4.9%) |
| 35 to 44 Years | 41 (78.8%) | 3 (7.3%) |
| 45 to 54 Years | 77 (82.8%) | 15 (19.5%) |
| 55 to 59 Years | 35 (68.6%) | 0 (0.0%) |
| 60 to 64 Years | 11 (64.7%) | 0 (0.0%) |
| 65 to 74 Years | 16 (22.9%) | 0 (0.0%) |
| 75 Years and over | 2 (10.0%) | 2 (100.0%) |
| Total | 273 (58.5%) | 30 (11.0%) |
Employment Status by Educational Attainment in Lyons Switch
According to labor force statistics for Lyons Switch, 76.5% of individuals (234) out of the total population between 25 and 64 years of age (306) are in the labor force, with 9.8% or 23 of them being unemployed. The group with the highest labor force participation rate are those with the educational attainment of bachelor's degree or higher, with 96.9% or 63 individuals in the labor force. Within the labor force, individuals with high school diploma education have the highest percentage of unemployment, with 18.8% or 16 of them being unemployed.
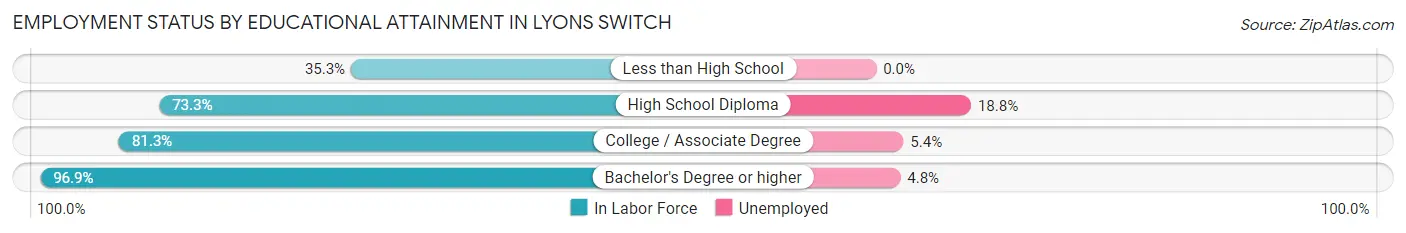
| Educational Attainment | In Labor Force | Unemployed |
| Less than High School | 12 (35.3%) | 0 (0.0%) |
| High School Diploma | 85 (73.3%) | 22 (18.8%) |
| College / Associate Degree | 74 (81.3%) | 5 (5.4%) |
| Bachelor's Degree or higher | 63 (96.9%) | 3 (4.8%) |
| Total | 234 (76.5%) | 30 (9.8%) |
Employment Occupations by Sex in Lyons Switch
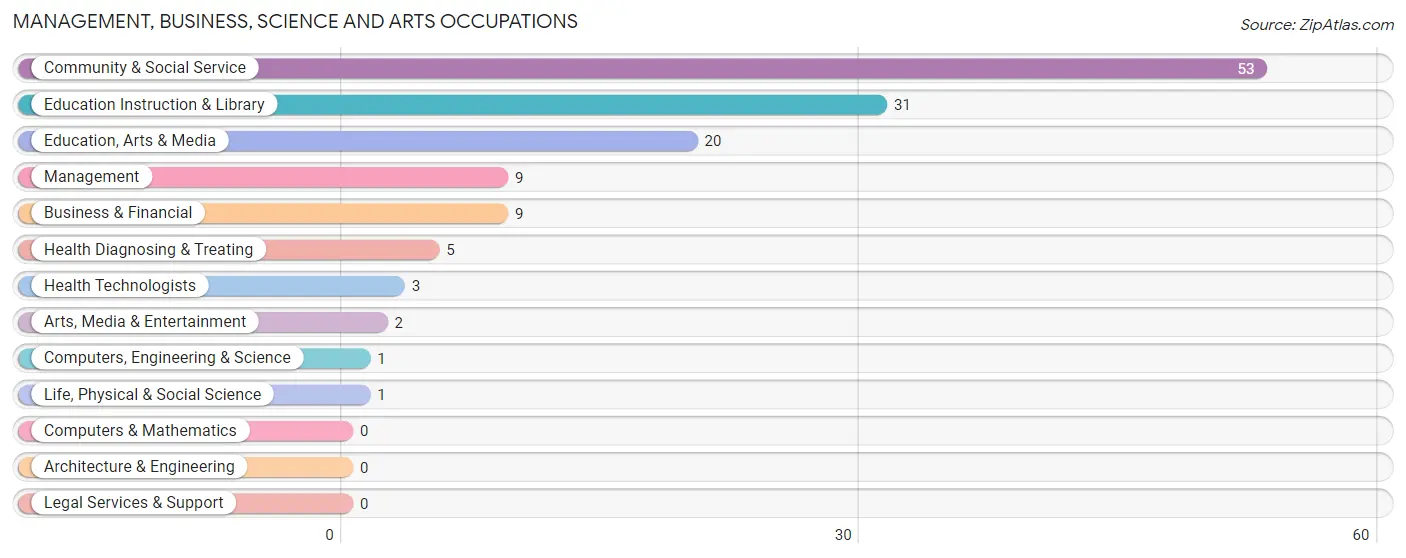
Management, Business, Science and Arts Occupations
The most common Management, Business, Science and Arts occupations in Lyons Switch are Community & Social Service (53 | 21.8%), Education Instruction & Library (31 | 12.8%), Education, Arts & Media (20 | 8.2%), Management (9 | 3.7%), and Business & Financial (9 | 3.7%).
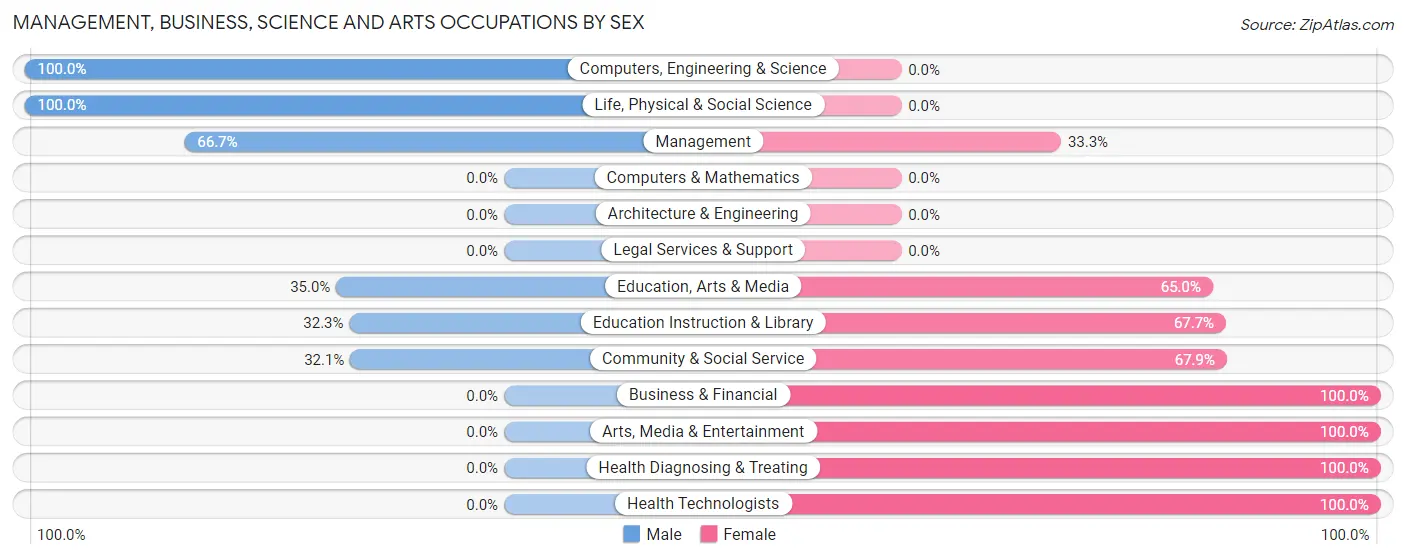
Management, Business, Science and Arts Occupations by Sex
Within the Management, Business, Science and Arts occupations in Lyons Switch, the most male-oriented occupations are Computers, Engineering & Science (100.0%), Life, Physical & Social Science (100.0%), and Management (66.7%), while the most female-oriented occupations are Business & Financial (100.0%), Arts, Media & Entertainment (100.0%), and Health Diagnosing & Treating (100.0%).
| Occupation | Male | Female |
| Management | 6 (66.7%) | 3 (33.3%) |
| Business & Financial | 0 (0.0%) | 9 (100.0%) |
| Computers, Engineering & Science | 1 (100.0%) | 0 (0.0%) |
| Computers & Mathematics | 0 (0.0%) | 0 (0.0%) |
| Architecture & Engineering | 0 (0.0%) | 0 (0.0%) |
| Life, Physical & Social Science | 1 (100.0%) | 0 (0.0%) |
| Community & Social Service | 17 (32.1%) | 36 (67.9%) |
| Education, Arts & Media | 7 (35.0%) | 13 (65.0%) |
| Legal Services & Support | 0 (0.0%) | 0 (0.0%) |
| Education Instruction & Library | 10 (32.3%) | 21 (67.7%) |
| Arts, Media & Entertainment | 0 (0.0%) | 2 (100.0%) |
| Health Diagnosing & Treating | 0 (0.0%) | 5 (100.0%) |
| Health Technologists | 0 (0.0%) | 3 (100.0%) |
| Total (Category) | 24 (31.2%) | 53 (68.8%) |
| Total (Overall) | 110 (45.3%) | 133 (54.7%) |
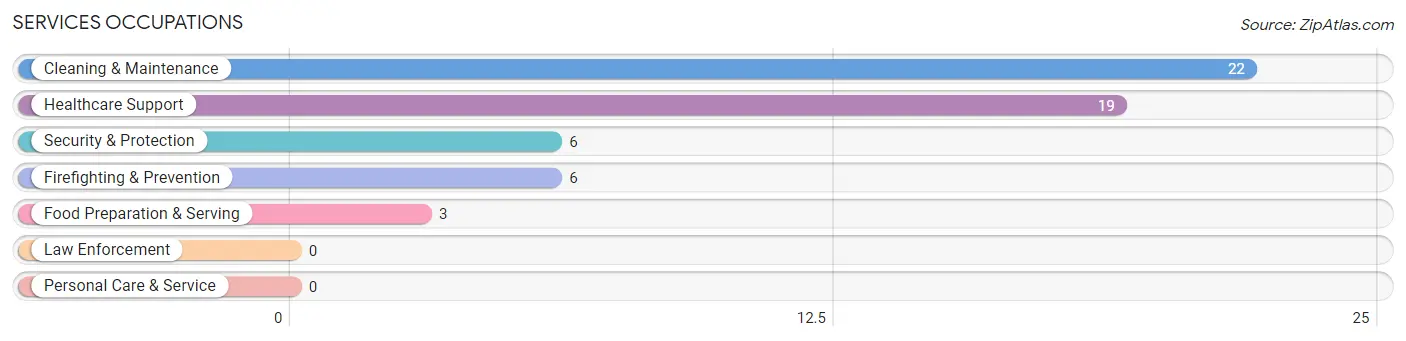
Services Occupations
The most common Services occupations in Lyons Switch are Cleaning & Maintenance (22 | 9.0%), Healthcare Support (19 | 7.8%), Security & Protection (6 | 2.5%), Firefighting & Prevention (6 | 2.5%), and Food Preparation & Serving (3 | 1.2%).
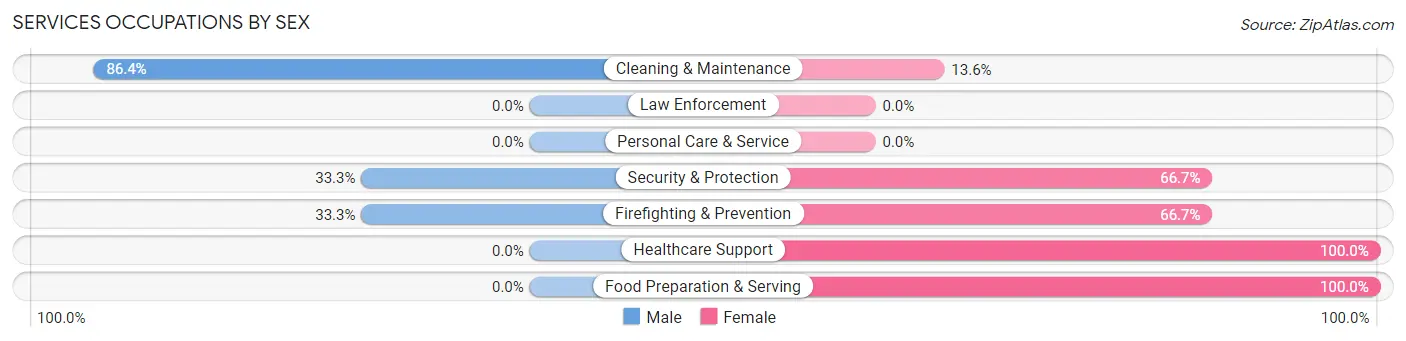
Services Occupations by Sex
Within the Services occupations in Lyons Switch, the most male-oriented occupations are Cleaning & Maintenance (86.4%), Security & Protection (33.3%), and Firefighting & Prevention (33.3%), while the most female-oriented occupations are Healthcare Support (100.0%), Food Preparation & Serving (100.0%), and Security & Protection (66.7%).
| Occupation | Male | Female |
| Healthcare Support | 0 (0.0%) | 19 (100.0%) |
| Security & Protection | 2 (33.3%) | 4 (66.7%) |
| Firefighting & Prevention | 2 (33.3%) | 4 (66.7%) |
| Law Enforcement | 0 (0.0%) | 0 (0.0%) |
| Food Preparation & Serving | 0 (0.0%) | 3 (100.0%) |
| Cleaning & Maintenance | 19 (86.4%) | 3 (13.6%) |
| Personal Care & Service | 0 (0.0%) | 0 (0.0%) |
| Total (Category) | 21 (42.0%) | 29 (58.0%) |
| Total (Overall) | 110 (45.3%) | 133 (54.7%) |
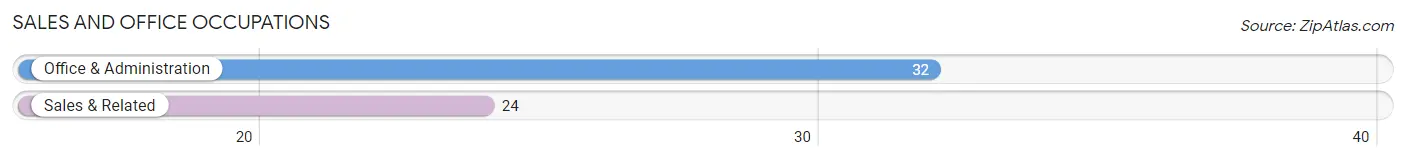
Sales and Office Occupations
The most common Sales and Office occupations in Lyons Switch are Office & Administration (32 | 13.2%), and Sales & Related (24 | 9.9%).
Sales and Office Occupations by Sex
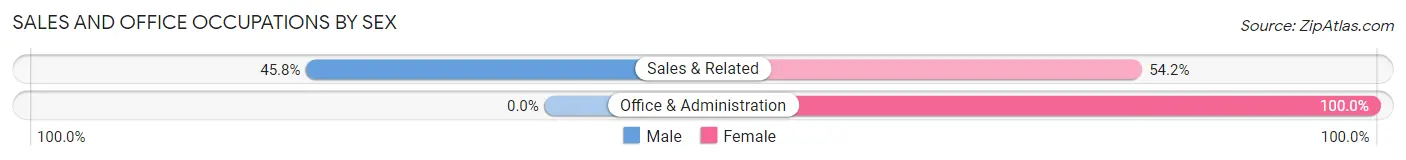
| Occupation | Male | Female |
| Sales & Related | 11 (45.8%) | 13 (54.2%) |
| Office & Administration | 0 (0.0%) | 32 (100.0%) |
| Total (Category) | 11 (19.6%) | 45 (80.4%) |
| Total (Overall) | 110 (45.3%) | 133 (54.7%) |
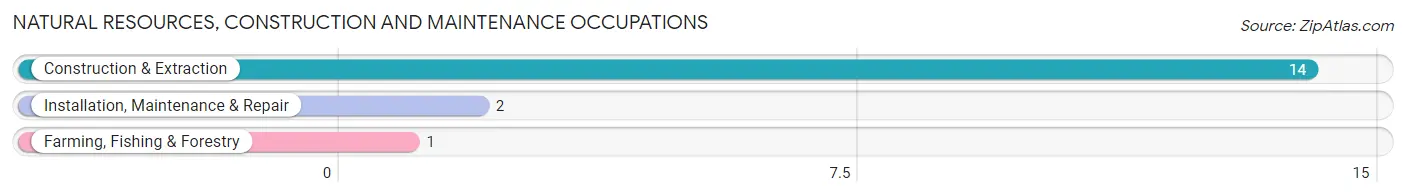
Natural Resources, Construction and Maintenance Occupations
The most common Natural Resources, Construction and Maintenance occupations in Lyons Switch are Construction & Extraction (14 | 5.8%), Installation, Maintenance & Repair (2 | 0.8%), and Farming, Fishing & Forestry (1 | 0.4%).
Natural Resources, Construction and Maintenance Occupations by Sex
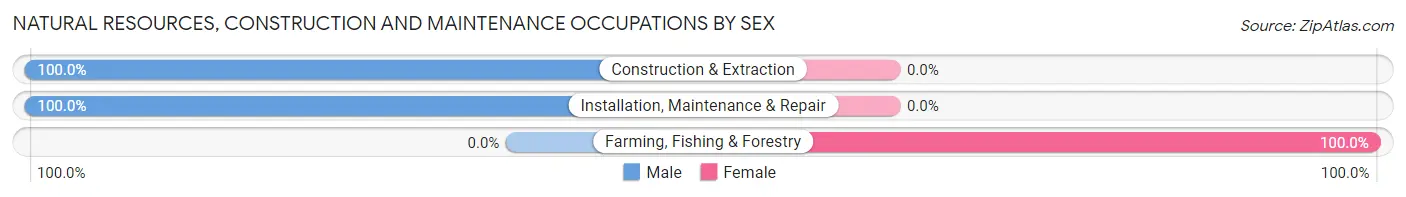
| Occupation | Male | Female |
| Farming, Fishing & Forestry | 0 (0.0%) | 1 (100.0%) |
| Construction & Extraction | 14 (100.0%) | 0 (0.0%) |
| Installation, Maintenance & Repair | 2 (100.0%) | 0 (0.0%) |
| Total (Category) | 16 (94.1%) | 1 (5.9%) |
| Total (Overall) | 110 (45.3%) | 133 (54.7%) |
Production, Transportation and Moving Occupations
The most common Production, Transportation and Moving occupations in Lyons Switch are Production (36 | 14.8%), Material Moving (5 | 2.1%), and Transportation (2 | 0.8%).
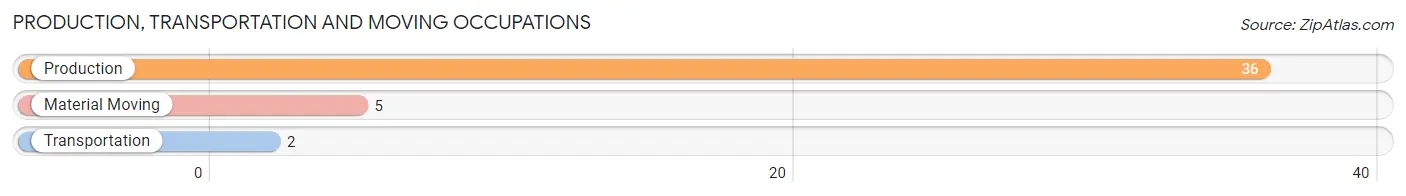
Production, Transportation and Moving Occupations by Sex
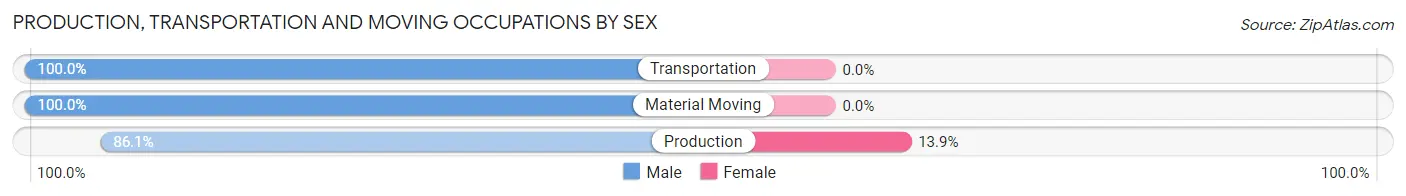
| Occupation | Male | Female |
| Production | 31 (86.1%) | 5 (13.9%) |
| Transportation | 2 (100.0%) | 0 (0.0%) |
| Material Moving | 5 (100.0%) | 0 (0.0%) |
| Total (Category) | 38 (88.4%) | 5 (11.6%) |
| Total (Overall) | 110 (45.3%) | 133 (54.7%) |
Employment Industries by Sex in Lyons Switch
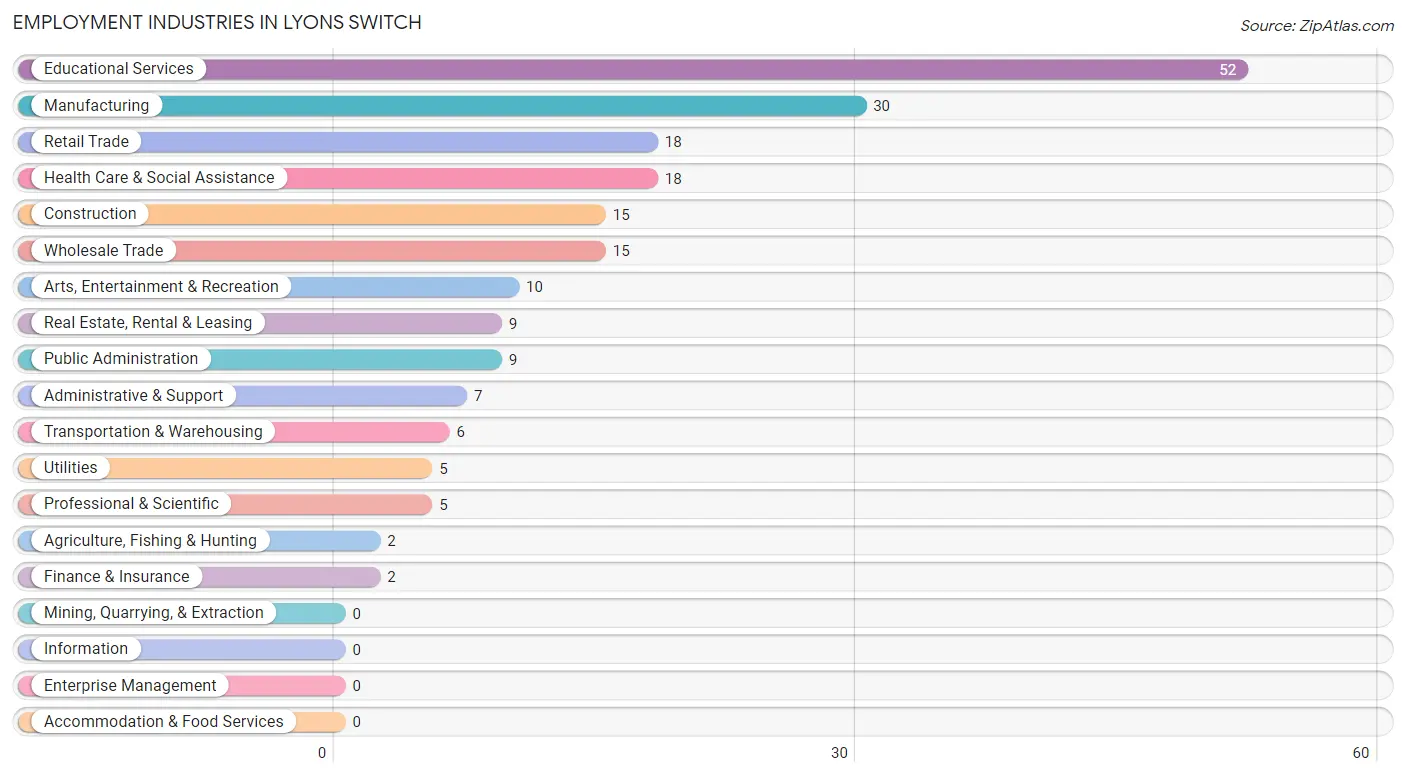
Employment Industries in Lyons Switch
The major employment industries in Lyons Switch include Educational Services (52 | 21.4%), Manufacturing (30 | 12.3%), Retail Trade (18 | 7.4%), Health Care & Social Assistance (18 | 7.4%), and Construction (15 | 6.2%).
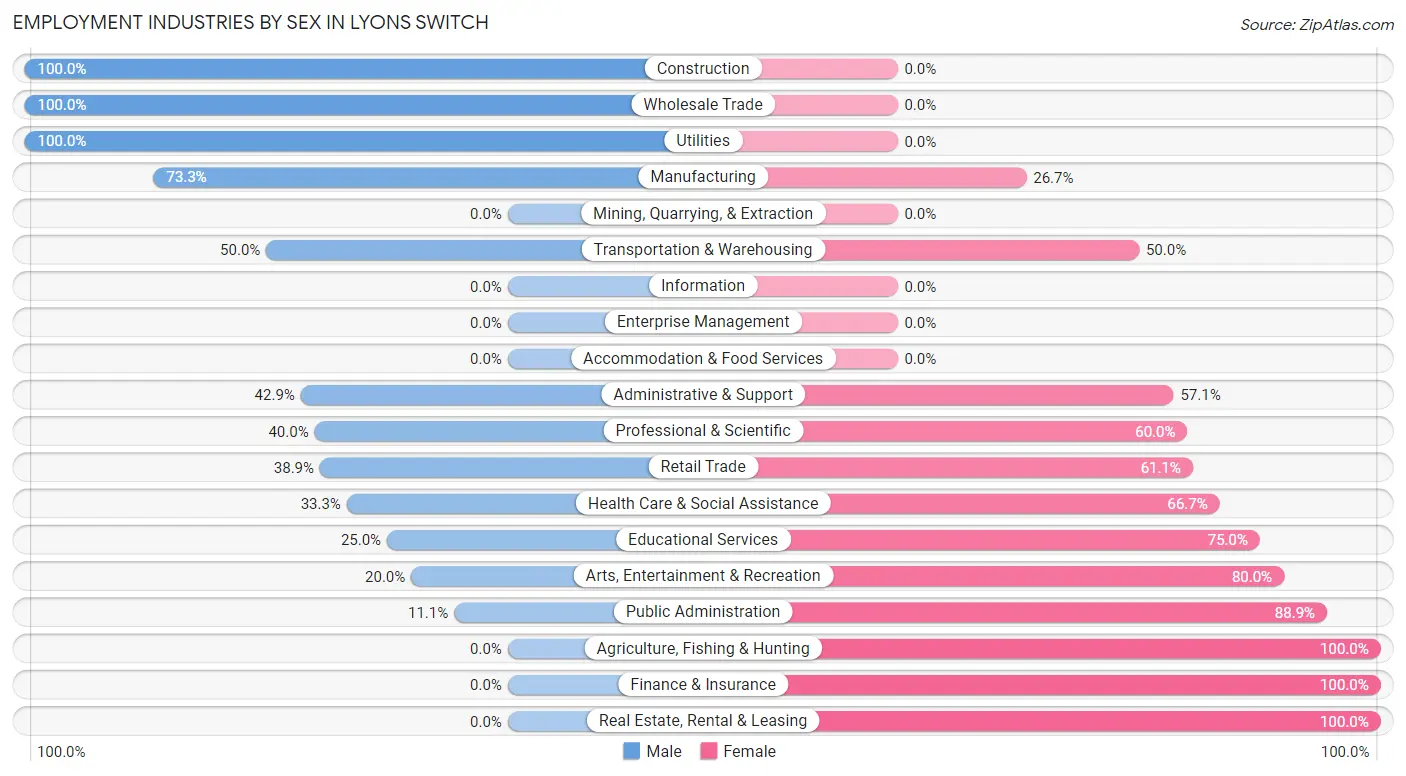
Employment Industries by Sex in Lyons Switch
The Lyons Switch industries that see more men than women are Construction (100.0%), Wholesale Trade (100.0%), and Utilities (100.0%), whereas the industries that tend to have a higher number of women are Agriculture, Fishing & Hunting (100.0%), Finance & Insurance (100.0%), and Real Estate, Rental & Leasing (100.0%).
| Industry | Male | Female |
| Agriculture, Fishing & Hunting | 0 (0.0%) | 2 (100.0%) |
| Mining, Quarrying, & Extraction | 0 (0.0%) | 0 (0.0%) |
| Construction | 15 (100.0%) | 0 (0.0%) |
| Manufacturing | 22 (73.3%) | 8 (26.7%) |
| Wholesale Trade | 15 (100.0%) | 0 (0.0%) |
| Retail Trade | 7 (38.9%) | 11 (61.1%) |
| Transportation & Warehousing | 3 (50.0%) | 3 (50.0%) |
| Utilities | 5 (100.0%) | 0 (0.0%) |
| Information | 0 (0.0%) | 0 (0.0%) |
| Finance & Insurance | 0 (0.0%) | 2 (100.0%) |
| Real Estate, Rental & Leasing | 0 (0.0%) | 9 (100.0%) |
| Professional & Scientific | 2 (40.0%) | 3 (60.0%) |
| Enterprise Management | 0 (0.0%) | 0 (0.0%) |
| Administrative & Support | 3 (42.9%) | 4 (57.1%) |
| Educational Services | 13 (25.0%) | 39 (75.0%) |
| Health Care & Social Assistance | 6 (33.3%) | 12 (66.7%) |
| Arts, Entertainment & Recreation | 2 (20.0%) | 8 (80.0%) |
| Accommodation & Food Services | 0 (0.0%) | 0 (0.0%) |
| Public Administration | 1 (11.1%) | 8 (88.9%) |
| Total | 110 (45.3%) | 133 (54.7%) |
Education in Lyons Switch
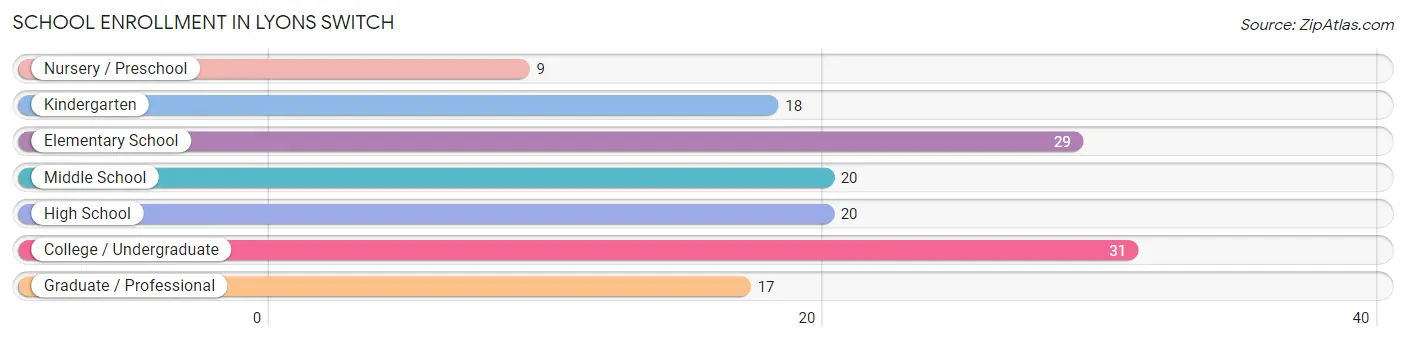
School Enrollment in Lyons Switch
The most common levels of schooling among the 144 students in Lyons Switch are college / undergraduate (31 | 21.5%), elementary school (29 | 20.1%), and middle school (20 | 13.9%).
| School Level | # Students | % Students |
| Nursery / Preschool | 9 | 6.2% |
| Kindergarten | 18 | 12.5% |
| Elementary School | 29 | 20.1% |
| Middle School | 20 | 13.9% |
| High School | 20 | 13.9% |
| College / Undergraduate | 31 | 21.5% |
| Graduate / Professional | 17 | 11.8% |
| Total | 144 | 100.0% |
School Enrollment by Age by Funding Source in Lyons Switch
Out of a total of 144 students who are enrolled in schools in Lyons Switch, 3 (2.1%) attend a private institution, while the remaining 141 (97.9%) are enrolled in public schools. The age group of 35 years and over has the highest likelihood of being enrolled in private schools, with 3 (17.6% in the age bracket) enrolled. Conversely, the age group of 3 to 4 year olds has the lowest likelihood of being enrolled in a private school, with 8 (100.0% in the age bracket) attending a public institution.
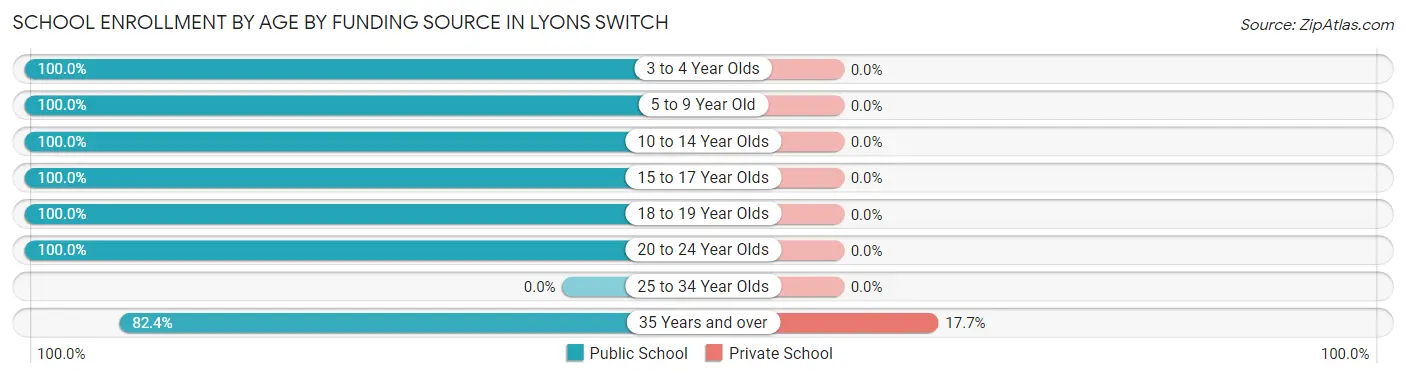
| Age Bracket | Public School | Private School |
| 3 to 4 Year Olds | 8 (100.0%) | 0 (0.0%) |
| 5 to 9 Year Old | 48 (100.0%) | 0 (0.0%) |
| 10 to 14 Year Olds | 20 (100.0%) | 0 (0.0%) |
| 15 to 17 Year Olds | 16 (100.0%) | 0 (0.0%) |
| 18 to 19 Year Olds | 17 (100.0%) | 0 (0.0%) |
| 20 to 24 Year Olds | 18 (100.0%) | 0 (0.0%) |
| 25 to 34 Year Olds | 0 (0.0%) | 0 (0.0%) |
| 35 Years and over | 14 (82.4%) | 3 (17.6%) |
| Total | 141 (97.9%) | 3 (2.1%) |
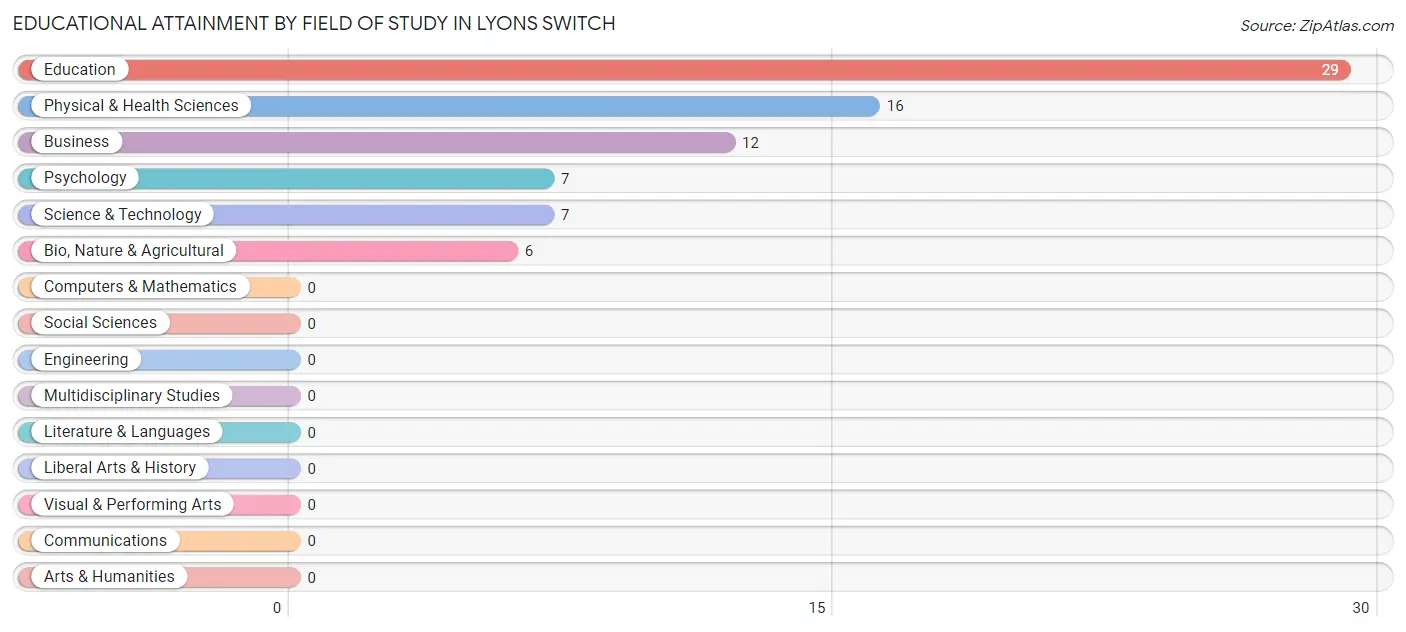
Educational Attainment by Field of Study in Lyons Switch
Education (29 | 37.7%), physical & health sciences (16 | 20.8%), business (12 | 15.6%), psychology (7 | 9.1%), and science & technology (7 | 9.1%) are the most common fields of study among 77 individuals in Lyons Switch who have obtained a bachelor's degree or higher.
| Field of Study | # Graduates | % Graduates |
| Computers & Mathematics | 0 | 0.0% |
| Bio, Nature & Agricultural | 6 | 7.8% |
| Physical & Health Sciences | 16 | 20.8% |
| Psychology | 7 | 9.1% |
| Social Sciences | 0 | 0.0% |
| Engineering | 0 | 0.0% |
| Multidisciplinary Studies | 0 | 0.0% |
| Science & Technology | 7 | 9.1% |
| Business | 12 | 15.6% |
| Education | 29 | 37.7% |
| Literature & Languages | 0 | 0.0% |
| Liberal Arts & History | 0 | 0.0% |
| Visual & Performing Arts | 0 | 0.0% |
| Communications | 0 | 0.0% |
| Arts & Humanities | 0 | 0.0% |
| Total | 77 | 100.0% |
Transportation & Commute in Lyons Switch
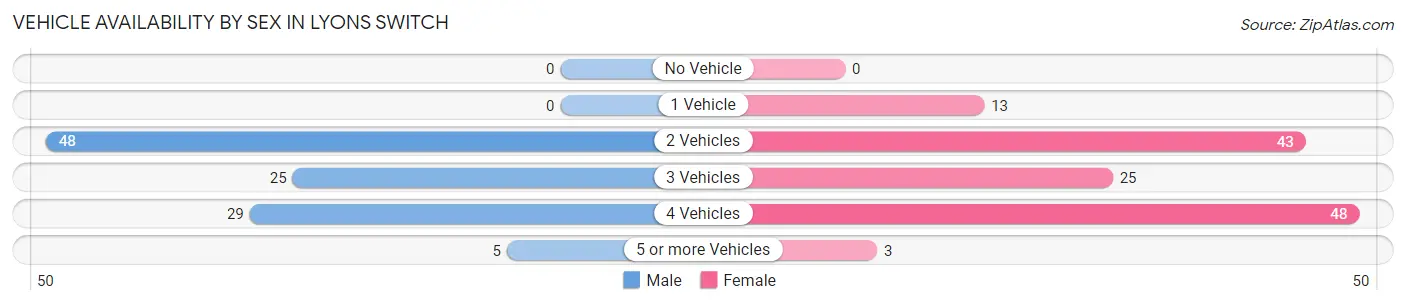
Vehicle Availability by Sex in Lyons Switch
The most prevalent vehicle ownership categories in Lyons Switch are males with 2 vehicles (48, accounting for 44.9%) and females with 2 vehicles (43, making up 36.4%).
| Vehicles Available | Male | Female |
| No Vehicle | 0 (0.0%) | 0 (0.0%) |
| 1 Vehicle | 0 (0.0%) | 13 (9.9%) |
| 2 Vehicles | 48 (44.9%) | 43 (32.6%) |
| 3 Vehicles | 25 (23.4%) | 25 (18.9%) |
| 4 Vehicles | 29 (27.1%) | 48 (36.4%) |
| 5 or more Vehicles | 5 (4.7%) | 3 (2.3%) |
| Total | 107 (100.0%) | 132 (100.0%) |
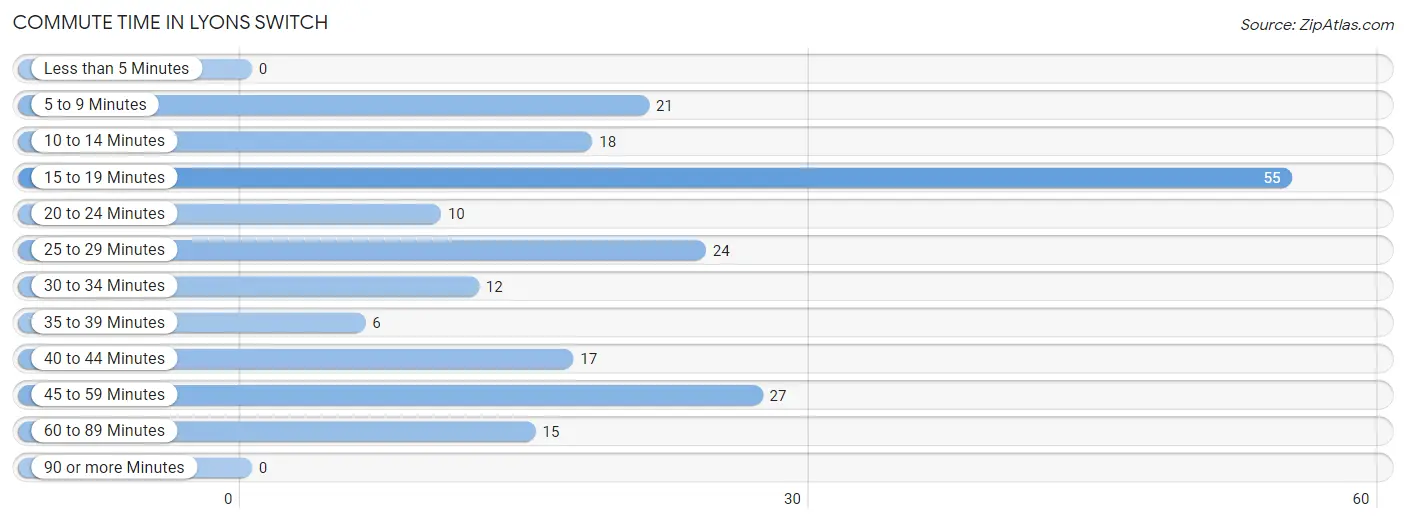
Commute Time in Lyons Switch
The most frequently occuring commute durations in Lyons Switch are 15 to 19 minutes (55 commuters, 26.8%), 45 to 59 minutes (27 commuters, 13.2%), and 25 to 29 minutes (24 commuters, 11.7%).
| Commute Time | # Commuters | % Commuters |
| Less than 5 Minutes | 0 | 0.0% |
| 5 to 9 Minutes | 21 | 10.2% |
| 10 to 14 Minutes | 18 | 8.8% |
| 15 to 19 Minutes | 55 | 26.8% |
| 20 to 24 Minutes | 10 | 4.9% |
| 25 to 29 Minutes | 24 | 11.7% |
| 30 to 34 Minutes | 12 | 5.9% |
| 35 to 39 Minutes | 6 | 2.9% |
| 40 to 44 Minutes | 17 | 8.3% |
| 45 to 59 Minutes | 27 | 13.2% |
| 60 to 89 Minutes | 15 | 7.3% |
| 90 or more Minutes | 0 | 0.0% |
Commute Time by Sex in Lyons Switch
The most common commute times in Lyons Switch are 15 to 19 minutes (23 commuters, 24.2%) for males and 15 to 19 minutes (32 commuters, 29.1%) for females.
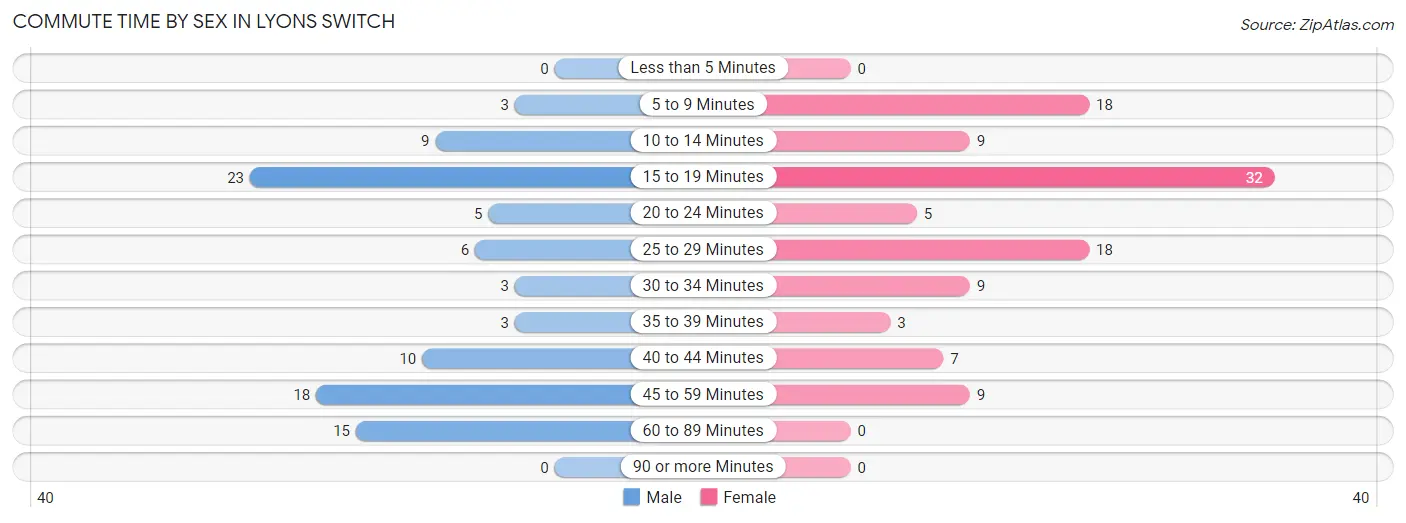
| Commute Time | Male | Female |
| Less than 5 Minutes | 0 (0.0%) | 0 (0.0%) |
| 5 to 9 Minutes | 3 (3.2%) | 18 (16.4%) |
| 10 to 14 Minutes | 9 (9.5%) | 9 (8.2%) |
| 15 to 19 Minutes | 23 (24.2%) | 32 (29.1%) |
| 20 to 24 Minutes | 5 (5.3%) | 5 (4.5%) |
| 25 to 29 Minutes | 6 (6.3%) | 18 (16.4%) |
| 30 to 34 Minutes | 3 (3.2%) | 9 (8.2%) |
| 35 to 39 Minutes | 3 (3.2%) | 3 (2.7%) |
| 40 to 44 Minutes | 10 (10.5%) | 7 (6.4%) |
| 45 to 59 Minutes | 18 (19.0%) | 9 (8.2%) |
| 60 to 89 Minutes | 15 (15.8%) | 0 (0.0%) |
| 90 or more Minutes | 0 (0.0%) | 0 (0.0%) |
Time of Departure to Work by Sex in Lyons Switch
The most frequent times of departure to work in Lyons Switch are 6:30 AM to 6:59 AM (23, 24.2%) for males and 7:30 AM to 7:59 AM (31, 28.2%) for females.
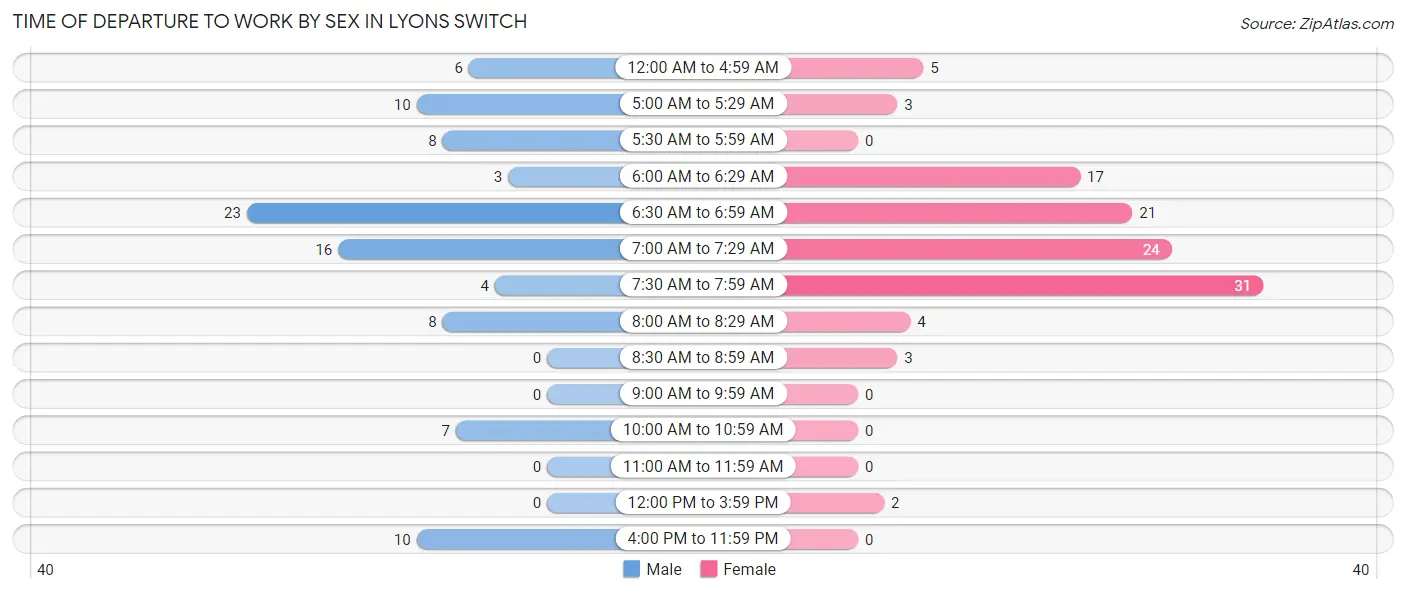
| Time of Departure | Male | Female |
| 12:00 AM to 4:59 AM | 6 (6.3%) | 5 (4.5%) |
| 5:00 AM to 5:29 AM | 10 (10.5%) | 3 (2.7%) |
| 5:30 AM to 5:59 AM | 8 (8.4%) | 0 (0.0%) |
| 6:00 AM to 6:29 AM | 3 (3.2%) | 17 (15.4%) |
| 6:30 AM to 6:59 AM | 23 (24.2%) | 21 (19.1%) |
| 7:00 AM to 7:29 AM | 16 (16.8%) | 24 (21.8%) |
| 7:30 AM to 7:59 AM | 4 (4.2%) | 31 (28.2%) |
| 8:00 AM to 8:29 AM | 8 (8.4%) | 4 (3.6%) |
| 8:30 AM to 8:59 AM | 0 (0.0%) | 3 (2.7%) |
| 9:00 AM to 9:59 AM | 0 (0.0%) | 0 (0.0%) |
| 10:00 AM to 10:59 AM | 7 (7.4%) | 0 (0.0%) |
| 11:00 AM to 11:59 AM | 0 (0.0%) | 0 (0.0%) |
| 12:00 PM to 3:59 PM | 0 (0.0%) | 2 (1.8%) |
| 4:00 PM to 11:59 PM | 10 (10.5%) | 0 (0.0%) |
| Total | 95 (100.0%) | 110 (100.0%) |
Housing Occupancy in Lyons Switch
Occupancy by Ownership in Lyons Switch
Of the total 170 dwellings in Lyons Switch, owner-occupied units account for 144 (84.7%), while renter-occupied units make up 26 (15.3%).
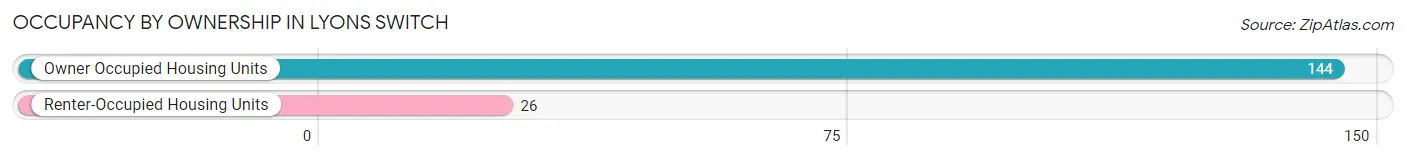
| Occupancy | # Housing Units | % Housing Units |
| Owner Occupied Housing Units | 144 | 84.7% |
| Renter-Occupied Housing Units | 26 | 15.3% |
| Total Occupied Housing Units | 170 | 100.0% |
Occupancy by Household Size in Lyons Switch
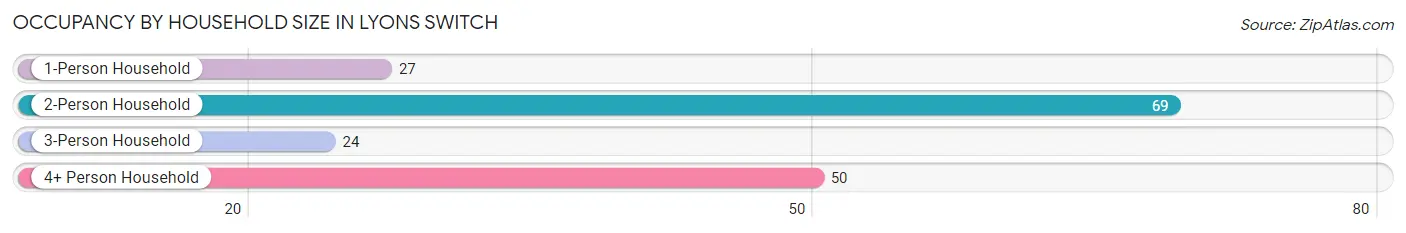
| Household Size | # Housing Units | % Housing Units |
| 1-Person Household | 27 | 15.9% |
| 2-Person Household | 69 | 40.6% |
| 3-Person Household | 24 | 14.1% |
| 4+ Person Household | 50 | 29.4% |
| Total Housing Units | 170 | 100.0% |
Occupancy by Ownership by Household Size in Lyons Switch
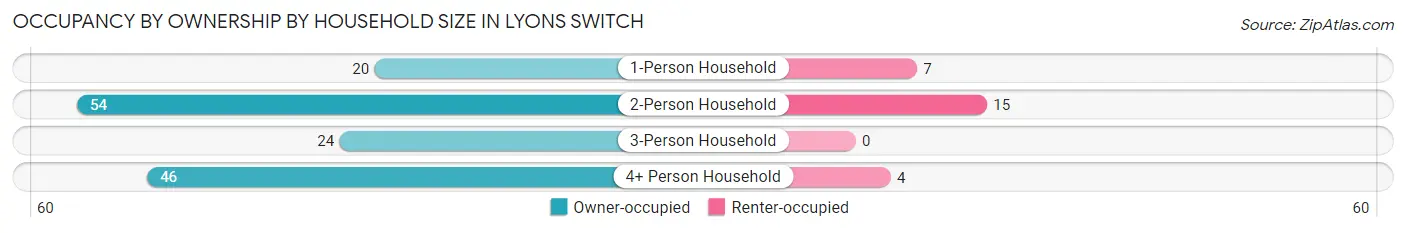
| Household Size | Owner-occupied | Renter-occupied |
| 1-Person Household | 20 (74.1%) | 7 (25.9%) |
| 2-Person Household | 54 (78.3%) | 15 (21.7%) |
| 3-Person Household | 24 (100.0%) | 0 (0.0%) |
| 4+ Person Household | 46 (92.0%) | 4 (8.0%) |
| Total Housing Units | 144 (84.7%) | 26 (15.3%) |
Occupancy by Educational Attainment in Lyons Switch
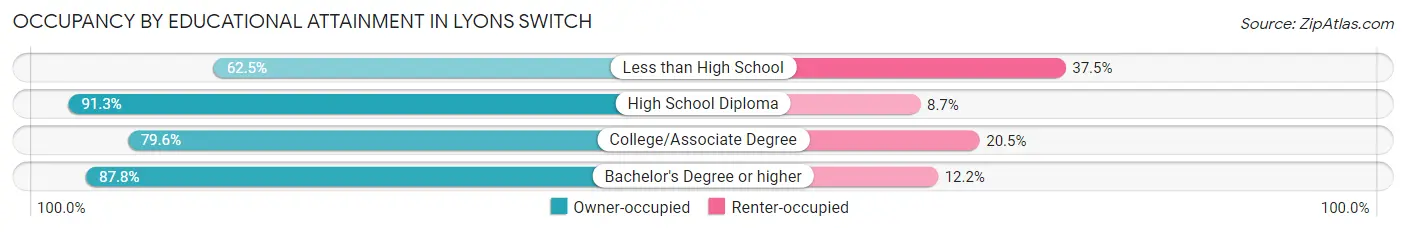
| Household Size | Owner-occupied | Renter-occupied |
| Less than High School | 10 (62.5%) | 6 (37.5%) |
| High School Diploma | 63 (91.3%) | 6 (8.7%) |
| College/Associate Degree | 35 (79.5%) | 9 (20.4%) |
| Bachelor's Degree or higher | 36 (87.8%) | 5 (12.2%) |
Occupancy by Age of Householder in Lyons Switch
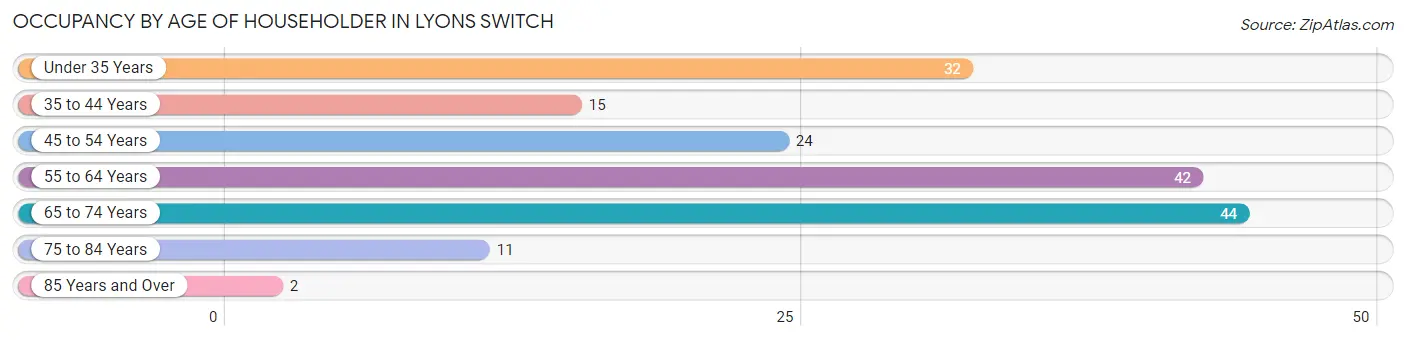
| Age Bracket | # Households | % Households |
| Under 35 Years | 32 | 18.8% |
| 35 to 44 Years | 15 | 8.8% |
| 45 to 54 Years | 24 | 14.1% |
| 55 to 64 Years | 42 | 24.7% |
| 65 to 74 Years | 44 | 25.9% |
| 75 to 84 Years | 11 | 6.5% |
| 85 Years and Over | 2 | 1.2% |
| Total | 170 | 100.0% |
Housing Finances in Lyons Switch
Median Income by Occupancy in Lyons Switch
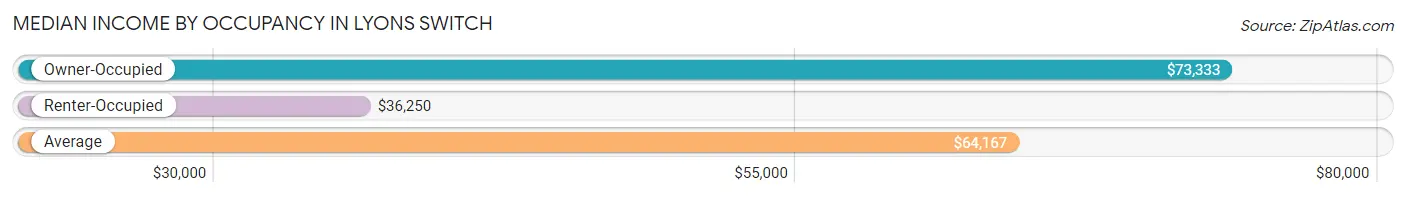
| Occupancy Type | # Households | Median Income |
| Owner-Occupied | 144 (84.7%) | $73,333 |
| Renter-Occupied | 26 (15.3%) | $36,250 |
| Average | 170 (100.0%) | $64,167 |
Occupancy by Householder Income Bracket in Lyons Switch
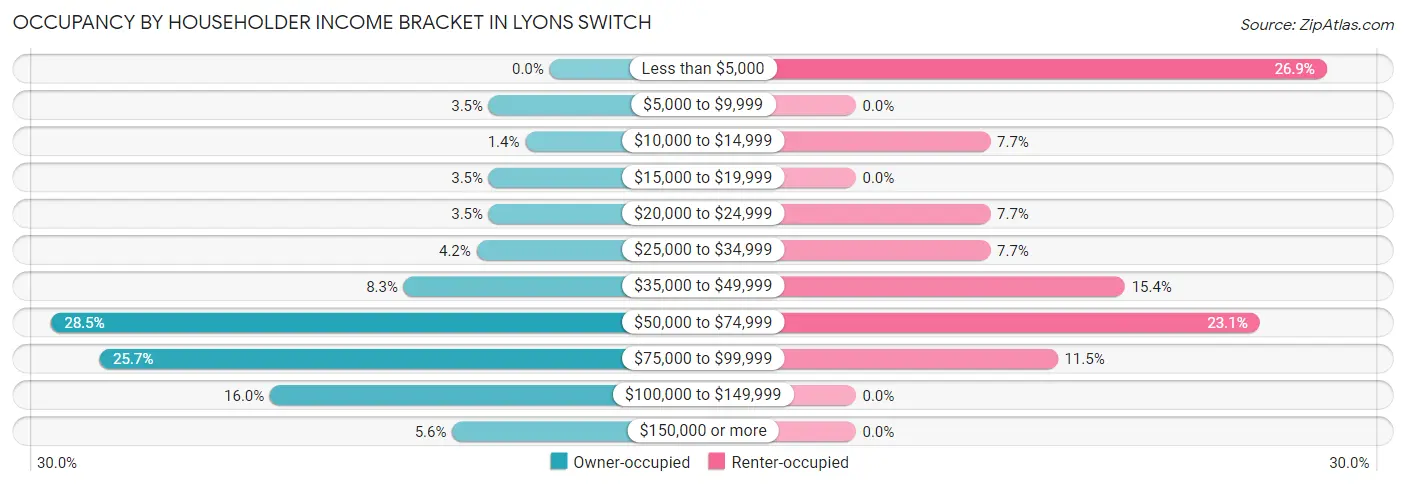
| Income Bracket | Owner-occupied | Renter-occupied |
| Less than $5,000 | 0 (0.0%) | 7 (26.9%) |
| $5,000 to $9,999 | 5 (3.5%) | 0 (0.0%) |
| $10,000 to $14,999 | 2 (1.4%) | 2 (7.7%) |
| $15,000 to $19,999 | 5 (3.5%) | 0 (0.0%) |
| $20,000 to $24,999 | 5 (3.5%) | 2 (7.7%) |
| $25,000 to $34,999 | 6 (4.2%) | 2 (7.7%) |
| $35,000 to $49,999 | 12 (8.3%) | 4 (15.4%) |
| $50,000 to $74,999 | 41 (28.5%) | 6 (23.1%) |
| $75,000 to $99,999 | 37 (25.7%) | 3 (11.5%) |
| $100,000 to $149,999 | 23 (16.0%) | 0 (0.0%) |
| $150,000 or more | 8 (5.6%) | 0 (0.0%) |
| Total | 144 (100.0%) | 26 (100.0%) |
Monthly Housing Cost Tiers in Lyons Switch
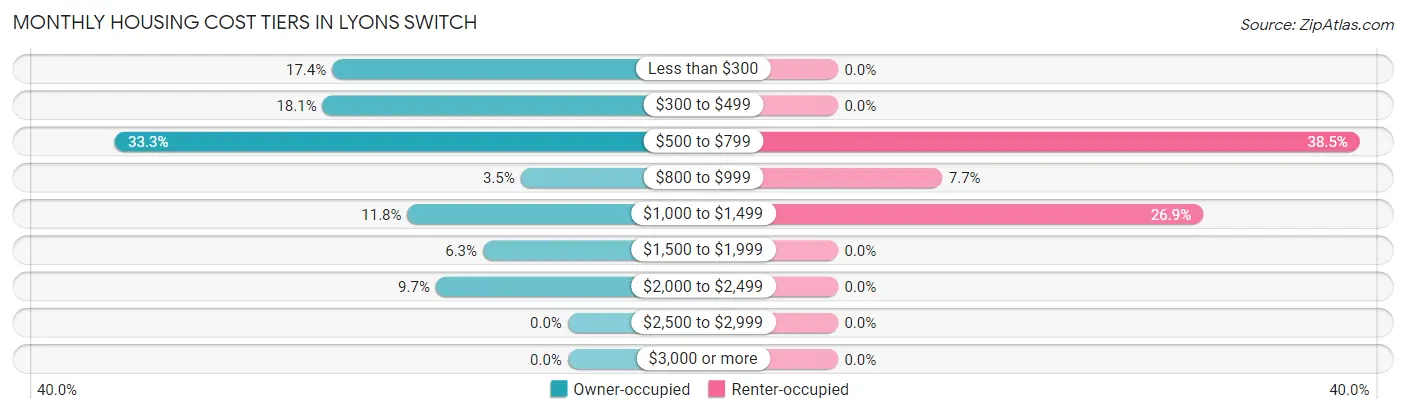
| Monthly Cost | Owner-occupied | Renter-occupied |
| Less than $300 | 25 (17.4%) | 0 (0.0%) |
| $300 to $499 | 26 (18.1%) | 0 (0.0%) |
| $500 to $799 | 48 (33.3%) | 10 (38.5%) |
| $800 to $999 | 5 (3.5%) | 2 (7.7%) |
| $1,000 to $1,499 | 17 (11.8%) | 7 (26.9%) |
| $1,500 to $1,999 | 9 (6.2%) | 0 (0.0%) |
| $2,000 to $2,499 | 14 (9.7%) | 0 (0.0%) |
| $2,500 to $2,999 | 0 (0.0%) | 0 (0.0%) |
| $3,000 or more | 0 (0.0%) | 0 (0.0%) |
| Total | 144 (100.0%) | 26 (100.0%) |
Physical Housing Characteristics in Lyons Switch
Housing Structures in Lyons Switch
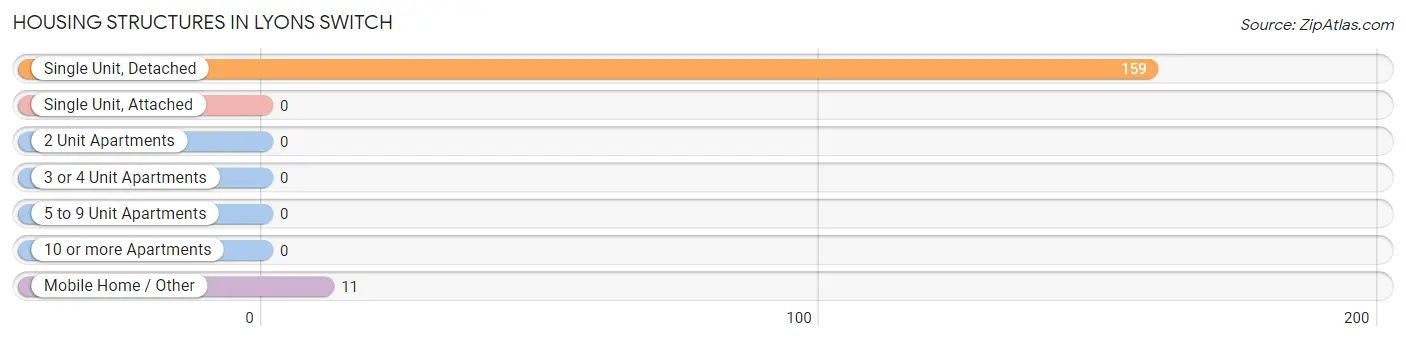
| Structure Type | # Housing Units | % Housing Units |
| Single Unit, Detached | 159 | 93.5% |
| Single Unit, Attached | 0 | 0.0% |
| 2 Unit Apartments | 0 | 0.0% |
| 3 or 4 Unit Apartments | 0 | 0.0% |
| 5 to 9 Unit Apartments | 0 | 0.0% |
| 10 or more Apartments | 0 | 0.0% |
| Mobile Home / Other | 11 | 6.5% |
| Total | 170 | 100.0% |
Housing Structures by Occupancy in Lyons Switch
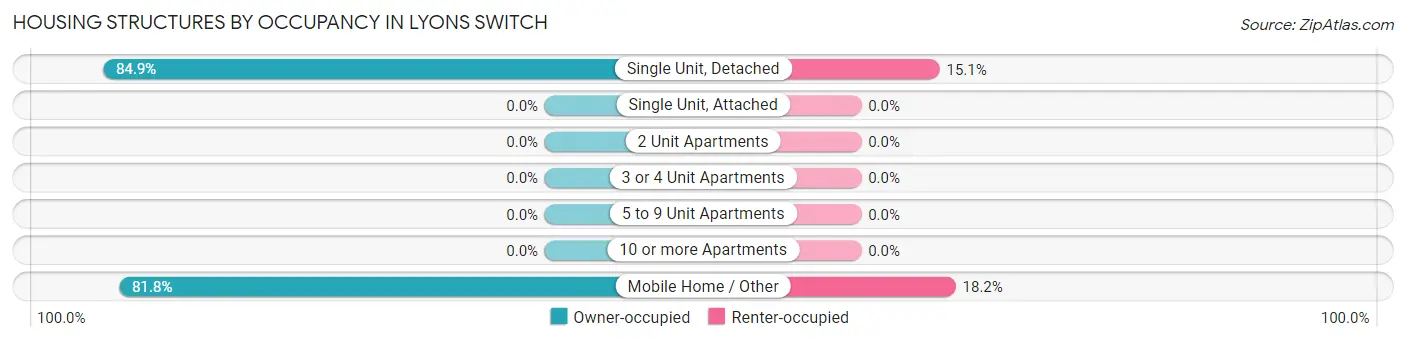
| Structure Type | Owner-occupied | Renter-occupied |
| Single Unit, Detached | 135 (84.9%) | 24 (15.1%) |
| Single Unit, Attached | 0 (0.0%) | 0 (0.0%) |
| 2 Unit Apartments | 0 (0.0%) | 0 (0.0%) |
| 3 or 4 Unit Apartments | 0 (0.0%) | 0 (0.0%) |
| 5 to 9 Unit Apartments | 0 (0.0%) | 0 (0.0%) |
| 10 or more Apartments | 0 (0.0%) | 0 (0.0%) |
| Mobile Home / Other | 9 (81.8%) | 2 (18.2%) |
| Total | 144 (84.7%) | 26 (15.3%) |
Housing Structures by Number of Rooms in Lyons Switch
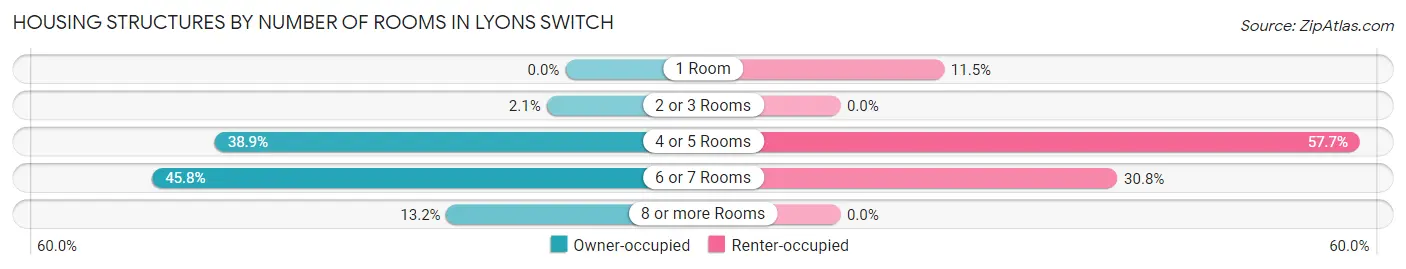
| Number of Rooms | Owner-occupied | Renter-occupied |
| 1 Room | 0 (0.0%) | 3 (11.5%) |
| 2 or 3 Rooms | 3 (2.1%) | 0 (0.0%) |
| 4 or 5 Rooms | 56 (38.9%) | 15 (57.7%) |
| 6 or 7 Rooms | 66 (45.8%) | 8 (30.8%) |
| 8 or more Rooms | 19 (13.2%) | 0 (0.0%) |
| Total | 144 (100.0%) | 26 (100.0%) |
Housing Structure by Heating Type in Lyons Switch
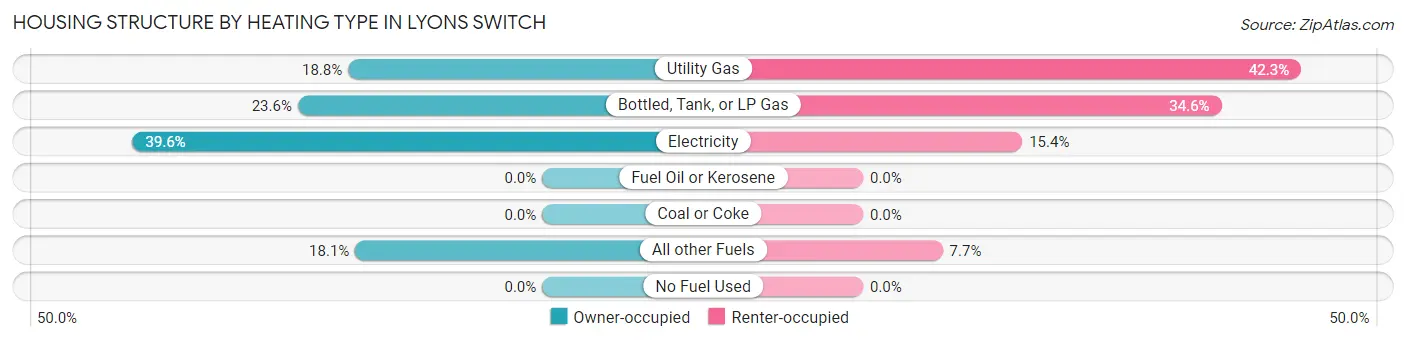
| Heating Type | Owner-occupied | Renter-occupied |
| Utility Gas | 27 (18.8%) | 11 (42.3%) |
| Bottled, Tank, or LP Gas | 34 (23.6%) | 9 (34.6%) |
| Electricity | 57 (39.6%) | 4 (15.4%) |
| Fuel Oil or Kerosene | 0 (0.0%) | 0 (0.0%) |
| Coal or Coke | 0 (0.0%) | 0 (0.0%) |
| All other Fuels | 26 (18.1%) | 2 (7.7%) |
| No Fuel Used | 0 (0.0%) | 0 (0.0%) |
| Total | 144 (100.0%) | 26 (100.0%) |
Household Vehicle Usage in Lyons Switch
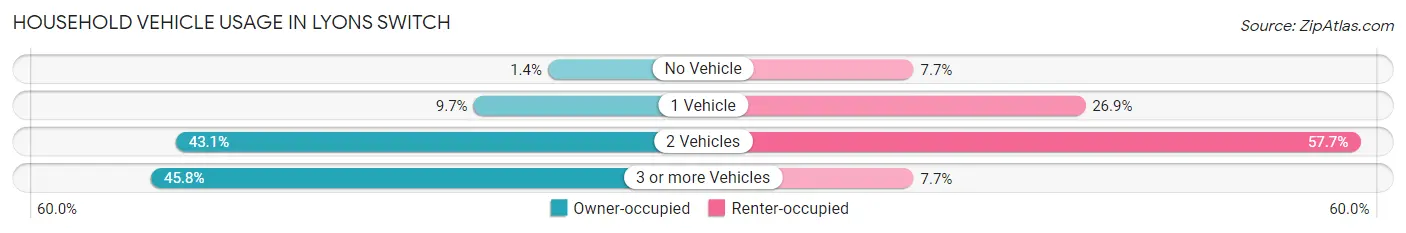
| Vehicles per Household | Owner-occupied | Renter-occupied |
| No Vehicle | 2 (1.4%) | 2 (7.7%) |
| 1 Vehicle | 14 (9.7%) | 7 (26.9%) |
| 2 Vehicles | 62 (43.1%) | 15 (57.7%) |
| 3 or more Vehicles | 66 (45.8%) | 2 (7.7%) |
| Total | 144 (100.0%) | 26 (100.0%) |
Real Estate & Mortgages in Lyons Switch
Real Estate and Mortgage Overview in Lyons Switch
| Characteristic | Without Mortgage | With Mortgage |
| Housing Units | 75 | 69 |
| Median Property Value | $176,800 | $223,900 |
| Median Household Income | $69,583 | $6 |
| Monthly Housing Costs | $363 | $0 |
| Real Estate Taxes | $814 | $6 |
Property Value by Mortgage Status in Lyons Switch
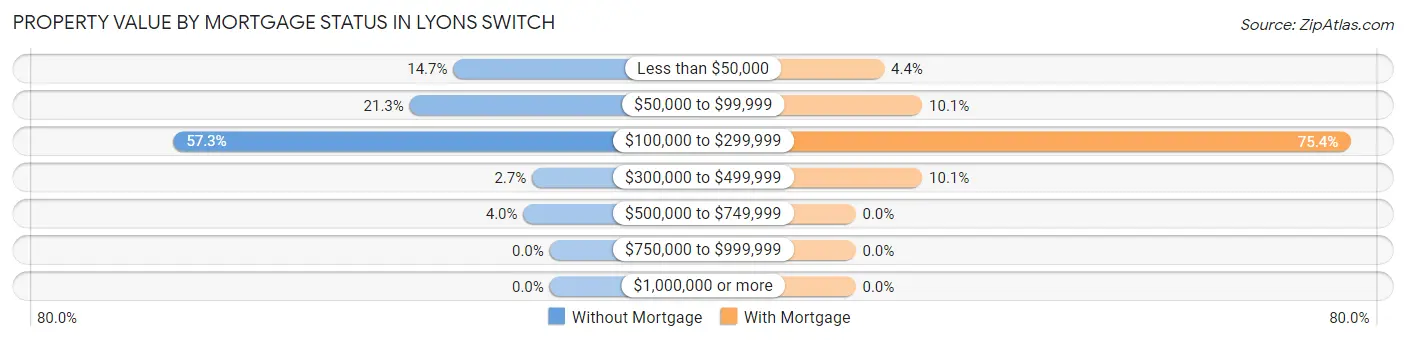
| Property Value | Without Mortgage | With Mortgage |
| Less than $50,000 | 11 (14.7%) | 3 (4.3%) |
| $50,000 to $99,999 | 16 (21.3%) | 7 (10.1%) |
| $100,000 to $299,999 | 43 (57.3%) | 52 (75.4%) |
| $300,000 to $499,999 | 2 (2.7%) | 7 (10.1%) |
| $500,000 to $749,999 | 3 (4.0%) | 0 (0.0%) |
| $750,000 to $999,999 | 0 (0.0%) | 0 (0.0%) |
| $1,000,000 or more | 0 (0.0%) | 0 (0.0%) |
| Total | 75 (100.0%) | 69 (100.0%) |
Household Income by Mortgage Status in Lyons Switch
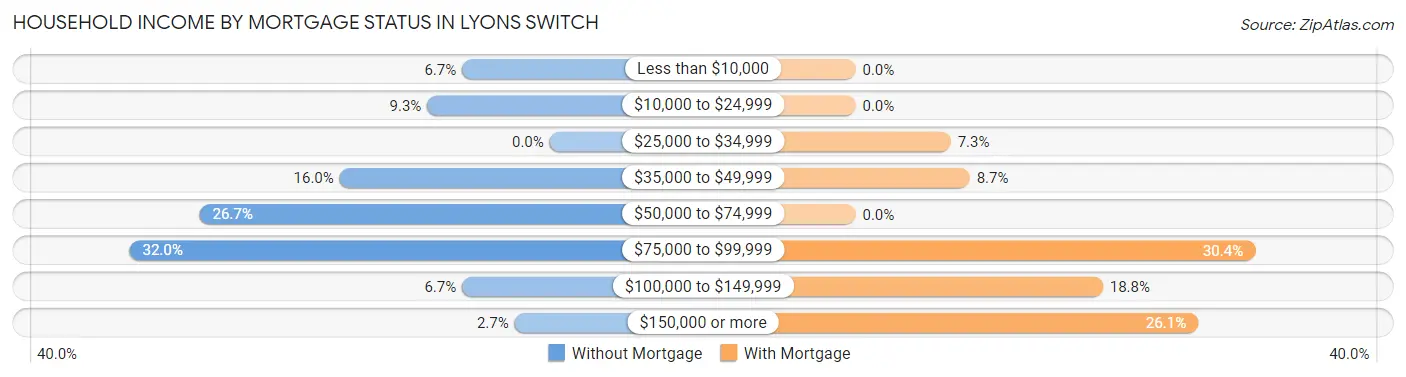
| Household Income | Without Mortgage | With Mortgage |
| Less than $10,000 | 5 (6.7%) | 0 (0.0%) |
| $10,000 to $24,999 | 7 (9.3%) | 0 (0.0%) |
| $25,000 to $34,999 | 0 (0.0%) | 5 (7.2%) |
| $35,000 to $49,999 | 12 (16.0%) | 6 (8.7%) |
| $50,000 to $74,999 | 20 (26.7%) | 0 (0.0%) |
| $75,000 to $99,999 | 24 (32.0%) | 21 (30.4%) |
| $100,000 to $149,999 | 5 (6.7%) | 13 (18.8%) |
| $150,000 or more | 2 (2.7%) | 18 (26.1%) |
| Total | 75 (100.0%) | 69 (100.0%) |
Property Value to Household Income Ratio in Lyons Switch
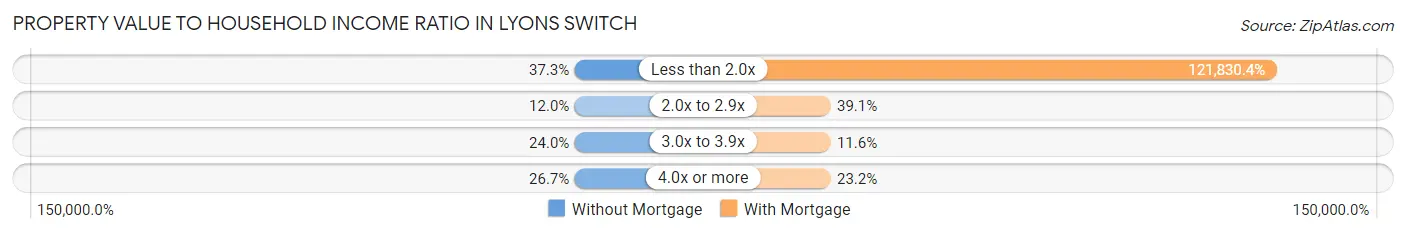
| Value-to-Income Ratio | Without Mortgage | With Mortgage |
| Less than 2.0x | 28 (37.3%) | 84,063 (121,830.4%) |
| 2.0x to 2.9x | 9 (12.0%) | 27 (39.1%) |
| 3.0x to 3.9x | 18 (24.0%) | 8 (11.6%) |
| 4.0x or more | 20 (26.7%) | 16 (23.2%) |
| Total | 75 (100.0%) | 69 (100.0%) |
Real Estate Taxes by Mortgage Status in Lyons Switch
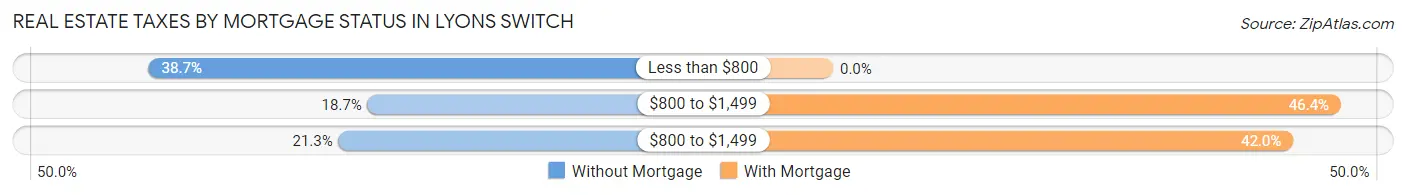
| Property Taxes | Without Mortgage | With Mortgage |
| Less than $800 | 29 (38.7%) | 0 (0.0%) |
| $800 to $1,499 | 14 (18.7%) | 32 (46.4%) |
| $800 to $1,499 | 16 (21.3%) | 29 (42.0%) |
| Total | 75 (100.0%) | 69 (100.0%) |
Health & Disability in Lyons Switch
Health Insurance Coverage by Age in Lyons Switch
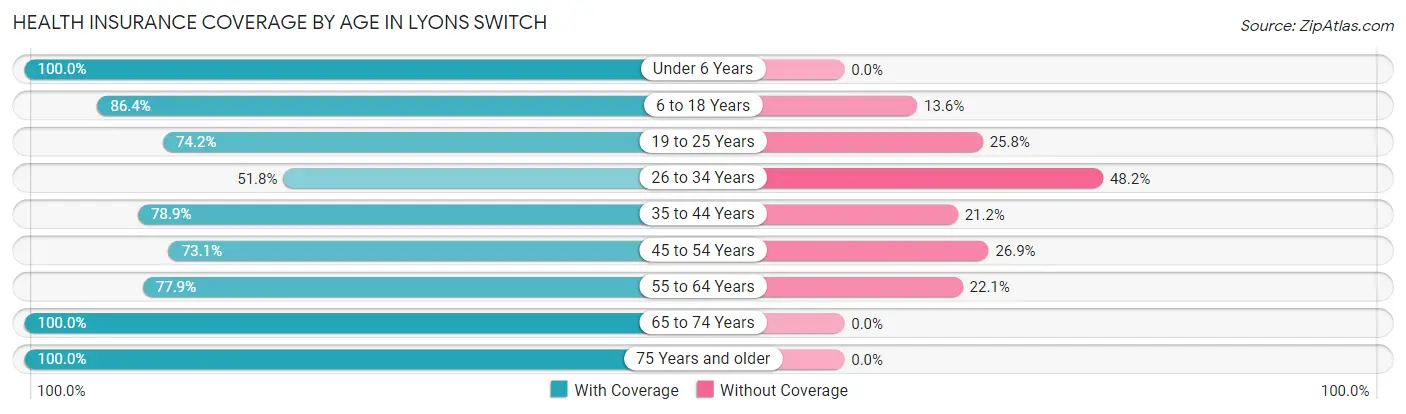
| Age Bracket | With Coverage | Without Coverage |
| Under 6 Years | 39 (100.0%) | 0 (0.0%) |
| 6 to 18 Years | 70 (86.4%) | 11 (13.6%) |
| 19 to 25 Years | 46 (74.2%) | 16 (25.8%) |
| 26 to 34 Years | 44 (51.8%) | 41 (48.2%) |
| 35 to 44 Years | 41 (78.8%) | 11 (21.1%) |
| 45 to 54 Years | 68 (73.1%) | 25 (26.9%) |
| 55 to 64 Years | 53 (77.9%) | 15 (22.1%) |
| 65 to 74 Years | 70 (100.0%) | 0 (0.0%) |
| 75 Years and older | 20 (100.0%) | 0 (0.0%) |
| Total | 451 (79.1%) | 119 (20.9%) |
Health Insurance Coverage by Citizenship Status in Lyons Switch
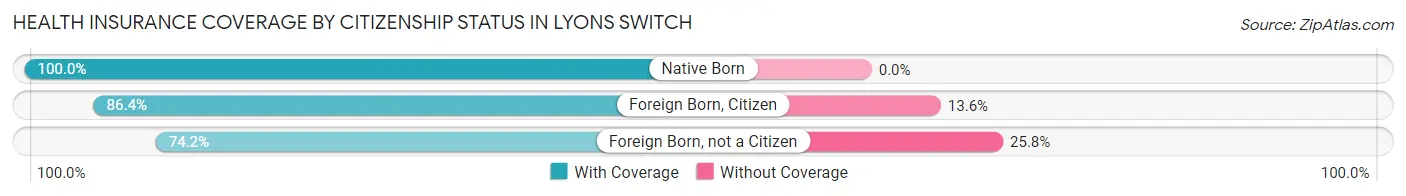
| Citizenship Status | With Coverage | Without Coverage |
| Native Born | 39 (100.0%) | 0 (0.0%) |
| Foreign Born, Citizen | 70 (86.4%) | 11 (13.6%) |
| Foreign Born, not a Citizen | 46 (74.2%) | 16 (25.8%) |
Health Insurance Coverage by Household Income in Lyons Switch
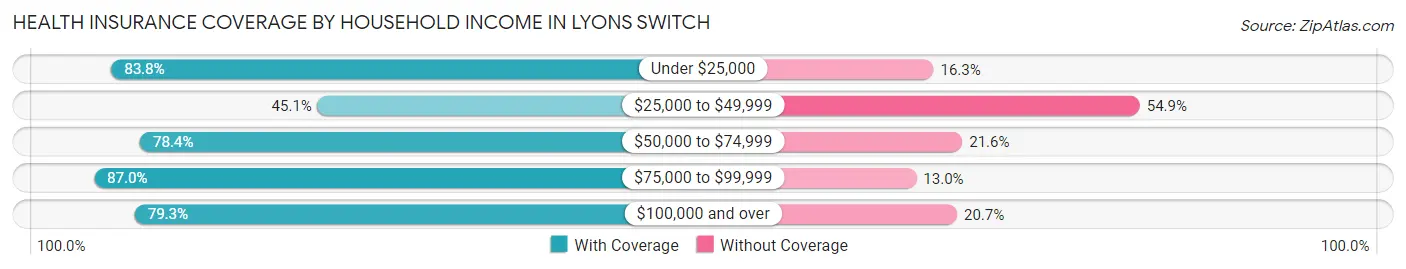
| Household Income | With Coverage | Without Coverage |
| Under $25,000 | 67 (83.8%) | 13 (16.3%) |
| $25,000 to $49,999 | 23 (45.1%) | 28 (54.9%) |
| $50,000 to $74,999 | 105 (78.4%) | 29 (21.6%) |
| $75,000 to $99,999 | 160 (87.0%) | 24 (13.0%) |
| $100,000 and over | 96 (79.3%) | 25 (20.7%) |
Public vs Private Health Insurance Coverage by Age in Lyons Switch
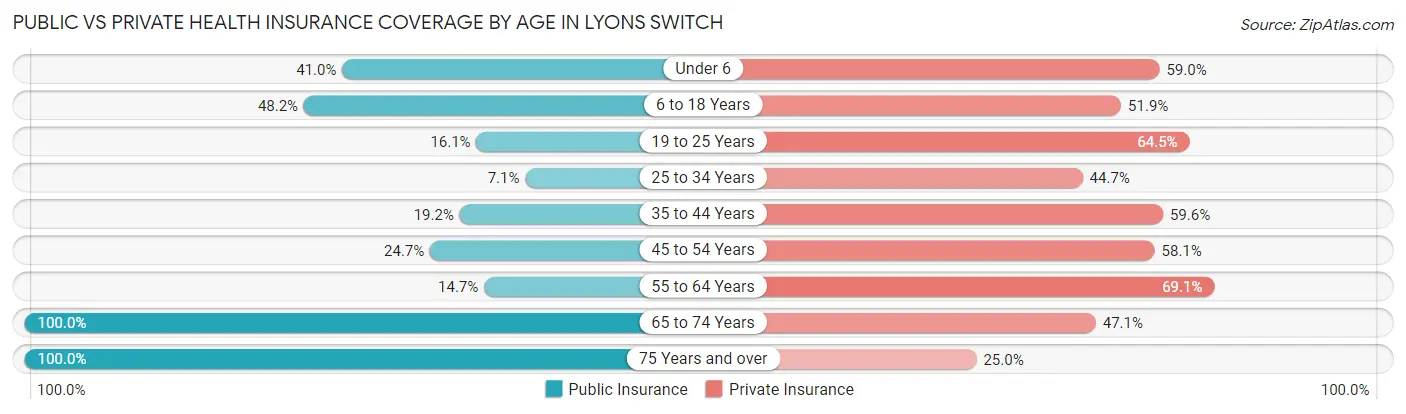
| Age Bracket | Public Insurance | Private Insurance |
| Under 6 | 16 (41.0%) | 23 (59.0%) |
| 6 to 18 Years | 39 (48.1%) | 42 (51.8%) |
| 19 to 25 Years | 10 (16.1%) | 40 (64.5%) |
| 25 to 34 Years | 6 (7.1%) | 38 (44.7%) |
| 35 to 44 Years | 10 (19.2%) | 31 (59.6%) |
| 45 to 54 Years | 23 (24.7%) | 54 (58.1%) |
| 55 to 64 Years | 10 (14.7%) | 47 (69.1%) |
| 65 to 74 Years | 70 (100.0%) | 33 (47.1%) |
| 75 Years and over | 20 (100.0%) | 5 (25.0%) |
| Total | 204 (35.8%) | 313 (54.9%) |
Disability Status by Sex by Age in Lyons Switch
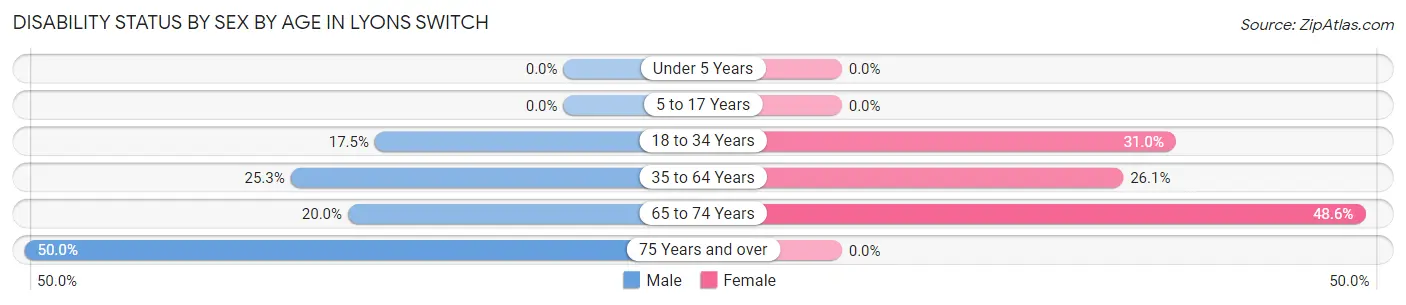
| Age Bracket | Male | Female |
| Under 5 Years | 0 (0.0%) | 0 (0.0%) |
| 5 to 17 Years | 0 (0.0%) | 0 (0.0%) |
| 18 to 34 Years | 14 (17.5%) | 22 (31.0%) |
| 35 to 64 Years | 20 (25.3%) | 35 (26.1%) |
| 65 to 74 Years | 7 (20.0%) | 17 (48.6%) |
| 75 Years and over | 8 (50.0%) | 0 (0.0%) |
Disability Class by Sex by Age in Lyons Switch
Disability Class: Hearing Difficulty
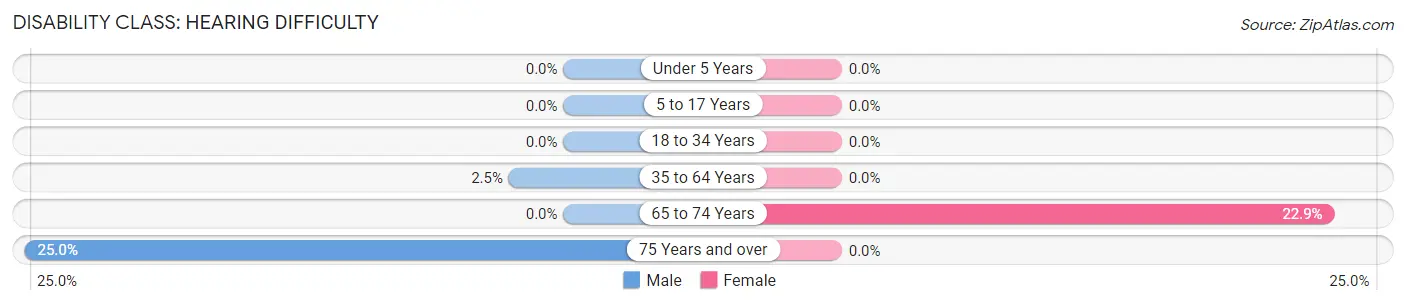
| Age Bracket | Male | Female |
| Under 5 Years | 0 (0.0%) | 0 (0.0%) |
| 5 to 17 Years | 0 (0.0%) | 0 (0.0%) |
| 18 to 34 Years | 0 (0.0%) | 0 (0.0%) |
| 35 to 64 Years | 2 (2.5%) | 0 (0.0%) |
| 65 to 74 Years | 0 (0.0%) | 8 (22.9%) |
| 75 Years and over | 4 (25.0%) | 0 (0.0%) |
Disability Class: Vision Difficulty
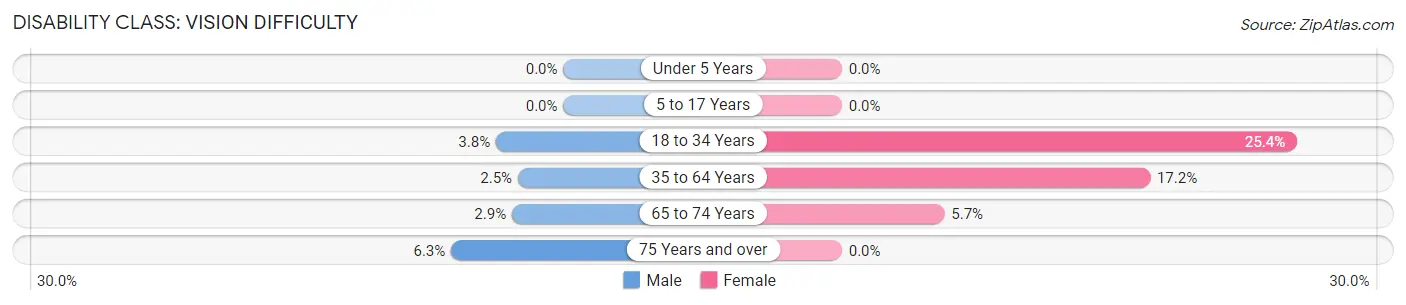
| Age Bracket | Male | Female |
| Under 5 Years | 0 (0.0%) | 0 (0.0%) |
| 5 to 17 Years | 0 (0.0%) | 0 (0.0%) |
| 18 to 34 Years | 3 (3.7%) | 18 (25.4%) |
| 35 to 64 Years | 2 (2.5%) | 23 (17.2%) |
| 65 to 74 Years | 1 (2.9%) | 2 (5.7%) |
| 75 Years and over | 1 (6.2%) | 0 (0.0%) |
Disability Class: Cognitive Difficulty
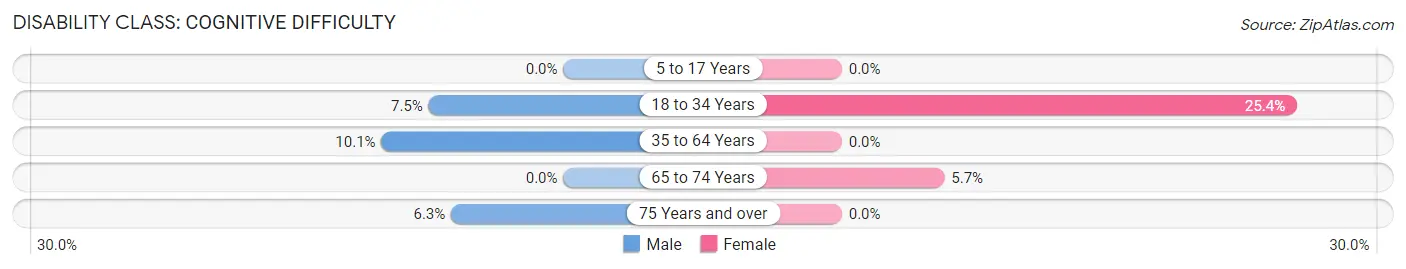
| Age Bracket | Male | Female |
| 5 to 17 Years | 0 (0.0%) | 0 (0.0%) |
| 18 to 34 Years | 6 (7.5%) | 18 (25.4%) |
| 35 to 64 Years | 8 (10.1%) | 0 (0.0%) |
| 65 to 74 Years | 0 (0.0%) | 2 (5.7%) |
| 75 Years and over | 1 (6.2%) | 0 (0.0%) |
Disability Class: Ambulatory Difficulty
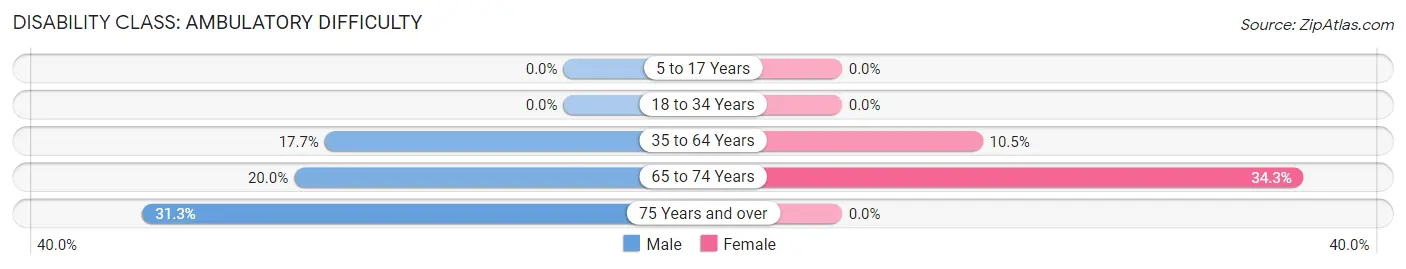
| Age Bracket | Male | Female |
| 5 to 17 Years | 0 (0.0%) | 0 (0.0%) |
| 18 to 34 Years | 0 (0.0%) | 0 (0.0%) |
| 35 to 64 Years | 14 (17.7%) | 14 (10.4%) |
| 65 to 74 Years | 7 (20.0%) | 12 (34.3%) |
| 75 Years and over | 5 (31.2%) | 0 (0.0%) |
Disability Class: Self-Care Difficulty
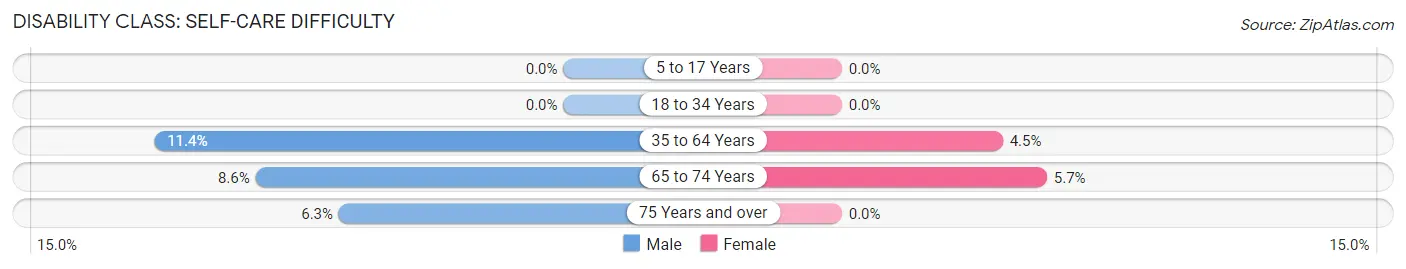
| Age Bracket | Male | Female |
| 5 to 17 Years | 0 (0.0%) | 0 (0.0%) |
| 18 to 34 Years | 0 (0.0%) | 0 (0.0%) |
| 35 to 64 Years | 9 (11.4%) | 6 (4.5%) |
| 65 to 74 Years | 3 (8.6%) | 2 (5.7%) |
| 75 Years and over | 1 (6.2%) | 0 (0.0%) |
Technology Access in Lyons Switch
Computing Device Access in Lyons Switch
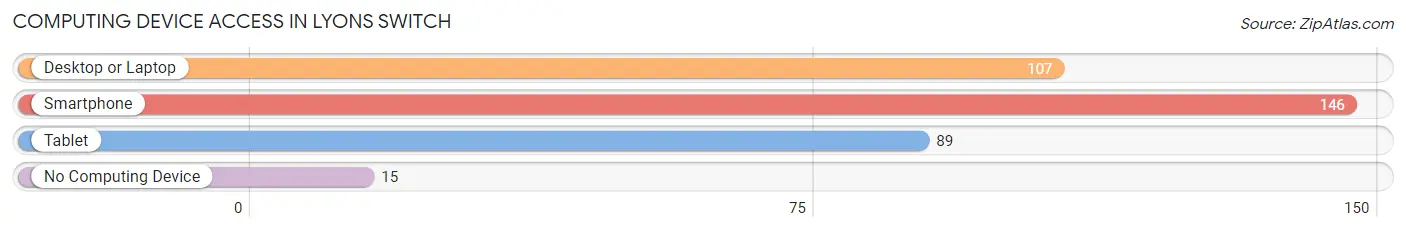
| Device Type | # Households | % Households |
| Desktop or Laptop | 107 | 62.9% |
| Smartphone | 146 | 85.9% |
| Tablet | 89 | 52.3% |
| No Computing Device | 15 | 8.8% |
| Total | 170 | 100.0% |
Internet Access in Lyons Switch
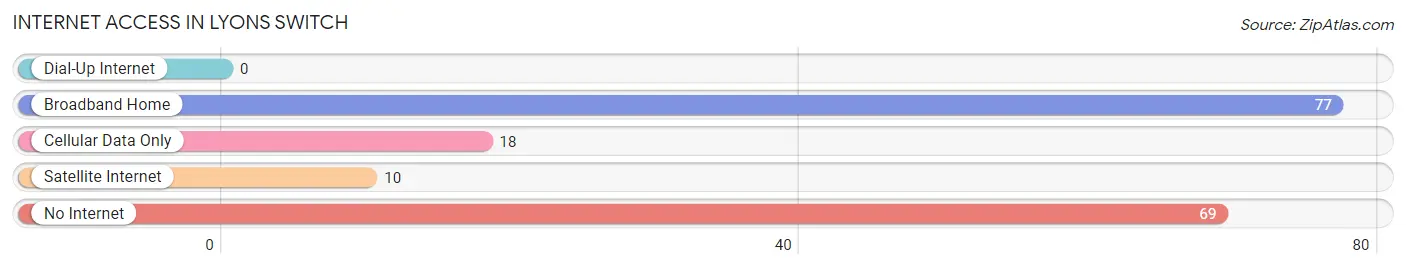
| Internet Type | # Households | % Households |
| Dial-Up Internet | 0 | 0.0% |
| Broadband Home | 77 | 45.3% |
| Cellular Data Only | 18 | 10.6% |
| Satellite Internet | 10 | 5.9% |
| No Internet | 69 | 40.6% |
| Total | 170 | 100.0% |
Lyons Switch Summary
Lyons Switch is a small unincorporated community located in the southeastern corner of Oklahoma, in the county of Pushmataha. It is situated in the foothills of the Ouachita Mountains, and is surrounded by the Kiamichi River and its tributaries. The town is located approximately 20 miles south of Antlers, Oklahoma, and is home to a population of approximately 200 people.
History
The area that is now Lyons Switch was first settled in the late 1800s by a group of settlers from Arkansas. The town was originally known as “Lyons”, after the family that first settled the area. The name was later changed to “Lyons Switch” when the railroad was built through the area in the early 1900s. The railroad was used to transport timber and other goods to and from the area.
The town was officially incorporated in 1910, and the first post office was established in 1911. The town was home to a variety of businesses, including a general store, a blacksmith shop, a sawmill, and a cotton gin. The town also had a school, which was built in 1912.
In the 1920s, the town began to decline as the timber industry began to decline. The railroad was eventually abandoned in the 1940s, and the town’s population began to dwindle. By the 1950s, the town had become a virtual ghost town.
In the late 1970s, the town began to experience a resurgence as people began to move back to the area. The town was officially re-incorporated in 1980, and the population has slowly grown since then.
Geography
Lyons Switch is located in the southeastern corner of Oklahoma, in the county of Pushmataha. It is situated in the foothills of the Ouachita Mountains, and is surrounded by the Kiamichi River and its tributaries. The town is located approximately 20 miles south of Antlers, Oklahoma.
The town is located at an elevation of approximately 1,000 feet above sea level. The climate in the area is generally mild, with temperatures ranging from the low 30s in the winter to the mid-90s in the summer. The area receives an average of 45 inches of precipitation per year.
Economy
The economy of Lyons Switch is largely based on agriculture and forestry. The town is home to several farms, which produce a variety of crops, including corn, soybeans, wheat, and hay. The town is also home to several timber companies, which harvest timber from the surrounding forests.
The town is also home to several small businesses, including a general store, a gas station, and a restaurant. The town is also home to a small manufacturing plant, which produces a variety of products, including furniture and clothing.
Demographics
As of the 2010 census, the population of Lyons Switch was approximately 200 people. The town is predominantly white, with approximately 95% of the population being white. The remaining 5% of the population is made up of African Americans, Native Americans, and other races.
The median household income in the town is approximately $30,000 per year. The median home value is approximately $80,000. The town has a poverty rate of approximately 20%, which is higher than the national average.
The town is served by the Pushmataha County School District, which operates a single elementary school in the town. The town is also home to a small library, which is operated by the Pushmataha County Library System.
Common Questions
What is Per Capita Income in Lyons Switch?
Per Capita income in Lyons Switch is $22,240.
What is the Median Family Income in Lyons Switch?
Median Family Income in Lyons Switch is $68,750.
What is the Median Household income in Lyons Switch?
Median Household Income in Lyons Switch is $64,167.
What is Income or Wage Gap in Lyons Switch?
Income or Wage Gap in Lyons Switch is 13.7%.
Women in Lyons Switch earn 86.3 cents for every dollar earned by a man.
What is Inequality or Gini Index in Lyons Switch?
Inequality or Gini Index in Lyons Switch is 0.32.
What is the Total Population of Lyons Switch?
Total Population of Lyons Switch is 570.
What is the Total Male Population of Lyons Switch?
Total Male Population of Lyons Switch is 256.
What is the Total Female Population of Lyons Switch?
Total Female Population of Lyons Switch is 314.
What is the Ratio of Males per 100 Females in Lyons Switch?
There are 81.53 Males per 100 Females in Lyons Switch.
What is the Ratio of Females per 100 Males in Lyons Switch?
There are 122.66 Females per 100 Males in Lyons Switch.
What is the Median Population Age in Lyons Switch?
Median Population Age in Lyons Switch is 39.5 Years.
What is the Average Family Size in Lyons Switch
Average Family Size in Lyons Switch is 3.7 People.
What is the Average Household Size in Lyons Switch
Average Household Size in Lyons Switch is 3.4 People.
How Large is the Labor Force in Lyons Switch?
There are 273 People in the Labor Forcein in Lyons Switch.
What is the Percentage of People in the Labor Force in Lyons Switch?
58.5% of People are in the Labor Force in Lyons Switch.
What is the Unemployment Rate in Lyons Switch?
Unemployment Rate in Lyons Switch is 11.0%.