Okeene, OK Map & Demographics
Okeene Map
Okeene Overview
$22,237
PER CAPITA INCOME
$50,938
AVG FAMILY INCOME
$53,021
AVG HOUSEHOLD INCOME
33.5%
WAGE / INCOME GAP [ % ]
66.5¢/ $1
WAGE / INCOME GAP [ $ ]
0.39
INEQUALITY / GINI INDEX
1,044
TOTAL POPULATION
447
MALE POPULATION
597
FEMALE POPULATION
74.87
MALES / 100 FEMALES
133.56
FEMALES / 100 MALES
29.7
MEDIAN AGE
3.3
AVG FAMILY SIZE
2.5
AVG HOUSEHOLD SIZE
462
LABOR FORCE [ PEOPLE ]
65.6%
PERCENT IN LABOR FORCE
9.7%
UNEMPLOYMENT RATE
Okeene Zip Codes
Okeene Area Codes
Income in Okeene
Income Overview in Okeene
Per Capita Income in Okeene is $22,237, while median incomes of families and households are $50,938 and $53,021 respectively.
| Characteristic | Number | Measure |
| Per Capita Income | 1,044 | $22,237 |
| Median Family Income | 251 | $50,938 |
| Mean Family Income | 251 | $58,163 |
| Median Household Income | 393 | $53,021 |
| Mean Household Income | 393 | $57,782 |
| Income Deficit | 251 | $0 |
| Wage / Income Gap (%) | 1,044 | 33.46% |
| Wage / Income Gap ($) | 1,044 | 66.54¢ per $1 |
| Gini / Inequality Index | 1,044 | 0.39 |
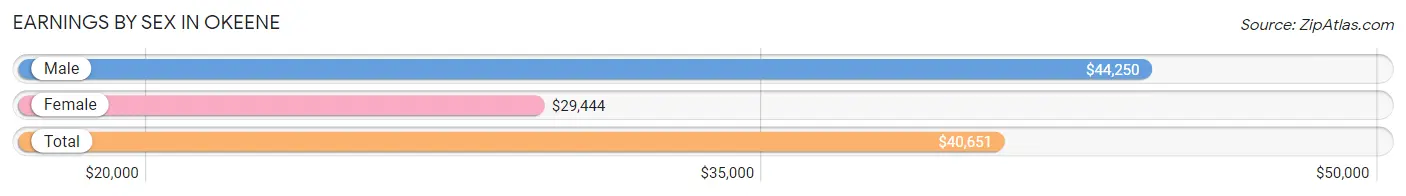
Earnings by Sex in Okeene
Average Earnings in Okeene are $40,651, $44,250 for men and $29,444 for women, a difference of 33.5%.
| Sex | Number | Average Earnings |
| Male | 201 (45.0%) | $44,250 |
| Female | 246 (55.0%) | $29,444 |
| Total | 447 (100.0%) | $40,651 |
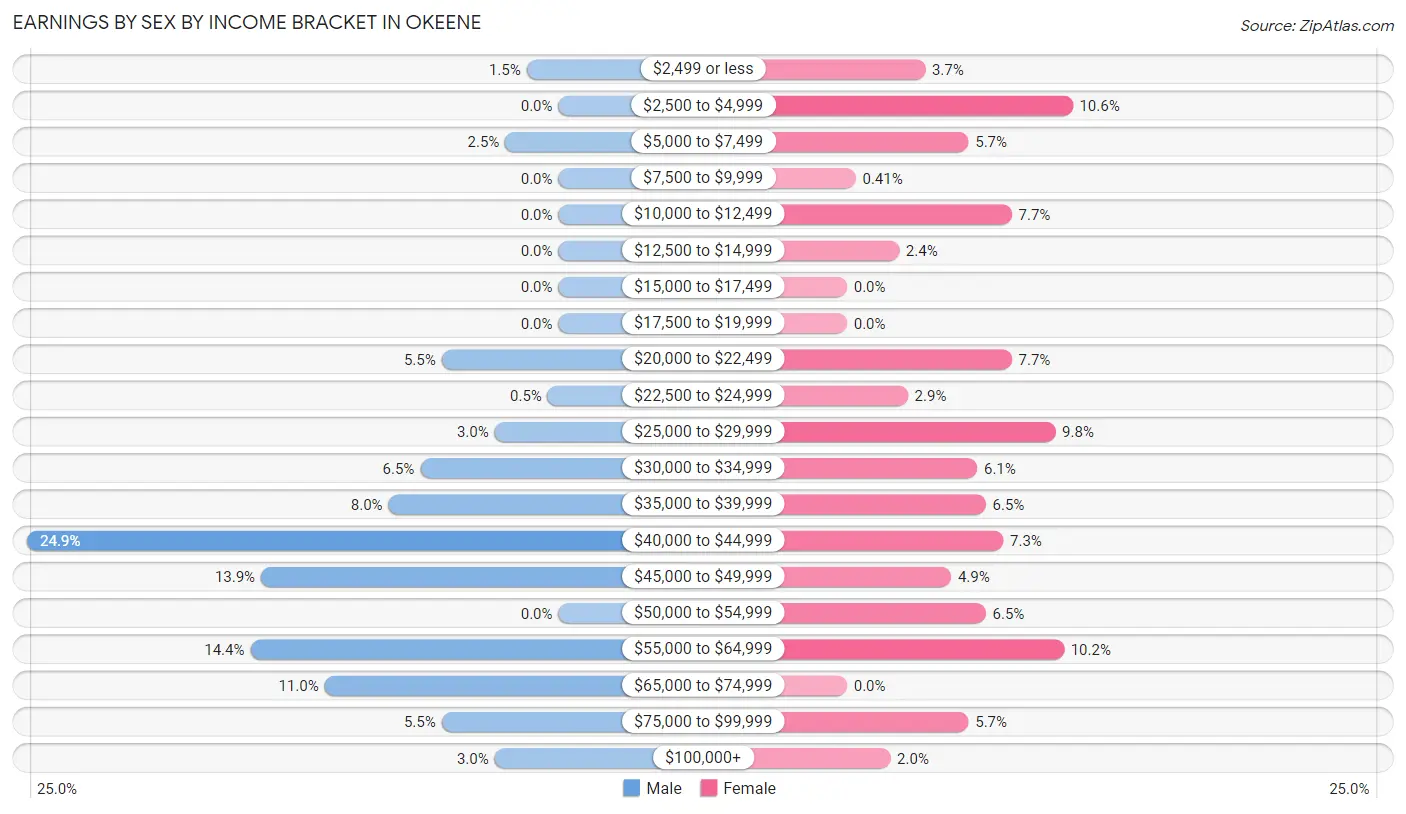
Earnings by Sex by Income Bracket in Okeene
The most common earnings brackets in Okeene are $40,000 to $44,999 for men (50 | 24.9%) and $2,500 to $4,999 for women (26 | 10.6%).
| Income | Male | Female |
| $2,499 or less | 3 (1.5%) | 9 (3.7%) |
| $2,500 to $4,999 | 0 (0.0%) | 26 (10.6%) |
| $5,000 to $7,499 | 5 (2.5%) | 14 (5.7%) |
| $7,500 to $9,999 | 0 (0.0%) | 1 (0.4%) |
| $10,000 to $12,499 | 0 (0.0%) | 19 (7.7%) |
| $12,500 to $14,999 | 0 (0.0%) | 6 (2.4%) |
| $15,000 to $17,499 | 0 (0.0%) | 0 (0.0%) |
| $17,500 to $19,999 | 0 (0.0%) | 0 (0.0%) |
| $20,000 to $22,499 | 11 (5.5%) | 19 (7.7%) |
| $22,500 to $24,999 | 1 (0.5%) | 7 (2.9%) |
| $25,000 to $29,999 | 6 (3.0%) | 24 (9.8%) |
| $30,000 to $34,999 | 13 (6.5%) | 15 (6.1%) |
| $35,000 to $39,999 | 16 (8.0%) | 16 (6.5%) |
| $40,000 to $44,999 | 50 (24.9%) | 18 (7.3%) |
| $45,000 to $49,999 | 28 (13.9%) | 12 (4.9%) |
| $50,000 to $54,999 | 0 (0.0%) | 16 (6.5%) |
| $55,000 to $64,999 | 29 (14.4%) | 25 (10.2%) |
| $65,000 to $74,999 | 22 (11.0%) | 0 (0.0%) |
| $75,000 to $99,999 | 11 (5.5%) | 14 (5.7%) |
| $100,000+ | 6 (3.0%) | 5 (2.0%) |
| Total | 201 (100.0%) | 246 (100.0%) |
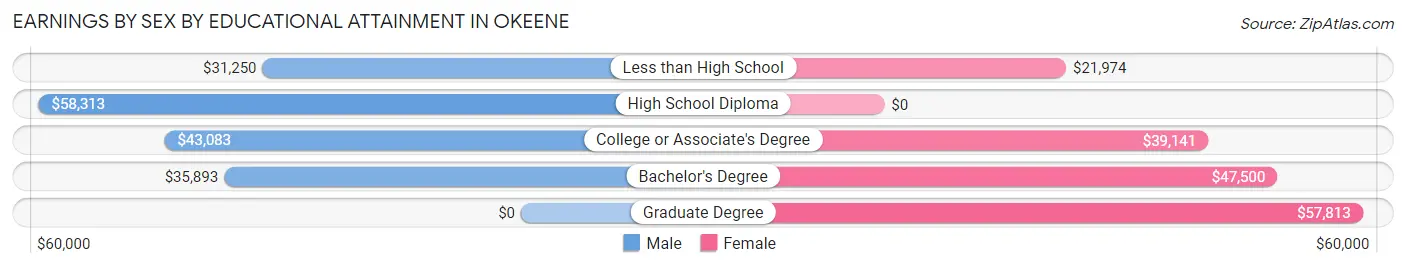
Earnings by Sex by Educational Attainment in Okeene
Average earnings in Okeene are $44,500 for men and $34,306 for women, a difference of 22.9%. Men with an educational attainment of high school diploma enjoy the highest average annual earnings of $58,313, while those with less than high school education earn the least with $31,250. Women with an educational attainment of graduate degree earn the most with the average annual earnings of $57,813, while those with less than high school education have the smallest earnings of $21,974.
| Educational Attainment | Male Income | Female Income |
| Less than High School | $31,250 | $21,974 |
| High School Diploma | $58,313 | $0 |
| College or Associate's Degree | $43,083 | $39,141 |
| Bachelor's Degree | $35,893 | $47,500 |
| Graduate Degree | - | - |
| Total | $44,500 | $34,306 |
Family Income in Okeene
Family Income Brackets in Okeene
According to the Okeene family income data, there are 50 families falling into the $50,000 to $74,999 income range, which is the most common income bracket and makes up 19.9% of all families. Conversely, the $200,000+ income bracket is the least frequent group with only 2 families (0.8%) belonging to this category.
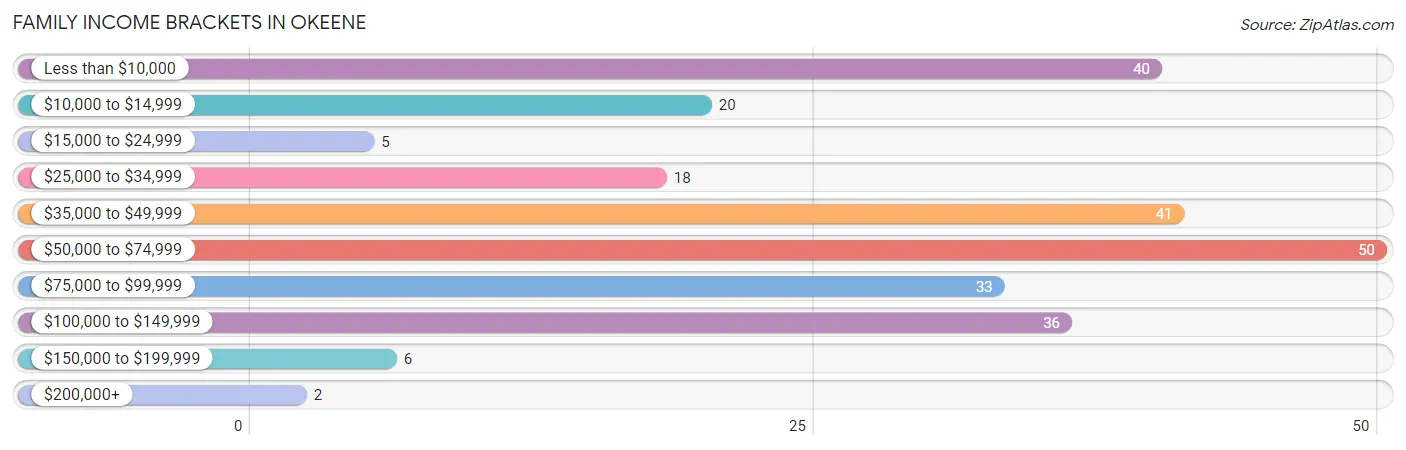
| Income Bracket | # Families | % Families |
| Less than $10,000 | 40 | 15.9% |
| $10,000 to $14,999 | 20 | 8.0% |
| $15,000 to $24,999 | 5 | 2.0% |
| $25,000 to $34,999 | 18 | 7.2% |
| $35,000 to $49,999 | 41 | 16.3% |
| $50,000 to $74,999 | 50 | 19.9% |
| $75,000 to $99,999 | 33 | 13.1% |
| $100,000 to $149,999 | 36 | 14.3% |
| $150,000 to $199,999 | 6 | 2.4% |
| $200,000+ | 2 | 0.8% |
Family Income by Famaliy Size in Okeene
4-person families (29 | 11.6%) account for the highest median family income in Okeene with $54,821 per family, while 2-person families (146 | 58.2%) have the highest median income of $27,000 per family member.
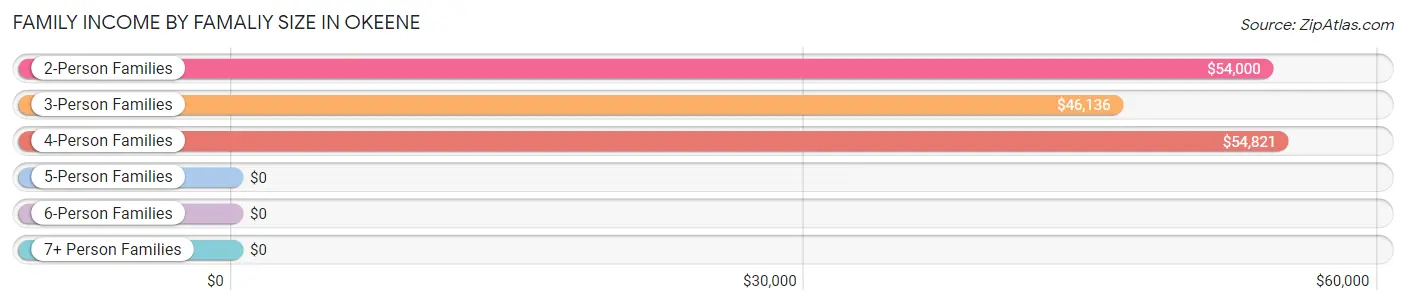
| Income Bracket | # Families | Median Income |
| 2-Person Families | 146 (58.2%) | $54,000 |
| 3-Person Families | 68 (27.1%) | $46,136 |
| 4-Person Families | 29 (11.6%) | $54,821 |
| 5-Person Families | 8 (3.2%) | $0 |
| 6-Person Families | 0 (0.0%) | $0 |
| 7+ Person Families | 0 (0.0%) | $0 |
| Total | 251 (100.0%) | $50,938 |
Family Income by Number of Earners in Okeene
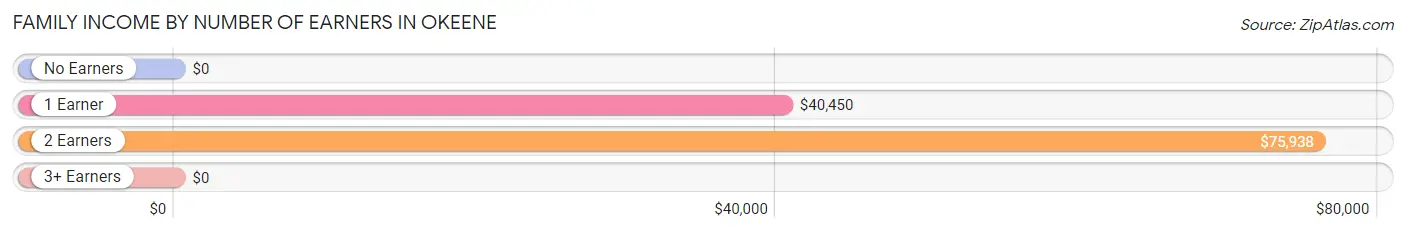
| Number of Earners | # Families | Median Income |
| No Earners | 60 (23.9%) | $0 |
| 1 Earner | 87 (34.7%) | $40,450 |
| 2 Earners | 97 (38.7%) | $75,938 |
| 3+ Earners | 7 (2.8%) | $0 |
| Total | 251 (100.0%) | $50,938 |
Household Income in Okeene
Household Income Brackets in Okeene
With 104 households falling in the category, the $50,000 to $74,999 income range is the most frequent in Okeene, accounting for 26.5% of all households. In contrast, only 2 households (0.5%) fall into the $200,000+ income bracket, making it the least populous group.
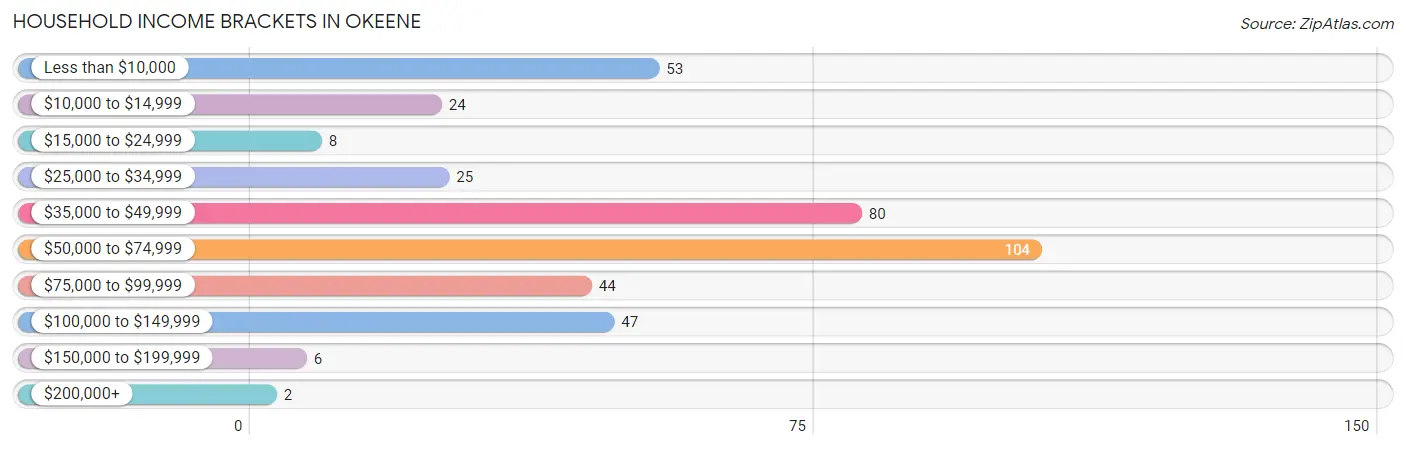
| Income Bracket | # Households | % Households |
| Less than $10,000 | 53 | 13.5% |
| $10,000 to $14,999 | 24 | 6.1% |
| $15,000 to $24,999 | 8 | 2.0% |
| $25,000 to $34,999 | 25 | 6.4% |
| $35,000 to $49,999 | 80 | 20.4% |
| $50,000 to $74,999 | 104 | 26.5% |
| $75,000 to $99,999 | 44 | 11.2% |
| $100,000 to $149,999 | 47 | 12.0% |
| $150,000 to $199,999 | 6 | 1.5% |
| $200,000+ | 2 | 0.5% |
Household Income by Householder Age in Okeene
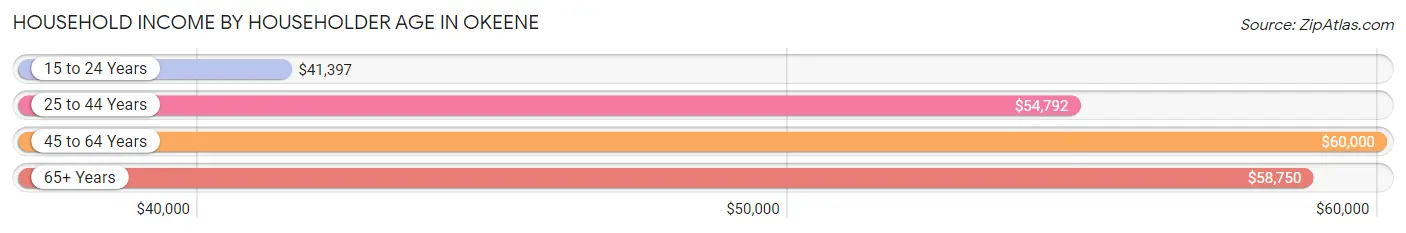
The median household income in Okeene is $53,021, with the highest median household income of $60,000 found in the 45 to 64 years age bracket for the primary householder. A total of 138 households (35.1%) fall into this category. Meanwhile, the 15 to 24 years age bracket for the primary householder has the lowest median household income of $41,397, with 53 households (13.5%) in this group.
| Income Bracket | # Households | Median Income |
| 15 to 24 Years | 53 (13.5%) | $41,397 |
| 25 to 44 Years | 116 (29.5%) | $54,792 |
| 45 to 64 Years | 138 (35.1%) | $60,000 |
| 65+ Years | 86 (21.9%) | $58,750 |
| Total | 393 (100.0%) | $53,021 |
Poverty in Okeene
Income Below Poverty by Sex and Age in Okeene
With 33.9% poverty level for males and 34.6% for females among the residents of Okeene, 16 and 17 year old males and 18 to 24 year old females are the most vulnerable to poverty, with 13 males (100.0%) and 51 females (96.2%) in their respective age groups living below the poverty level.
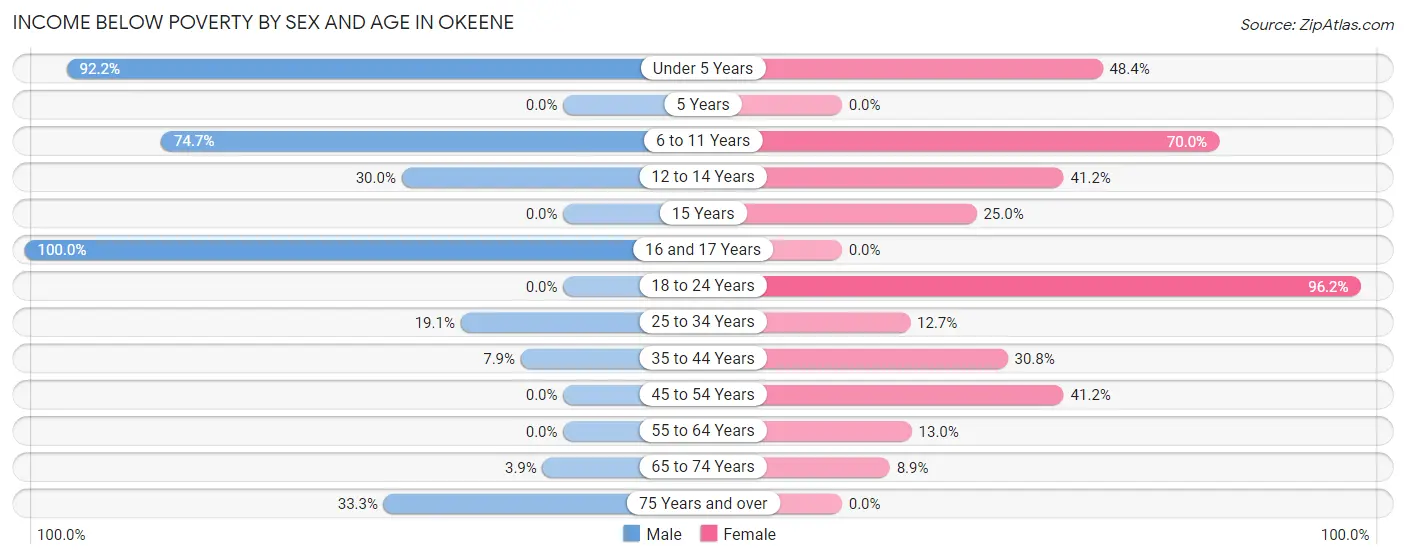
| Age Bracket | Male | Female |
| Under 5 Years | 59 (92.2%) | 30 (48.4%) |
| 5 Years | 0 (0.0%) | 0 (0.0%) |
| 6 to 11 Years | 56 (74.7%) | 35 (70.0%) |
| 12 to 14 Years | 6 (30.0%) | 14 (41.2%) |
| 15 Years | 0 (0.0%) | 3 (25.0%) |
| 16 and 17 Years | 13 (100.0%) | 0 (0.0%) |
| 18 to 24 Years | 0 (0.0%) | 51 (96.2%) |
| 25 to 34 Years | 4 (19.1%) | 9 (12.7%) |
| 35 to 44 Years | 3 (7.9%) | 12 (30.8%) |
| 45 to 54 Years | 0 (0.0%) | 28 (41.2%) |
| 55 to 64 Years | 0 (0.0%) | 7 (13.0%) |
| 65 to 74 Years | 1 (3.8%) | 4 (8.9%) |
| 75 Years and over | 6 (33.3%) | 0 (0.0%) |
| Total | 148 (33.9%) | 193 (34.6%) |
Income Above Poverty by Sex and Age in Okeene
According to the poverty statistics in Okeene, males aged 5 years and females aged 16 and 17 years are the age groups that are most secure financially, with 100.0% of males and 100.0% of females in these age groups living above the poverty line.
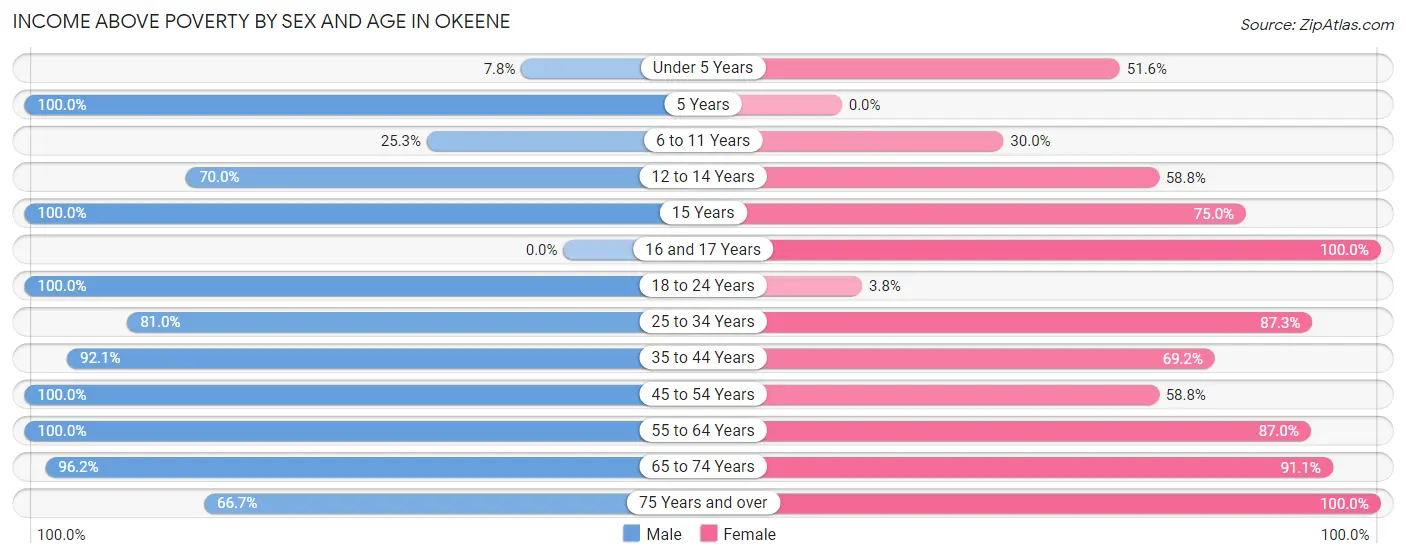
| Age Bracket | Male | Female |
| Under 5 Years | 5 (7.8%) | 32 (51.6%) |
| 5 Years | 2 (100.0%) | 0 (0.0%) |
| 6 to 11 Years | 19 (25.3%) | 15 (30.0%) |
| 12 to 14 Years | 14 (70.0%) | 20 (58.8%) |
| 15 Years | 16 (100.0%) | 9 (75.0%) |
| 16 and 17 Years | 0 (0.0%) | 44 (100.0%) |
| 18 to 24 Years | 43 (100.0%) | 2 (3.8%) |
| 25 to 34 Years | 17 (80.9%) | 62 (87.3%) |
| 35 to 44 Years | 35 (92.1%) | 27 (69.2%) |
| 45 to 54 Years | 57 (100.0%) | 40 (58.8%) |
| 55 to 64 Years | 44 (100.0%) | 47 (87.0%) |
| 65 to 74 Years | 25 (96.2%) | 41 (91.1%) |
| 75 Years and over | 12 (66.7%) | 26 (100.0%) |
| Total | 289 (66.1%) | 365 (65.4%) |
Income Below Poverty Among Married-Couple Families in Okeene
The poverty statistics for married-couple families in Okeene show that 1.5% or 2 of the total 135 families live below the poverty line. Families with 3 or 4 children have the highest poverty rate of 33.3%, comprising of 2 families. On the other hand, families with no children have the lowest poverty rate of 0.0%, which includes 0 families.
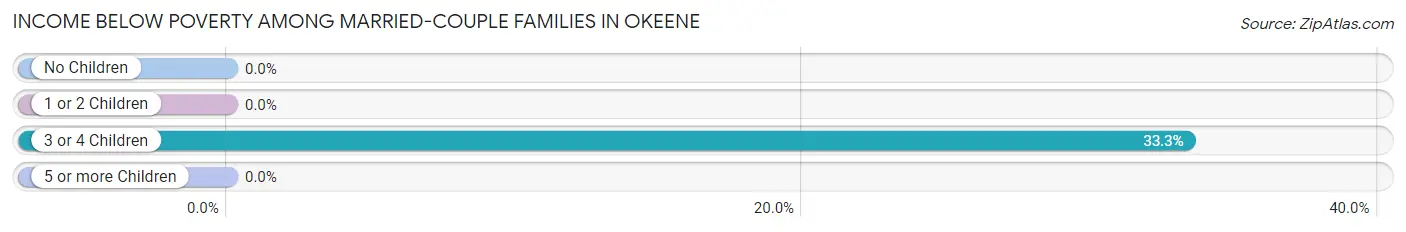
| Children | Above Poverty | Below Poverty |
| No Children | 85 (100.0%) | 0 (0.0%) |
| 1 or 2 Children | 44 (100.0%) | 0 (0.0%) |
| 3 or 4 Children | 4 (66.7%) | 2 (33.3%) |
| 5 or more Children | 0 (0.0%) | 0 (0.0%) |
| Total | 133 (98.5%) | 2 (1.5%) |
Income Below Poverty Among Single-Parent Households in Okeene
According to the poverty data in Okeene, 12.5% or 3 single-father households and 68.5% or 63 single-mother households are living below the poverty line. Among single-father households, those with 1 or 2 children have the highest poverty rate, with 3 households (12.5%) experiencing poverty. Likewise, among single-mother households, those with 3 or 4 children have the highest poverty rate, with 2 households (100.0%) falling below the poverty line.
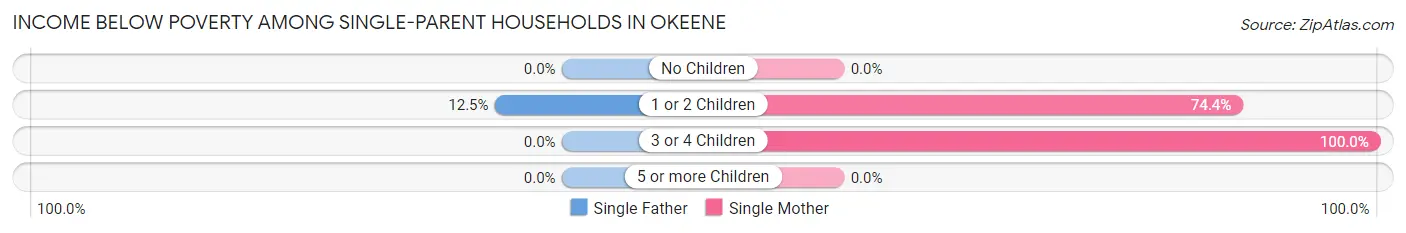
| Children | Single Father | Single Mother |
| No Children | 0 (0.0%) | 0 (0.0%) |
| 1 or 2 Children | 3 (12.5%) | 61 (74.4%) |
| 3 or 4 Children | 0 (0.0%) | 2 (100.0%) |
| 5 or more Children | 0 (0.0%) | 0 (0.0%) |
| Total | 3 (12.5%) | 63 (68.5%) |
Income Below Poverty Among Married-Couple vs Single-Parent Households in Okeene
The poverty data for Okeene shows that 2 of the married-couple family households (1.5%) and 66 of the single-parent households (56.9%) are living below the poverty level. Within the married-couple family households, those with 3 or 4 children have the highest poverty rate, with 2 households (33.3%) falling below the poverty line. Among the single-parent households, those with 3 or 4 children have the highest poverty rate, with 2 household (100.0%) living below poverty.
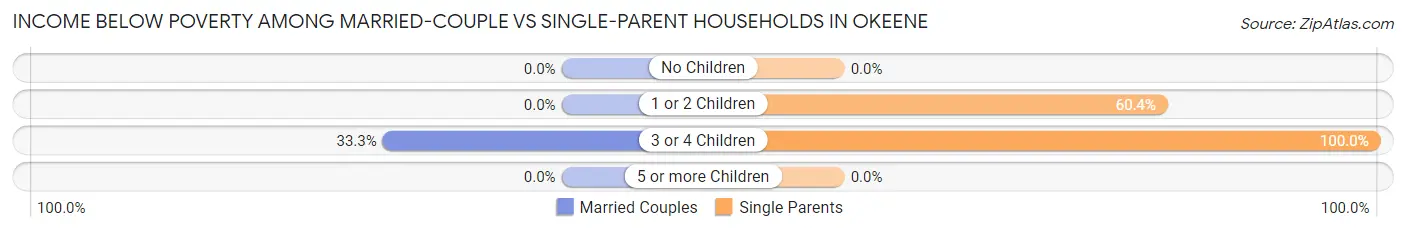
| Children | Married-Couple Families | Single-Parent Households |
| No Children | 0 (0.0%) | 0 (0.0%) |
| 1 or 2 Children | 0 (0.0%) | 64 (60.4%) |
| 3 or 4 Children | 2 (33.3%) | 2 (100.0%) |
| 5 or more Children | 0 (0.0%) | 0 (0.0%) |
| Total | 2 (1.5%) | 66 (56.9%) |
Race in Okeene
The most populous races in Okeene are White / Caucasian (906 | 86.8%), Hispanic or Latino (152 | 14.6%), and Two or more Races (99 | 9.5%).
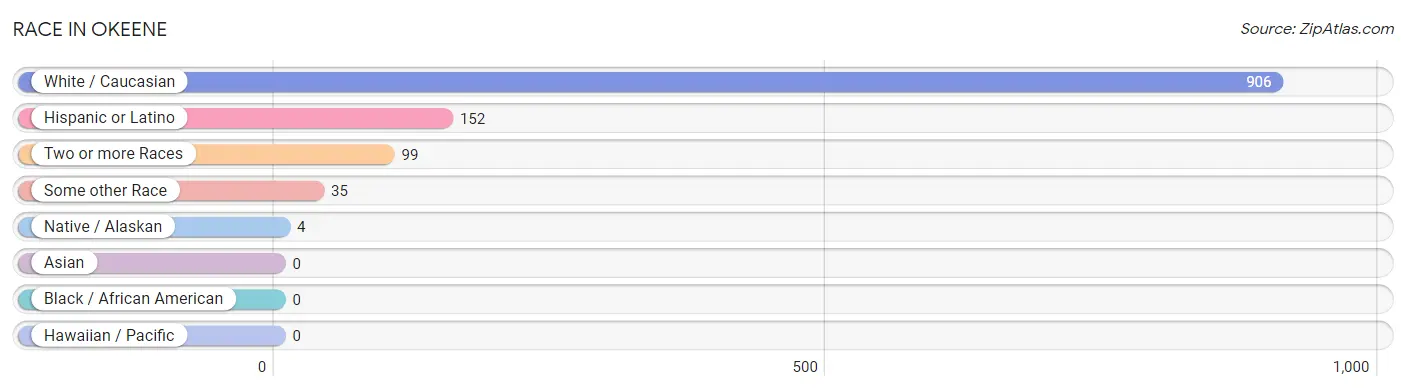
| Race | # Population | % Population |
| Asian | 0 | 0.0% |
| Black / African American | 0 | 0.0% |
| Hawaiian / Pacific | 0 | 0.0% |
| Hispanic or Latino | 152 | 14.6% |
| Native / Alaskan | 4 | 0.4% |
| White / Caucasian | 906 | 86.8% |
| Two or more Races | 99 | 9.5% |
| Some other Race | 35 | 3.4% |
| Total | 1,044 | 100.0% |
Ancestry in Okeene
The most populous ancestries reported in Okeene are German (341 | 32.7%), Mexican (149 | 14.3%), Scottish (98 | 9.4%), English (92 | 8.8%), and American (78 | 7.5%), together accounting for 72.6% of all Okeene residents.
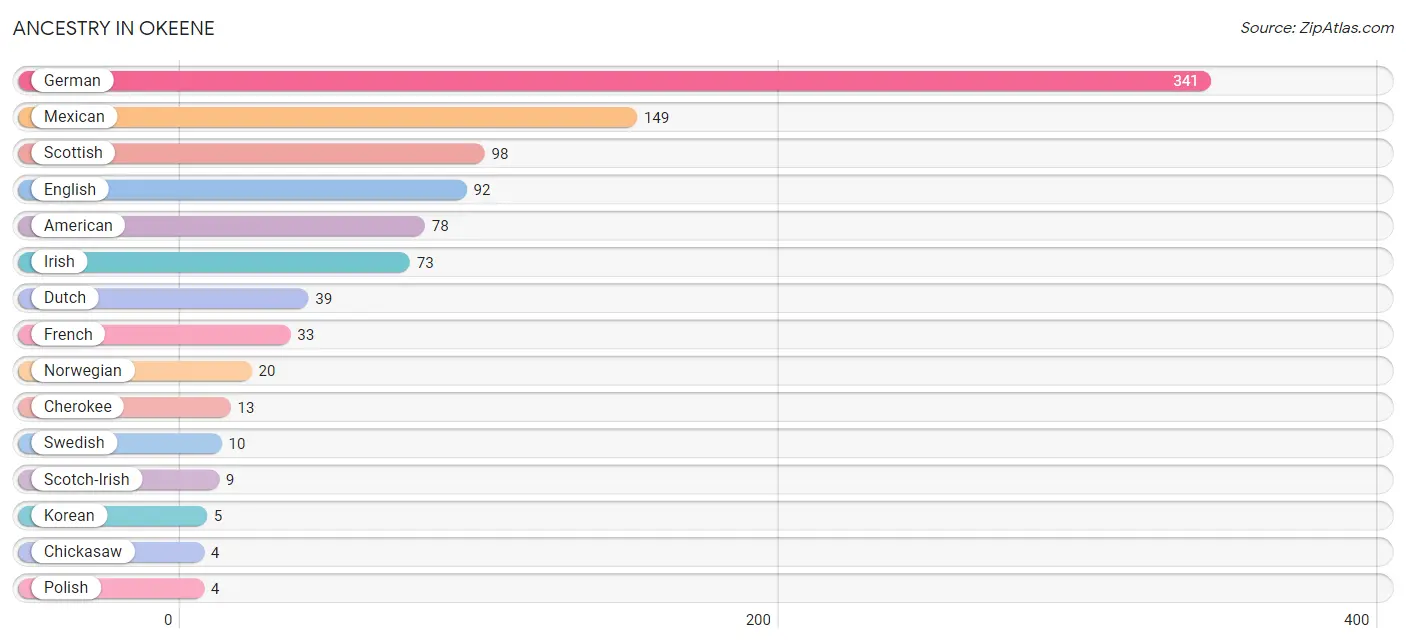
| Ancestry | # Population | % Population |
| American | 78 | 7.5% |
| Cherokee | 13 | 1.3% |
| Chickasaw | 4 | 0.4% |
| Choctaw | 3 | 0.3% |
| Czech | 3 | 0.3% |
| Dutch | 39 | 3.7% |
| English | 92 | 8.8% |
| French | 33 | 3.2% |
| German | 341 | 32.7% |
| Irish | 73 | 7.0% |
| Korean | 5 | 0.5% |
| Mexican | 149 | 14.3% |
| Norwegian | 20 | 1.9% |
| Polish | 4 | 0.4% |
| Scotch-Irish | 9 | 0.9% |
| Scottish | 98 | 9.4% |
| Swedish | 10 | 1.0% |
| Welsh | 2 | 0.2% | View All 18 Rows |
Immigrants in Okeene
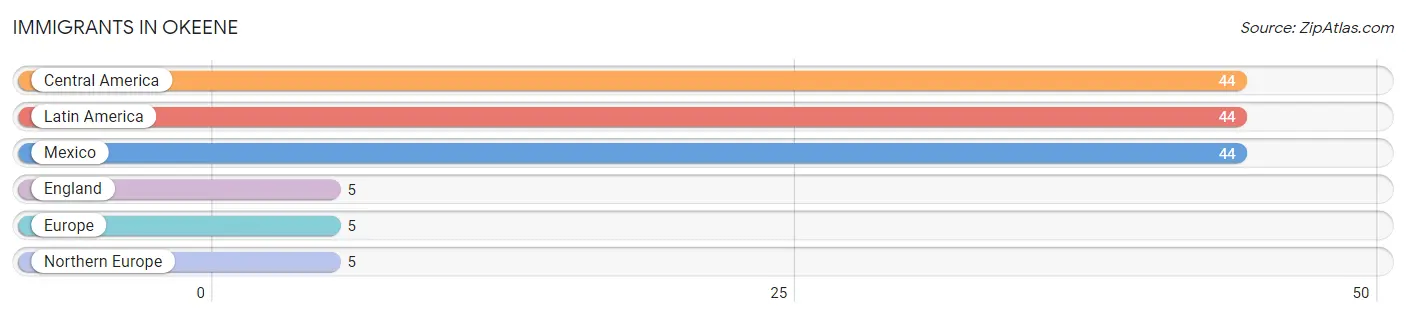
The most numerous immigrant groups reported in Okeene came from Central America (44 | 4.2%), Latin America (44 | 4.2%), Mexico (44 | 4.2%), England (5 | 0.5%), and Europe (5 | 0.5%), together accounting for 13.6% of all Okeene residents.
| Immigration Origin | # Population | % Population |
| Central America | 44 | 4.2% |
| England | 5 | 0.5% |
| Europe | 5 | 0.5% |
| Latin America | 44 | 4.2% |
| Mexico | 44 | 4.2% |
| Northern Europe | 5 | 0.5% | View All 6 Rows |
Sex and Age in Okeene
Sex and Age in Okeene
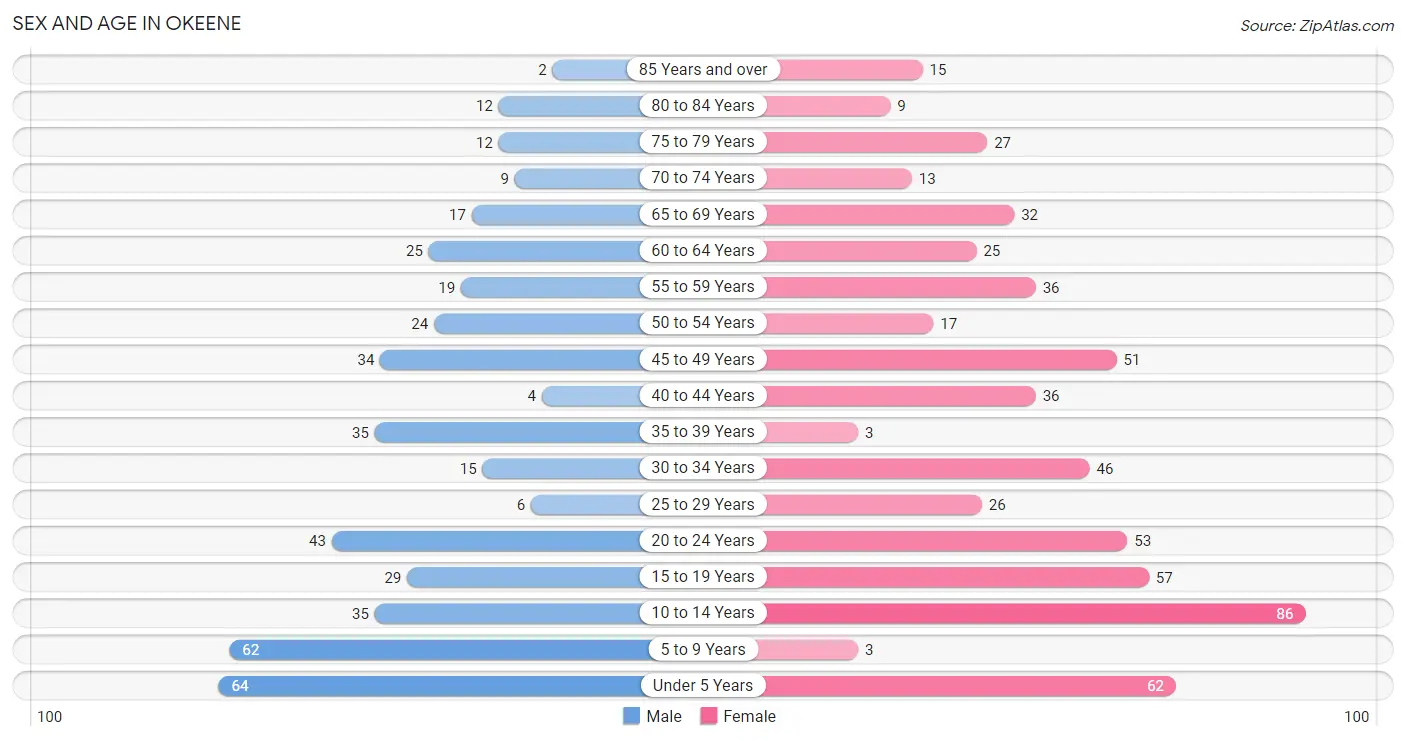
The most populous age groups in Okeene are Under 5 Years (64 | 14.3%) for men and 10 to 14 Years (86 | 14.4%) for women.
| Age Bracket | Male | Female |
| Under 5 Years | 64 (14.3%) | 62 (10.4%) |
| 5 to 9 Years | 62 (13.9%) | 3 (0.5%) |
| 10 to 14 Years | 35 (7.8%) | 86 (14.4%) |
| 15 to 19 Years | 29 (6.5%) | 57 (9.6%) |
| 20 to 24 Years | 43 (9.6%) | 53 (8.9%) |
| 25 to 29 Years | 6 (1.3%) | 26 (4.4%) |
| 30 to 34 Years | 15 (3.4%) | 46 (7.7%) |
| 35 to 39 Years | 35 (7.8%) | 3 (0.5%) |
| 40 to 44 Years | 4 (0.9%) | 36 (6.0%) |
| 45 to 49 Years | 34 (7.6%) | 51 (8.5%) |
| 50 to 54 Years | 24 (5.4%) | 17 (2.9%) |
| 55 to 59 Years | 19 (4.3%) | 36 (6.0%) |
| 60 to 64 Years | 25 (5.6%) | 25 (4.2%) |
| 65 to 69 Years | 17 (3.8%) | 32 (5.4%) |
| 70 to 74 Years | 9 (2.0%) | 13 (2.2%) |
| 75 to 79 Years | 12 (2.7%) | 27 (4.5%) |
| 80 to 84 Years | 12 (2.7%) | 9 (1.5%) |
| 85 Years and over | 2 (0.4%) | 15 (2.5%) |
| Total | 447 (100.0%) | 597 (100.0%) |
Families and Households in Okeene
Median Family Size in Okeene
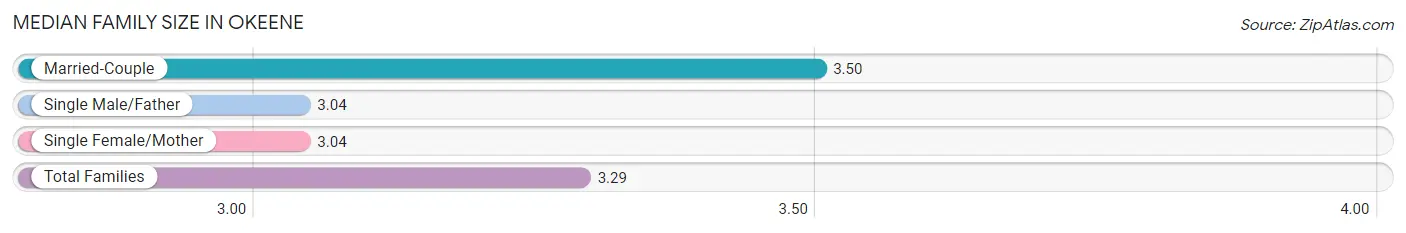
The median family size in Okeene is 3.29 persons per family, with married-couple families (135 | 53.8%) accounting for the largest median family size of 3.5 persons per family. On the other hand, single male/father families (24 | 9.6%) represent the smallest median family size with 3.04 persons per family.
| Family Type | # Families | Family Size |
| Married-Couple | 135 (53.8%) | 3.50 |
| Single Male/Father | 24 (9.6%) | 3.04 |
| Single Female/Mother | 92 (36.6%) | 3.04 |
| Total Families | 251 (100.0%) | 3.29 |
Median Household Size in Okeene
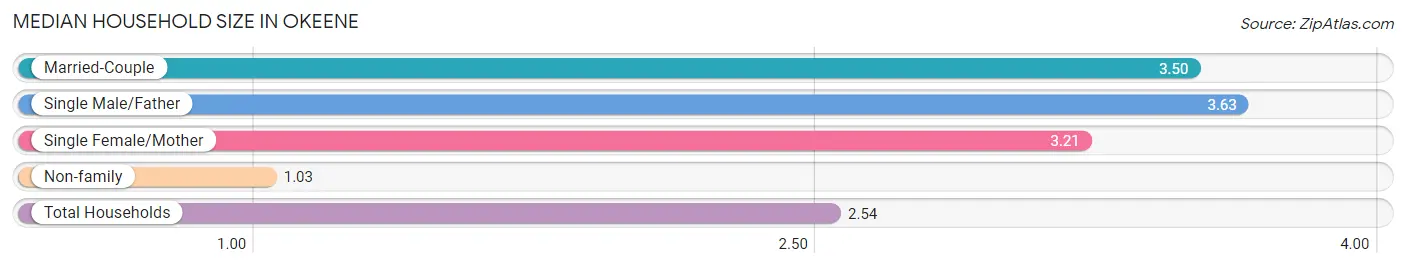
The median household size in Okeene is 2.54 persons per household, with single male/father households (24 | 6.1%) accounting for the largest median household size of 3.63 persons per household. non-family households (142 | 36.1%) represent the smallest median household size with 1.03 persons per household.
| Household Type | # Households | Household Size |
| Married-Couple | 135 (34.4%) | 3.50 |
| Single Male/Father | 24 (6.1%) | 3.63 |
| Single Female/Mother | 92 (23.4%) | 3.21 |
| Non-family | 142 (36.1%) | 1.03 |
| Total Households | 393 (100.0%) | 2.54 |
Household Size by Marriage Status in Okeene
Out of a total of 393 households in Okeene, 251 (63.9%) are family households, while 142 (36.1%) are nonfamily households. The most numerous type of family households are 2-person households, comprising 134, and the most common type of nonfamily households are 1-person households, comprising 136.
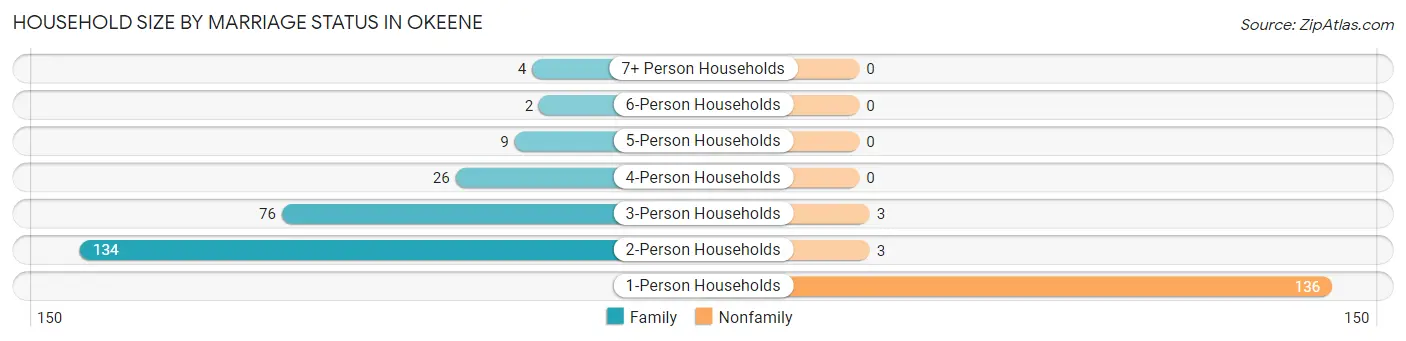
| Household Size | Family Households | Nonfamily Households |
| 1-Person Households | - | 136 (34.6%) |
| 2-Person Households | 134 (34.1%) | 3 (0.8%) |
| 3-Person Households | 76 (19.3%) | 3 (0.8%) |
| 4-Person Households | 26 (6.6%) | 0 (0.0%) |
| 5-Person Households | 9 (2.3%) | 0 (0.0%) |
| 6-Person Households | 2 (0.5%) | 0 (0.0%) |
| 7+ Person Households | 4 (1.0%) | 0 (0.0%) |
| Total | 251 (63.9%) | 142 (36.1%) |
Female Fertility in Okeene
Fertility by Age in Okeene
Average fertility rate in Okeene is 156.0 births per 1,000 women. Women in the age bracket of 20 to 34 years have the highest fertility rate with 344.0 births per 1,000 women. Women in the age bracket of 20 to 34 years acount for 100.0% of all women with births.
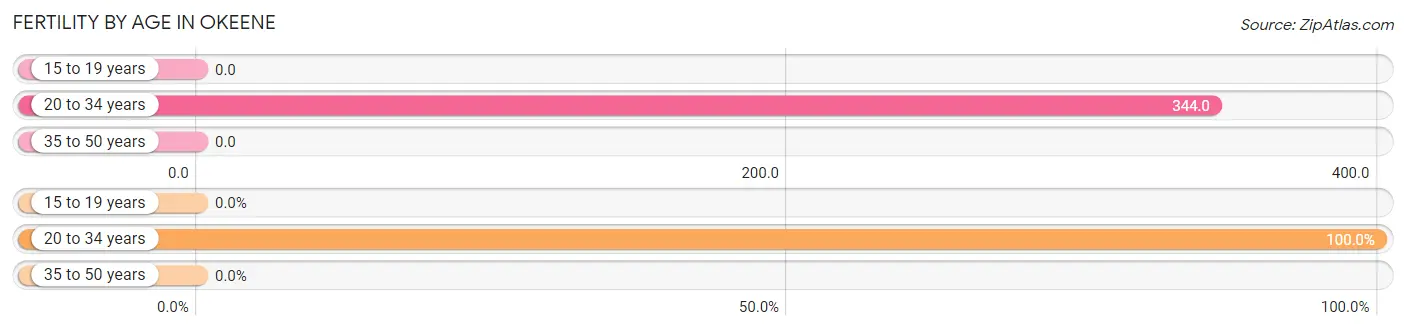
| Age Bracket | Women with Births | Births / 1,000 Women |
| 15 to 19 years | 0 (0.0%) | 0.0 |
| 20 to 34 years | 43 (100.0%) | 344.0 |
| 35 to 50 years | 0 (0.0%) | 0.0 |
| Total | 43 (100.0%) | 156.0 |
Fertility by Age by Marriage Status in Okeene
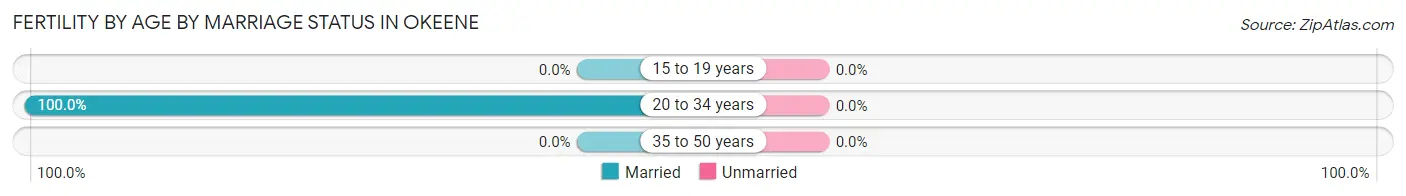
| Age Bracket | Married | Unmarried |
| 15 to 19 years | 0 (0.0%) | 0 (0.0%) |
| 20 to 34 years | 43 (100.0%) | 0 (0.0%) |
| 35 to 50 years | 0 (0.0%) | 0 (0.0%) |
| Total | 43 (100.0%) | 0 (0.0%) |
Fertility by Education in Okeene
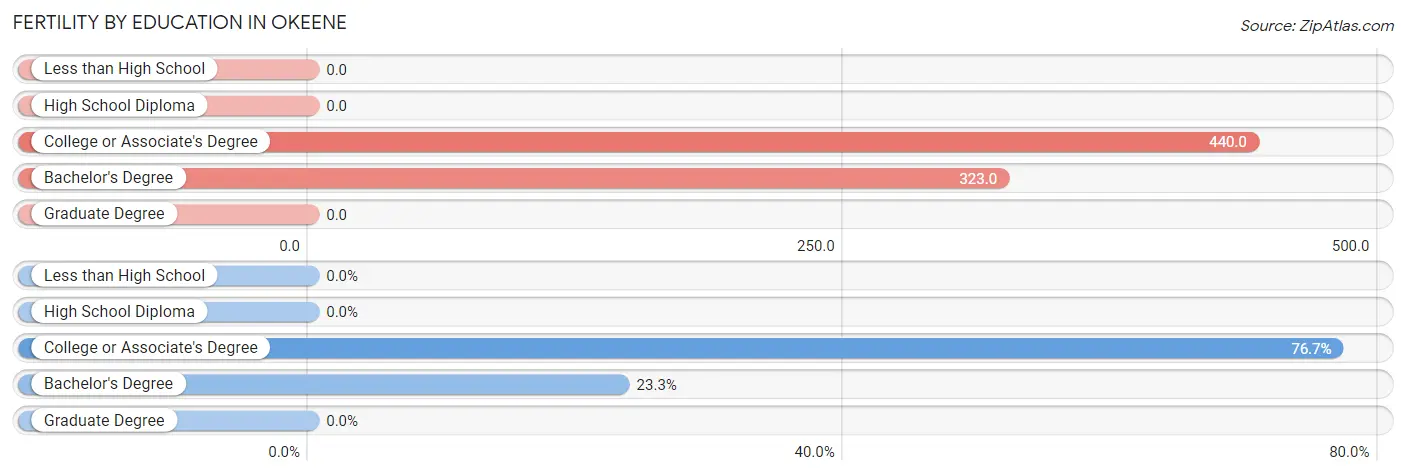
| Educational Attainment | Women with Births | Births / 1,000 Women |
| Less than High School | 0 (0.0%) | 0.0 |
| High School Diploma | 0 (0.0%) | 0.0 |
| College or Associate's Degree | 33 (76.7%) | 440.0 |
| Bachelor's Degree | 10 (23.3%) | 323.0 |
| Graduate Degree | 0 (0.0%) | 0.0 |
| Total | 43 (100.0%) | 156.0 |
Fertility by Education by Marriage Status in Okeene
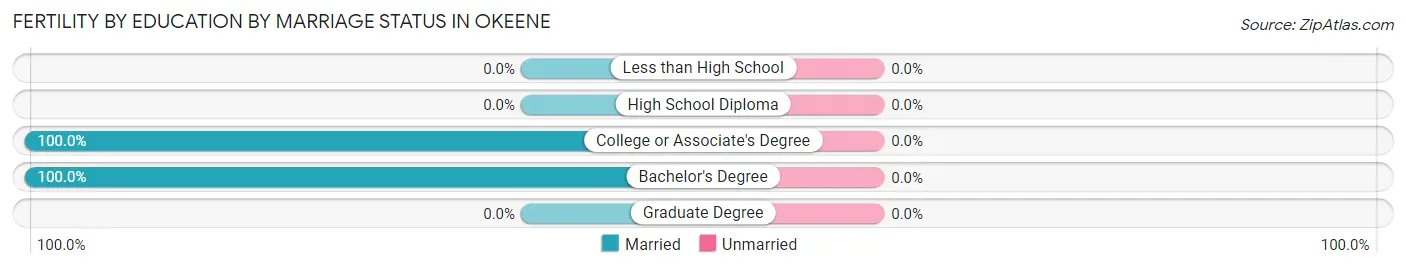
| Educational Attainment | Married | Unmarried |
| Less than High School | 0 (0.0%) | 0 (0.0%) |
| High School Diploma | 0 (0.0%) | 0 (0.0%) |
| College or Associate's Degree | 33 (100.0%) | 0 (0.0%) |
| Bachelor's Degree | 10 (100.0%) | 0 (0.0%) |
| Graduate Degree | 0 (0.0%) | 0 (0.0%) |
| Total | 43 (100.0%) | 0 (0.0%) |
Employment Characteristics in Okeene
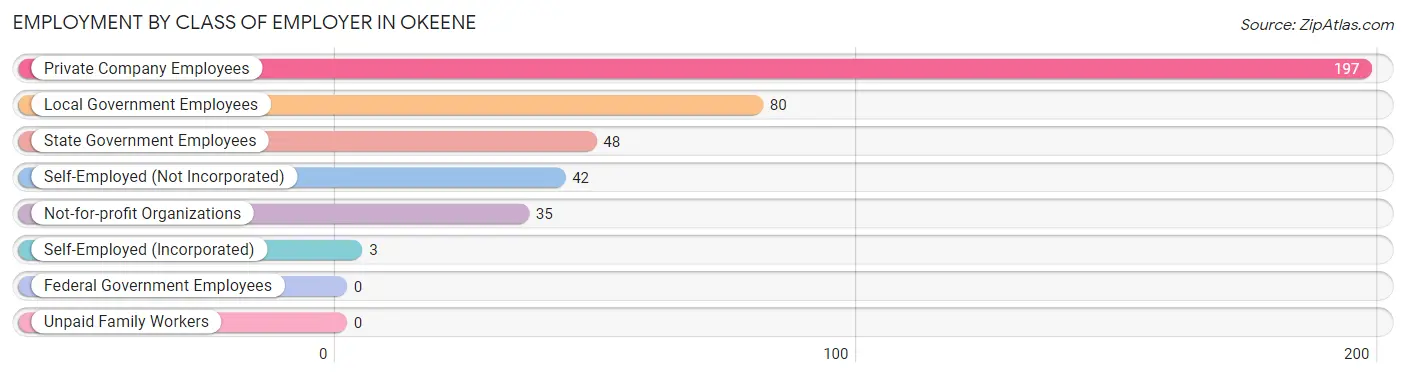
Employment by Class of Employer in Okeene
Among the 405 employed individuals in Okeene, private company employees (197 | 48.6%), local government employees (80 | 19.8%), and state government employees (48 | 11.8%) make up the most common classes of employment.
| Employer Class | # Employees | % Employees |
| Private Company Employees | 197 | 48.6% |
| Self-Employed (Incorporated) | 3 | 0.7% |
| Self-Employed (Not Incorporated) | 42 | 10.4% |
| Not-for-profit Organizations | 35 | 8.6% |
| Local Government Employees | 80 | 19.8% |
| State Government Employees | 48 | 11.8% |
| Federal Government Employees | 0 | 0.0% |
| Unpaid Family Workers | 0 | 0.0% |
| Total | 405 | 100.0% |
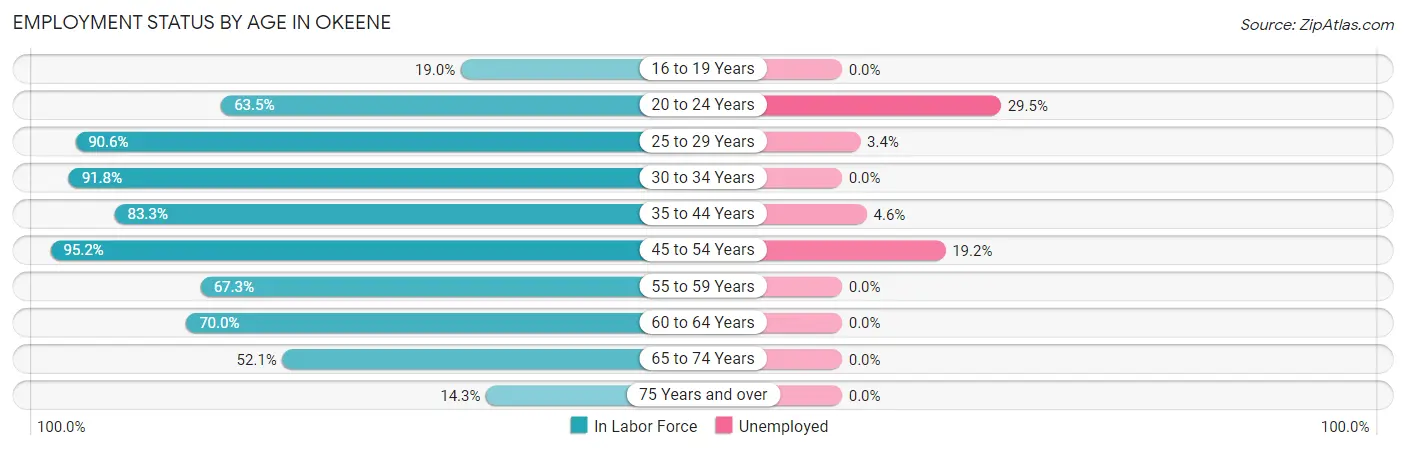
Employment Status by Age in Okeene
According to the labor force statistics for Okeene, out of the total population over 16 years of age (704), 65.6% or 462 individuals are in the labor force, with 9.7% or 45 of them unemployed. The age group with the highest labor force participation rate is 45 to 54 years, with 95.2% or 120 individuals in the labor force. Within the labor force, the 20 to 24 years age range has the highest percentage of unemployed individuals, with 29.5% or 18 of them being unemployed.
| Age Bracket | In Labor Force | Unemployed |
| 16 to 19 Years | 11 (19.0%) | 0 (0.0%) |
| 20 to 24 Years | 61 (63.5%) | 18 (29.5%) |
| 25 to 29 Years | 29 (90.6%) | 1 (3.4%) |
| 30 to 34 Years | 56 (91.8%) | 0 (0.0%) |
| 35 to 44 Years | 65 (83.3%) | 3 (4.6%) |
| 45 to 54 Years | 120 (95.2%) | 23 (19.2%) |
| 55 to 59 Years | 37 (67.3%) | 0 (0.0%) |
| 60 to 64 Years | 35 (70.0%) | 0 (0.0%) |
| 65 to 74 Years | 37 (52.1%) | 0 (0.0%) |
| 75 Years and over | 11 (14.3%) | 0 (0.0%) |
| Total | 462 (65.6%) | 45 (9.7%) |
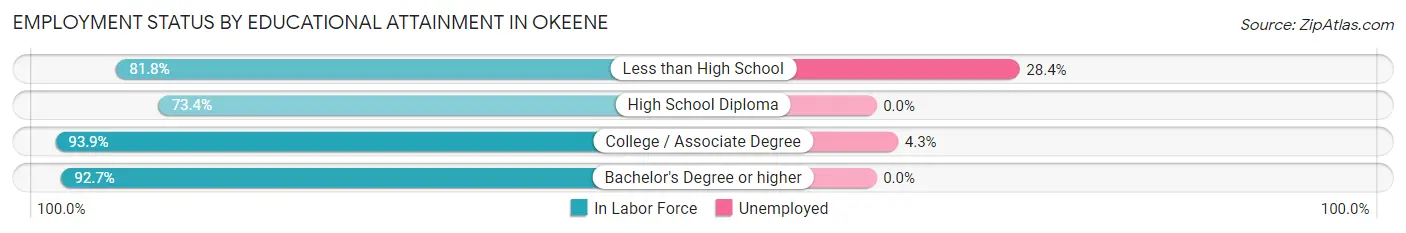
Employment Status by Educational Attainment in Okeene
According to labor force statistics for Okeene, 85.1% of individuals (342) out of the total population between 25 and 64 years of age (402) are in the labor force, with 7.9% or 27 of them being unemployed. The group with the highest labor force participation rate are those with the educational attainment of college / associate degree, with 93.9% or 92 individuals in the labor force. Within the labor force, individuals with less than high school education have the highest percentage of unemployment, with 28.4% or 23 of them being unemployed.
| Educational Attainment | In Labor Force | Unemployed |
| Less than High School | 81 (81.8%) | 28 (28.4%) |
| High School Diploma | 80 (73.4%) | 0 (0.0%) |
| College / Associate Degree | 92 (93.9%) | 4 (4.3%) |
| Bachelor's Degree or higher | 89 (92.7%) | 0 (0.0%) |
| Total | 342 (85.1%) | 32 (7.9%) |
Employment Occupations by Sex in Okeene
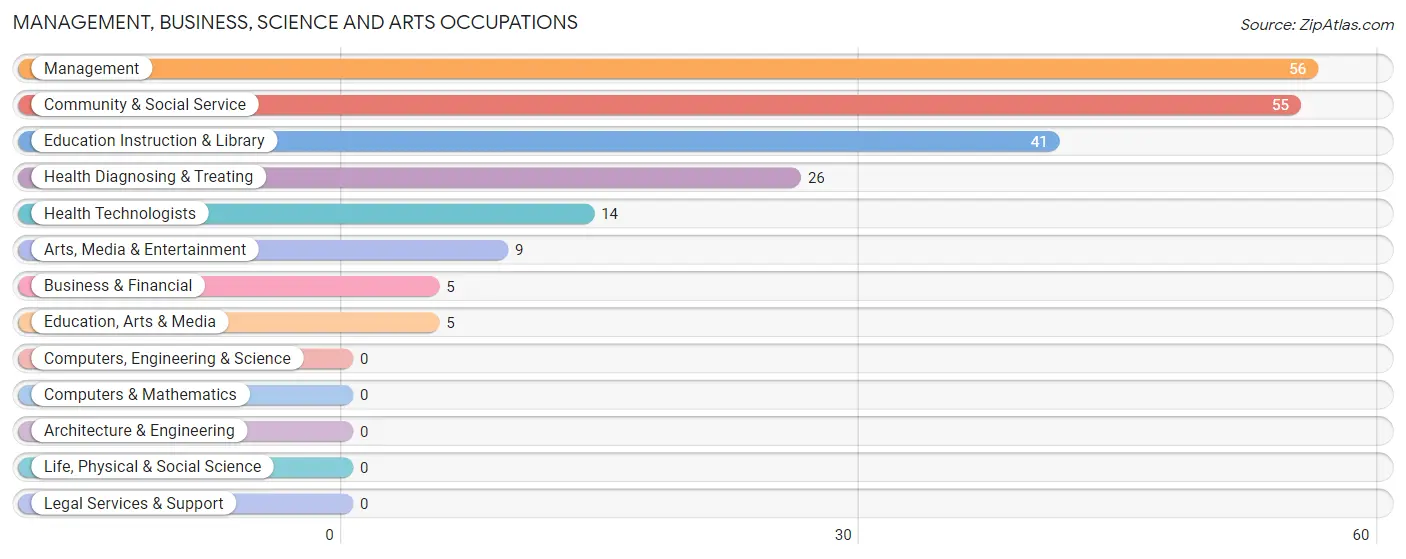
Management, Business, Science and Arts Occupations
The most common Management, Business, Science and Arts occupations in Okeene are Management (56 | 13.4%), Community & Social Service (55 | 13.2%), Education Instruction & Library (41 | 9.8%), Health Diagnosing & Treating (26 | 6.2%), and Health Technologists (14 | 3.4%).
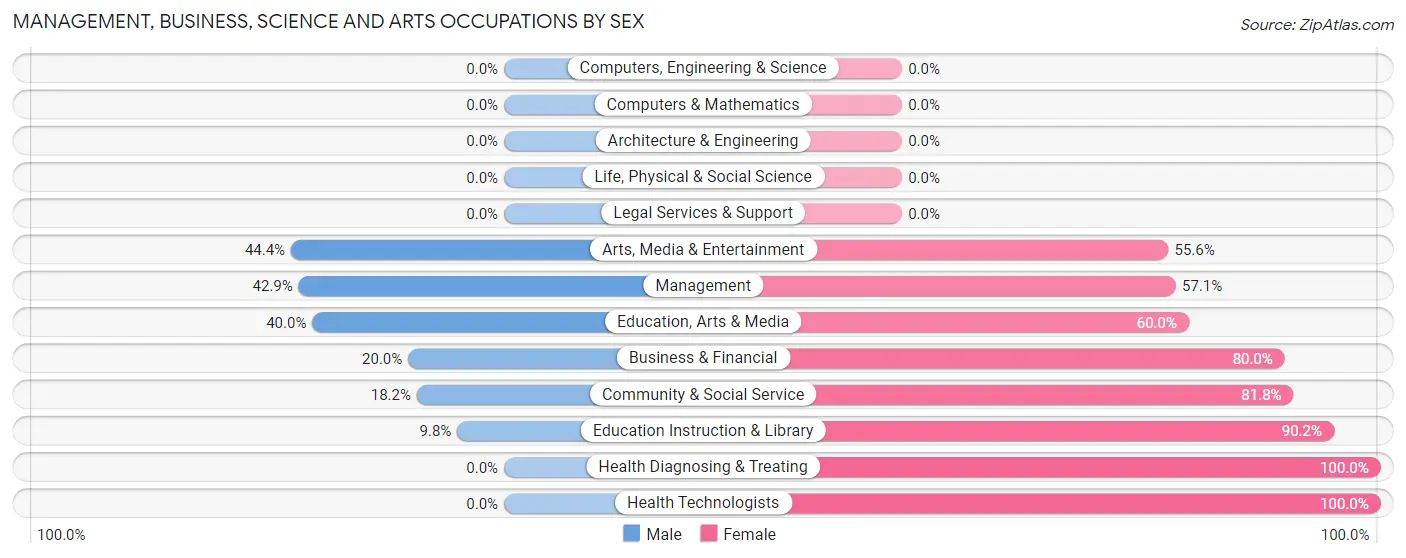
Management, Business, Science and Arts Occupations by Sex
Within the Management, Business, Science and Arts occupations in Okeene, the most male-oriented occupations are Arts, Media & Entertainment (44.4%), Management (42.9%), and Education, Arts & Media (40.0%), while the most female-oriented occupations are Health Diagnosing & Treating (100.0%), Health Technologists (100.0%), and Education Instruction & Library (90.2%).
| Occupation | Male | Female |
| Management | 24 (42.9%) | 32 (57.1%) |
| Business & Financial | 1 (20.0%) | 4 (80.0%) |
| Computers, Engineering & Science | 0 (0.0%) | 0 (0.0%) |
| Computers & Mathematics | 0 (0.0%) | 0 (0.0%) |
| Architecture & Engineering | 0 (0.0%) | 0 (0.0%) |
| Life, Physical & Social Science | 0 (0.0%) | 0 (0.0%) |
| Community & Social Service | 10 (18.2%) | 45 (81.8%) |
| Education, Arts & Media | 2 (40.0%) | 3 (60.0%) |
| Legal Services & Support | 0 (0.0%) | 0 (0.0%) |
| Education Instruction & Library | 4 (9.8%) | 37 (90.2%) |
| Arts, Media & Entertainment | 4 (44.4%) | 5 (55.6%) |
| Health Diagnosing & Treating | 0 (0.0%) | 26 (100.0%) |
| Health Technologists | 0 (0.0%) | 14 (100.0%) |
| Total (Category) | 35 (24.6%) | 107 (75.3%) |
| Total (Overall) | 182 (43.6%) | 235 (56.4%) |
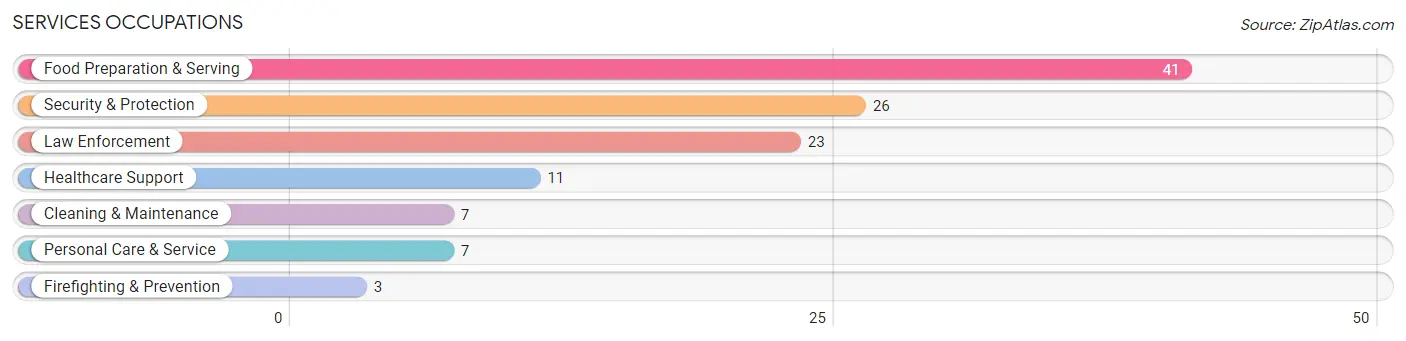
Services Occupations
The most common Services occupations in Okeene are Food Preparation & Serving (41 | 9.8%), Security & Protection (26 | 6.2%), Law Enforcement (23 | 5.5%), Healthcare Support (11 | 2.6%), and Cleaning & Maintenance (7 | 1.7%).
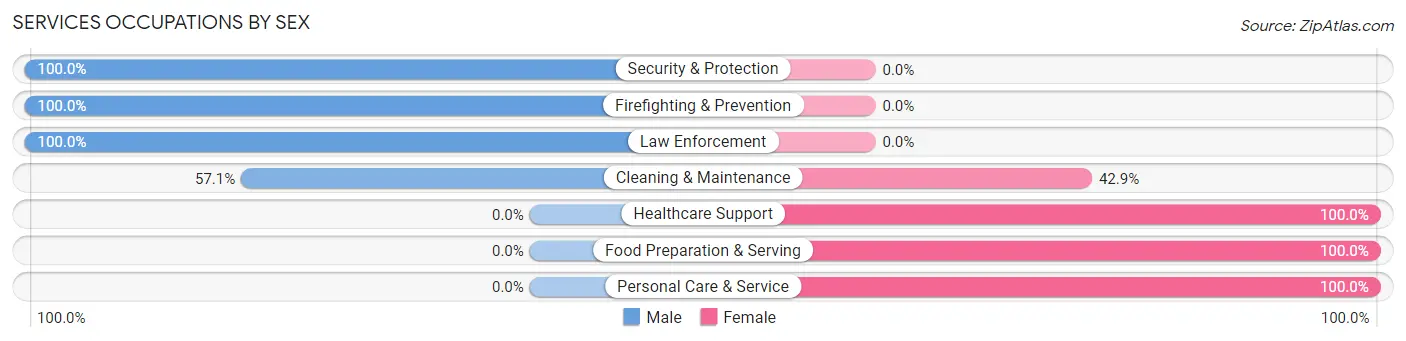
Services Occupations by Sex
Within the Services occupations in Okeene, the most male-oriented occupations are Security & Protection (100.0%), Firefighting & Prevention (100.0%), and Law Enforcement (100.0%), while the most female-oriented occupations are Healthcare Support (100.0%), Food Preparation & Serving (100.0%), and Personal Care & Service (100.0%).
| Occupation | Male | Female |
| Healthcare Support | 0 (0.0%) | 11 (100.0%) |
| Security & Protection | 26 (100.0%) | 0 (0.0%) |
| Firefighting & Prevention | 3 (100.0%) | 0 (0.0%) |
| Law Enforcement | 23 (100.0%) | 0 (0.0%) |
| Food Preparation & Serving | 0 (0.0%) | 41 (100.0%) |
| Cleaning & Maintenance | 4 (57.1%) | 3 (42.9%) |
| Personal Care & Service | 0 (0.0%) | 7 (100.0%) |
| Total (Category) | 30 (32.6%) | 62 (67.4%) |
| Total (Overall) | 182 (43.6%) | 235 (56.4%) |
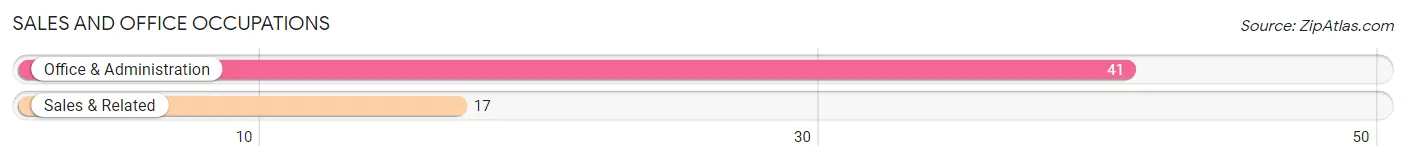
Sales and Office Occupations
The most common Sales and Office occupations in Okeene are Office & Administration (41 | 9.8%), and Sales & Related (17 | 4.1%).
Sales and Office Occupations by Sex
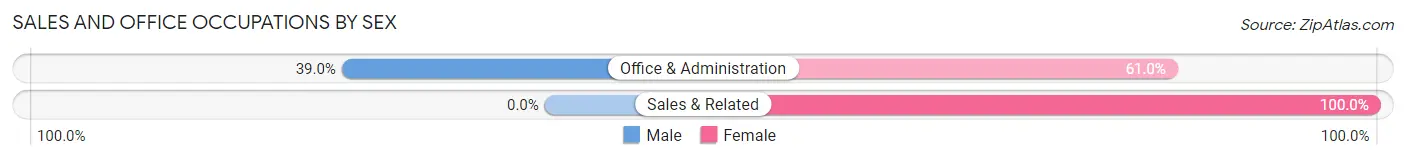
| Occupation | Male | Female |
| Sales & Related | 0 (0.0%) | 17 (100.0%) |
| Office & Administration | 16 (39.0%) | 25 (61.0%) |
| Total (Category) | 16 (27.6%) | 42 (72.4%) |
| Total (Overall) | 182 (43.6%) | 235 (56.4%) |
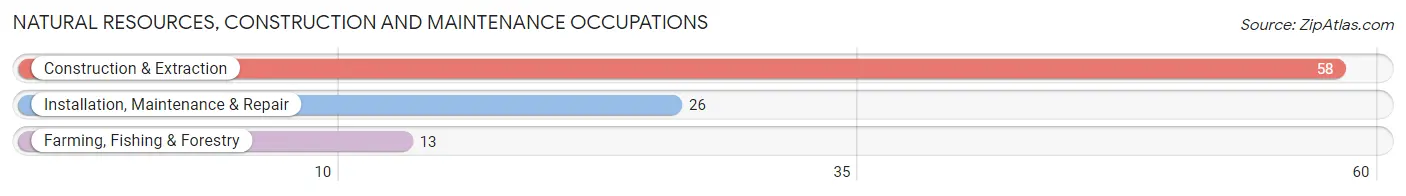
Natural Resources, Construction and Maintenance Occupations
The most common Natural Resources, Construction and Maintenance occupations in Okeene are Construction & Extraction (58 | 13.9%), Installation, Maintenance & Repair (26 | 6.2%), and Farming, Fishing & Forestry (13 | 3.1%).
Natural Resources, Construction and Maintenance Occupations by Sex
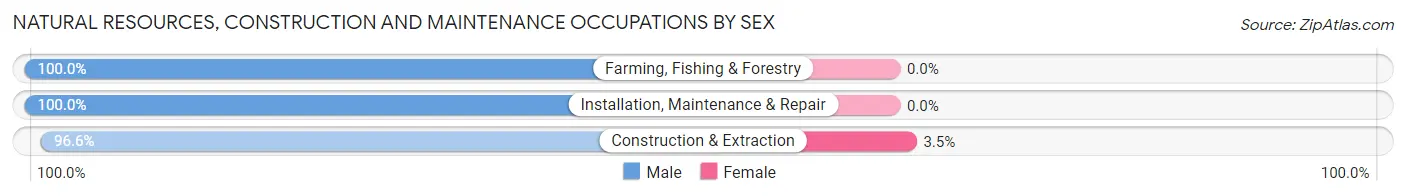
| Occupation | Male | Female |
| Farming, Fishing & Forestry | 13 (100.0%) | 0 (0.0%) |
| Construction & Extraction | 56 (96.6%) | 2 (3.5%) |
| Installation, Maintenance & Repair | 26 (100.0%) | 0 (0.0%) |
| Total (Category) | 95 (97.9%) | 2 (2.1%) |
| Total (Overall) | 182 (43.6%) | 235 (56.4%) |
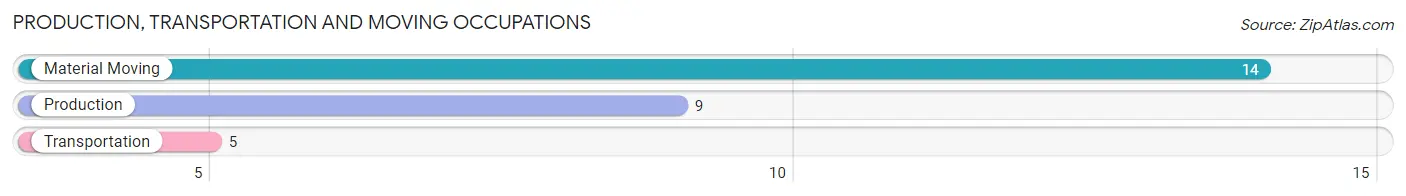
Production, Transportation and Moving Occupations
The most common Production, Transportation and Moving occupations in Okeene are Material Moving (14 | 3.4%), Production (9 | 2.2%), and Transportation (5 | 1.2%).
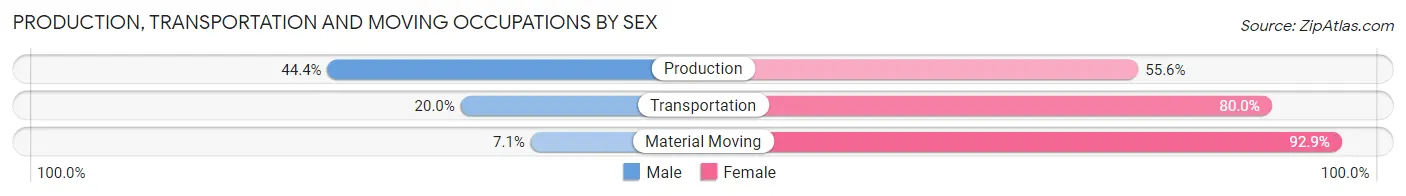
Production, Transportation and Moving Occupations by Sex
| Occupation | Male | Female |
| Production | 4 (44.4%) | 5 (55.6%) |
| Transportation | 1 (20.0%) | 4 (80.0%) |
| Material Moving | 1 (7.1%) | 13 (92.9%) |
| Total (Category) | 6 (21.4%) | 22 (78.6%) |
| Total (Overall) | 182 (43.6%) | 235 (56.4%) |
Employment Industries by Sex in Okeene
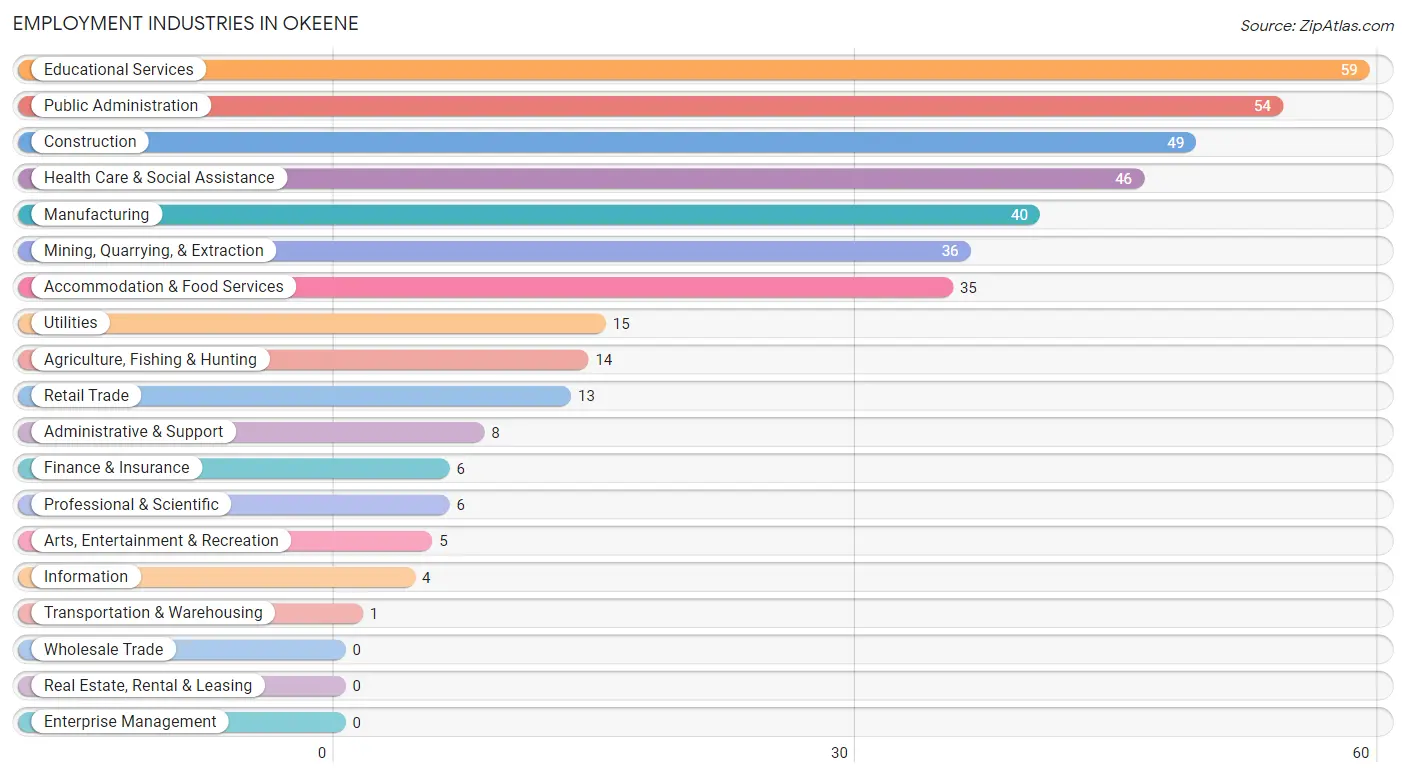
Employment Industries in Okeene
The major employment industries in Okeene include Educational Services (59 | 14.1%), Public Administration (54 | 13.0%), Construction (49 | 11.7%), Health Care & Social Assistance (46 | 11.0%), and Manufacturing (40 | 9.6%).
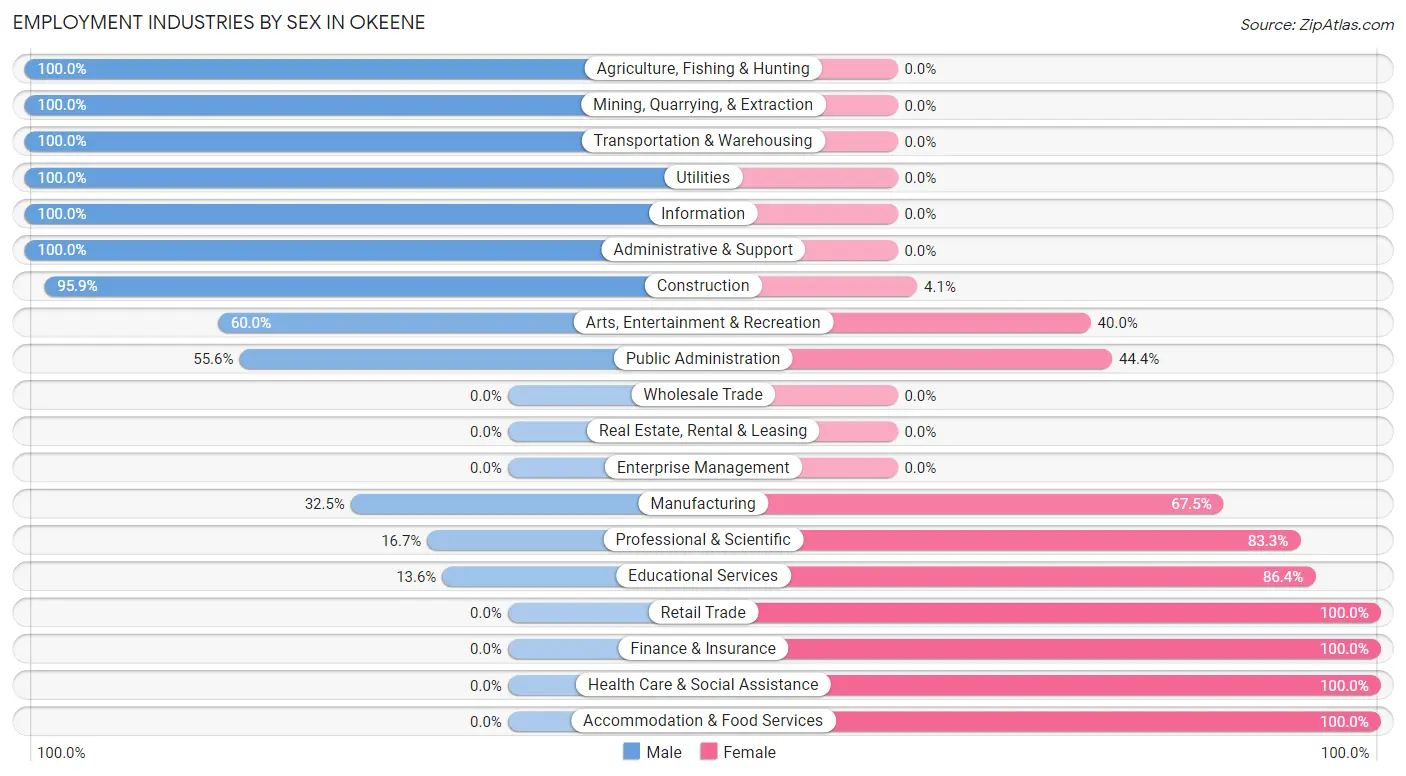
Employment Industries by Sex in Okeene
The Okeene industries that see more men than women are Agriculture, Fishing & Hunting (100.0%), Mining, Quarrying, & Extraction (100.0%), and Transportation & Warehousing (100.0%), whereas the industries that tend to have a higher number of women are Retail Trade (100.0%), Finance & Insurance (100.0%), and Health Care & Social Assistance (100.0%).
| Industry | Male | Female |
| Agriculture, Fishing & Hunting | 14 (100.0%) | 0 (0.0%) |
| Mining, Quarrying, & Extraction | 36 (100.0%) | 0 (0.0%) |
| Construction | 47 (95.9%) | 2 (4.1%) |
| Manufacturing | 13 (32.5%) | 27 (67.5%) |
| Wholesale Trade | 0 (0.0%) | 0 (0.0%) |
| Retail Trade | 0 (0.0%) | 13 (100.0%) |
| Transportation & Warehousing | 1 (100.0%) | 0 (0.0%) |
| Utilities | 15 (100.0%) | 0 (0.0%) |
| Information | 4 (100.0%) | 0 (0.0%) |
| Finance & Insurance | 0 (0.0%) | 6 (100.0%) |
| Real Estate, Rental & Leasing | 0 (0.0%) | 0 (0.0%) |
| Professional & Scientific | 1 (16.7%) | 5 (83.3%) |
| Enterprise Management | 0 (0.0%) | 0 (0.0%) |
| Administrative & Support | 8 (100.0%) | 0 (0.0%) |
| Educational Services | 8 (13.6%) | 51 (86.4%) |
| Health Care & Social Assistance | 0 (0.0%) | 46 (100.0%) |
| Arts, Entertainment & Recreation | 3 (60.0%) | 2 (40.0%) |
| Accommodation & Food Services | 0 (0.0%) | 35 (100.0%) |
| Public Administration | 30 (55.6%) | 24 (44.4%) |
| Total | 182 (43.6%) | 235 (56.4%) |
Education in Okeene
School Enrollment in Okeene
The most common levels of schooling among the 273 students in Okeene are middle school (94 | 34.4%), high school (85 | 31.1%), and elementary school (78 | 28.6%).
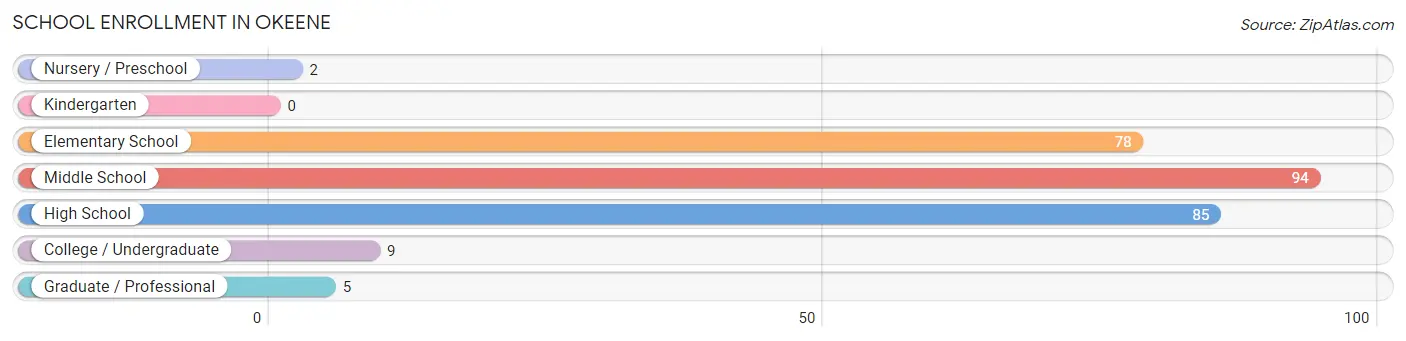
| School Level | # Students | % Students |
| Nursery / Preschool | 2 | 0.7% |
| Kindergarten | 0 | 0.0% |
| Elementary School | 78 | 28.6% |
| Middle School | 94 | 34.4% |
| High School | 85 | 31.1% |
| College / Undergraduate | 9 | 3.3% |
| Graduate / Professional | 5 | 1.8% |
| Total | 273 | 100.0% |
School Enrollment by Age by Funding Source in Okeene
Out of a total of 273 students who are enrolled in schools in Okeene, 4 (1.5%) attend a private institution, while the remaining 269 (98.5%) are enrolled in public schools. The age group of 15 to 17 year olds has the highest likelihood of being enrolled in private schools, with 3 (3.5% in the age bracket) enrolled. Conversely, the age group of 5 to 9 year old has the lowest likelihood of being enrolled in a private school, with 65 (100.0% in the age bracket) attending a public institution.
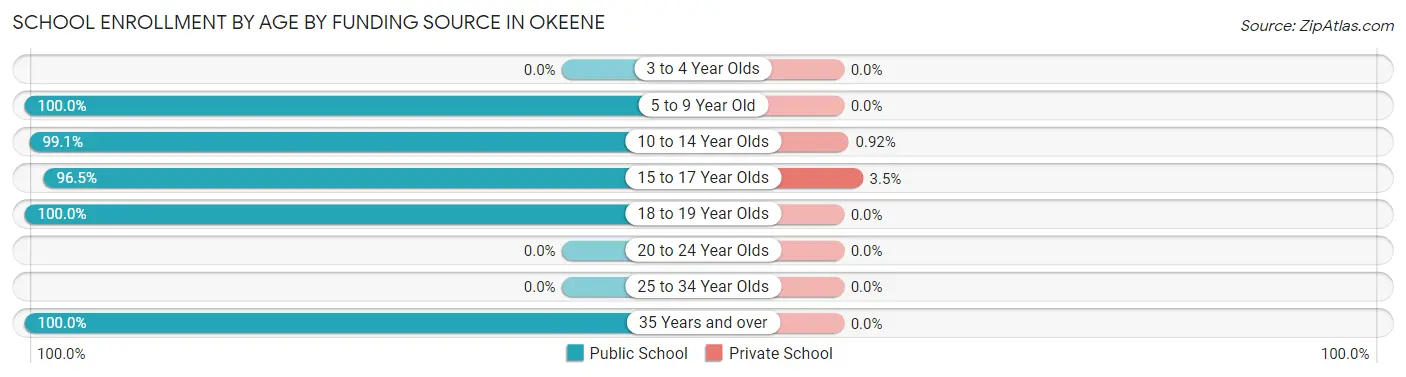
| Age Bracket | Public School | Private School |
| 3 to 4 Year Olds | 0 (0.0%) | 0 (0.0%) |
| 5 to 9 Year Old | 65 (100.0%) | 0 (0.0%) |
| 10 to 14 Year Olds | 108 (99.1%) | 1 (0.9%) |
| 15 to 17 Year Olds | 82 (96.5%) | 3 (3.5%) |
| 18 to 19 Year Olds | 1 (100.0%) | 0 (0.0%) |
| 20 to 24 Year Olds | 0 (0.0%) | 0 (0.0%) |
| 25 to 34 Year Olds | 0 (0.0%) | 0 (0.0%) |
| 35 Years and over | 13 (100.0%) | 0 (0.0%) |
| Total | 269 (98.5%) | 4 (1.5%) |
Educational Attainment by Field of Study in Okeene
Education (64 | 45.1%), arts & humanities (17 | 12.0%), liberal arts & history (14 | 9.9%), science & technology (10 | 7.0%), and business (10 | 7.0%) are the most common fields of study among 142 individuals in Okeene who have obtained a bachelor's degree or higher.
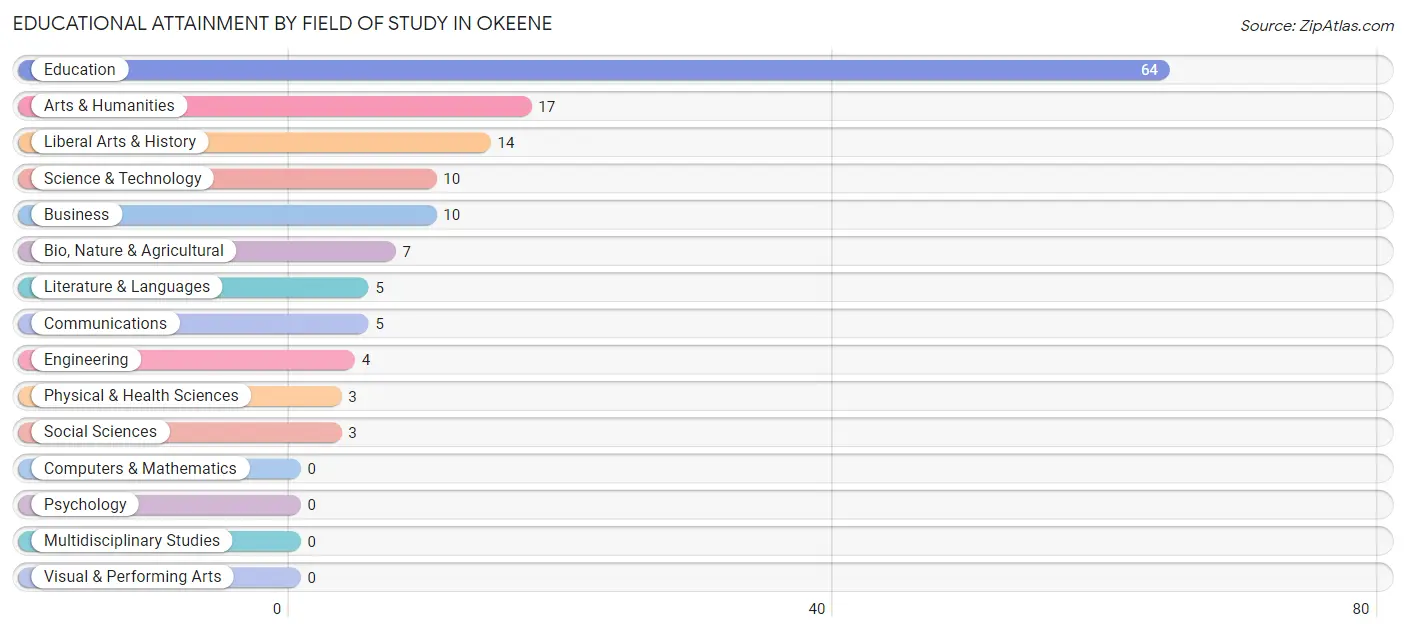
| Field of Study | # Graduates | % Graduates |
| Computers & Mathematics | 0 | 0.0% |
| Bio, Nature & Agricultural | 7 | 4.9% |
| Physical & Health Sciences | 3 | 2.1% |
| Psychology | 0 | 0.0% |
| Social Sciences | 3 | 2.1% |
| Engineering | 4 | 2.8% |
| Multidisciplinary Studies | 0 | 0.0% |
| Science & Technology | 10 | 7.0% |
| Business | 10 | 7.0% |
| Education | 64 | 45.1% |
| Literature & Languages | 5 | 3.5% |
| Liberal Arts & History | 14 | 9.9% |
| Visual & Performing Arts | 0 | 0.0% |
| Communications | 5 | 3.5% |
| Arts & Humanities | 17 | 12.0% |
| Total | 142 | 100.0% |
Transportation & Commute in Okeene
Vehicle Availability by Sex in Okeene
The most prevalent vehicle ownership categories in Okeene are males with 2 vehicles (84, accounting for 46.2%) and females with 2 vehicles (56, making up 37.7%).
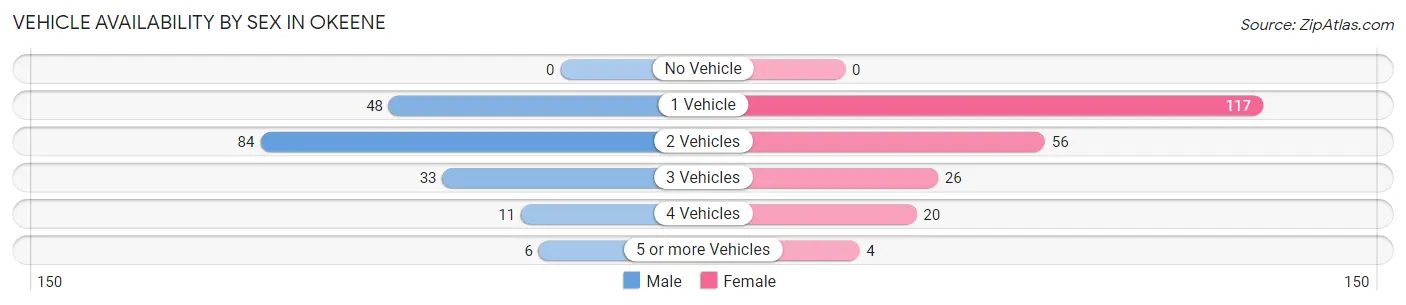
| Vehicles Available | Male | Female |
| No Vehicle | 0 (0.0%) | 0 (0.0%) |
| 1 Vehicle | 48 (26.4%) | 117 (52.5%) |
| 2 Vehicles | 84 (46.2%) | 56 (25.1%) |
| 3 Vehicles | 33 (18.1%) | 26 (11.7%) |
| 4 Vehicles | 11 (6.0%) | 20 (9.0%) |
| 5 or more Vehicles | 6 (3.3%) | 4 (1.8%) |
| Total | 182 (100.0%) | 223 (100.0%) |
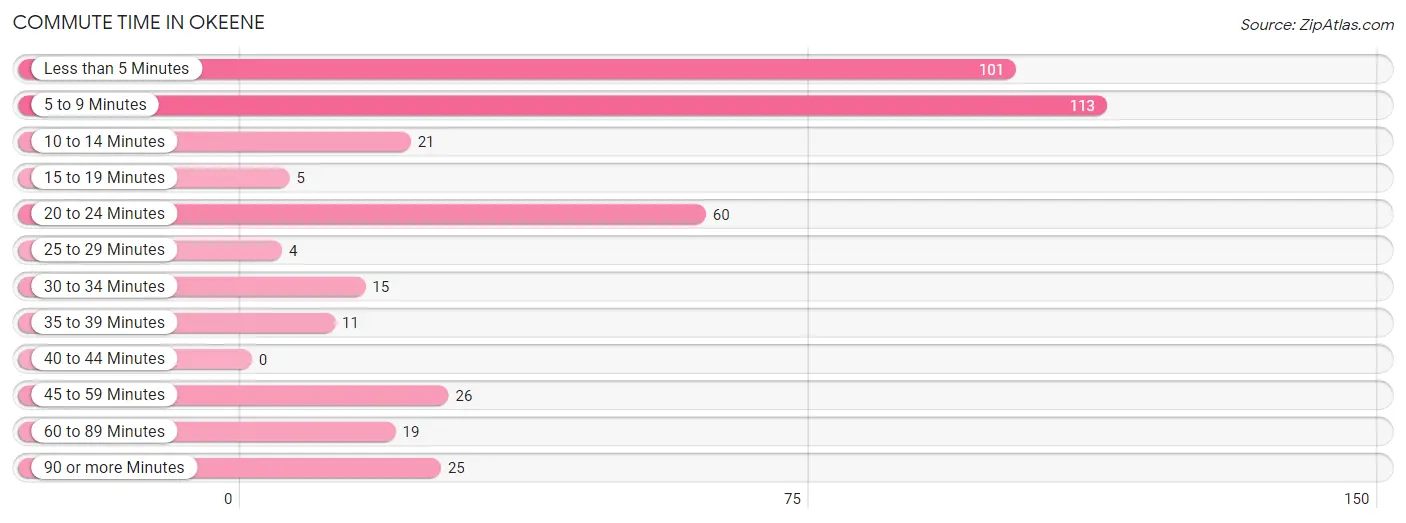
Commute Time in Okeene
The most frequently occuring commute durations in Okeene are 5 to 9 minutes (113 commuters, 28.2%), less than 5 minutes (101 commuters, 25.3%), and 20 to 24 minutes (60 commuters, 15.0%).
| Commute Time | # Commuters | % Commuters |
| Less than 5 Minutes | 101 | 25.3% |
| 5 to 9 Minutes | 113 | 28.2% |
| 10 to 14 Minutes | 21 | 5.2% |
| 15 to 19 Minutes | 5 | 1.3% |
| 20 to 24 Minutes | 60 | 15.0% |
| 25 to 29 Minutes | 4 | 1.0% |
| 30 to 34 Minutes | 15 | 3.7% |
| 35 to 39 Minutes | 11 | 2.8% |
| 40 to 44 Minutes | 0 | 0.0% |
| 45 to 59 Minutes | 26 | 6.5% |
| 60 to 89 Minutes | 19 | 4.8% |
| 90 or more Minutes | 25 | 6.2% |
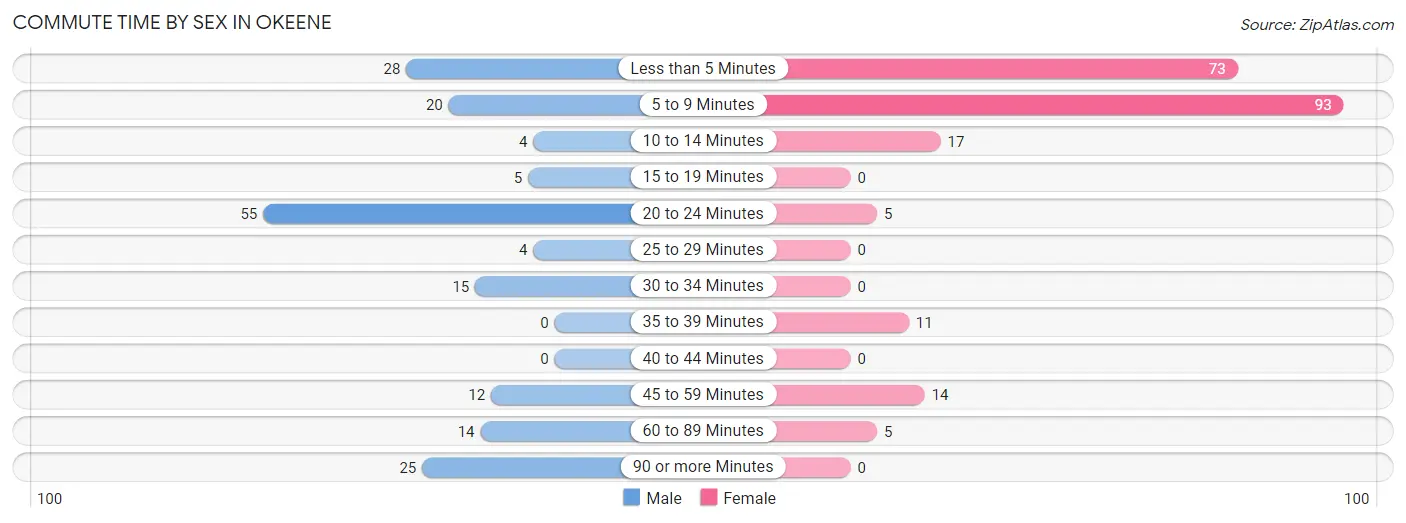
Commute Time by Sex in Okeene
The most common commute times in Okeene are 20 to 24 minutes (55 commuters, 30.2%) for males and 5 to 9 minutes (93 commuters, 42.7%) for females.
| Commute Time | Male | Female |
| Less than 5 Minutes | 28 (15.4%) | 73 (33.5%) |
| 5 to 9 Minutes | 20 (11.0%) | 93 (42.7%) |
| 10 to 14 Minutes | 4 (2.2%) | 17 (7.8%) |
| 15 to 19 Minutes | 5 (2.8%) | 0 (0.0%) |
| 20 to 24 Minutes | 55 (30.2%) | 5 (2.3%) |
| 25 to 29 Minutes | 4 (2.2%) | 0 (0.0%) |
| 30 to 34 Minutes | 15 (8.2%) | 0 (0.0%) |
| 35 to 39 Minutes | 0 (0.0%) | 11 (5.1%) |
| 40 to 44 Minutes | 0 (0.0%) | 0 (0.0%) |
| 45 to 59 Minutes | 12 (6.6%) | 14 (6.4%) |
| 60 to 89 Minutes | 14 (7.7%) | 5 (2.3%) |
| 90 or more Minutes | 25 (13.7%) | 0 (0.0%) |
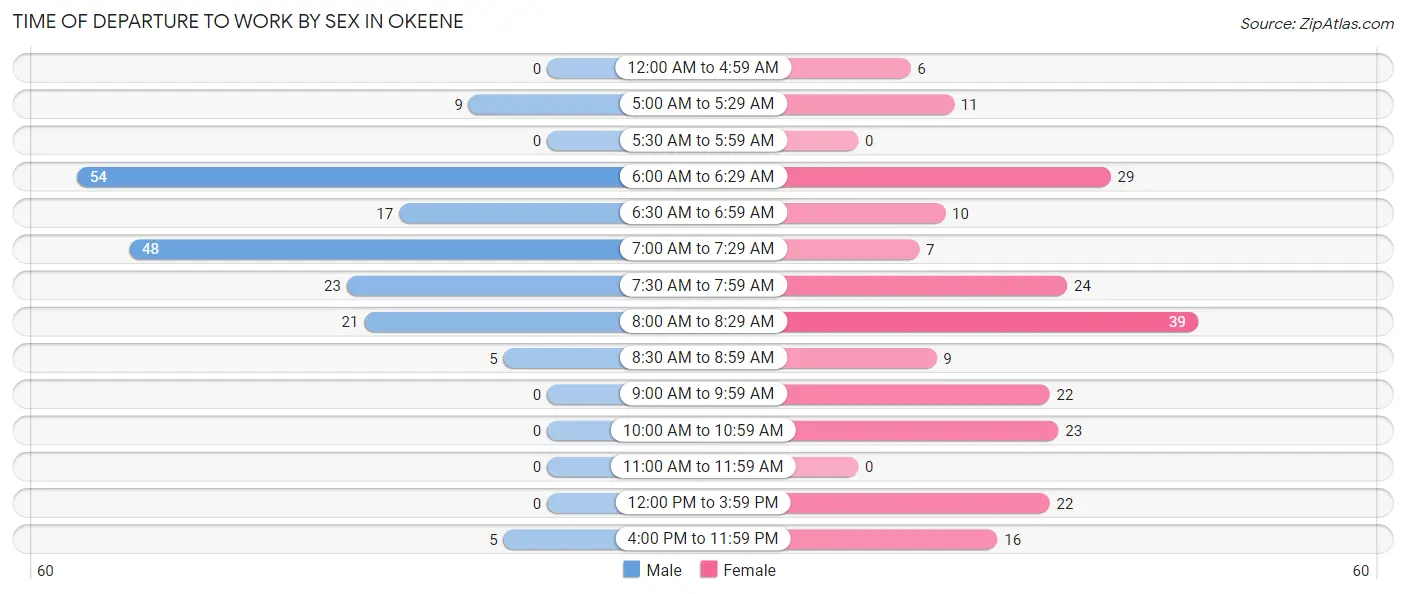
Time of Departure to Work by Sex in Okeene
The most frequent times of departure to work in Okeene are 6:00 AM to 6:29 AM (54, 29.7%) for males and 8:00 AM to 8:29 AM (39, 17.9%) for females.
| Time of Departure | Male | Female |
| 12:00 AM to 4:59 AM | 0 (0.0%) | 6 (2.8%) |
| 5:00 AM to 5:29 AM | 9 (5.0%) | 11 (5.1%) |
| 5:30 AM to 5:59 AM | 0 (0.0%) | 0 (0.0%) |
| 6:00 AM to 6:29 AM | 54 (29.7%) | 29 (13.3%) |
| 6:30 AM to 6:59 AM | 17 (9.3%) | 10 (4.6%) |
| 7:00 AM to 7:29 AM | 48 (26.4%) | 7 (3.2%) |
| 7:30 AM to 7:59 AM | 23 (12.6%) | 24 (11.0%) |
| 8:00 AM to 8:29 AM | 21 (11.5%) | 39 (17.9%) |
| 8:30 AM to 8:59 AM | 5 (2.8%) | 9 (4.1%) |
| 9:00 AM to 9:59 AM | 0 (0.0%) | 22 (10.1%) |
| 10:00 AM to 10:59 AM | 0 (0.0%) | 23 (10.5%) |
| 11:00 AM to 11:59 AM | 0 (0.0%) | 0 (0.0%) |
| 12:00 PM to 3:59 PM | 0 (0.0%) | 22 (10.1%) |
| 4:00 PM to 11:59 PM | 5 (2.8%) | 16 (7.3%) |
| Total | 182 (100.0%) | 218 (100.0%) |
Housing Occupancy in Okeene
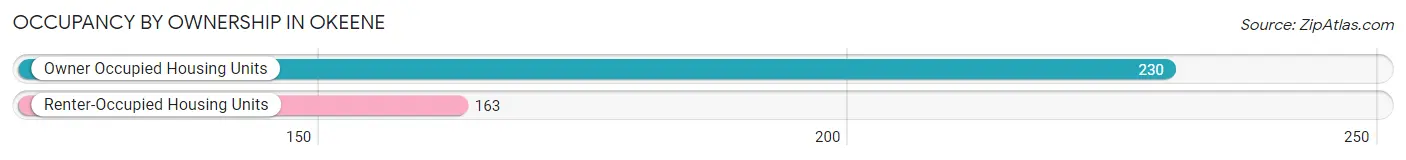
Occupancy by Ownership in Okeene
Of the total 393 dwellings in Okeene, owner-occupied units account for 230 (58.5%), while renter-occupied units make up 163 (41.5%).
| Occupancy | # Housing Units | % Housing Units |
| Owner Occupied Housing Units | 230 | 58.5% |
| Renter-Occupied Housing Units | 163 | 41.5% |
| Total Occupied Housing Units | 393 | 100.0% |
Occupancy by Household Size in Okeene
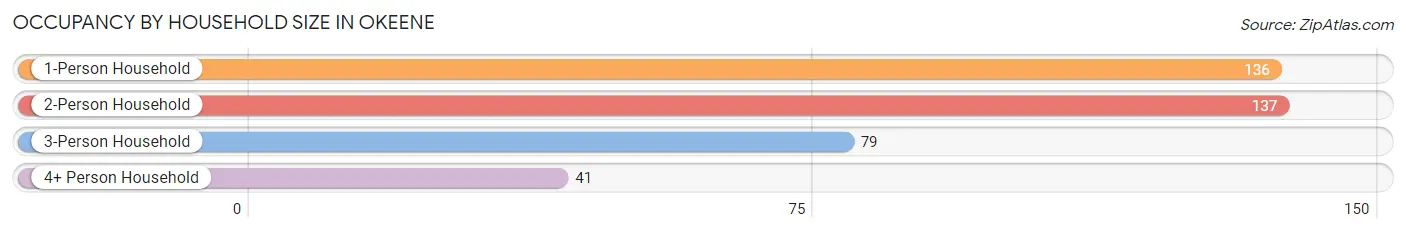
| Household Size | # Housing Units | % Housing Units |
| 1-Person Household | 136 | 34.6% |
| 2-Person Household | 137 | 34.9% |
| 3-Person Household | 79 | 20.1% |
| 4+ Person Household | 41 | 10.4% |
| Total Housing Units | 393 | 100.0% |
Occupancy by Ownership by Household Size in Okeene
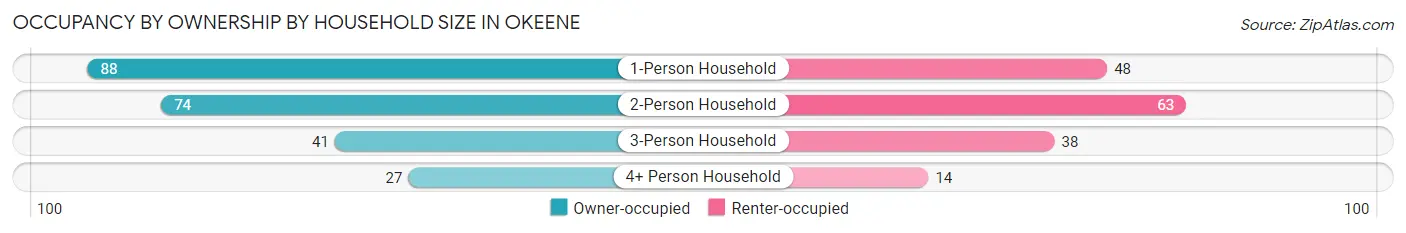
| Household Size | Owner-occupied | Renter-occupied |
| 1-Person Household | 88 (64.7%) | 48 (35.3%) |
| 2-Person Household | 74 (54.0%) | 63 (46.0%) |
| 3-Person Household | 41 (51.9%) | 38 (48.1%) |
| 4+ Person Household | 27 (65.8%) | 14 (34.2%) |
| Total Housing Units | 230 (58.5%) | 163 (41.5%) |
Occupancy by Educational Attainment in Okeene
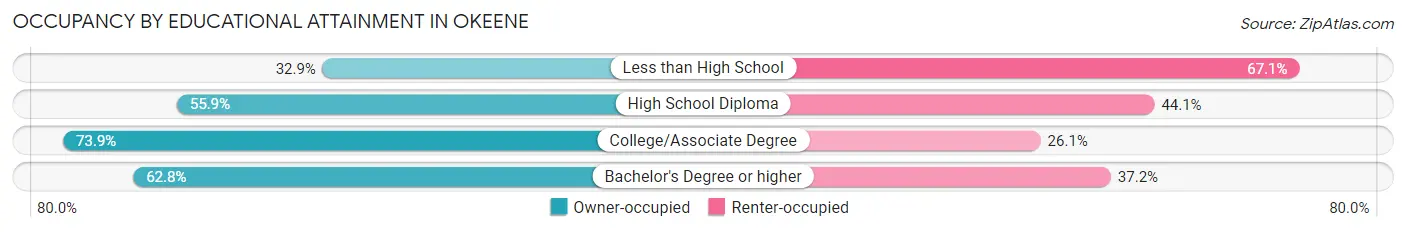
| Household Size | Owner-occupied | Renter-occupied |
| Less than High School | 24 (32.9%) | 49 (67.1%) |
| High School Diploma | 62 (55.9%) | 49 (44.1%) |
| College/Associate Degree | 85 (73.9%) | 30 (26.1%) |
| Bachelor's Degree or higher | 59 (62.8%) | 35 (37.2%) |
Occupancy by Age of Householder in Okeene
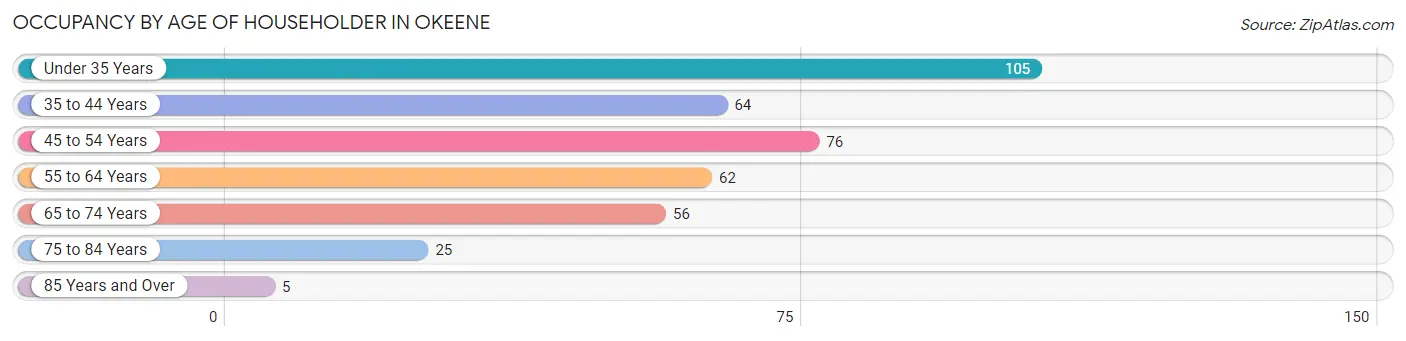
| Age Bracket | # Households | % Households |
| Under 35 Years | 105 | 26.7% |
| 35 to 44 Years | 64 | 16.3% |
| 45 to 54 Years | 76 | 19.3% |
| 55 to 64 Years | 62 | 15.8% |
| 65 to 74 Years | 56 | 14.2% |
| 75 to 84 Years | 25 | 6.4% |
| 85 Years and Over | 5 | 1.3% |
| Total | 393 | 100.0% |
Housing Finances in Okeene
Median Income by Occupancy in Okeene
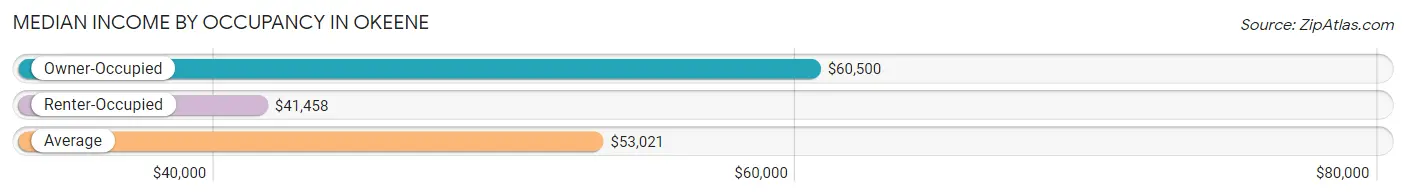
| Occupancy Type | # Households | Median Income |
| Owner-Occupied | 230 (58.5%) | $60,500 |
| Renter-Occupied | 163 (41.5%) | $41,458 |
| Average | 393 (100.0%) | $53,021 |
Occupancy by Householder Income Bracket in Okeene
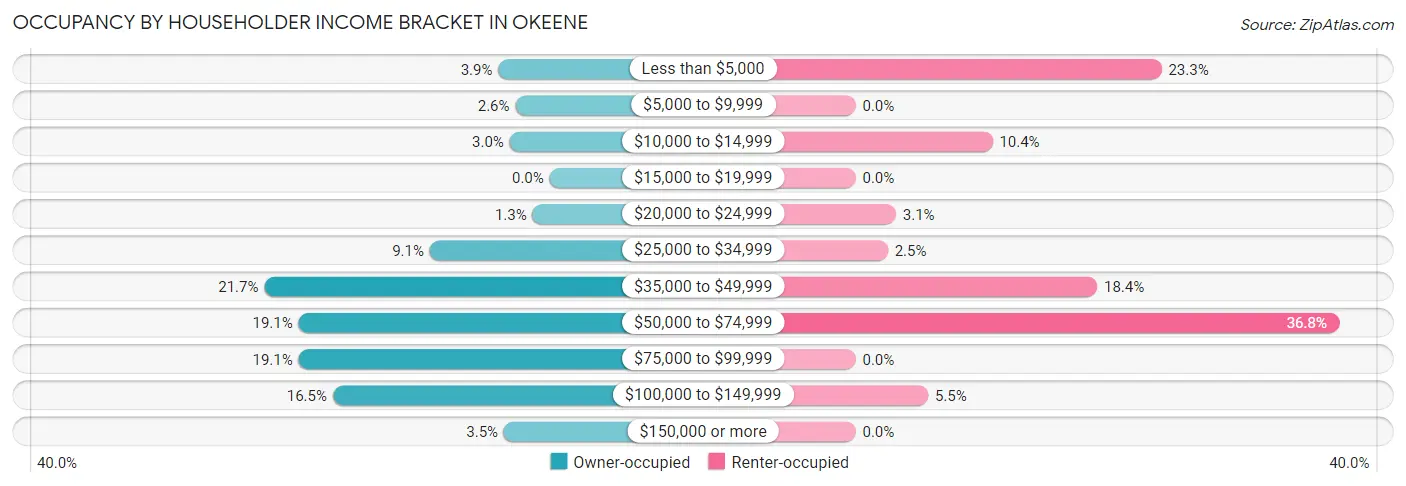
| Income Bracket | Owner-occupied | Renter-occupied |
| Less than $5,000 | 9 (3.9%) | 38 (23.3%) |
| $5,000 to $9,999 | 6 (2.6%) | 0 (0.0%) |
| $10,000 to $14,999 | 7 (3.0%) | 17 (10.4%) |
| $15,000 to $19,999 | 0 (0.0%) | 0 (0.0%) |
| $20,000 to $24,999 | 3 (1.3%) | 5 (3.1%) |
| $25,000 to $34,999 | 21 (9.1%) | 4 (2.5%) |
| $35,000 to $49,999 | 50 (21.7%) | 30 (18.4%) |
| $50,000 to $74,999 | 44 (19.1%) | 60 (36.8%) |
| $75,000 to $99,999 | 44 (19.1%) | 0 (0.0%) |
| $100,000 to $149,999 | 38 (16.5%) | 9 (5.5%) |
| $150,000 or more | 8 (3.5%) | 0 (0.0%) |
| Total | 230 (100.0%) | 163 (100.0%) |
Monthly Housing Cost Tiers in Okeene
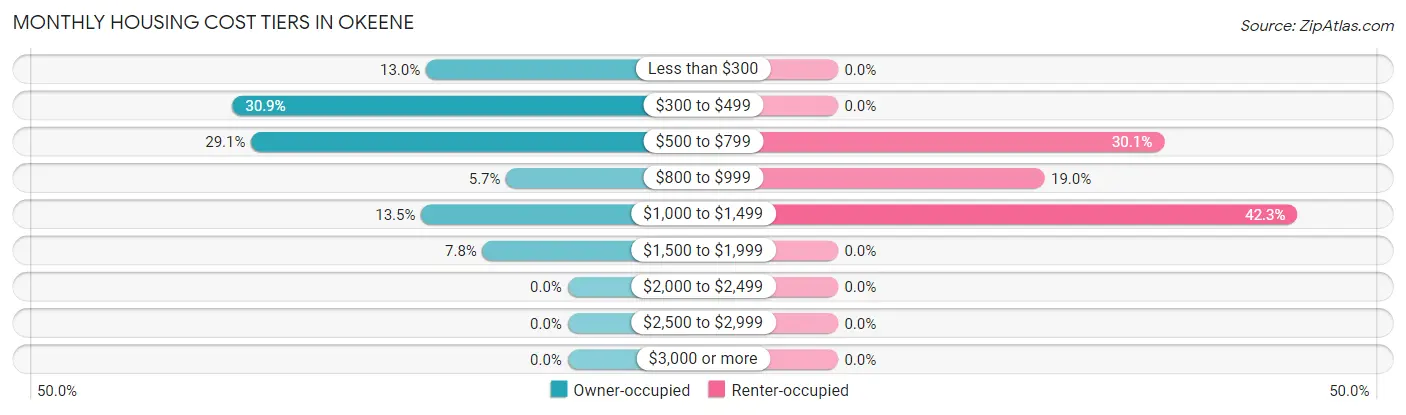
| Monthly Cost | Owner-occupied | Renter-occupied |
| Less than $300 | 30 (13.0%) | 0 (0.0%) |
| $300 to $499 | 71 (30.9%) | 0 (0.0%) |
| $500 to $799 | 67 (29.1%) | 49 (30.1%) |
| $800 to $999 | 13 (5.7%) | 31 (19.0%) |
| $1,000 to $1,499 | 31 (13.5%) | 69 (42.3%) |
| $1,500 to $1,999 | 18 (7.8%) | 0 (0.0%) |
| $2,000 to $2,499 | 0 (0.0%) | 0 (0.0%) |
| $2,500 to $2,999 | 0 (0.0%) | 0 (0.0%) |
| $3,000 or more | 0 (0.0%) | 0 (0.0%) |
| Total | 230 (100.0%) | 163 (100.0%) |
Physical Housing Characteristics in Okeene
Housing Structures in Okeene
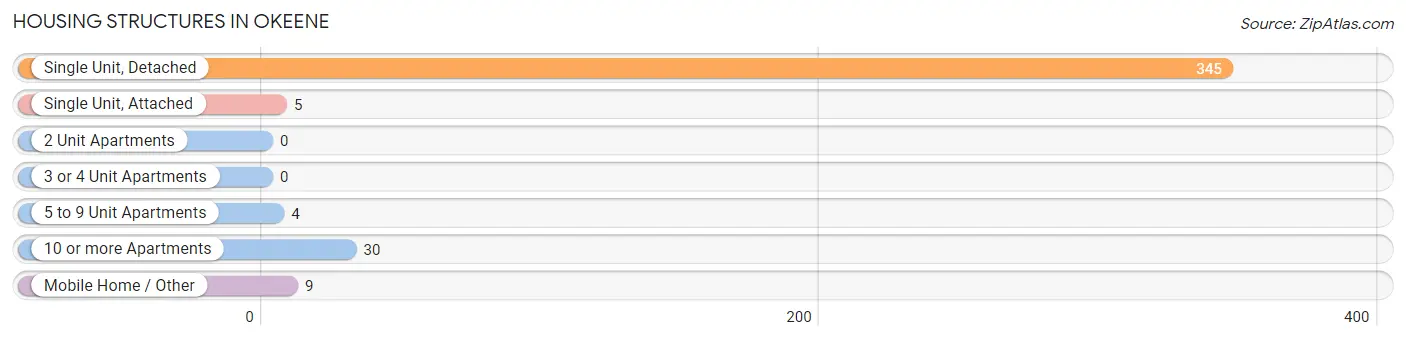
| Structure Type | # Housing Units | % Housing Units |
| Single Unit, Detached | 345 | 87.8% |
| Single Unit, Attached | 5 | 1.3% |
| 2 Unit Apartments | 0 | 0.0% |
| 3 or 4 Unit Apartments | 0 | 0.0% |
| 5 to 9 Unit Apartments | 4 | 1.0% |
| 10 or more Apartments | 30 | 7.6% |
| Mobile Home / Other | 9 | 2.3% |
| Total | 393 | 100.0% |
Housing Structures by Occupancy in Okeene
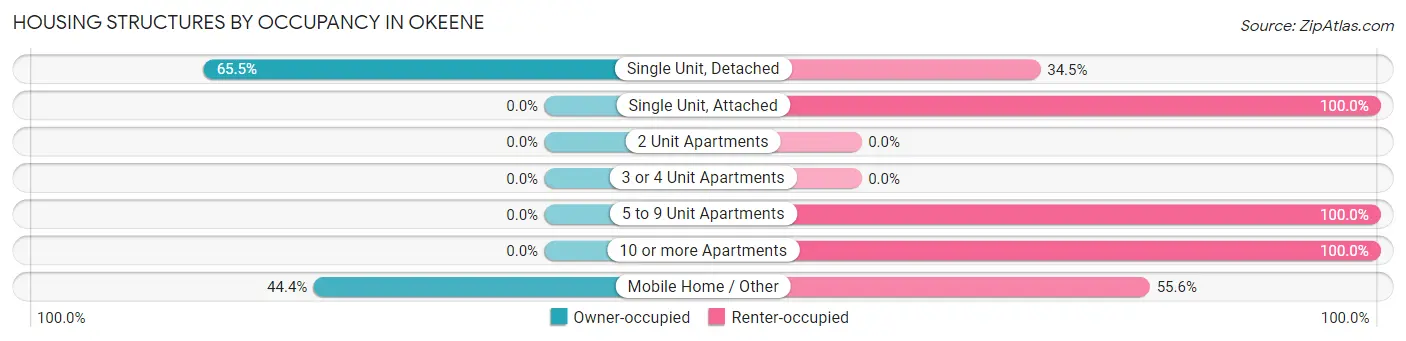
| Structure Type | Owner-occupied | Renter-occupied |
| Single Unit, Detached | 226 (65.5%) | 119 (34.5%) |
| Single Unit, Attached | 0 (0.0%) | 5 (100.0%) |
| 2 Unit Apartments | 0 (0.0%) | 0 (0.0%) |
| 3 or 4 Unit Apartments | 0 (0.0%) | 0 (0.0%) |
| 5 to 9 Unit Apartments | 0 (0.0%) | 4 (100.0%) |
| 10 or more Apartments | 0 (0.0%) | 30 (100.0%) |
| Mobile Home / Other | 4 (44.4%) | 5 (55.6%) |
| Total | 230 (58.5%) | 163 (41.5%) |
Housing Structures by Number of Rooms in Okeene
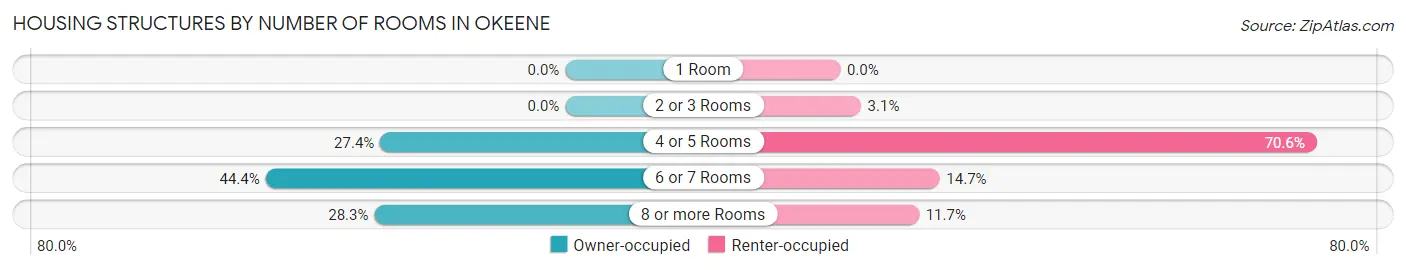
| Number of Rooms | Owner-occupied | Renter-occupied |
| 1 Room | 0 (0.0%) | 0 (0.0%) |
| 2 or 3 Rooms | 0 (0.0%) | 5 (3.1%) |
| 4 or 5 Rooms | 63 (27.4%) | 115 (70.6%) |
| 6 or 7 Rooms | 102 (44.4%) | 24 (14.7%) |
| 8 or more Rooms | 65 (28.3%) | 19 (11.7%) |
| Total | 230 (100.0%) | 163 (100.0%) |
Housing Structure by Heating Type in Okeene
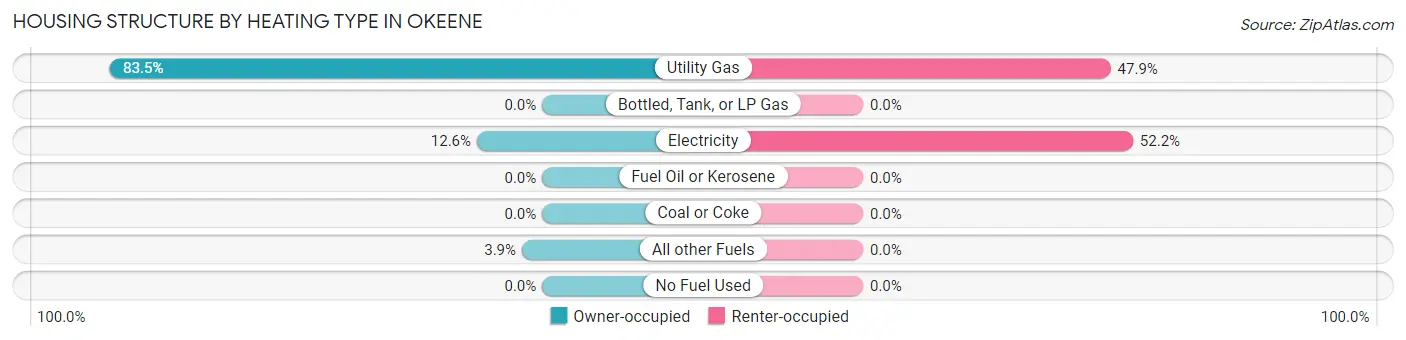
| Heating Type | Owner-occupied | Renter-occupied |
| Utility Gas | 192 (83.5%) | 78 (47.8%) |
| Bottled, Tank, or LP Gas | 0 (0.0%) | 0 (0.0%) |
| Electricity | 29 (12.6%) | 85 (52.1%) |
| Fuel Oil or Kerosene | 0 (0.0%) | 0 (0.0%) |
| Coal or Coke | 0 (0.0%) | 0 (0.0%) |
| All other Fuels | 9 (3.9%) | 0 (0.0%) |
| No Fuel Used | 0 (0.0%) | 0 (0.0%) |
| Total | 230 (100.0%) | 163 (100.0%) |
Household Vehicle Usage in Okeene
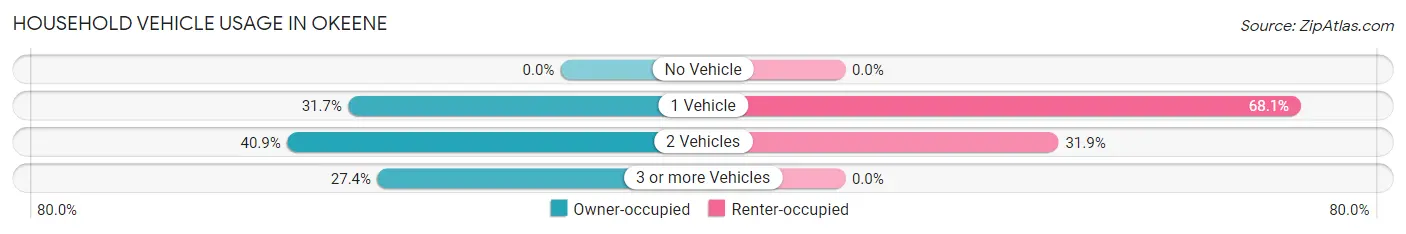
| Vehicles per Household | Owner-occupied | Renter-occupied |
| No Vehicle | 0 (0.0%) | 0 (0.0%) |
| 1 Vehicle | 73 (31.7%) | 111 (68.1%) |
| 2 Vehicles | 94 (40.9%) | 52 (31.9%) |
| 3 or more Vehicles | 63 (27.4%) | 0 (0.0%) |
| Total | 230 (100.0%) | 163 (100.0%) |
Real Estate & Mortgages in Okeene
Real Estate and Mortgage Overview in Okeene
| Characteristic | Without Mortgage | With Mortgage |
| Housing Units | 137 | 93 |
| Median Property Value | $82,000 | $99,400 |
| Median Household Income | $47,961 | $6 |
| Monthly Housing Costs | $391 | $0 |
| Real Estate Taxes | $413 | $13 |
Property Value by Mortgage Status in Okeene
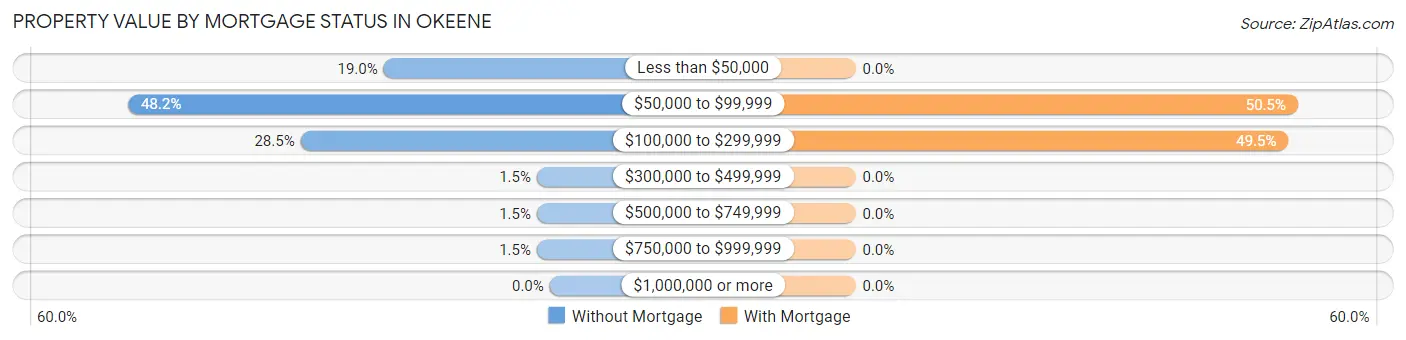
| Property Value | Without Mortgage | With Mortgage |
| Less than $50,000 | 26 (19.0%) | 0 (0.0%) |
| $50,000 to $99,999 | 66 (48.2%) | 47 (50.5%) |
| $100,000 to $299,999 | 39 (28.5%) | 46 (49.5%) |
| $300,000 to $499,999 | 2 (1.5%) | 0 (0.0%) |
| $500,000 to $749,999 | 2 (1.5%) | 0 (0.0%) |
| $750,000 to $999,999 | 2 (1.5%) | 0 (0.0%) |
| $1,000,000 or more | 0 (0.0%) | 0 (0.0%) |
| Total | 137 (100.0%) | 93 (100.0%) |
Household Income by Mortgage Status in Okeene
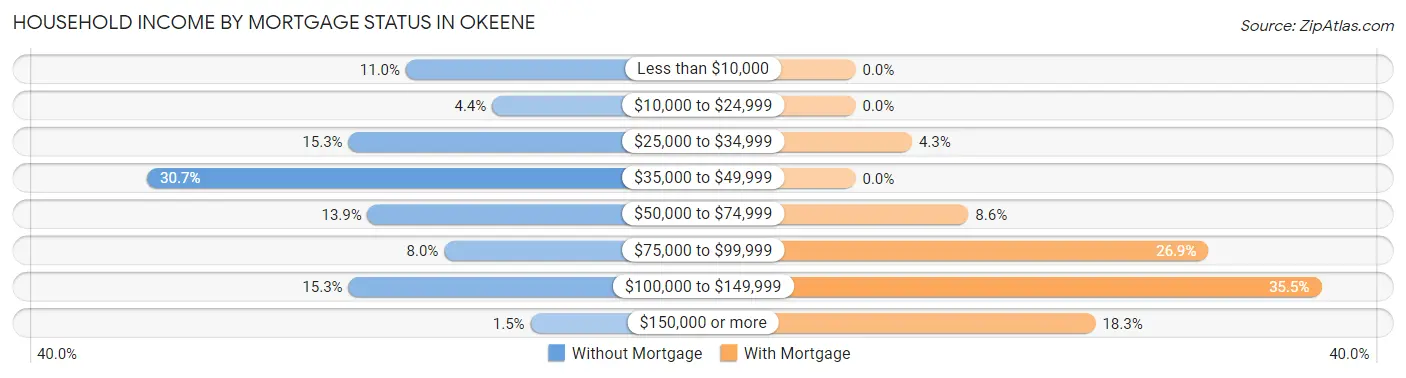
| Household Income | Without Mortgage | With Mortgage |
| Less than $10,000 | 15 (11.0%) | 0 (0.0%) |
| $10,000 to $24,999 | 6 (4.4%) | 0 (0.0%) |
| $25,000 to $34,999 | 21 (15.3%) | 4 (4.3%) |
| $35,000 to $49,999 | 42 (30.7%) | 0 (0.0%) |
| $50,000 to $74,999 | 19 (13.9%) | 8 (8.6%) |
| $75,000 to $99,999 | 11 (8.0%) | 25 (26.9%) |
| $100,000 to $149,999 | 21 (15.3%) | 33 (35.5%) |
| $150,000 or more | 2 (1.5%) | 17 (18.3%) |
| Total | 137 (100.0%) | 93 (100.0%) |
Property Value to Household Income Ratio in Okeene
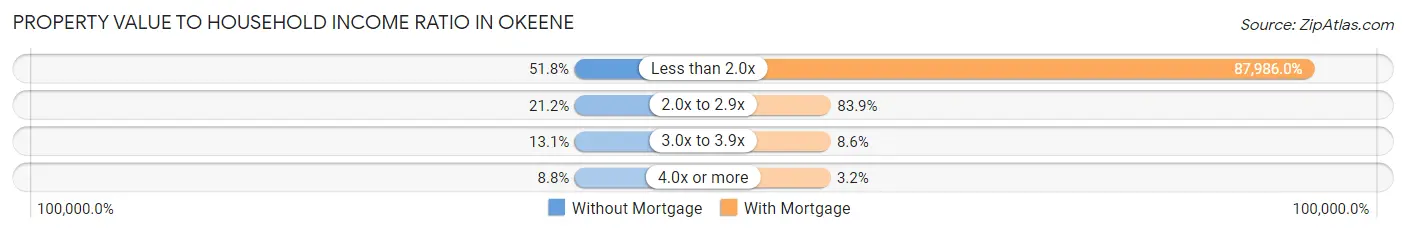
| Value-to-Income Ratio | Without Mortgage | With Mortgage |
| Less than 2.0x | 71 (51.8%) | 81,827 (87,986.0%) |
| 2.0x to 2.9x | 29 (21.2%) | 78 (83.9%) |
| 3.0x to 3.9x | 18 (13.1%) | 8 (8.6%) |
| 4.0x or more | 12 (8.8%) | 3 (3.2%) |
| Total | 137 (100.0%) | 93 (100.0%) |
Real Estate Taxes by Mortgage Status in Okeene
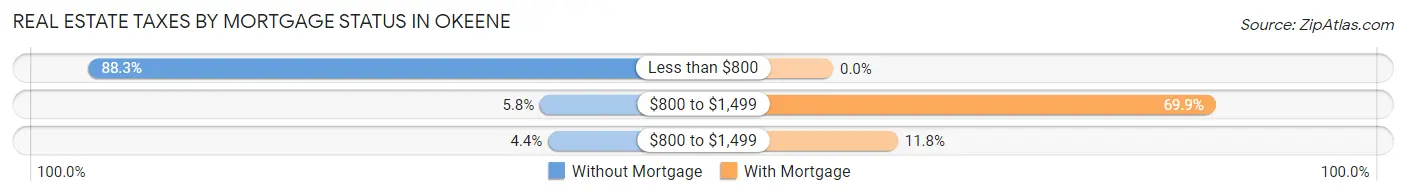
| Property Taxes | Without Mortgage | With Mortgage |
| Less than $800 | 121 (88.3%) | 0 (0.0%) |
| $800 to $1,499 | 8 (5.8%) | 65 (69.9%) |
| $800 to $1,499 | 6 (4.4%) | 11 (11.8%) |
| Total | 137 (100.0%) | 93 (100.0%) |
Health & Disability in Okeene
Health Insurance Coverage by Age in Okeene
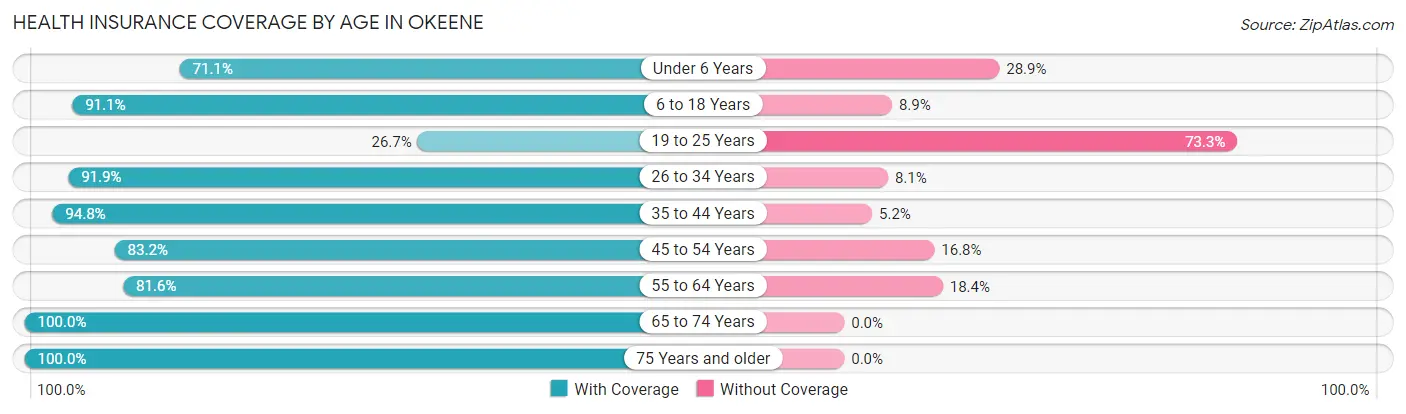
| Age Bracket | With Coverage | Without Coverage |
| Under 6 Years | 91 (71.1%) | 37 (28.9%) |
| 6 to 18 Years | 246 (91.1%) | 24 (8.9%) |
| 19 to 25 Years | 27 (26.7%) | 74 (73.3%) |
| 26 to 34 Years | 79 (91.9%) | 7 (8.1%) |
| 35 to 44 Years | 73 (94.8%) | 4 (5.2%) |
| 45 to 54 Years | 104 (83.2%) | 21 (16.8%) |
| 55 to 64 Years | 80 (81.6%) | 18 (18.4%) |
| 65 to 74 Years | 71 (100.0%) | 0 (0.0%) |
| 75 Years and older | 44 (100.0%) | 0 (0.0%) |
| Total | 815 (81.5%) | 185 (18.5%) |
Health Insurance Coverage by Citizenship Status in Okeene
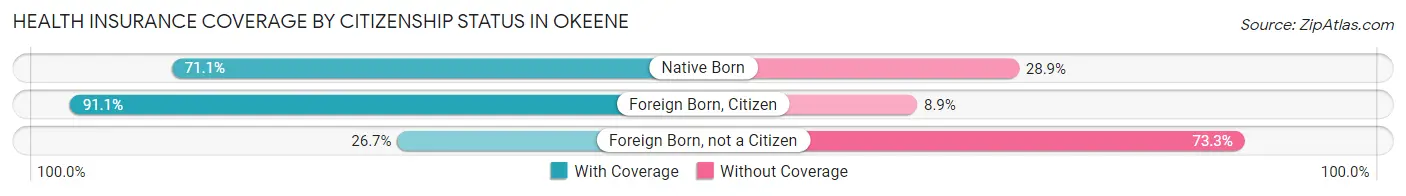
| Citizenship Status | With Coverage | Without Coverage |
| Native Born | 91 (71.1%) | 37 (28.9%) |
| Foreign Born, Citizen | 246 (91.1%) | 24 (8.9%) |
| Foreign Born, not a Citizen | 27 (26.7%) | 74 (73.3%) |
Health Insurance Coverage by Household Income in Okeene
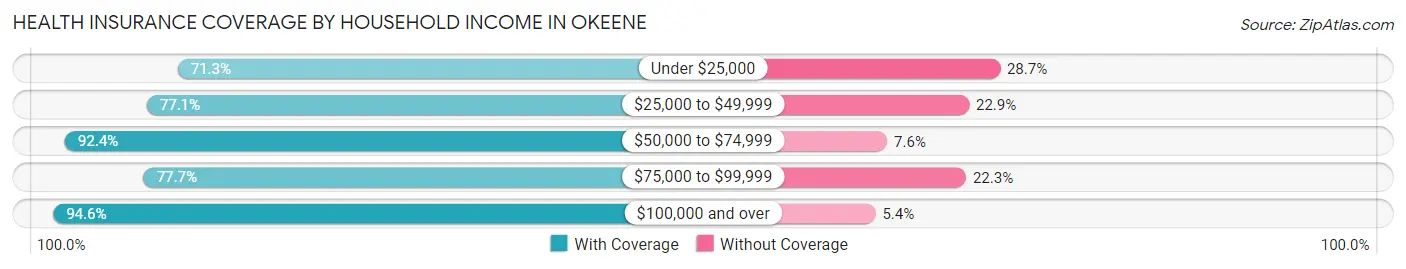
| Household Income | With Coverage | Without Coverage |
| Under $25,000 | 236 (71.3%) | 95 (28.7%) |
| $25,000 to $49,999 | 138 (77.1%) | 41 (22.9%) |
| $50,000 to $74,999 | 220 (92.4%) | 18 (7.6%) |
| $75,000 to $99,999 | 80 (77.7%) | 23 (22.3%) |
| $100,000 and over | 141 (94.6%) | 8 (5.4%) |
Public vs Private Health Insurance Coverage by Age in Okeene
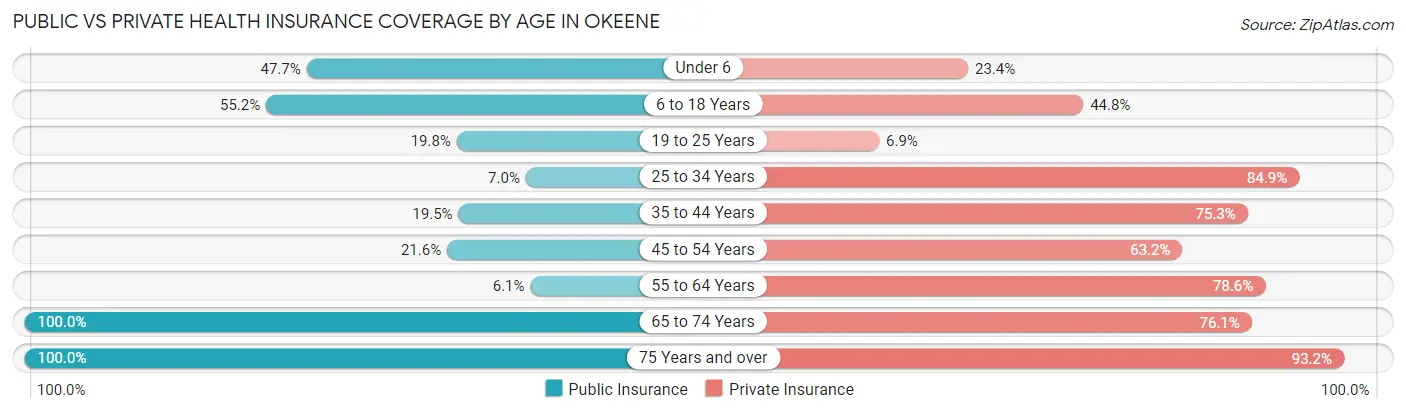
| Age Bracket | Public Insurance | Private Insurance |
| Under 6 | 61 (47.7%) | 30 (23.4%) |
| 6 to 18 Years | 149 (55.2%) | 121 (44.8%) |
| 19 to 25 Years | 20 (19.8%) | 7 (6.9%) |
| 25 to 34 Years | 6 (7.0%) | 73 (84.9%) |
| 35 to 44 Years | 15 (19.5%) | 58 (75.3%) |
| 45 to 54 Years | 27 (21.6%) | 79 (63.2%) |
| 55 to 64 Years | 6 (6.1%) | 77 (78.6%) |
| 65 to 74 Years | 71 (100.0%) | 54 (76.1%) |
| 75 Years and over | 44 (100.0%) | 41 (93.2%) |
| Total | 399 (39.9%) | 540 (54.0%) |
Disability Status by Sex by Age in Okeene
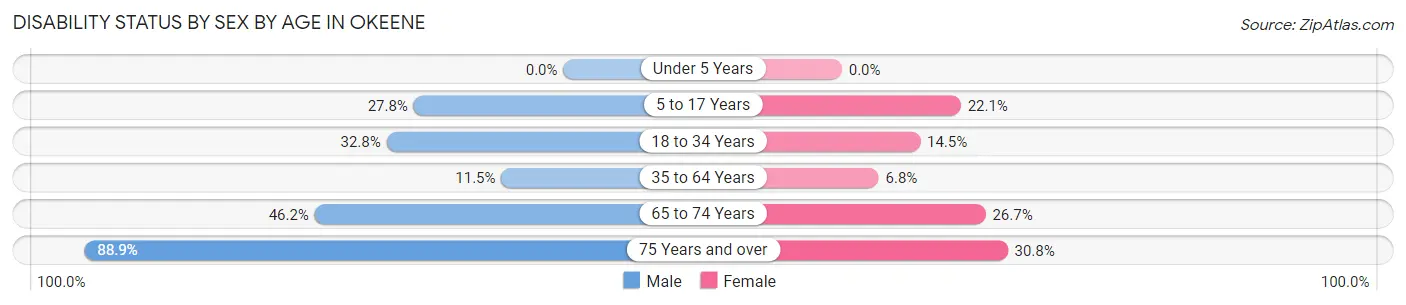
| Age Bracket | Male | Female |
| Under 5 Years | 0 (0.0%) | 0 (0.0%) |
| 5 to 17 Years | 35 (27.8%) | 32 (22.1%) |
| 18 to 34 Years | 21 (32.8%) | 18 (14.5%) |
| 35 to 64 Years | 16 (11.5%) | 11 (6.8%) |
| 65 to 74 Years | 12 (46.2%) | 12 (26.7%) |
| 75 Years and over | 16 (88.9%) | 8 (30.8%) |
Disability Class by Sex by Age in Okeene
Disability Class: Hearing Difficulty
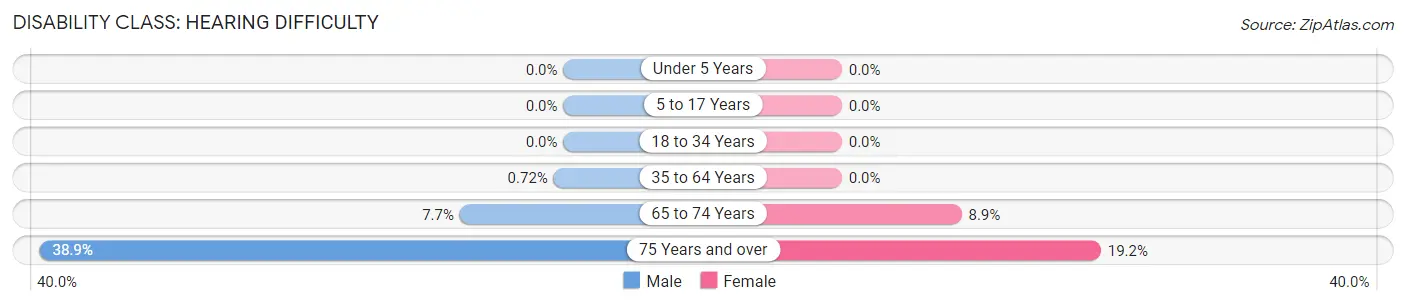
| Age Bracket | Male | Female |
| Under 5 Years | 0 (0.0%) | 0 (0.0%) |
| 5 to 17 Years | 0 (0.0%) | 0 (0.0%) |
| 18 to 34 Years | 0 (0.0%) | 0 (0.0%) |
| 35 to 64 Years | 1 (0.7%) | 0 (0.0%) |
| 65 to 74 Years | 2 (7.7%) | 4 (8.9%) |
| 75 Years and over | 7 (38.9%) | 5 (19.2%) |
Disability Class: Vision Difficulty
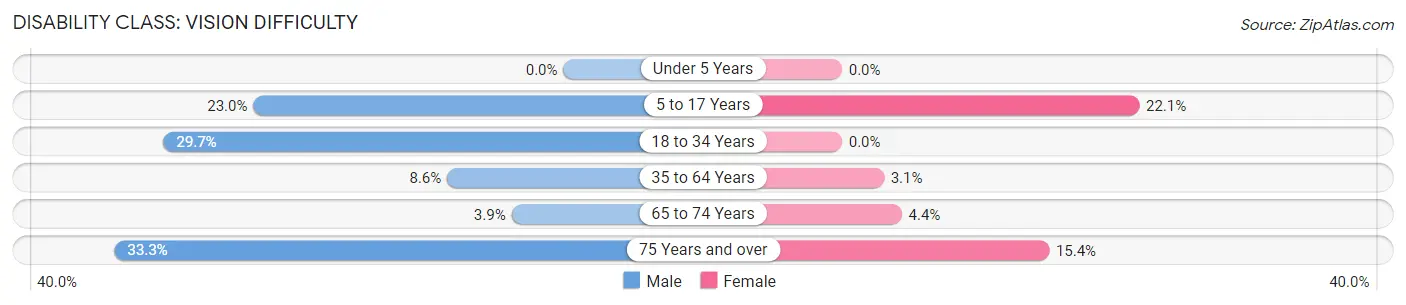
| Age Bracket | Male | Female |
| Under 5 Years | 0 (0.0%) | 0 (0.0%) |
| 5 to 17 Years | 29 (23.0%) | 32 (22.1%) |
| 18 to 34 Years | 19 (29.7%) | 0 (0.0%) |
| 35 to 64 Years | 12 (8.6%) | 5 (3.1%) |
| 65 to 74 Years | 1 (3.8%) | 2 (4.4%) |
| 75 Years and over | 6 (33.3%) | 4 (15.4%) |
Disability Class: Cognitive Difficulty
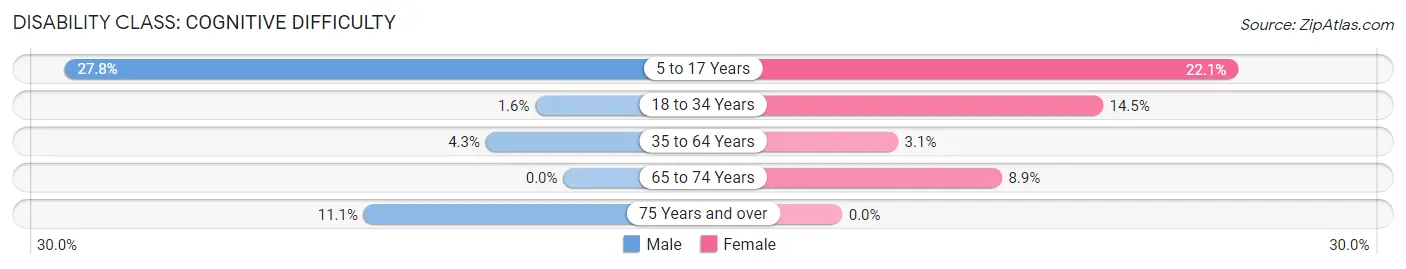
| Age Bracket | Male | Female |
| 5 to 17 Years | 35 (27.8%) | 32 (22.1%) |
| 18 to 34 Years | 1 (1.6%) | 18 (14.5%) |
| 35 to 64 Years | 6 (4.3%) | 5 (3.1%) |
| 65 to 74 Years | 0 (0.0%) | 4 (8.9%) |
| 75 Years and over | 2 (11.1%) | 0 (0.0%) |
Disability Class: Ambulatory Difficulty
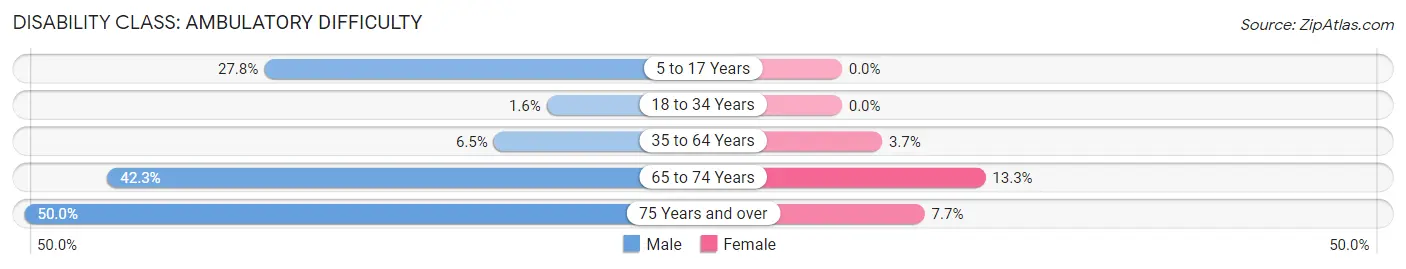
| Age Bracket | Male | Female |
| 5 to 17 Years | 35 (27.8%) | 0 (0.0%) |
| 18 to 34 Years | 1 (1.6%) | 0 (0.0%) |
| 35 to 64 Years | 9 (6.5%) | 6 (3.7%) |
| 65 to 74 Years | 11 (42.3%) | 6 (13.3%) |
| 75 Years and over | 9 (50.0%) | 2 (7.7%) |
Disability Class: Self-Care Difficulty
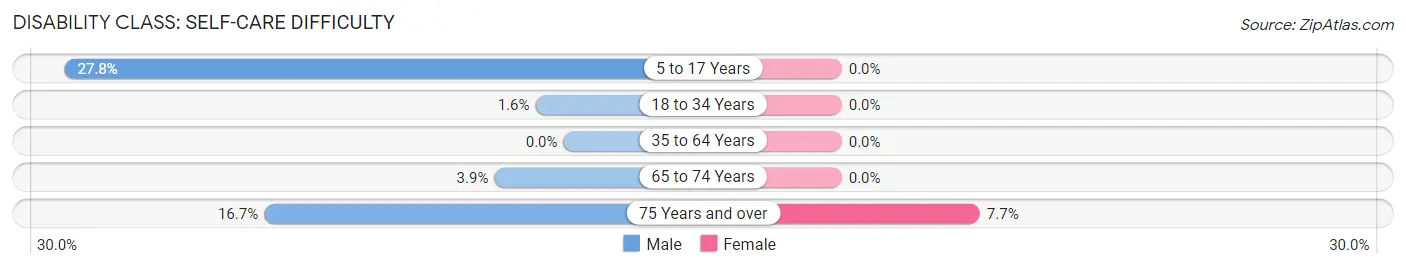
| Age Bracket | Male | Female |
| 5 to 17 Years | 35 (27.8%) | 0 (0.0%) |
| 18 to 34 Years | 1 (1.6%) | 0 (0.0%) |
| 35 to 64 Years | 0 (0.0%) | 0 (0.0%) |
| 65 to 74 Years | 1 (3.8%) | 0 (0.0%) |
| 75 Years and over | 3 (16.7%) | 2 (7.7%) |
Technology Access in Okeene
Computing Device Access in Okeene
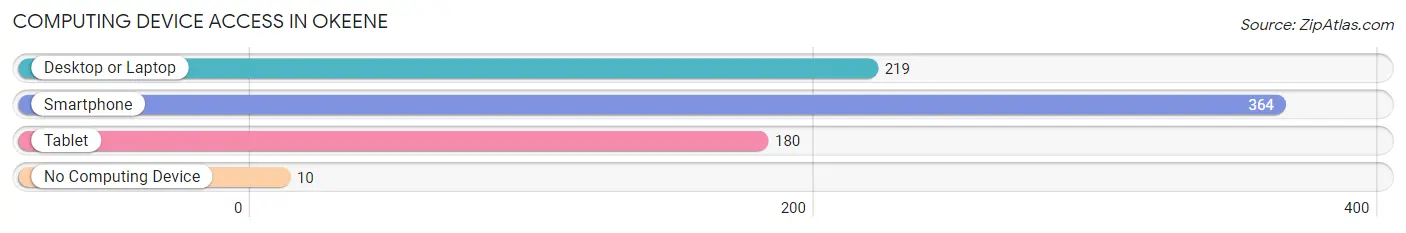
| Device Type | # Households | % Households |
| Desktop or Laptop | 219 | 55.7% |
| Smartphone | 364 | 92.6% |
| Tablet | 180 | 45.8% |
| No Computing Device | 10 | 2.5% |
| Total | 393 | 100.0% |
Internet Access in Okeene
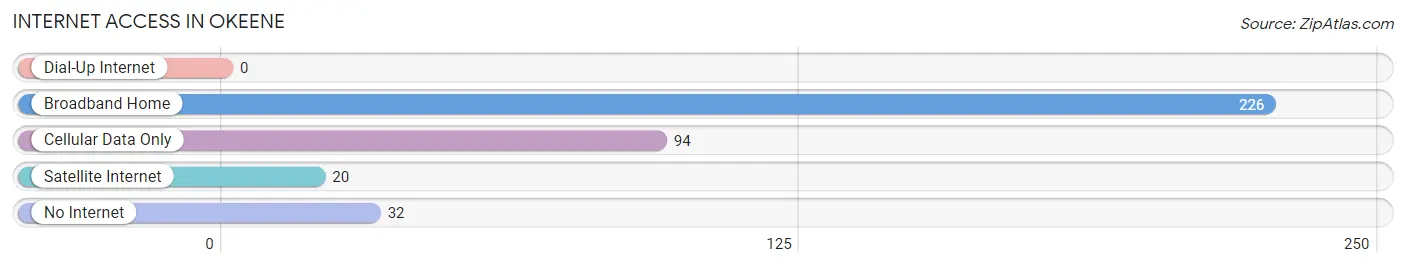
| Internet Type | # Households | % Households |
| Dial-Up Internet | 0 | 0.0% |
| Broadband Home | 226 | 57.5% |
| Cellular Data Only | 94 | 23.9% |
| Satellite Internet | 20 | 5.1% |
| No Internet | 32 | 8.1% |
| Total | 393 | 100.0% |
Okeene Summary
Okeene is a small town located in Blaine County, Oklahoma. It is situated in the western part of the state, approximately 70 miles northwest of Oklahoma City. The town was founded in 1901 and has a population of 1,521 as of the 2020 census.
History
Okeene was founded in 1901 by the Santa Fe Railroad. The town was named after the Okeene Indian tribe, which had lived in the area for centuries. The town was originally a stop on the railroad, but soon grew into a small farming community. The town was incorporated in 1907 and the first mayor was elected in 1908.
In the early 1900s, Okeene was a thriving agricultural community. The town was home to several grain elevators, a cotton gin, and a flour mill. The town also had a bank, a hotel, and several stores.
In the 1920s, the town began to decline as the railroad moved its operations elsewhere. The Great Depression further hurt the town's economy, and many of the businesses closed. The town was able to survive, however, and in the 1940s, the town began to experience a resurgence.
Geography
Okeene is located in western Oklahoma, approximately 70 miles northwest of Oklahoma City. The town is situated in Blaine County, and is surrounded by rolling hills and prairies. The town is located on the banks of the North Canadian River, which provides a source of water for the town.
The town has a total area of 1.2 square miles, all of which is land. The town has an elevation of 1,072 feet above sea level.
Economy
Okeene's economy is largely based on agriculture. The town is home to several grain elevators, a cotton gin, and a flour mill. The town also has several businesses, including a bank, a hotel, and several stores.
The town is also home to several manufacturing companies, including a furniture factory and a metal fabrication plant. The town is also home to a wind farm, which provides electricity to the town.
Demographics
As of the 2020 census, Okeene had a population of 1,521. The town has a median age of 39.7 years, and a median household income of $41,944. The town is predominantly white, with a population that is 94.3% white, 1.2% Native American, 0.7% Asian, 0.2% African American, and 3.6% other.
The town has a poverty rate of 16.3%, and a high school graduation rate of 87.3%. The town is served by the Okeene Public School District, which has one elementary school, one middle school, and one high school.
Conclusion
Okeene is a small town located in western Oklahoma. The town was founded in 1901 and has a population of 1,521 as of the 2020 census. The town's economy is largely based on agriculture, and the town is home to several manufacturing companies. The town is predominantly white, with a median age of 39.7 years and a median household income of $41,944. Okeene is served by the Okeene Public School District, which has one elementary school, one middle school, and one high school.
Common Questions
What is Per Capita Income in Okeene?
Per Capita income in Okeene is $22,237.
What is the Median Family Income in Okeene?
Median Family Income in Okeene is $50,938.
What is the Median Household income in Okeene?
Median Household Income in Okeene is $53,021.
What is Income or Wage Gap in Okeene?
Income or Wage Gap in Okeene is 33.5%.
Women in Okeene earn 66.5 cents for every dollar earned by a man.
What is Inequality or Gini Index in Okeene?
Inequality or Gini Index in Okeene is 0.39.
What is the Total Population of Okeene?
Total Population of Okeene is 1,044.
What is the Total Male Population of Okeene?
Total Male Population of Okeene is 447.
What is the Total Female Population of Okeene?
Total Female Population of Okeene is 597.
What is the Ratio of Males per 100 Females in Okeene?
There are 74.87 Males per 100 Females in Okeene.
What is the Ratio of Females per 100 Males in Okeene?
There are 133.56 Females per 100 Males in Okeene.
What is the Median Population Age in Okeene?
Median Population Age in Okeene is 29.7 Years.
What is the Average Family Size in Okeene
Average Family Size in Okeene is 3.3 People.
What is the Average Household Size in Okeene
Average Household Size in Okeene is 2.5 People.
How Large is the Labor Force in Okeene?
There are 462 People in the Labor Forcein in Okeene.
What is the Percentage of People in the Labor Force in Okeene?
65.6% of People are in the Labor Force in Okeene.
What is the Unemployment Rate in Okeene?
Unemployment Rate in Okeene is 9.7%.