Coalgate, OK Map & Demographics
Coalgate Map
Coalgate Overview
$24,377
PER CAPITA INCOME
$47,083
AVG FAMILY INCOME
$36,019
AVG HOUSEHOLD INCOME
7.6%
WAGE / INCOME GAP [ % ]
92.4¢/ $1
WAGE / INCOME GAP [ $ ]
0.54
INEQUALITY / GINI INDEX
1,886
TOTAL POPULATION
948
MALE POPULATION
938
FEMALE POPULATION
101.07
MALES / 100 FEMALES
98.95
FEMALES / 100 MALES
38.4
MEDIAN AGE
3.1
AVG FAMILY SIZE
2.5
AVG HOUSEHOLD SIZE
803
LABOR FORCE [ PEOPLE ]
52.6%
PERCENT IN LABOR FORCE
8.8%
UNEMPLOYMENT RATE
Coalgate Zip Codes
Coalgate Area Codes
Income in Coalgate
Income Overview in Coalgate
Per Capita Income in Coalgate is $24,377, while median incomes of families and households are $47,083 and $36,019 respectively.
| Characteristic | Number | Measure |
| Per Capita Income | 1,886 | $24,377 |
| Median Family Income | 432 | $47,083 |
| Mean Family Income | 432 | $75,821 |
| Median Household Income | 728 | $36,019 |
| Mean Household Income | 728 | $61,862 |
| Income Deficit | 432 | $0 |
| Wage / Income Gap (%) | 1,886 | 7.62% |
| Wage / Income Gap ($) | 1,886 | 92.38¢ per $1 |
| Gini / Inequality Index | 1,886 | 0.54 |
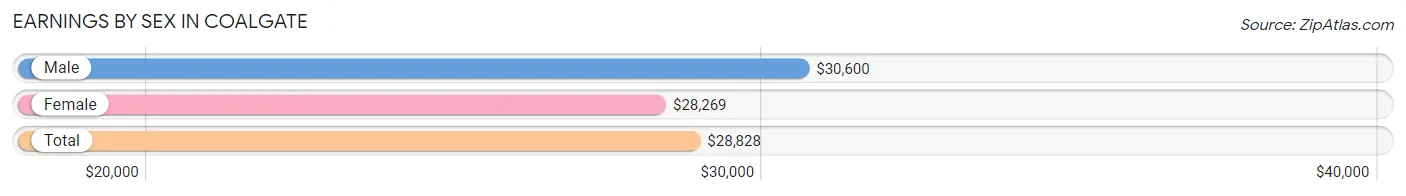
Earnings by Sex in Coalgate
Average Earnings in Coalgate are $28,828, $30,600 for men and $28,269 for women, a difference of 7.6%.
| Sex | Number | Average Earnings |
| Male | 422 (51.1%) | $30,600 |
| Female | 404 (48.9%) | $28,269 |
| Total | 826 (100.0%) | $28,828 |
Earnings by Sex by Income Bracket in Coalgate
The most common earnings brackets in Coalgate are $45,000 to $49,999 for men (50 | 11.8%) and $25,000 to $29,999 for women (71 | 17.6%).

| Income | Male | Female |
| $2,499 or less | 20 (4.7%) | 14 (3.5%) |
| $2,500 to $4,999 | 21 (5.0%) | 28 (6.9%) |
| $5,000 to $7,499 | 23 (5.4%) | 16 (4.0%) |
| $7,500 to $9,999 | 6 (1.4%) | 22 (5.4%) |
| $10,000 to $12,499 | 27 (6.4%) | 13 (3.2%) |
| $12,500 to $14,999 | 45 (10.7%) | 7 (1.7%) |
| $15,000 to $17,499 | 36 (8.5%) | 16 (4.0%) |
| $17,500 to $19,999 | 5 (1.2%) | 10 (2.5%) |
| $20,000 to $22,499 | 5 (1.2%) | 25 (6.2%) |
| $22,500 to $24,999 | 5 (1.2%) | 16 (4.0%) |
| $25,000 to $29,999 | 12 (2.8%) | 71 (17.6%) |
| $30,000 to $34,999 | 48 (11.4%) | 30 (7.4%) |
| $35,000 to $39,999 | 4 (0.9%) | 67 (16.6%) |
| $40,000 to $44,999 | 17 (4.0%) | 12 (3.0%) |
| $45,000 to $49,999 | 50 (11.8%) | 7 (1.7%) |
| $50,000 to $54,999 | 8 (1.9%) | 13 (3.2%) |
| $55,000 to $64,999 | 19 (4.5%) | 19 (4.7%) |
| $65,000 to $74,999 | 29 (6.9%) | 5 (1.2%) |
| $75,000 to $99,999 | 16 (3.8%) | 4 (1.0%) |
| $100,000+ | 26 (6.2%) | 9 (2.2%) |
| Total | 422 (100.0%) | 404 (100.0%) |
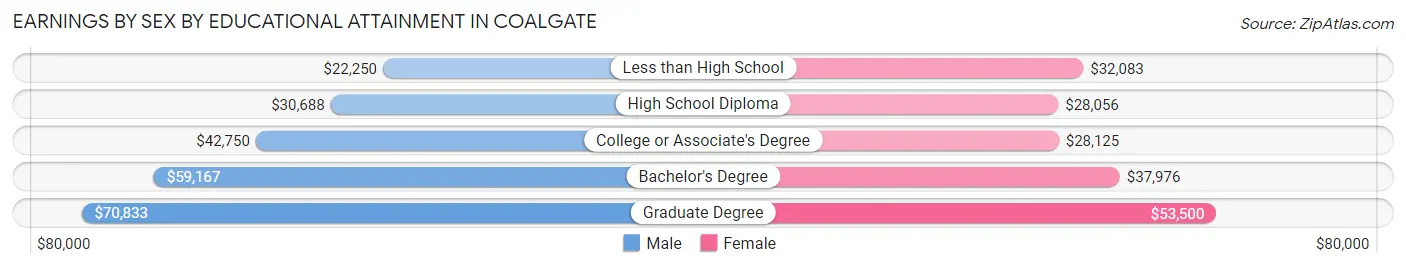
Earnings by Sex by Educational Attainment in Coalgate
Average earnings in Coalgate are $33,587 for men and $29,399 for women, a difference of 12.5%. Men with an educational attainment of graduate degree enjoy the highest average annual earnings of $70,833, while those with less than high school education earn the least with $22,250. Women with an educational attainment of graduate degree earn the most with the average annual earnings of $53,500, while those with high school diploma education have the smallest earnings of $28,056.
| Educational Attainment | Male Income | Female Income |
| Less than High School | $22,250 | $32,083 |
| High School Diploma | $30,688 | $28,056 |
| College or Associate's Degree | $42,750 | $28,125 |
| Bachelor's Degree | $59,167 | $37,976 |
| Graduate Degree | $70,833 | $53,500 |
| Total | $33,587 | $29,399 |
Family Income in Coalgate
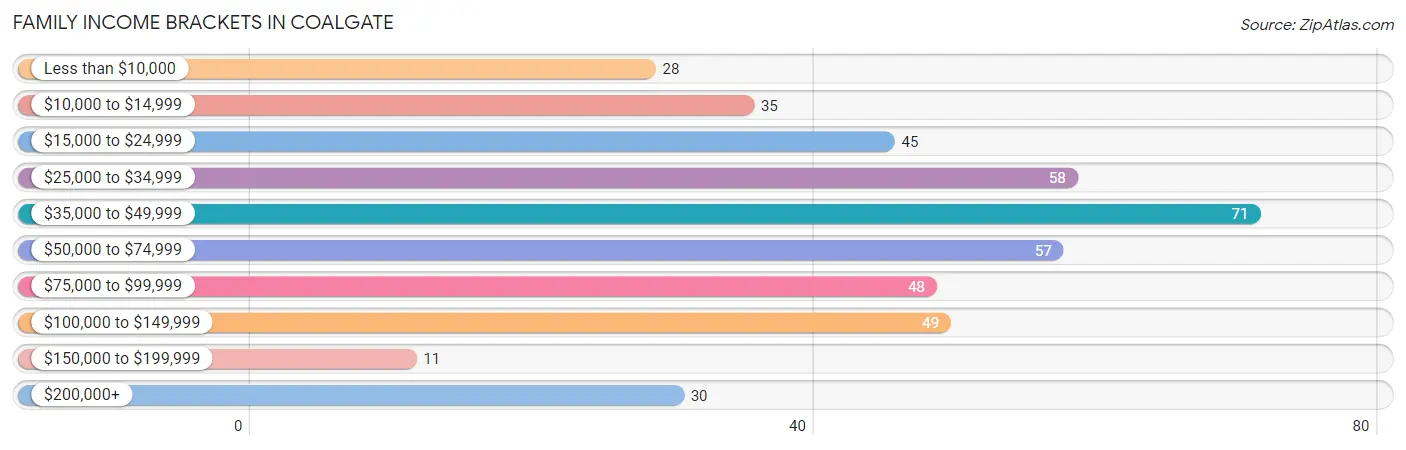
Family Income Brackets in Coalgate
According to the Coalgate family income data, there are 71 families falling into the $35,000 to $49,999 income range, which is the most common income bracket and makes up 16.4% of all families. Conversely, the $150,000 to $199,999 income bracket is the least frequent group with only 11 families (2.5%) belonging to this category.
| Income Bracket | # Families | % Families |
| Less than $10,000 | 28 | 6.5% |
| $10,000 to $14,999 | 35 | 8.1% |
| $15,000 to $24,999 | 45 | 10.4% |
| $25,000 to $34,999 | 58 | 13.4% |
| $35,000 to $49,999 | 71 | 16.4% |
| $50,000 to $74,999 | 57 | 13.2% |
| $75,000 to $99,999 | 48 | 11.1% |
| $100,000 to $149,999 | 49 | 11.3% |
| $150,000 to $199,999 | 11 | 2.5% |
| $200,000+ | 30 | 6.9% |
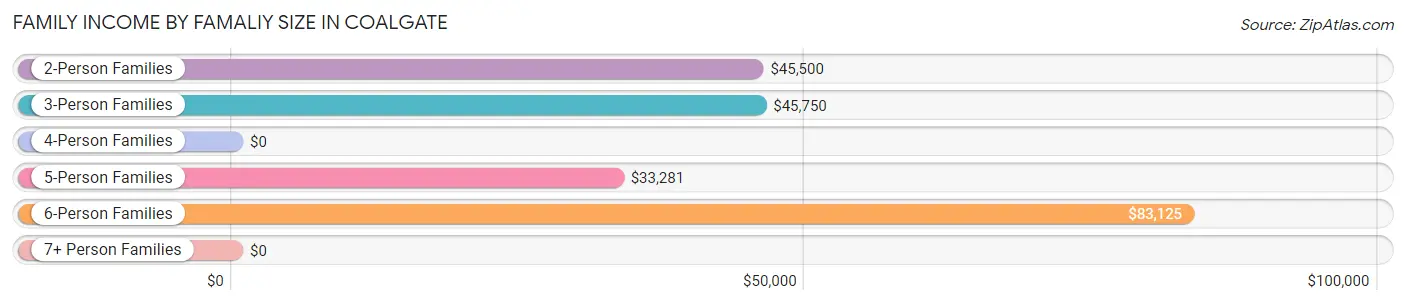
Family Income by Famaliy Size in Coalgate
6-person families (23 | 5.3%) account for the highest median family income in Coalgate with $83,125 per family, while 2-person families (212 | 49.1%) have the highest median income of $22,750 per family member.
| Income Bracket | # Families | Median Income |
| 2-Person Families | 212 (49.1%) | $45,500 |
| 3-Person Families | 99 (22.9%) | $45,750 |
| 4-Person Families | 69 (16.0%) | $0 |
| 5-Person Families | 25 (5.8%) | $33,281 |
| 6-Person Families | 23 (5.3%) | $83,125 |
| 7+ Person Families | 4 (0.9%) | $0 |
| Total | 432 (100.0%) | $47,083 |
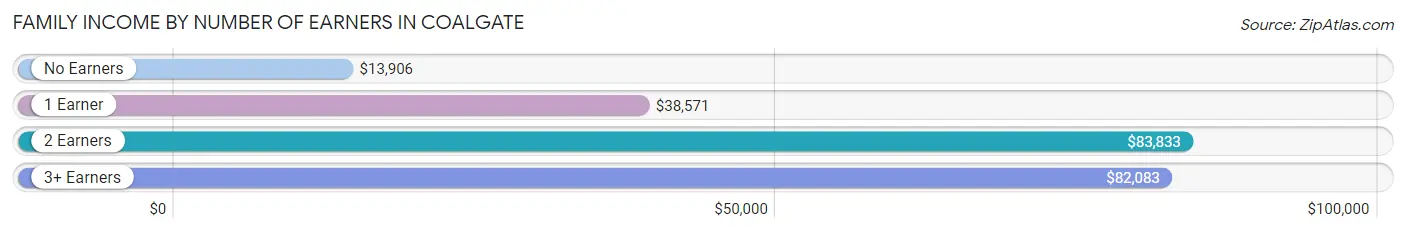
Family Income by Number of Earners in Coalgate
The median family income in Coalgate is $47,083, with families comprising 2 earners (114) having the highest median family income of $83,833, while families with no earners (87) have the lowest median family income of $13,906, accounting for 26.4% and 20.1% of families, respectively.
| Number of Earners | # Families | Median Income |
| No Earners | 87 (20.1%) | $13,906 |
| 1 Earner | 202 (46.8%) | $38,571 |
| 2 Earners | 114 (26.4%) | $83,833 |
| 3+ Earners | 29 (6.7%) | $82,083 |
| Total | 432 (100.0%) | $47,083 |
Household Income in Coalgate
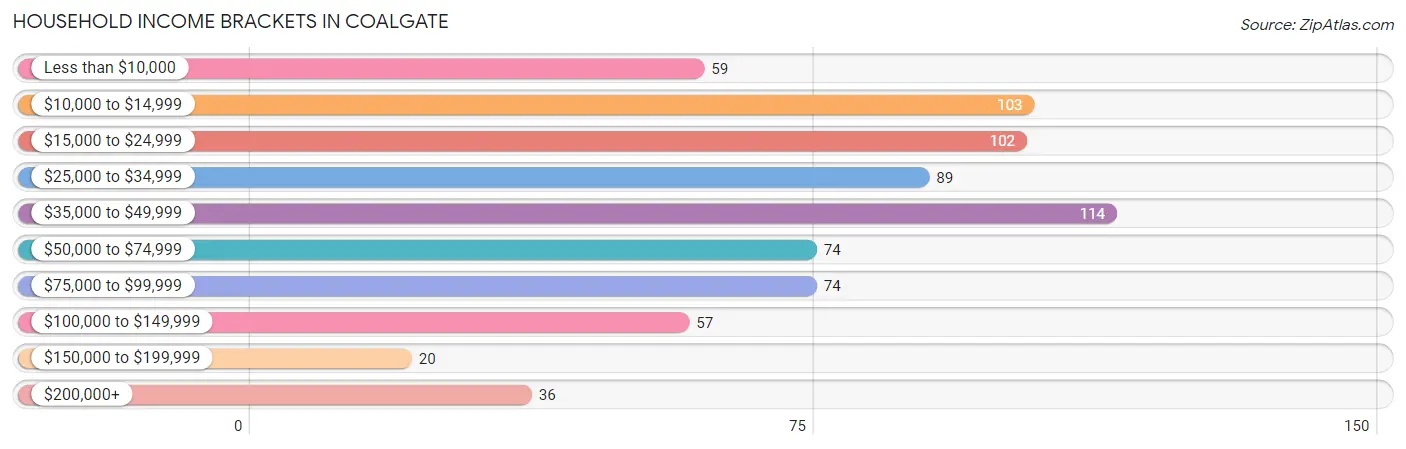
Household Income Brackets in Coalgate
With 114 households falling in the category, the $35,000 to $49,999 income range is the most frequent in Coalgate, accounting for 15.7% of all households. In contrast, only 20 households (2.8%) fall into the $150,000 to $199,999 income bracket, making it the least populous group.
| Income Bracket | # Households | % Households |
| Less than $10,000 | 59 | 8.1% |
| $10,000 to $14,999 | 103 | 14.1% |
| $15,000 to $24,999 | 102 | 14.0% |
| $25,000 to $34,999 | 89 | 12.2% |
| $35,000 to $49,999 | 114 | 15.7% |
| $50,000 to $74,999 | 74 | 10.2% |
| $75,000 to $99,999 | 74 | 10.2% |
| $100,000 to $149,999 | 57 | 7.8% |
| $150,000 to $199,999 | 20 | 2.7% |
| $200,000+ | 36 | 4.9% |
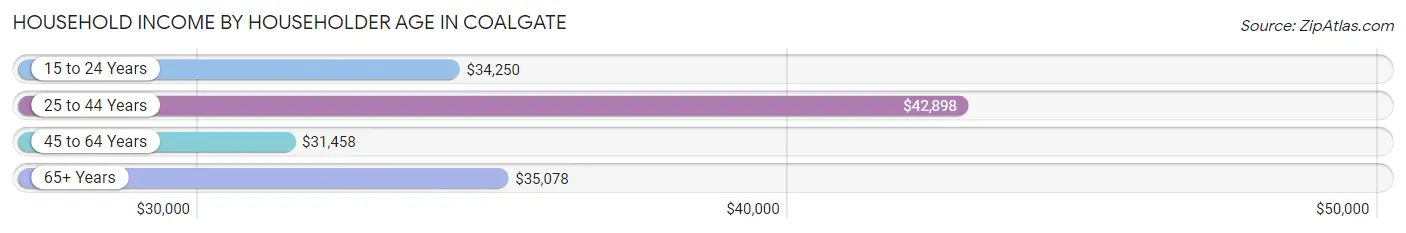
Household Income by Householder Age in Coalgate
The median household income in Coalgate is $36,019, with the highest median household income of $42,898 found in the 25 to 44 years age bracket for the primary householder. A total of 231 households (31.7%) fall into this category. Meanwhile, the 45 to 64 years age bracket for the primary householder has the lowest median household income of $31,458, with 245 households (33.7%) in this group.
| Income Bracket | # Households | Median Income |
| 15 to 24 Years | 39 (5.4%) | $34,250 |
| 25 to 44 Years | 231 (31.7%) | $42,898 |
| 45 to 64 Years | 245 (33.7%) | $31,458 |
| 65+ Years | 213 (29.3%) | $35,078 |
| Total | 728 (100.0%) | $36,019 |
Poverty in Coalgate
Income Below Poverty by Sex and Age in Coalgate
With 36.0% poverty level for males and 32.8% for females among the residents of Coalgate, 12 to 14 year old males and 15 year old females are the most vulnerable to poverty, with 36 males (66.7%) and 3 females (100.0%) in their respective age groups living below the poverty level.
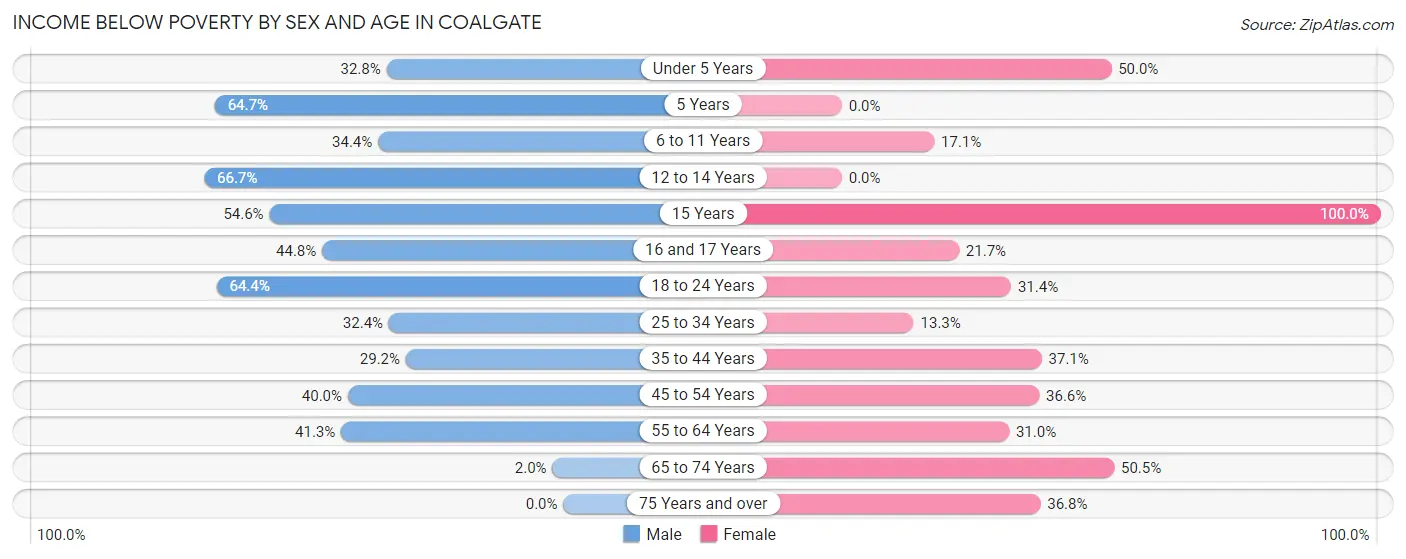
| Age Bracket | Male | Female |
| Under 5 Years | 21 (32.8%) | 34 (50.0%) |
| 5 Years | 11 (64.7%) | 0 (0.0%) |
| 6 to 11 Years | 22 (34.4%) | 6 (17.1%) |
| 12 to 14 Years | 36 (66.7%) | 0 (0.0%) |
| 15 Years | 6 (54.5%) | 3 (100.0%) |
| 16 and 17 Years | 30 (44.8%) | 5 (21.7%) |
| 18 to 24 Years | 56 (64.4%) | 27 (31.4%) |
| 25 to 34 Years | 34 (32.4%) | 14 (13.3%) |
| 35 to 44 Years | 38 (29.2%) | 56 (37.1%) |
| 45 to 54 Years | 48 (40.0%) | 26 (36.6%) |
| 55 to 64 Years | 33 (41.2%) | 36 (31.0%) |
| 65 to 74 Years | 2 (2.0%) | 47 (50.5%) |
| 75 Years and over | 0 (0.0%) | 35 (36.8%) |
| Total | 337 (36.0%) | 289 (32.8%) |
Income Above Poverty by Sex and Age in Coalgate
According to the poverty statistics in Coalgate, males aged 75 years and over and females aged 5 years are the age groups that are most secure financially, with 100.0% of males and 100.0% of females in these age groups living above the poverty line.
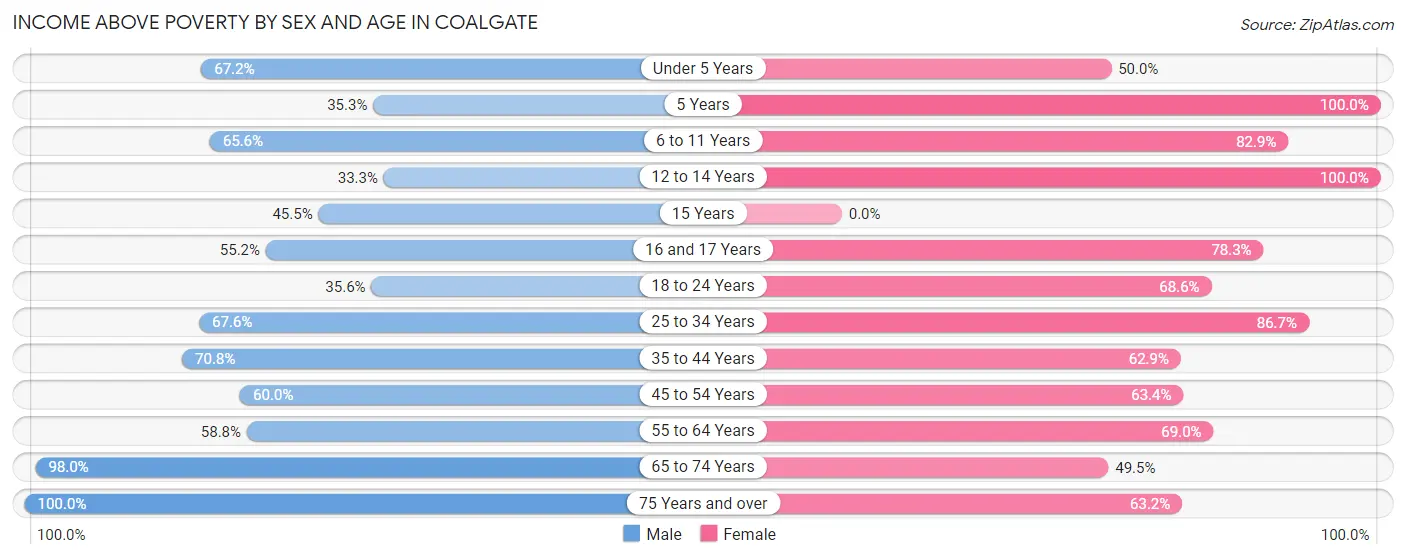
| Age Bracket | Male | Female |
| Under 5 Years | 43 (67.2%) | 34 (50.0%) |
| 5 Years | 6 (35.3%) | 9 (100.0%) |
| 6 to 11 Years | 42 (65.6%) | 29 (82.9%) |
| 12 to 14 Years | 18 (33.3%) | 25 (100.0%) |
| 15 Years | 5 (45.5%) | 0 (0.0%) |
| 16 and 17 Years | 37 (55.2%) | 18 (78.3%) |
| 18 to 24 Years | 31 (35.6%) | 59 (68.6%) |
| 25 to 34 Years | 71 (67.6%) | 91 (86.7%) |
| 35 to 44 Years | 92 (70.8%) | 95 (62.9%) |
| 45 to 54 Years | 72 (60.0%) | 45 (63.4%) |
| 55 to 64 Years | 47 (58.8%) | 80 (69.0%) |
| 65 to 74 Years | 97 (98.0%) | 46 (49.5%) |
| 75 Years and over | 37 (100.0%) | 60 (63.2%) |
| Total | 598 (64.0%) | 591 (67.2%) |
Income Below Poverty Among Married-Couple Families in Coalgate
The poverty statistics for married-couple families in Coalgate show that 12.9% or 35 of the total 271 families live below the poverty line. Families with 1 or 2 children have the highest poverty rate of 20.5%, comprising of 15 families. On the other hand, families with 3 or 4 children have the lowest poverty rate of 0.0%, which includes 0 families.
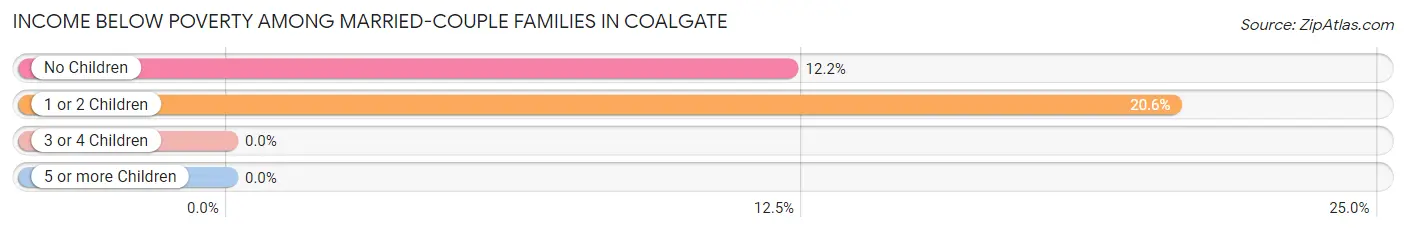
| Children | Above Poverty | Below Poverty |
| No Children | 144 (87.8%) | 20 (12.2%) |
| 1 or 2 Children | 58 (79.4%) | 15 (20.5%) |
| 3 or 4 Children | 34 (100.0%) | 0 (0.0%) |
| 5 or more Children | 0 (0.0%) | 0 (0.0%) |
| Total | 236 (87.1%) | 35 (12.9%) |
Income Below Poverty Among Single-Parent Households in Coalgate
According to the poverty data in Coalgate, 31.0% or 9 single-father households and 52.3% or 69 single-mother households are living below the poverty line. Among single-father households, those with 3 or 4 children have the highest poverty rate, with 5 households (100.0%) experiencing poverty. Likewise, among single-mother households, those with 3 or 4 children have the highest poverty rate, with 18 households (69.2%) falling below the poverty line.
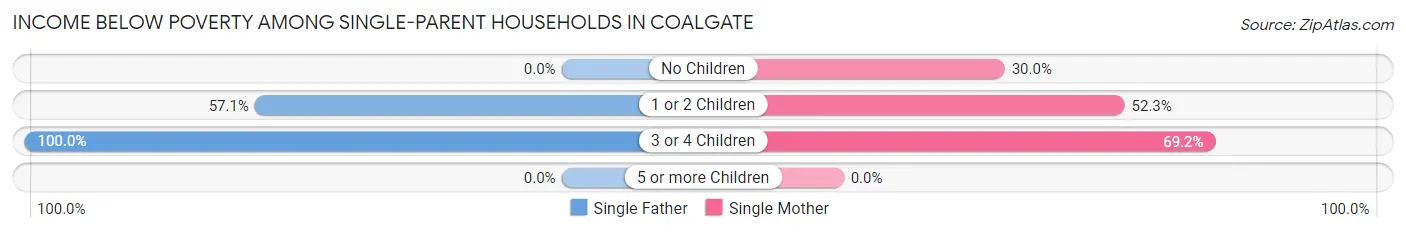
| Children | Single Father | Single Mother |
| No Children | 0 (0.0%) | 6 (30.0%) |
| 1 or 2 Children | 4 (57.1%) | 45 (52.3%) |
| 3 or 4 Children | 5 (100.0%) | 18 (69.2%) |
| 5 or more Children | 0 (0.0%) | 0 (0.0%) |
| Total | 9 (31.0%) | 69 (52.3%) |
Income Below Poverty Among Married-Couple vs Single-Parent Households in Coalgate
The poverty data for Coalgate shows that 35 of the married-couple family households (12.9%) and 78 of the single-parent households (48.4%) are living below the poverty level. Within the married-couple family households, those with 1 or 2 children have the highest poverty rate, with 15 households (20.5%) falling below the poverty line. Among the single-parent households, those with 3 or 4 children have the highest poverty rate, with 23 household (74.2%) living below poverty.
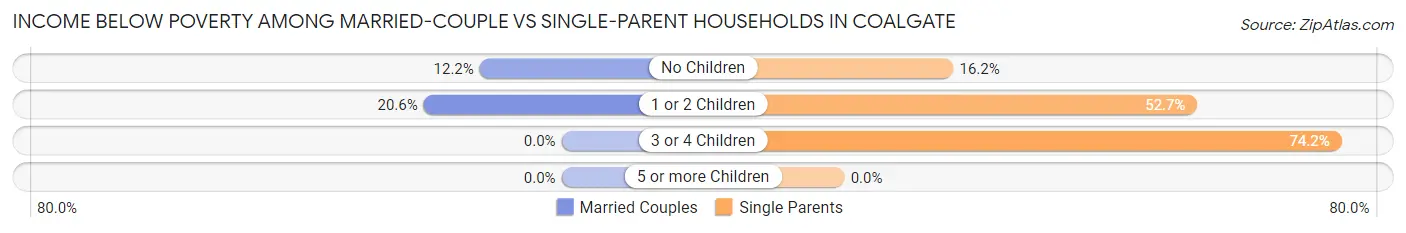
| Children | Married-Couple Families | Single-Parent Households |
| No Children | 20 (12.2%) | 6 (16.2%) |
| 1 or 2 Children | 15 (20.5%) | 49 (52.7%) |
| 3 or 4 Children | 0 (0.0%) | 23 (74.2%) |
| 5 or more Children | 0 (0.0%) | 0 (0.0%) |
| Total | 35 (12.9%) | 78 (48.4%) |
Race in Coalgate
The most populous races in Coalgate are White / Caucasian (1,076 | 57.1%), Two or more Races (520 | 27.6%), and Native / Alaskan (249 | 13.2%).
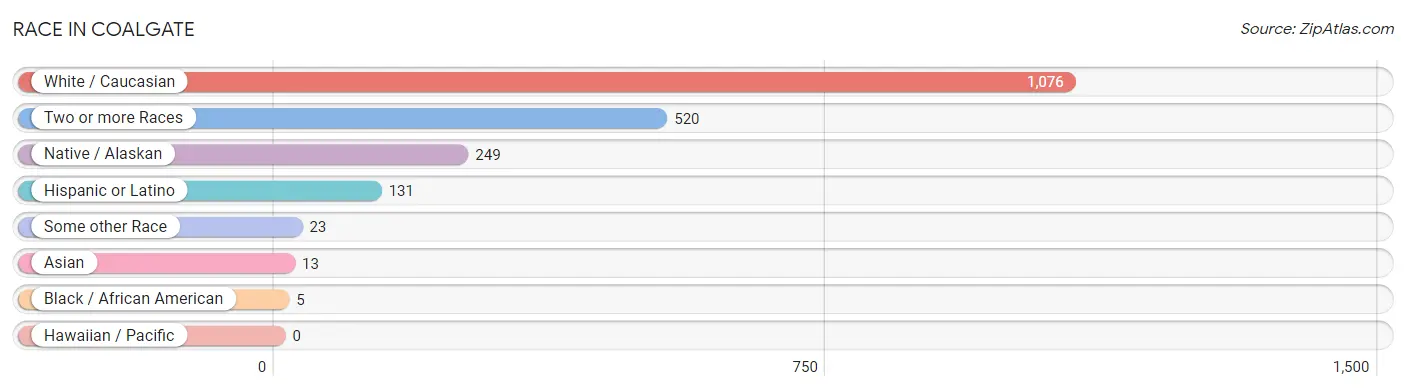
| Race | # Population | % Population |
| Asian | 13 | 0.7% |
| Black / African American | 5 | 0.3% |
| Hawaiian / Pacific | 0 | 0.0% |
| Hispanic or Latino | 131 | 7.0% |
| Native / Alaskan | 249 | 13.2% |
| White / Caucasian | 1,076 | 57.1% |
| Two or more Races | 520 | 27.6% |
| Some other Race | 23 | 1.2% |
| Total | 1,886 | 100.0% |
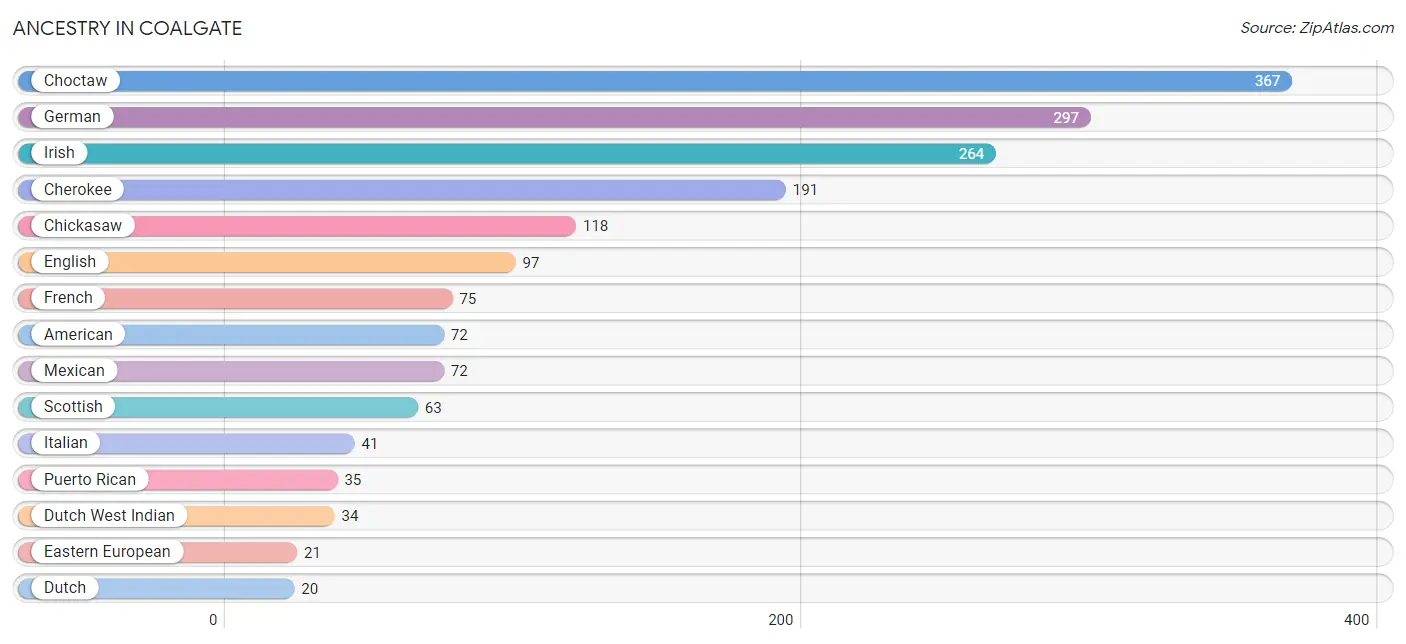
Ancestry in Coalgate
The most populous ancestries reported in Coalgate are Choctaw (367 | 19.5%), German (297 | 15.8%), Irish (264 | 14.0%), Cherokee (191 | 10.1%), and Chickasaw (118 | 6.3%), together accounting for 65.6% of all Coalgate residents.
| Ancestry | # Population | % Population |
| American | 72 | 3.8% |
| Apache | 8 | 0.4% |
| British | 3 | 0.2% |
| Central American | 18 | 0.9% |
| Cherokee | 191 | 10.1% |
| Chickasaw | 118 | 6.3% |
| Choctaw | 367 | 19.5% |
| Creek | 15 | 0.8% |
| Cuban | 6 | 0.3% |
| Danish | 5 | 0.3% |
| Dutch | 20 | 1.1% |
| Dutch West Indian | 34 | 1.8% |
| Eastern European | 21 | 1.1% |
| English | 97 | 5.1% |
| French | 75 | 4.0% |
| German | 297 | 15.8% |
| Irish | 264 | 14.0% |
| Italian | 41 | 2.2% |
| Mexican | 72 | 3.8% |
| Northern European | 4 | 0.2% |
| Norwegian | 9 | 0.5% |
| Polish | 6 | 0.3% |
| Portuguese | 4 | 0.2% |
| Potawatomi | 15 | 0.8% |
| Puerto Rican | 35 | 1.9% |
| Russian | 19 | 1.0% |
| Salvadoran | 18 | 0.9% |
| Scotch-Irish | 18 | 0.9% |
| Scottish | 63 | 3.3% |
| Seminole | 20 | 1.1% |
| Slovak | 15 | 0.8% |
| Sri Lankan | 13 | 0.7% |
| Swedish | 5 | 0.3% |
| Welsh | 10 | 0.5% | View All 34 Rows |
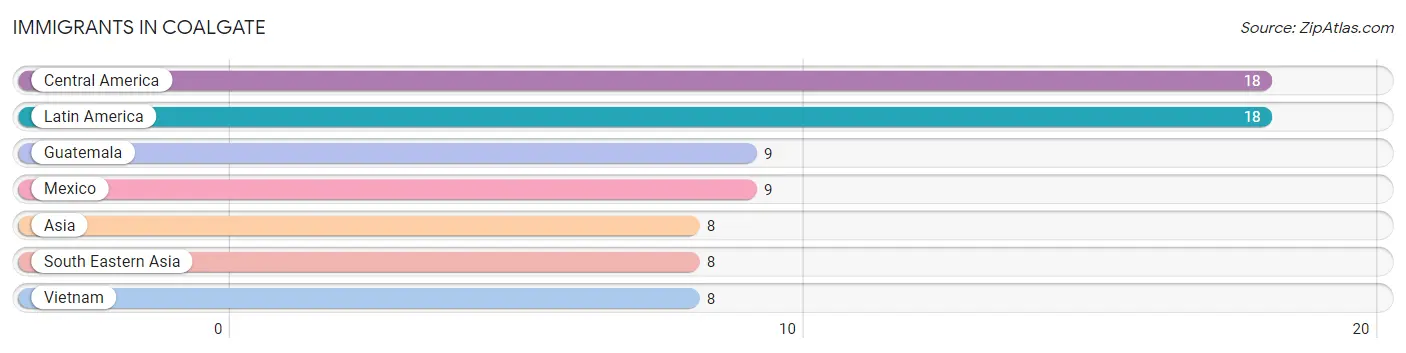
Immigrants in Coalgate
The most numerous immigrant groups reported in Coalgate came from Central America (18 | 0.9%), Latin America (18 | 0.9%), Guatemala (9 | 0.5%), Mexico (9 | 0.5%), and Asia (8 | 0.4%), together accounting for 3.3% of all Coalgate residents.
| Immigration Origin | # Population | % Population |
| Asia | 8 | 0.4% |
| Central America | 18 | 0.9% |
| Guatemala | 9 | 0.5% |
| Latin America | 18 | 0.9% |
| Mexico | 9 | 0.5% |
| South Eastern Asia | 8 | 0.4% |
| Vietnam | 8 | 0.4% | View All 7 Rows |
Sex and Age in Coalgate
Sex and Age in Coalgate
The most populous age groups in Coalgate are 15 to 19 Years (109 | 11.5%) for men and 25 to 29 Years (88 | 9.4%) for women.
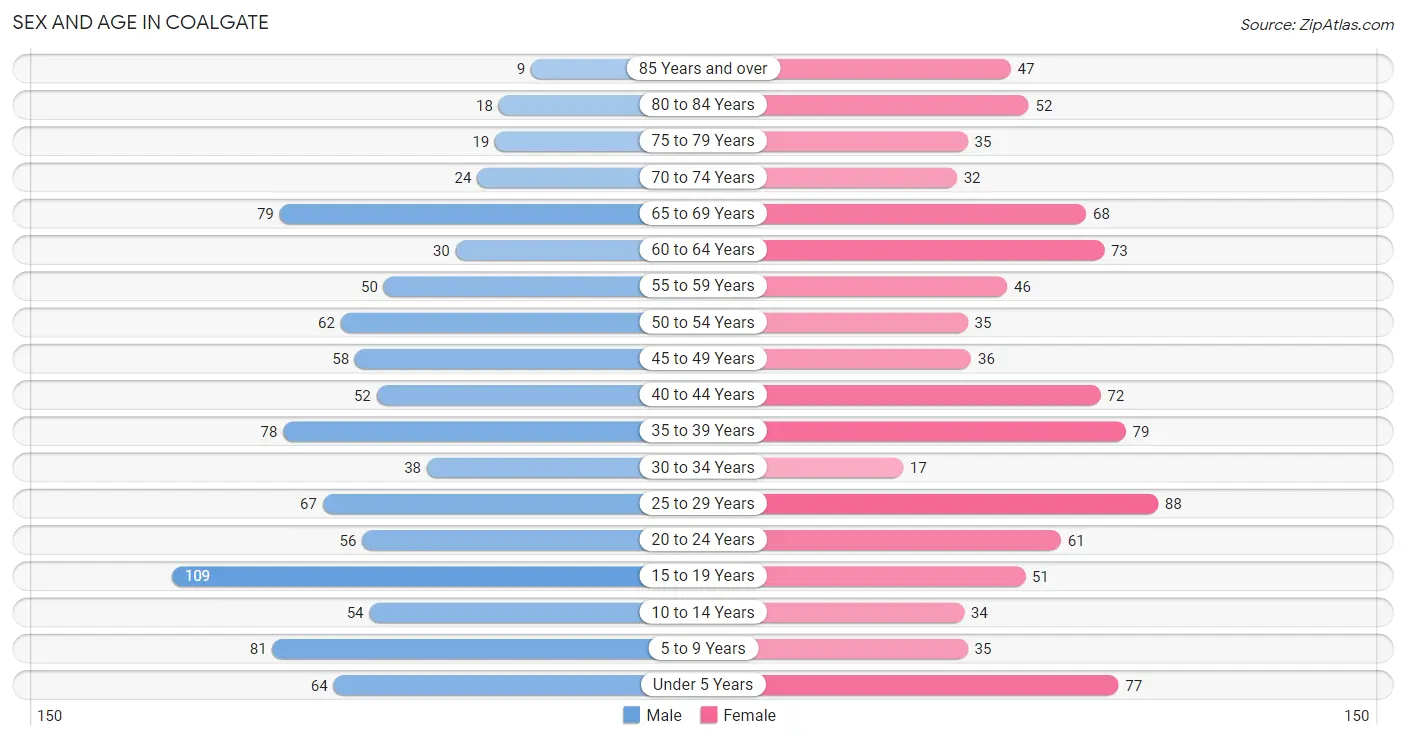
| Age Bracket | Male | Female |
| Under 5 Years | 64 (6.8%) | 77 (8.2%) |
| 5 to 9 Years | 81 (8.5%) | 35 (3.7%) |
| 10 to 14 Years | 54 (5.7%) | 34 (3.6%) |
| 15 to 19 Years | 109 (11.5%) | 51 (5.4%) |
| 20 to 24 Years | 56 (5.9%) | 61 (6.5%) |
| 25 to 29 Years | 67 (7.1%) | 88 (9.4%) |
| 30 to 34 Years | 38 (4.0%) | 17 (1.8%) |
| 35 to 39 Years | 78 (8.2%) | 79 (8.4%) |
| 40 to 44 Years | 52 (5.5%) | 72 (7.7%) |
| 45 to 49 Years | 58 (6.1%) | 36 (3.8%) |
| 50 to 54 Years | 62 (6.5%) | 35 (3.7%) |
| 55 to 59 Years | 50 (5.3%) | 46 (4.9%) |
| 60 to 64 Years | 30 (3.2%) | 73 (7.8%) |
| 65 to 69 Years | 79 (8.3%) | 68 (7.2%) |
| 70 to 74 Years | 24 (2.5%) | 32 (3.4%) |
| 75 to 79 Years | 19 (2.0%) | 35 (3.7%) |
| 80 to 84 Years | 18 (1.9%) | 52 (5.5%) |
| 85 Years and over | 9 (0.9%) | 47 (5.0%) |
| Total | 948 (100.0%) | 938 (100.0%) |
Families and Households in Coalgate
Median Family Size in Coalgate
The median family size in Coalgate is 3.09 persons per family, with married-couple families (271 | 62.7%) accounting for the largest median family size of 3.22 persons per family. On the other hand, single male/father families (29 | 6.7%) represent the smallest median family size with 2.86 persons per family.
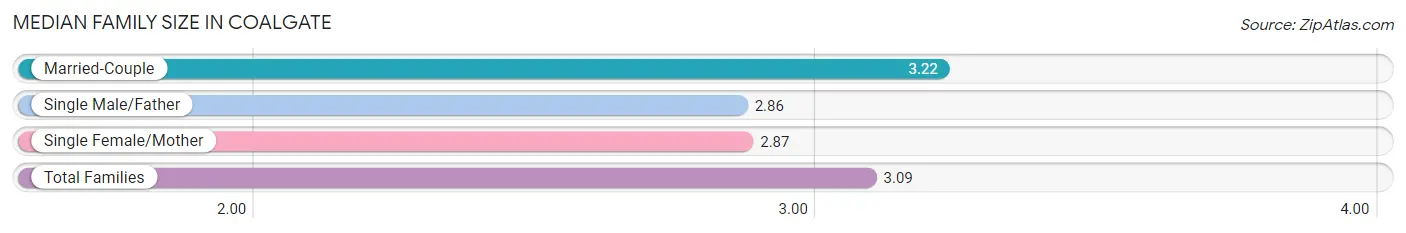
| Family Type | # Families | Family Size |
| Married-Couple | 271 (62.7%) | 3.22 |
| Single Male/Father | 29 (6.7%) | 2.86 |
| Single Female/Mother | 132 (30.6%) | 2.87 |
| Total Families | 432 (100.0%) | 3.09 |
Median Household Size in Coalgate
The median household size in Coalgate is 2.51 persons per household, with single male/father households (29 | 4.0%) accounting for the largest median household size of 3.62 persons per household. non-family households (296 | 40.7%) represent the smallest median household size with 1.34 persons per household.
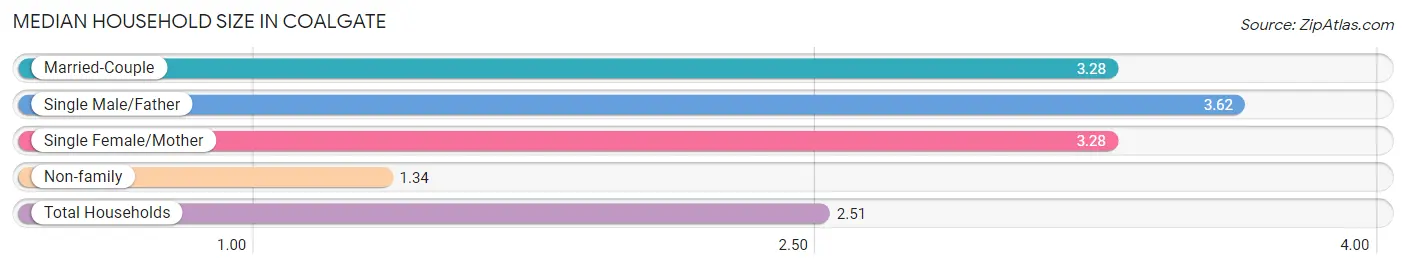
| Household Type | # Households | Household Size |
| Married-Couple | 271 (37.2%) | 3.28 |
| Single Male/Father | 29 (4.0%) | 3.62 |
| Single Female/Mother | 132 (18.1%) | 3.28 |
| Non-family | 296 (40.7%) | 1.34 |
| Total Households | 728 (100.0%) | 2.51 |
Household Size by Marriage Status in Coalgate
Out of a total of 728 households in Coalgate, 432 (59.3%) are family households, while 296 (40.7%) are nonfamily households. The most numerous type of family households are 2-person households, comprising 189, and the most common type of nonfamily households are 1-person households, comprising 251.
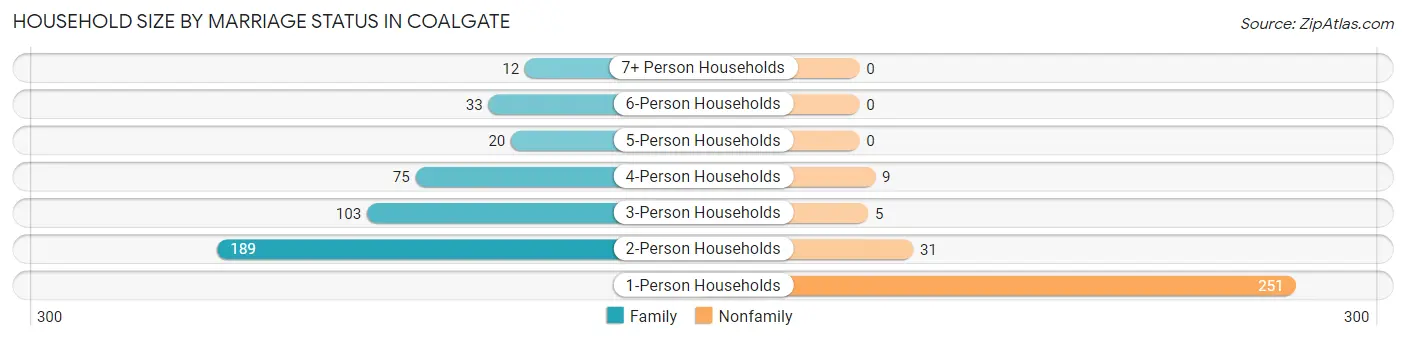
| Household Size | Family Households | Nonfamily Households |
| 1-Person Households | - | 251 (34.5%) |
| 2-Person Households | 189 (26.0%) | 31 (4.3%) |
| 3-Person Households | 103 (14.1%) | 5 (0.7%) |
| 4-Person Households | 75 (10.3%) | 9 (1.2%) |
| 5-Person Households | 20 (2.8%) | 0 (0.0%) |
| 6-Person Households | 33 (4.5%) | 0 (0.0%) |
| 7+ Person Households | 12 (1.7%) | 0 (0.0%) |
| Total | 432 (59.3%) | 296 (40.7%) |
Female Fertility in Coalgate
Fertility by Age in Coalgate
Average fertility rate in Coalgate is 105.0 births per 1,000 women. Women in the age bracket of 20 to 34 years have the highest fertility rate with 205.0 births per 1,000 women. Women in the age bracket of 20 to 34 years acount for 79.1% of all women with births.
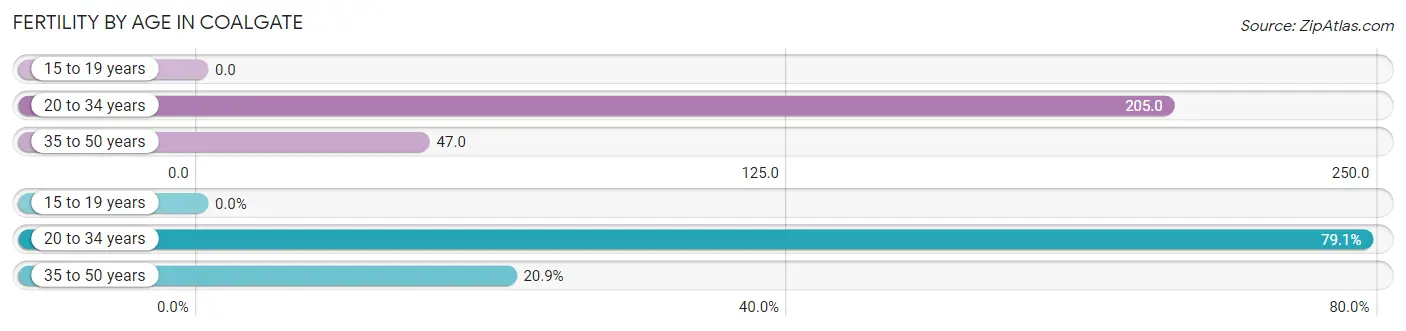
| Age Bracket | Women with Births | Births / 1,000 Women |
| 15 to 19 years | 0 (0.0%) | 0.0 |
| 20 to 34 years | 34 (79.1%) | 205.0 |
| 35 to 50 years | 9 (20.9%) | 47.0 |
| Total | 43 (100.0%) | 105.0 |
Fertility by Age by Marriage Status in Coalgate
23.3% of women with births (43) in Coalgate are married. The highest percentage of unmarried women with births falls into 20 to 34 years age bracket with 88.2% of them unmarried at the time of birth, while the lowest percentage of unmarried women with births belong to 35 to 50 years age bracket with 33.3% of them unmarried.
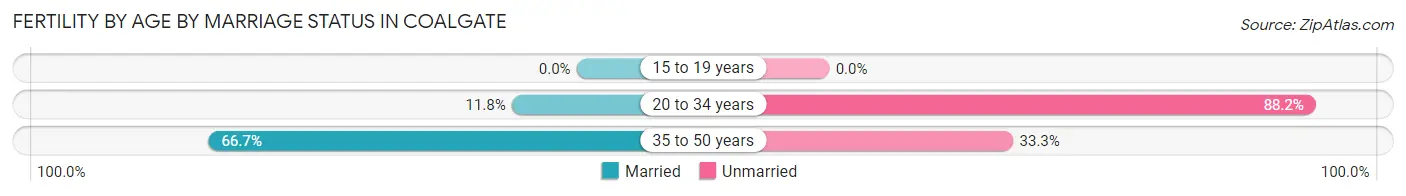
| Age Bracket | Married | Unmarried |
| 15 to 19 years | 0 (0.0%) | 0 (0.0%) |
| 20 to 34 years | 4 (11.8%) | 30 (88.2%) |
| 35 to 50 years | 6 (66.7%) | 3 (33.3%) |
| Total | 10 (23.3%) | 33 (76.7%) |
Fertility by Education in Coalgate
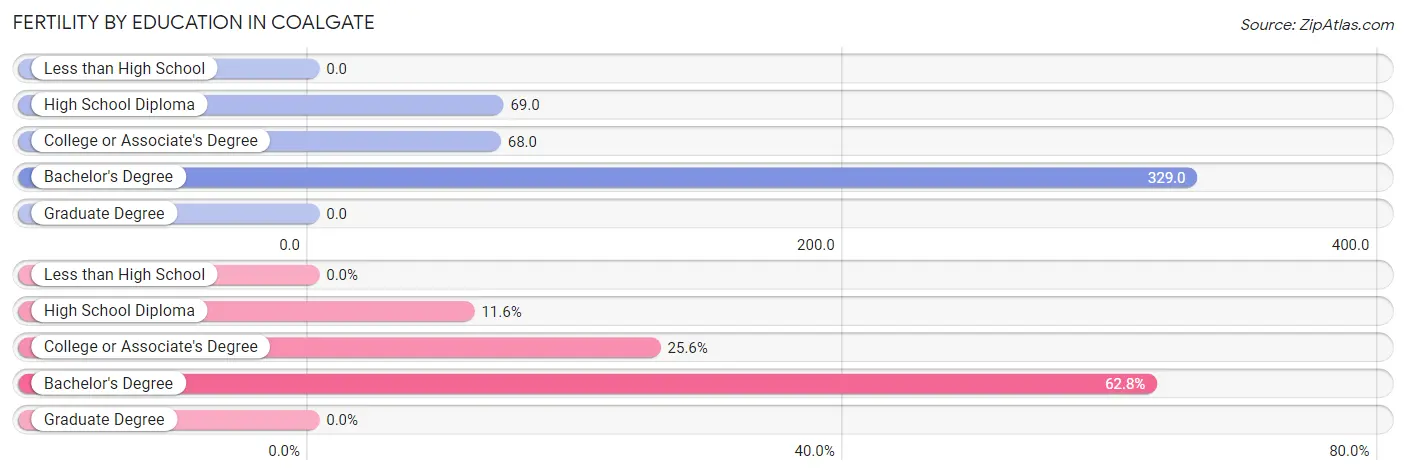
| Educational Attainment | Women with Births | Births / 1,000 Women |
| Less than High School | 0 (0.0%) | 0.0 |
| High School Diploma | 5 (11.6%) | 69.0 |
| College or Associate's Degree | 11 (25.6%) | 68.0 |
| Bachelor's Degree | 27 (62.8%) | 329.0 |
| Graduate Degree | 0 (0.0%) | 0.0 |
| Total | 43 (100.0%) | 105.0 |
Fertility by Education by Marriage Status in Coalgate
76.7% of women with births in Coalgate are unmarried. Women with the educational attainment of college or associate's degree are most likely to be married with 36.4% of them married at childbirth, while women with the educational attainment of high school diploma are least likely to be married with 100.0% of them unmarried at childbirth.
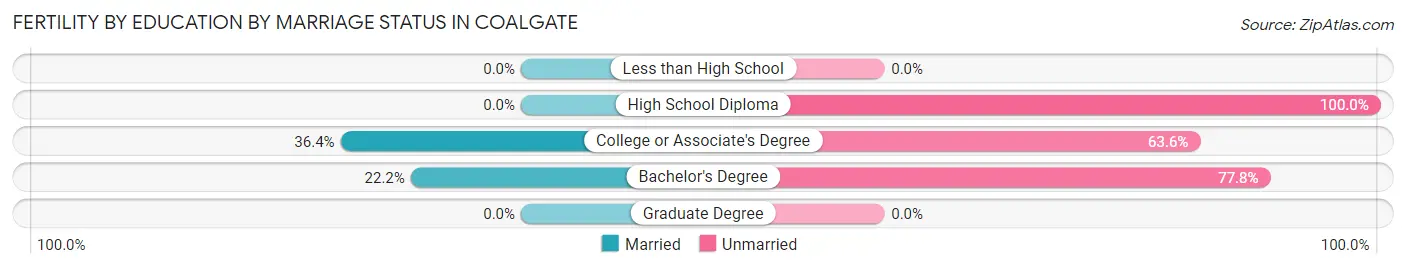
| Educational Attainment | Married | Unmarried |
| Less than High School | 0 (0.0%) | 0 (0.0%) |
| High School Diploma | 0 (0.0%) | 5 (100.0%) |
| College or Associate's Degree | 4 (36.4%) | 7 (63.6%) |
| Bachelor's Degree | 6 (22.2%) | 21 (77.8%) |
| Graduate Degree | 0 (0.0%) | 0 (0.0%) |
| Total | 10 (23.3%) | 33 (76.7%) |
Employment Characteristics in Coalgate
Employment by Class of Employer in Coalgate
Among the 702 employed individuals in Coalgate, private company employees (437 | 62.3%), local government employees (91 | 13.0%), and not-for-profit organizations (53 | 7.5%) make up the most common classes of employment.
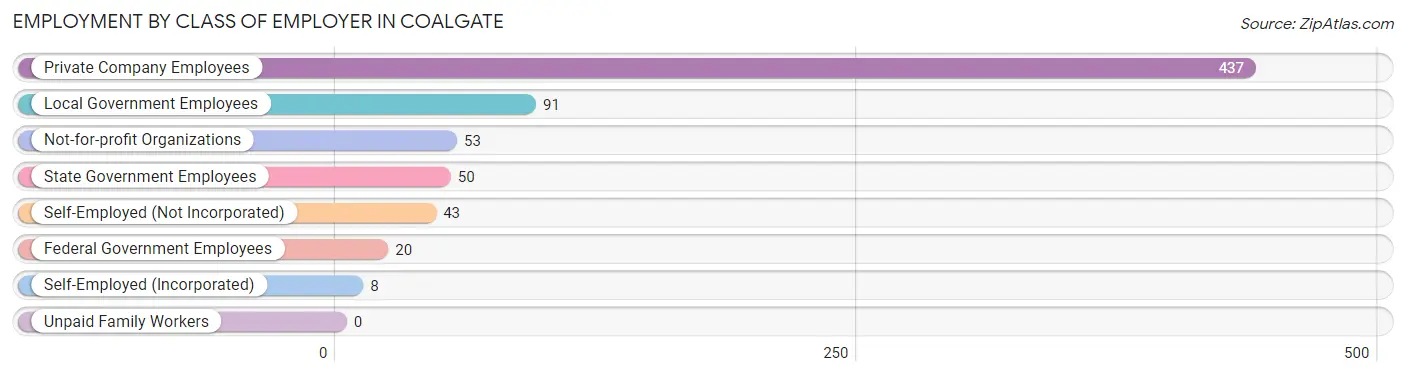
| Employer Class | # Employees | % Employees |
| Private Company Employees | 437 | 62.3% |
| Self-Employed (Incorporated) | 8 | 1.1% |
| Self-Employed (Not Incorporated) | 43 | 6.1% |
| Not-for-profit Organizations | 53 | 7.5% |
| Local Government Employees | 91 | 13.0% |
| State Government Employees | 50 | 7.1% |
| Federal Government Employees | 20 | 2.9% |
| Unpaid Family Workers | 0 | 0.0% |
| Total | 702 | 100.0% |
Employment Status by Age in Coalgate
According to the labor force statistics for Coalgate, out of the total population over 16 years of age (1,527), 52.6% or 803 individuals are in the labor force, with 8.8% or 71 of them unemployed. The age group with the highest labor force participation rate is 20 to 24 years, with 92.3% or 108 individuals in the labor force. Within the labor force, the 20 to 24 years age range has the highest percentage of unemployed individuals, with 25.0% or 27 of them being unemployed.
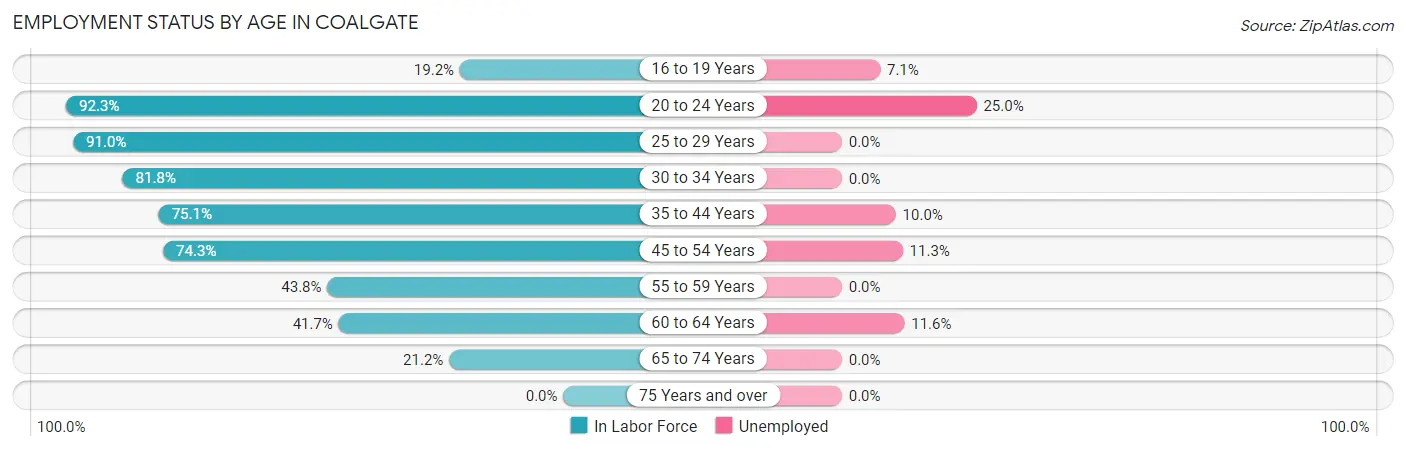
| Age Bracket | In Labor Force | Unemployed |
| 16 to 19 Years | 28 (19.2%) | 2 (7.1%) |
| 20 to 24 Years | 108 (92.3%) | 27 (25.0%) |
| 25 to 29 Years | 141 (91.0%) | 0 (0.0%) |
| 30 to 34 Years | 45 (81.8%) | 0 (0.0%) |
| 35 to 44 Years | 211 (75.1%) | 21 (10.0%) |
| 45 to 54 Years | 142 (74.3%) | 16 (11.3%) |
| 55 to 59 Years | 42 (43.8%) | 0 (0.0%) |
| 60 to 64 Years | 43 (41.7%) | 5 (11.6%) |
| 65 to 74 Years | 43 (21.2%) | 0 (0.0%) |
| 75 Years and over | 0 (0.0%) | 0 (0.0%) |
| Total | 803 (52.6%) | 71 (8.8%) |
Employment Status by Educational Attainment in Coalgate
According to labor force statistics for Coalgate, 70.8% of individuals (624) out of the total population between 25 and 64 years of age (881) are in the labor force, with 6.7% or 42 of them being unemployed. The group with the highest labor force participation rate are those with the educational attainment of bachelor's degree or higher, with 83.4% or 121 individuals in the labor force. Within the labor force, individuals with less than high school education have the highest percentage of unemployment, with 17.5% or 17 of them being unemployed.
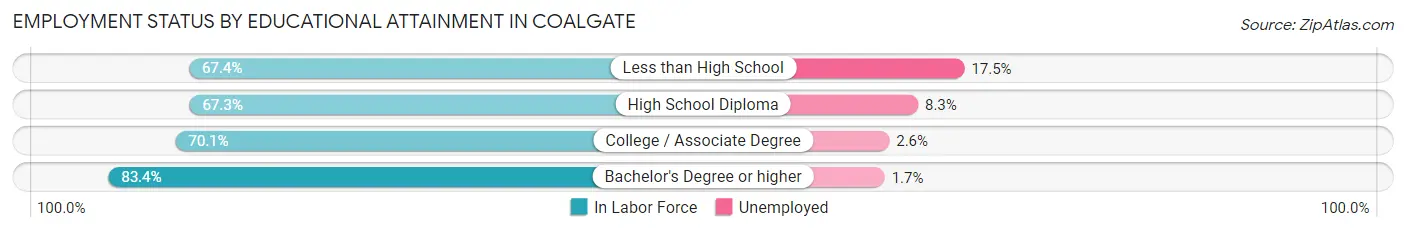
| Educational Attainment | In Labor Force | Unemployed |
| Less than High School | 97 (67.4%) | 25 (17.5%) |
| High School Diploma | 216 (67.3%) | 27 (8.3%) |
| College / Associate Degree | 190 (70.1%) | 7 (2.6%) |
| Bachelor's Degree or higher | 121 (83.4%) | 2 (1.7%) |
| Total | 624 (70.8%) | 59 (6.7%) |
Employment Occupations by Sex in Coalgate
Management, Business, Science and Arts Occupations
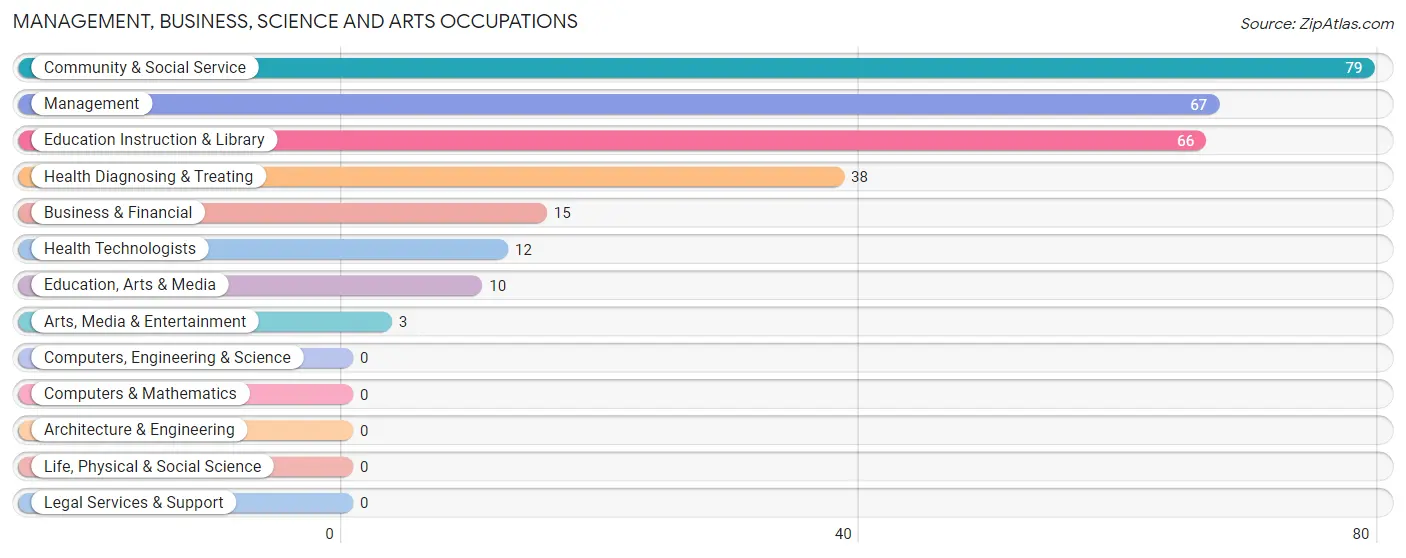
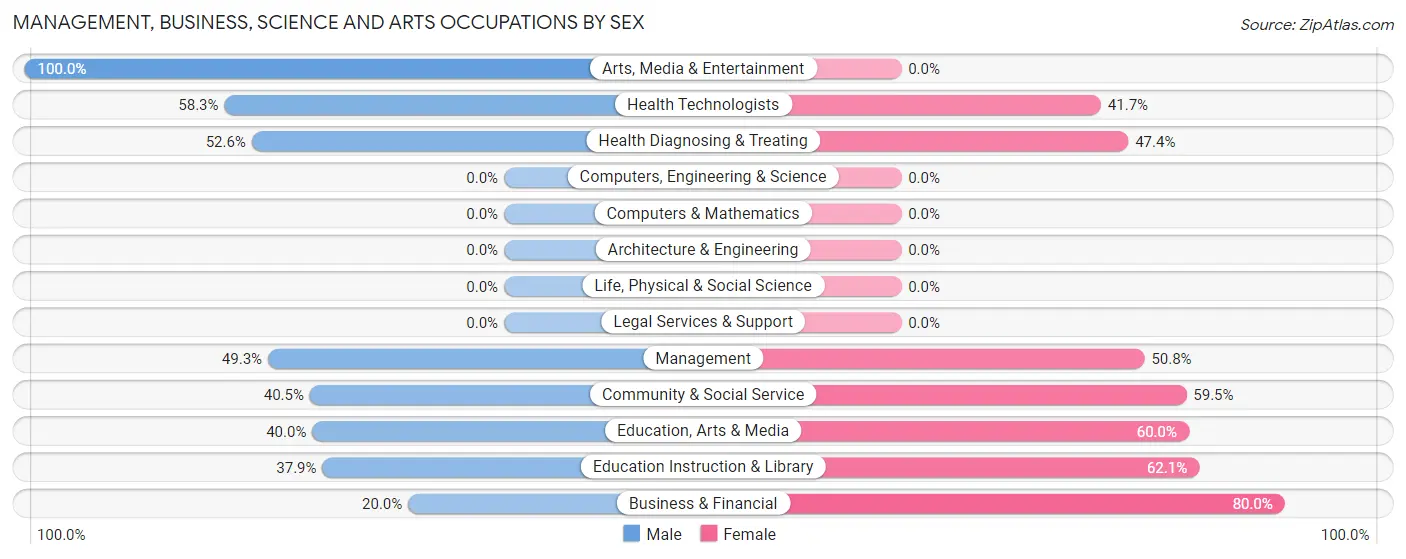
The most common Management, Business, Science and Arts occupations in Coalgate are Community & Social Service (79 | 10.8%), Management (67 | 9.1%), Education Instruction & Library (66 | 9.0%), Health Diagnosing & Treating (38 | 5.2%), and Business & Financial (15 | 2.1%).
Management, Business, Science and Arts Occupations by Sex
Within the Management, Business, Science and Arts occupations in Coalgate, the most male-oriented occupations are Arts, Media & Entertainment (100.0%), Health Technologists (58.3%), and Health Diagnosing & Treating (52.6%), while the most female-oriented occupations are Business & Financial (80.0%), Education Instruction & Library (62.1%), and Education, Arts & Media (60.0%).
| Occupation | Male | Female |
| Management | 33 (49.2%) | 34 (50.7%) |
| Business & Financial | 3 (20.0%) | 12 (80.0%) |
| Computers, Engineering & Science | 0 (0.0%) | 0 (0.0%) |
| Computers & Mathematics | 0 (0.0%) | 0 (0.0%) |
| Architecture & Engineering | 0 (0.0%) | 0 (0.0%) |
| Life, Physical & Social Science | 0 (0.0%) | 0 (0.0%) |
| Community & Social Service | 32 (40.5%) | 47 (59.5%) |
| Education, Arts & Media | 4 (40.0%) | 6 (60.0%) |
| Legal Services & Support | 0 (0.0%) | 0 (0.0%) |
| Education Instruction & Library | 25 (37.9%) | 41 (62.1%) |
| Arts, Media & Entertainment | 3 (100.0%) | 0 (0.0%) |
| Health Diagnosing & Treating | 20 (52.6%) | 18 (47.4%) |
| Health Technologists | 7 (58.3%) | 5 (41.7%) |
| Total (Category) | 88 (44.2%) | 111 (55.8%) |
| Total (Overall) | 383 (52.3%) | 349 (47.7%) |
Services Occupations
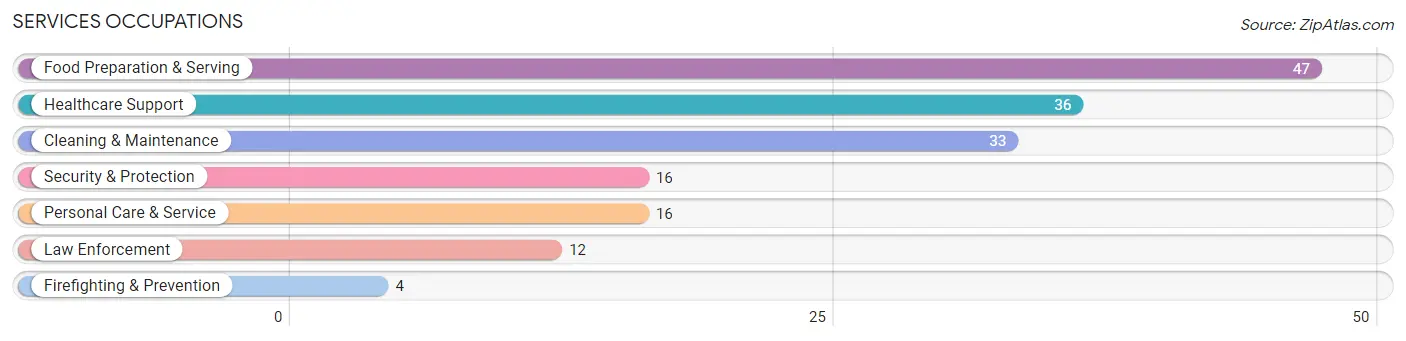
The most common Services occupations in Coalgate are Food Preparation & Serving (47 | 6.4%), Healthcare Support (36 | 4.9%), Cleaning & Maintenance (33 | 4.5%), Security & Protection (16 | 2.2%), and Personal Care & Service (16 | 2.2%).
Services Occupations by Sex
Within the Services occupations in Coalgate, the most male-oriented occupations are Security & Protection (100.0%), Firefighting & Prevention (100.0%), and Law Enforcement (100.0%), while the most female-oriented occupations are Healthcare Support (100.0%), Personal Care & Service (81.2%), and Food Preparation & Serving (72.3%).

| Occupation | Male | Female |
| Healthcare Support | 0 (0.0%) | 36 (100.0%) |
| Security & Protection | 16 (100.0%) | 0 (0.0%) |
| Firefighting & Prevention | 4 (100.0%) | 0 (0.0%) |
| Law Enforcement | 12 (100.0%) | 0 (0.0%) |
| Food Preparation & Serving | 13 (27.7%) | 34 (72.3%) |
| Cleaning & Maintenance | 18 (54.5%) | 15 (45.5%) |
| Personal Care & Service | 3 (18.8%) | 13 (81.2%) |
| Total (Category) | 50 (33.8%) | 98 (66.2%) |
| Total (Overall) | 383 (52.3%) | 349 (47.7%) |
Sales and Office Occupations
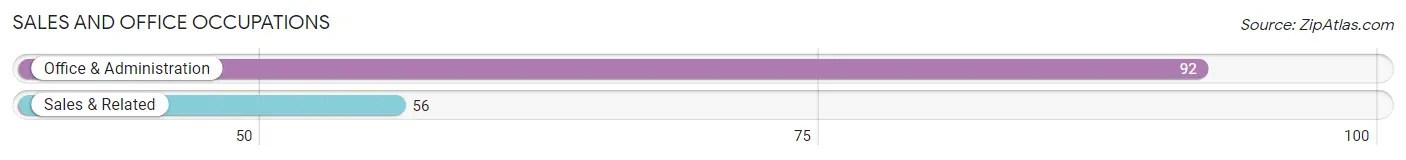
The most common Sales and Office occupations in Coalgate are Office & Administration (92 | 12.6%), and Sales & Related (56 | 7.6%).
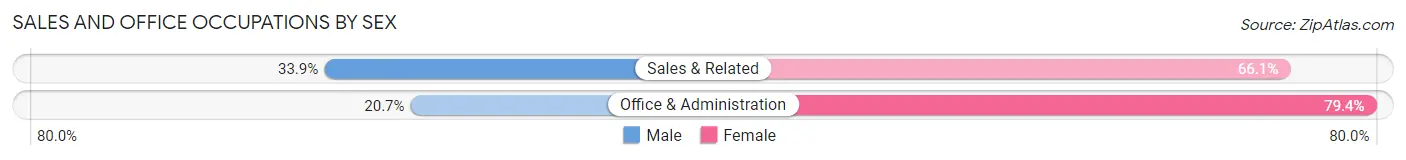
Sales and Office Occupations by Sex
| Occupation | Male | Female |
| Sales & Related | 19 (33.9%) | 37 (66.1%) |
| Office & Administration | 19 (20.6%) | 73 (79.3%) |
| Total (Category) | 38 (25.7%) | 110 (74.3%) |
| Total (Overall) | 383 (52.3%) | 349 (47.7%) |
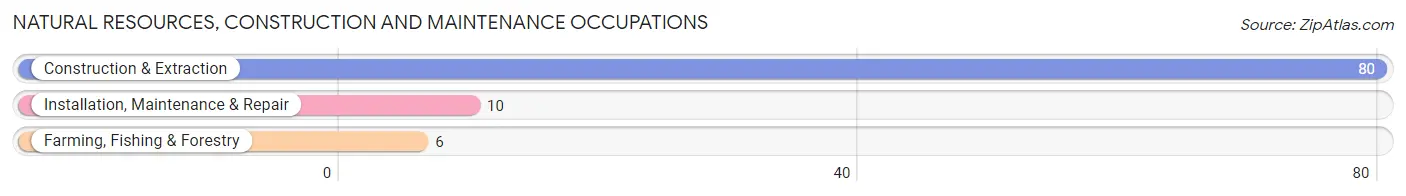
Natural Resources, Construction and Maintenance Occupations
The most common Natural Resources, Construction and Maintenance occupations in Coalgate are Construction & Extraction (80 | 10.9%), Installation, Maintenance & Repair (10 | 1.4%), and Farming, Fishing & Forestry (6 | 0.8%).
Natural Resources, Construction and Maintenance Occupations by Sex
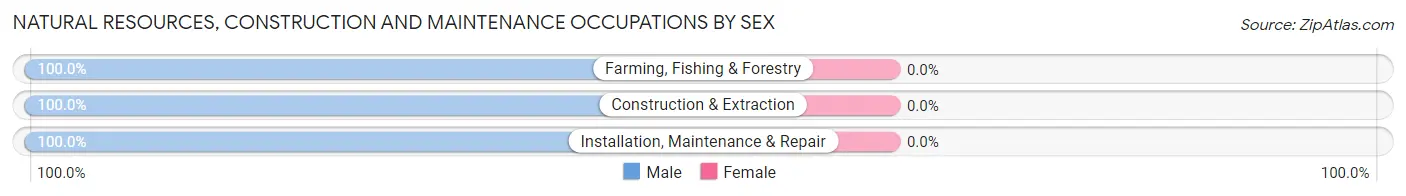
| Occupation | Male | Female |
| Farming, Fishing & Forestry | 6 (100.0%) | 0 (0.0%) |
| Construction & Extraction | 80 (100.0%) | 0 (0.0%) |
| Installation, Maintenance & Repair | 10 (100.0%) | 0 (0.0%) |
| Total (Category) | 96 (100.0%) | 0 (0.0%) |
| Total (Overall) | 383 (52.3%) | 349 (47.7%) |
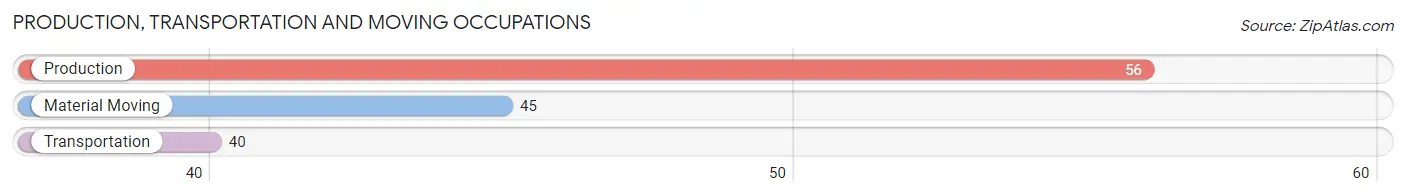
Production, Transportation and Moving Occupations
The most common Production, Transportation and Moving occupations in Coalgate are Production (56 | 7.6%), Material Moving (45 | 6.1%), and Transportation (40 | 5.5%).
Production, Transportation and Moving Occupations by Sex
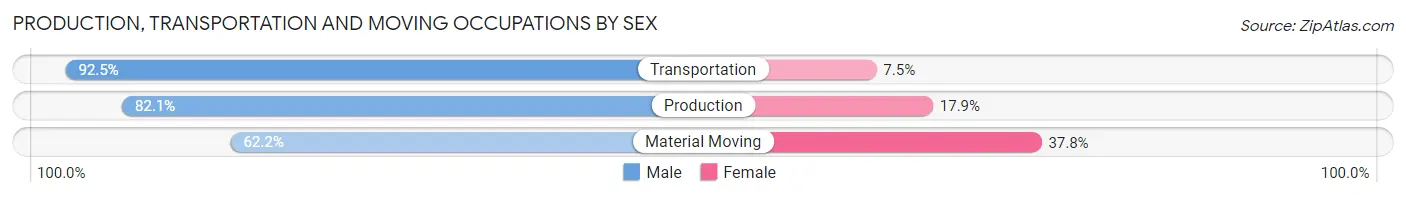
| Occupation | Male | Female |
| Production | 46 (82.1%) | 10 (17.9%) |
| Transportation | 37 (92.5%) | 3 (7.5%) |
| Material Moving | 28 (62.2%) | 17 (37.8%) |
| Total (Category) | 111 (78.7%) | 30 (21.3%) |
| Total (Overall) | 383 (52.3%) | 349 (47.7%) |
Employment Industries by Sex in Coalgate
Employment Industries in Coalgate
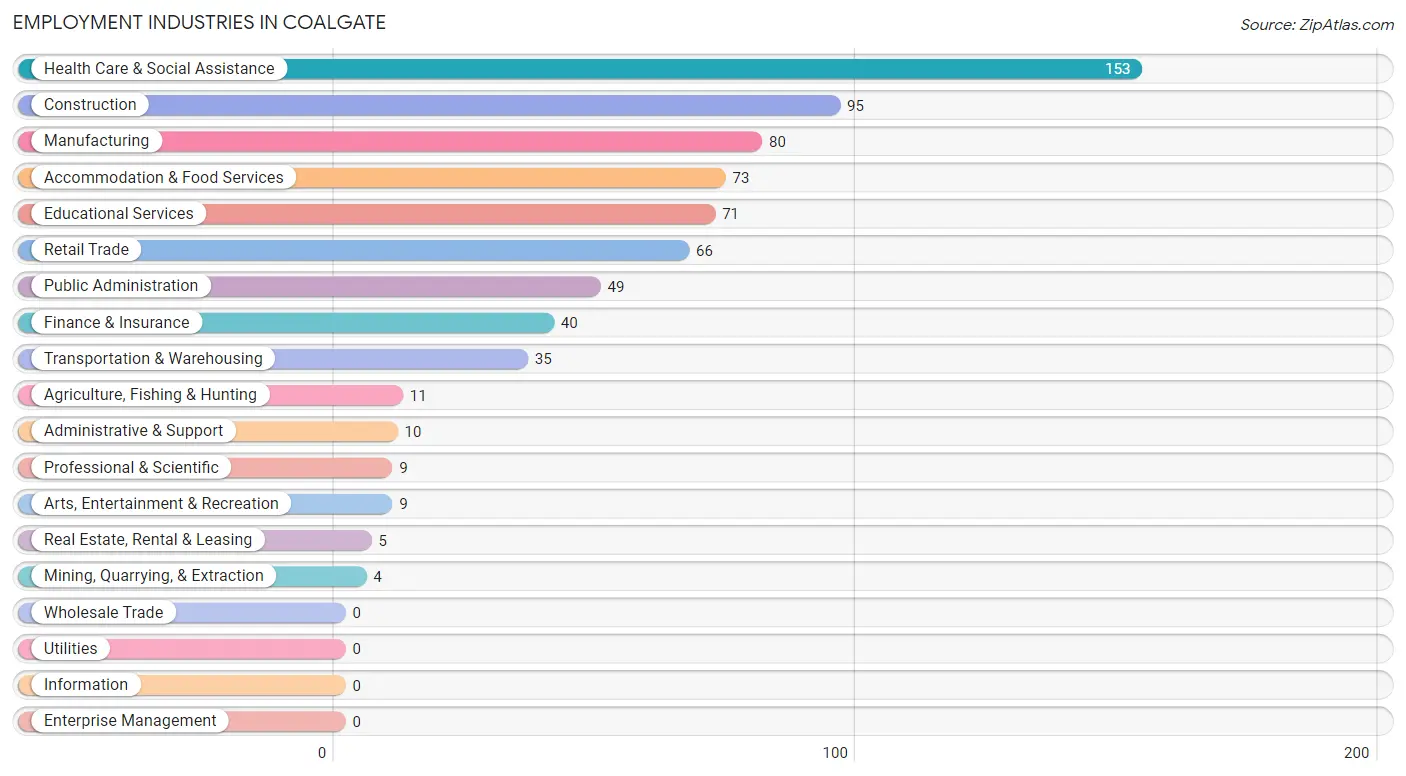
The major employment industries in Coalgate include Health Care & Social Assistance (153 | 20.9%), Construction (95 | 13.0%), Manufacturing (80 | 10.9%), Accommodation & Food Services (73 | 10.0%), and Educational Services (71 | 9.7%).
Employment Industries by Sex in Coalgate
The Coalgate industries that see more men than women are Agriculture, Fishing & Hunting (100.0%), Mining, Quarrying, & Extraction (100.0%), and Real Estate, Rental & Leasing (100.0%), whereas the industries that tend to have a higher number of women are Health Care & Social Assistance (78.4%), Accommodation & Food Services (69.9%), and Educational Services (67.6%).
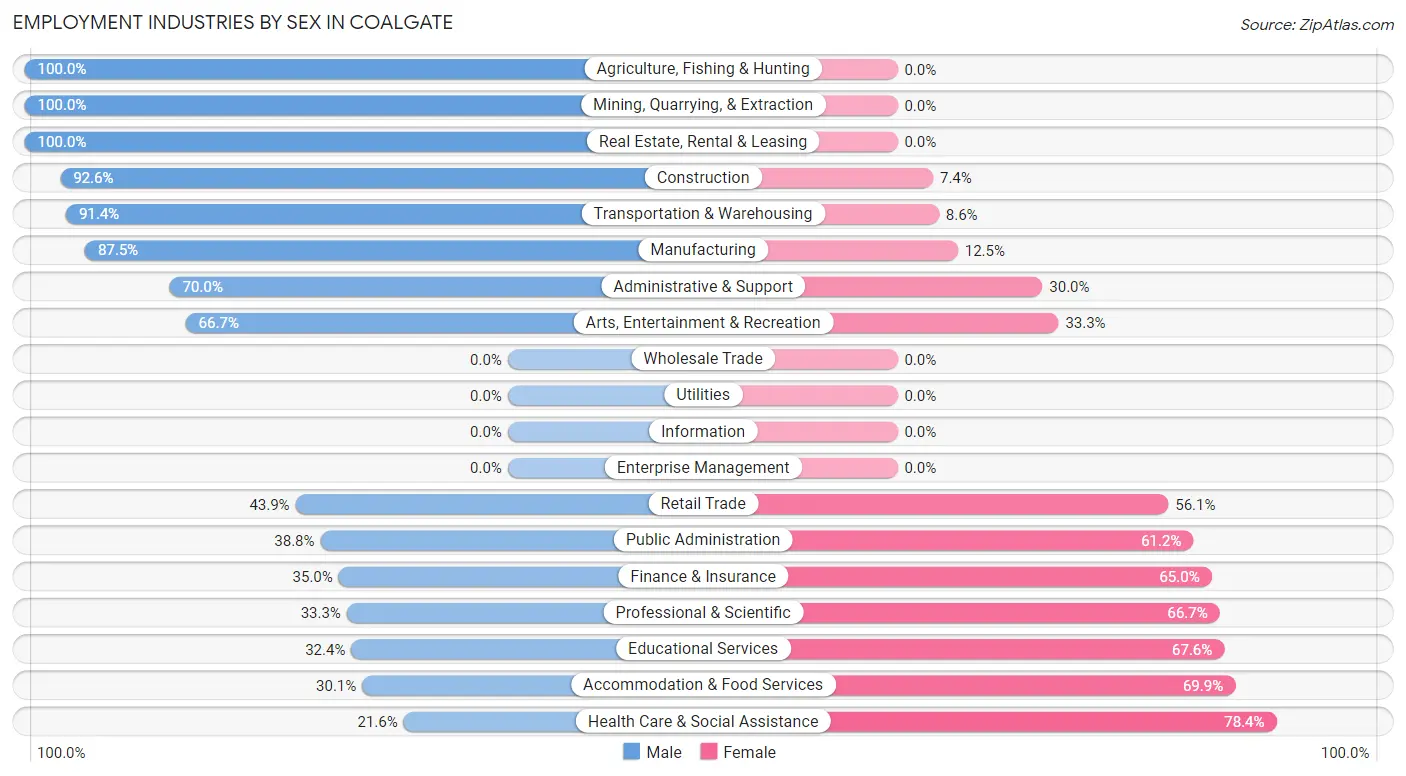
| Industry | Male | Female |
| Agriculture, Fishing & Hunting | 11 (100.0%) | 0 (0.0%) |
| Mining, Quarrying, & Extraction | 4 (100.0%) | 0 (0.0%) |
| Construction | 88 (92.6%) | 7 (7.4%) |
| Manufacturing | 70 (87.5%) | 10 (12.5%) |
| Wholesale Trade | 0 (0.0%) | 0 (0.0%) |
| Retail Trade | 29 (43.9%) | 37 (56.1%) |
| Transportation & Warehousing | 32 (91.4%) | 3 (8.6%) |
| Utilities | 0 (0.0%) | 0 (0.0%) |
| Information | 0 (0.0%) | 0 (0.0%) |
| Finance & Insurance | 14 (35.0%) | 26 (65.0%) |
| Real Estate, Rental & Leasing | 5 (100.0%) | 0 (0.0%) |
| Professional & Scientific | 3 (33.3%) | 6 (66.7%) |
| Enterprise Management | 0 (0.0%) | 0 (0.0%) |
| Administrative & Support | 7 (70.0%) | 3 (30.0%) |
| Educational Services | 23 (32.4%) | 48 (67.6%) |
| Health Care & Social Assistance | 33 (21.6%) | 120 (78.4%) |
| Arts, Entertainment & Recreation | 6 (66.7%) | 3 (33.3%) |
| Accommodation & Food Services | 22 (30.1%) | 51 (69.9%) |
| Public Administration | 19 (38.8%) | 30 (61.2%) |
| Total | 383 (52.3%) | 349 (47.7%) |
Education in Coalgate
School Enrollment in Coalgate
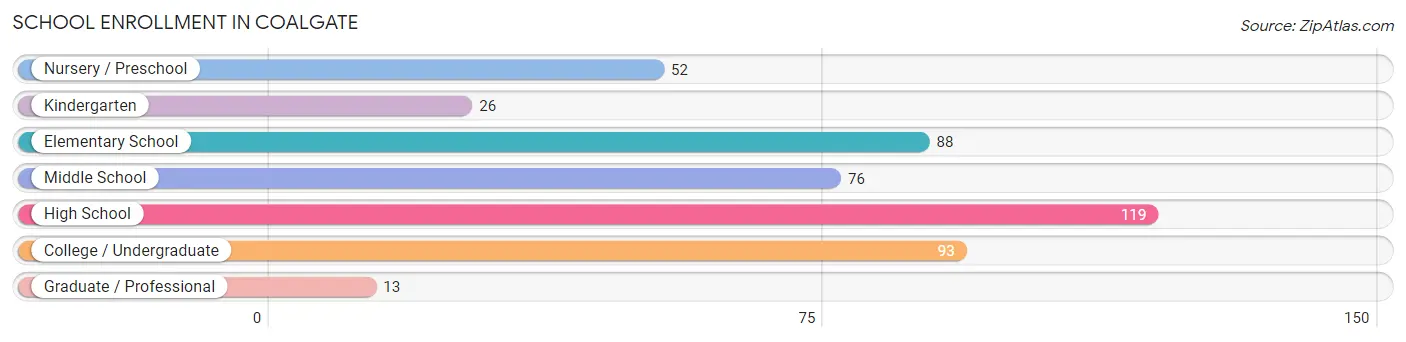
The most common levels of schooling among the 467 students in Coalgate are high school (119 | 25.5%), college / undergraduate (93 | 19.9%), and elementary school (88 | 18.8%).
| School Level | # Students | % Students |
| Nursery / Preschool | 52 | 11.1% |
| Kindergarten | 26 | 5.6% |
| Elementary School | 88 | 18.8% |
| Middle School | 76 | 16.3% |
| High School | 119 | 25.5% |
| College / Undergraduate | 93 | 19.9% |
| Graduate / Professional | 13 | 2.8% |
| Total | 467 | 100.0% |
School Enrollment by Age by Funding Source in Coalgate
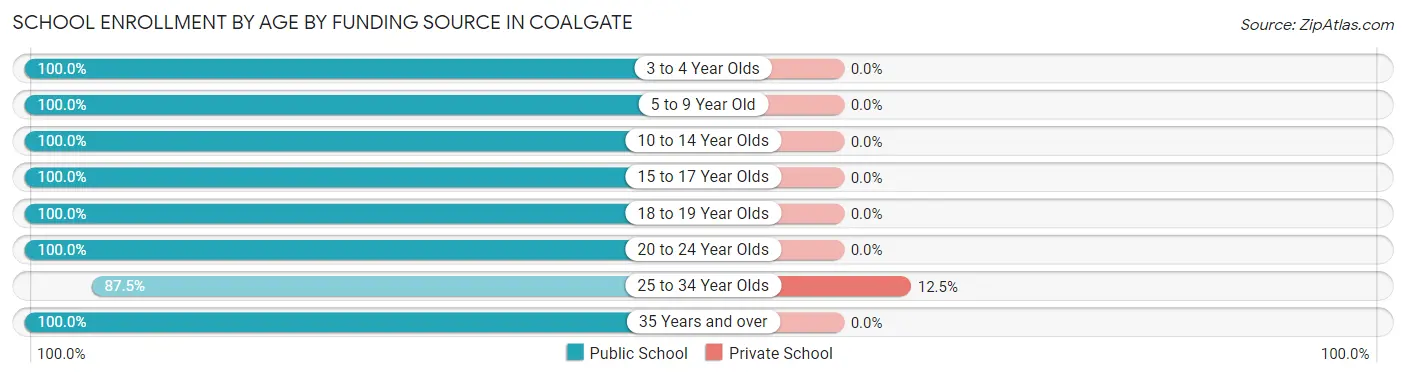
Out of a total of 467 students who are enrolled in schools in Coalgate, 4 (0.9%) attend a private institution, while the remaining 463 (99.1%) are enrolled in public schools. The age group of 25 to 34 year olds has the highest likelihood of being enrolled in private schools, with 4 (12.5% in the age bracket) enrolled. Conversely, the age group of 3 to 4 year olds has the lowest likelihood of being enrolled in a private school, with 41 (100.0% in the age bracket) attending a public institution.
| Age Bracket | Public School | Private School |
| 3 to 4 Year Olds | 41 (100.0%) | 0 (0.0%) |
| 5 to 9 Year Old | 116 (100.0%) | 0 (0.0%) |
| 10 to 14 Year Olds | 85 (100.0%) | 0 (0.0%) |
| 15 to 17 Year Olds | 104 (100.0%) | 0 (0.0%) |
| 18 to 19 Year Olds | 39 (100.0%) | 0 (0.0%) |
| 20 to 24 Year Olds | 19 (100.0%) | 0 (0.0%) |
| 25 to 34 Year Olds | 28 (87.5%) | 4 (12.5%) |
| 35 Years and over | 31 (100.0%) | 0 (0.0%) |
| Total | 463 (99.1%) | 4 (0.9%) |
Educational Attainment by Field of Study in Coalgate
Education (76 | 35.2%), business (39 | 18.1%), science & technology (28 | 13.0%), arts & humanities (28 | 13.0%), and bio, nature & agricultural (14 | 6.5%) are the most common fields of study among 216 individuals in Coalgate who have obtained a bachelor's degree or higher.
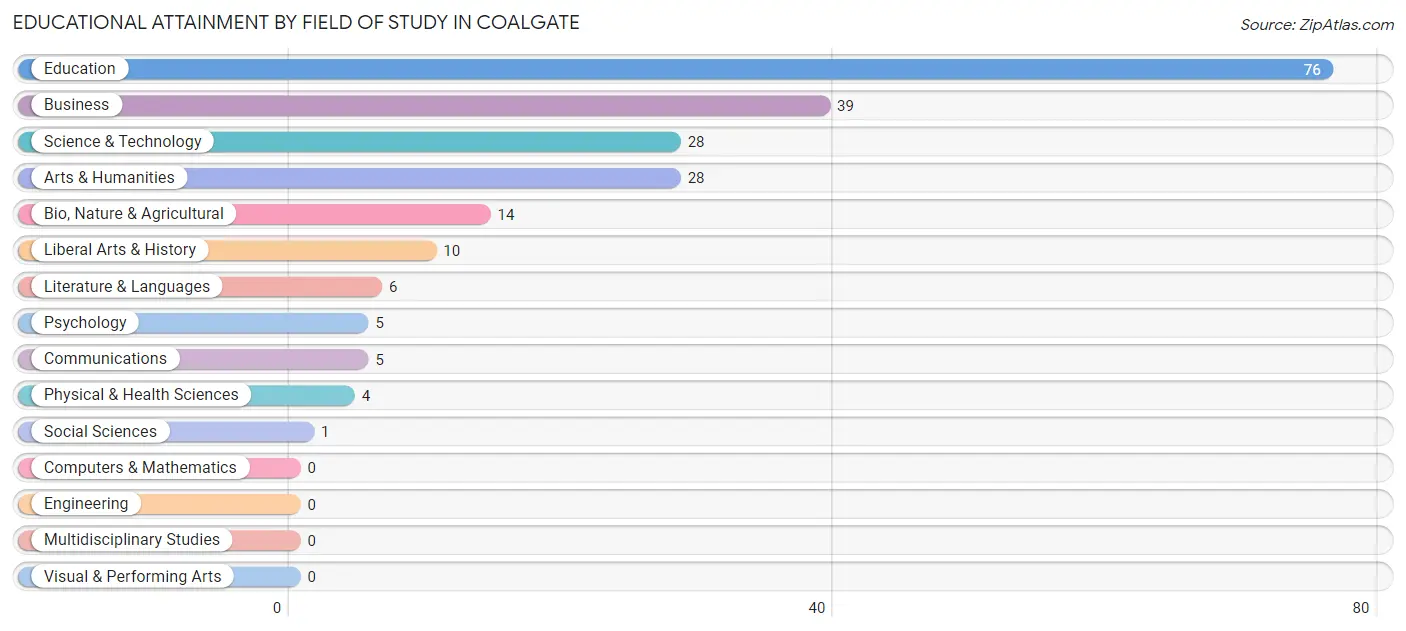
| Field of Study | # Graduates | % Graduates |
| Computers & Mathematics | 0 | 0.0% |
| Bio, Nature & Agricultural | 14 | 6.5% |
| Physical & Health Sciences | 4 | 1.8% |
| Psychology | 5 | 2.3% |
| Social Sciences | 1 | 0.5% |
| Engineering | 0 | 0.0% |
| Multidisciplinary Studies | 0 | 0.0% |
| Science & Technology | 28 | 13.0% |
| Business | 39 | 18.1% |
| Education | 76 | 35.2% |
| Literature & Languages | 6 | 2.8% |
| Liberal Arts & History | 10 | 4.6% |
| Visual & Performing Arts | 0 | 0.0% |
| Communications | 5 | 2.3% |
| Arts & Humanities | 28 | 13.0% |
| Total | 216 | 100.0% |
Transportation & Commute in Coalgate
Vehicle Availability by Sex in Coalgate
The most prevalent vehicle ownership categories in Coalgate are males with 2 vehicles (127, accounting for 34.7%) and females with 2 vehicles (150, making up 37.8%).
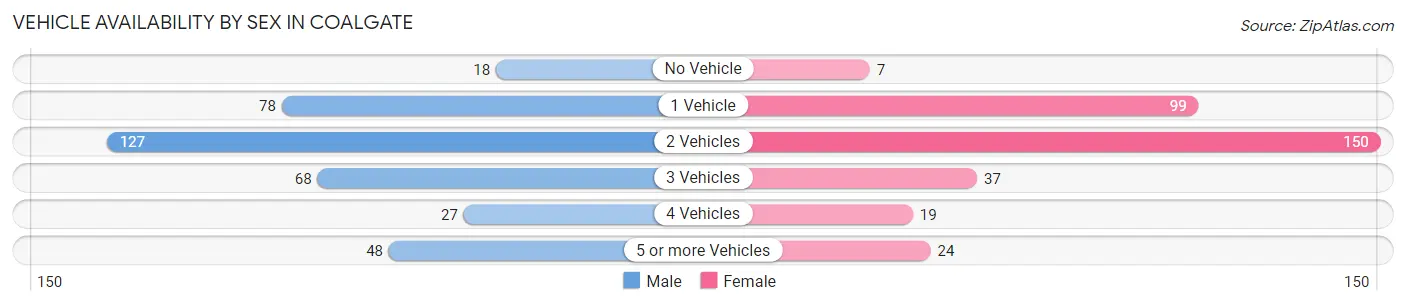
| Vehicles Available | Male | Female |
| No Vehicle | 18 (4.9%) | 7 (2.1%) |
| 1 Vehicle | 78 (21.3%) | 99 (29.5%) |
| 2 Vehicles | 127 (34.7%) | 150 (44.6%) |
| 3 Vehicles | 68 (18.6%) | 37 (11.0%) |
| 4 Vehicles | 27 (7.4%) | 19 (5.7%) |
| 5 or more Vehicles | 48 (13.1%) | 24 (7.1%) |
| Total | 366 (100.0%) | 336 (100.0%) |
Commute Time in Coalgate
The most frequently occuring commute durations in Coalgate are less than 5 minutes (145 commuters, 21.9%), 5 to 9 minutes (143 commuters, 21.6%), and 15 to 19 minutes (86 commuters, 13.0%).
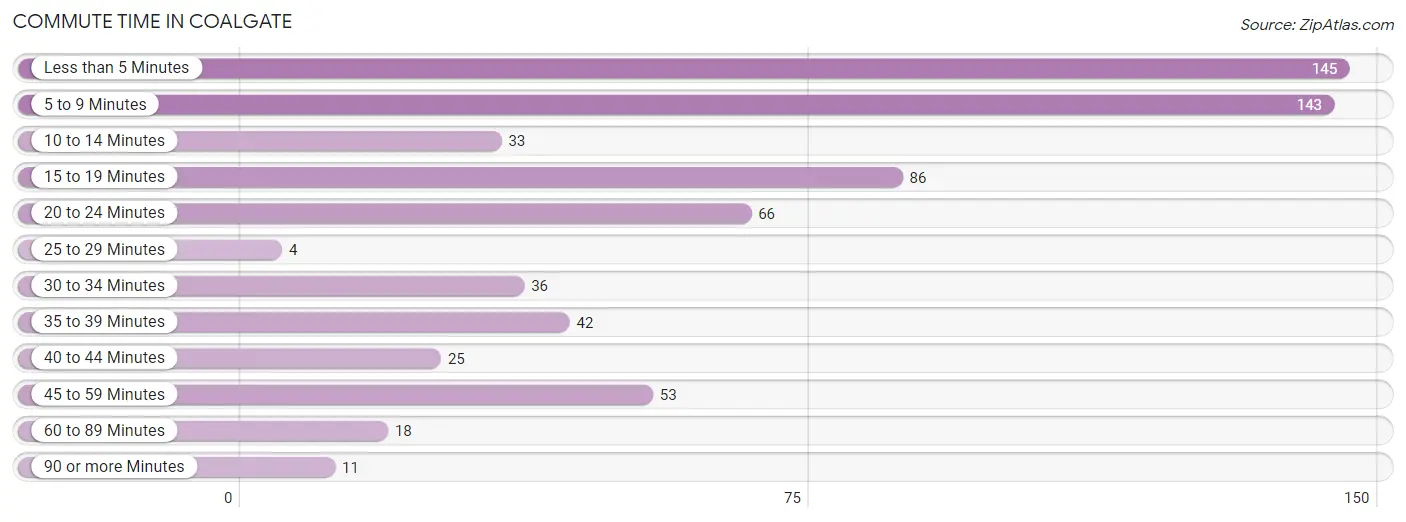
| Commute Time | # Commuters | % Commuters |
| Less than 5 Minutes | 145 | 21.9% |
| 5 to 9 Minutes | 143 | 21.6% |
| 10 to 14 Minutes | 33 | 5.0% |
| 15 to 19 Minutes | 86 | 13.0% |
| 20 to 24 Minutes | 66 | 10.0% |
| 25 to 29 Minutes | 4 | 0.6% |
| 30 to 34 Minutes | 36 | 5.4% |
| 35 to 39 Minutes | 42 | 6.3% |
| 40 to 44 Minutes | 25 | 3.8% |
| 45 to 59 Minutes | 53 | 8.0% |
| 60 to 89 Minutes | 18 | 2.7% |
| 90 or more Minutes | 11 | 1.7% |
Commute Time by Sex in Coalgate
The most common commute times in Coalgate are 5 to 9 minutes (85 commuters, 24.8%) for males and less than 5 minutes (99 commuters, 30.9%) for females.
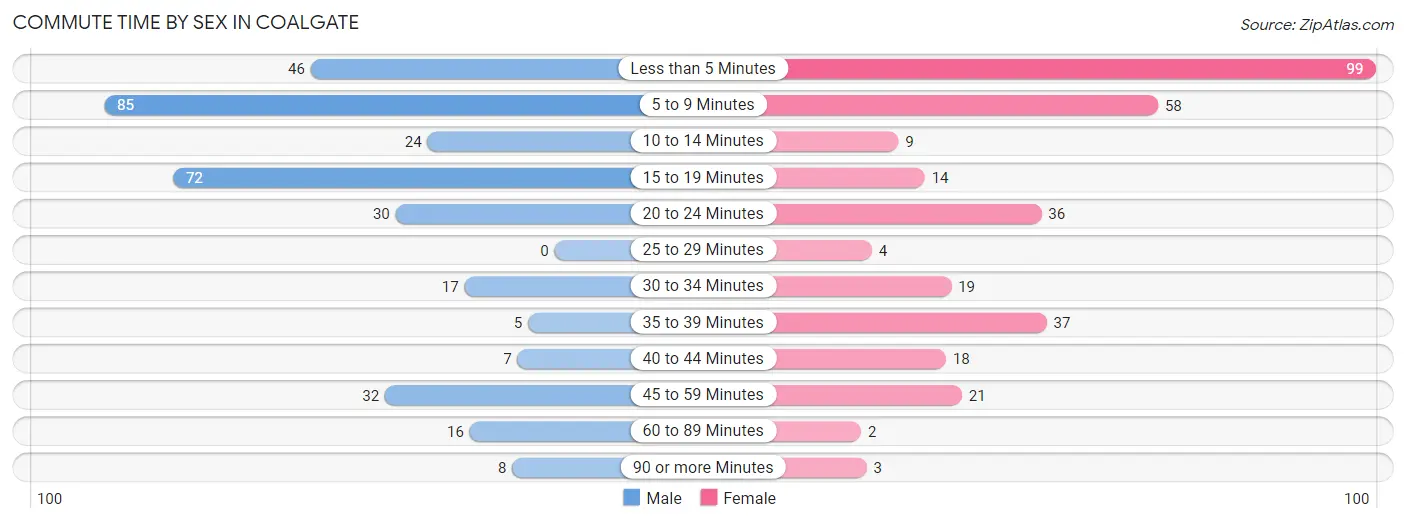
| Commute Time | Male | Female |
| Less than 5 Minutes | 46 (13.5%) | 99 (30.9%) |
| 5 to 9 Minutes | 85 (24.8%) | 58 (18.1%) |
| 10 to 14 Minutes | 24 (7.0%) | 9 (2.8%) |
| 15 to 19 Minutes | 72 (21.0%) | 14 (4.4%) |
| 20 to 24 Minutes | 30 (8.8%) | 36 (11.3%) |
| 25 to 29 Minutes | 0 (0.0%) | 4 (1.3%) |
| 30 to 34 Minutes | 17 (5.0%) | 19 (5.9%) |
| 35 to 39 Minutes | 5 (1.5%) | 37 (11.6%) |
| 40 to 44 Minutes | 7 (2.1%) | 18 (5.6%) |
| 45 to 59 Minutes | 32 (9.4%) | 21 (6.6%) |
| 60 to 89 Minutes | 16 (4.7%) | 2 (0.6%) |
| 90 or more Minutes | 8 (2.3%) | 3 (0.9%) |
Time of Departure to Work by Sex in Coalgate
The most frequent times of departure to work in Coalgate are 7:00 AM to 7:29 AM (49, 14.3%) for males and 7:30 AM to 7:59 AM (126, 39.4%) for females.
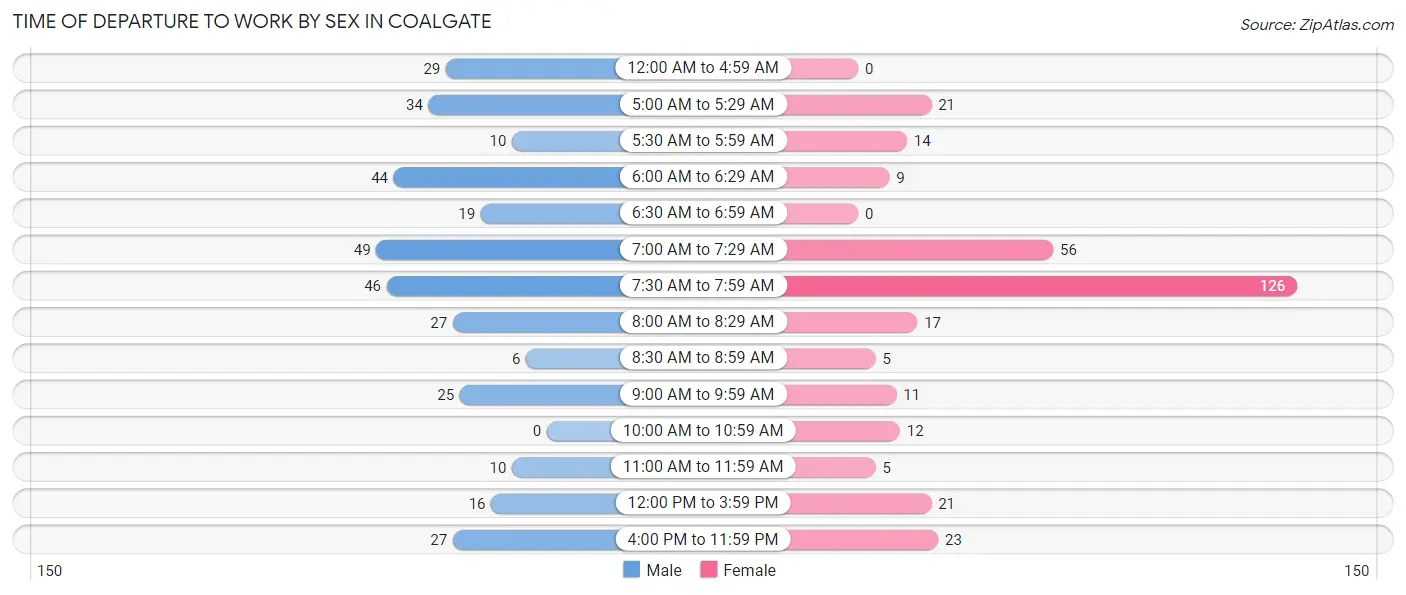
| Time of Departure | Male | Female |
| 12:00 AM to 4:59 AM | 29 (8.5%) | 0 (0.0%) |
| 5:00 AM to 5:29 AM | 34 (9.9%) | 21 (6.6%) |
| 5:30 AM to 5:59 AM | 10 (2.9%) | 14 (4.4%) |
| 6:00 AM to 6:29 AM | 44 (12.9%) | 9 (2.8%) |
| 6:30 AM to 6:59 AM | 19 (5.6%) | 0 (0.0%) |
| 7:00 AM to 7:29 AM | 49 (14.3%) | 56 (17.5%) |
| 7:30 AM to 7:59 AM | 46 (13.5%) | 126 (39.4%) |
| 8:00 AM to 8:29 AM | 27 (7.9%) | 17 (5.3%) |
| 8:30 AM to 8:59 AM | 6 (1.8%) | 5 (1.6%) |
| 9:00 AM to 9:59 AM | 25 (7.3%) | 11 (3.4%) |
| 10:00 AM to 10:59 AM | 0 (0.0%) | 12 (3.7%) |
| 11:00 AM to 11:59 AM | 10 (2.9%) | 5 (1.6%) |
| 12:00 PM to 3:59 PM | 16 (4.7%) | 21 (6.6%) |
| 4:00 PM to 11:59 PM | 27 (7.9%) | 23 (7.2%) |
| Total | 342 (100.0%) | 320 (100.0%) |
Housing Occupancy in Coalgate
Occupancy by Ownership in Coalgate
Of the total 728 dwellings in Coalgate, owner-occupied units account for 396 (54.4%), while renter-occupied units make up 332 (45.6%).
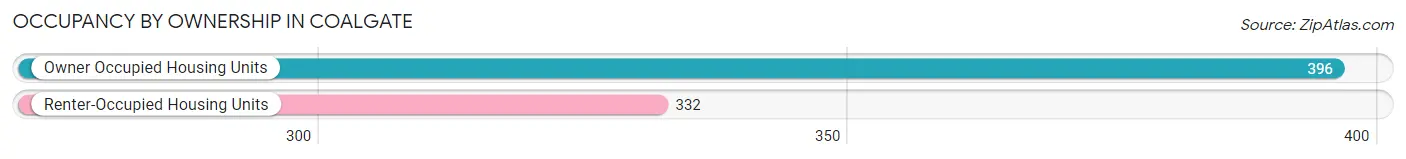
| Occupancy | # Housing Units | % Housing Units |
| Owner Occupied Housing Units | 396 | 54.4% |
| Renter-Occupied Housing Units | 332 | 45.6% |
| Total Occupied Housing Units | 728 | 100.0% |
Occupancy by Household Size in Coalgate
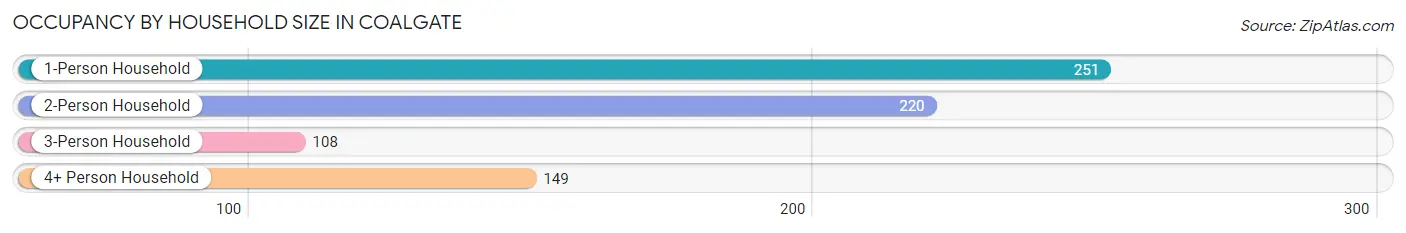
| Household Size | # Housing Units | % Housing Units |
| 1-Person Household | 251 | 34.5% |
| 2-Person Household | 220 | 30.2% |
| 3-Person Household | 108 | 14.8% |
| 4+ Person Household | 149 | 20.5% |
| Total Housing Units | 728 | 100.0% |
Occupancy by Ownership by Household Size in Coalgate
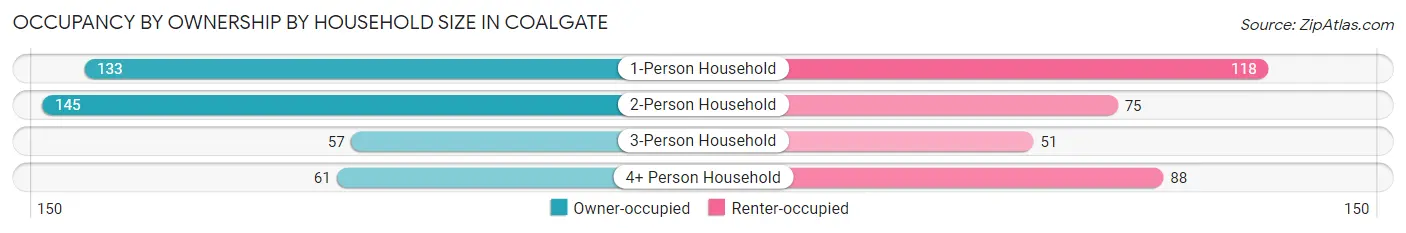
| Household Size | Owner-occupied | Renter-occupied |
| 1-Person Household | 133 (53.0%) | 118 (47.0%) |
| 2-Person Household | 145 (65.9%) | 75 (34.1%) |
| 3-Person Household | 57 (52.8%) | 51 (47.2%) |
| 4+ Person Household | 61 (40.9%) | 88 (59.1%) |
| Total Housing Units | 396 (54.4%) | 332 (45.6%) |
Occupancy by Educational Attainment in Coalgate
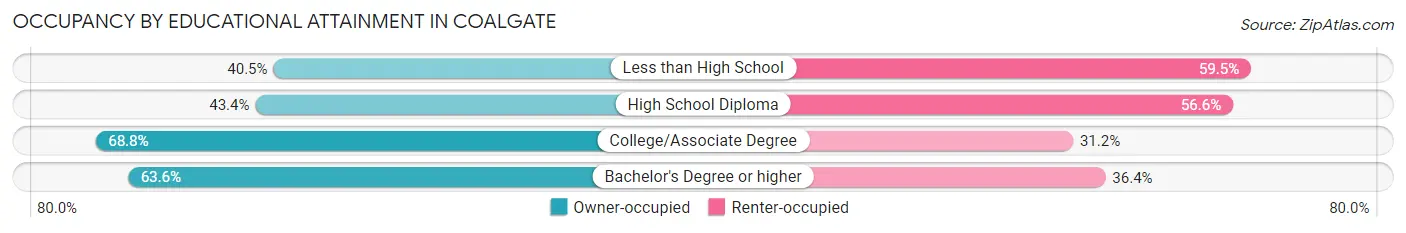
| Household Size | Owner-occupied | Renter-occupied |
| Less than High School | 45 (40.5%) | 66 (59.5%) |
| High School Diploma | 112 (43.4%) | 146 (56.6%) |
| College/Associate Degree | 141 (68.8%) | 64 (31.2%) |
| Bachelor's Degree or higher | 98 (63.6%) | 56 (36.4%) |
Occupancy by Age of Householder in Coalgate
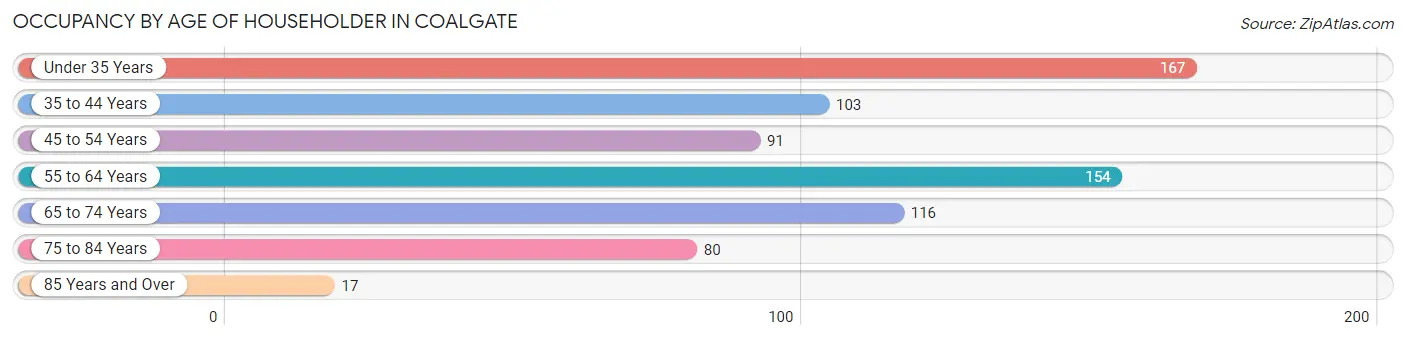
| Age Bracket | # Households | % Households |
| Under 35 Years | 167 | 22.9% |
| 35 to 44 Years | 103 | 14.1% |
| 45 to 54 Years | 91 | 12.5% |
| 55 to 64 Years | 154 | 21.1% |
| 65 to 74 Years | 116 | 15.9% |
| 75 to 84 Years | 80 | 11.0% |
| 85 Years and Over | 17 | 2.3% |
| Total | 728 | 100.0% |
Housing Finances in Coalgate
Median Income by Occupancy in Coalgate
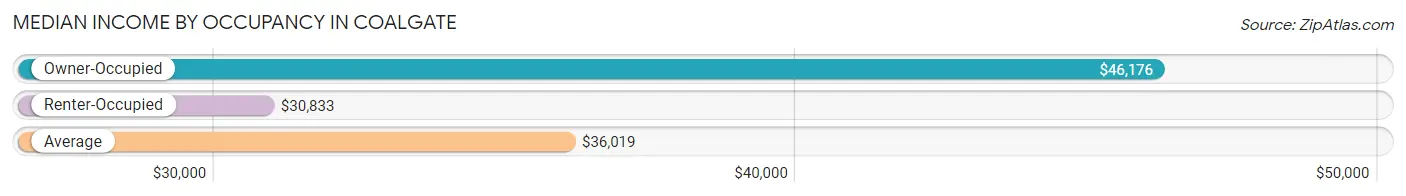
| Occupancy Type | # Households | Median Income |
| Owner-Occupied | 396 (54.4%) | $46,176 |
| Renter-Occupied | 332 (45.6%) | $30,833 |
| Average | 728 (100.0%) | $36,019 |
Occupancy by Householder Income Bracket in Coalgate
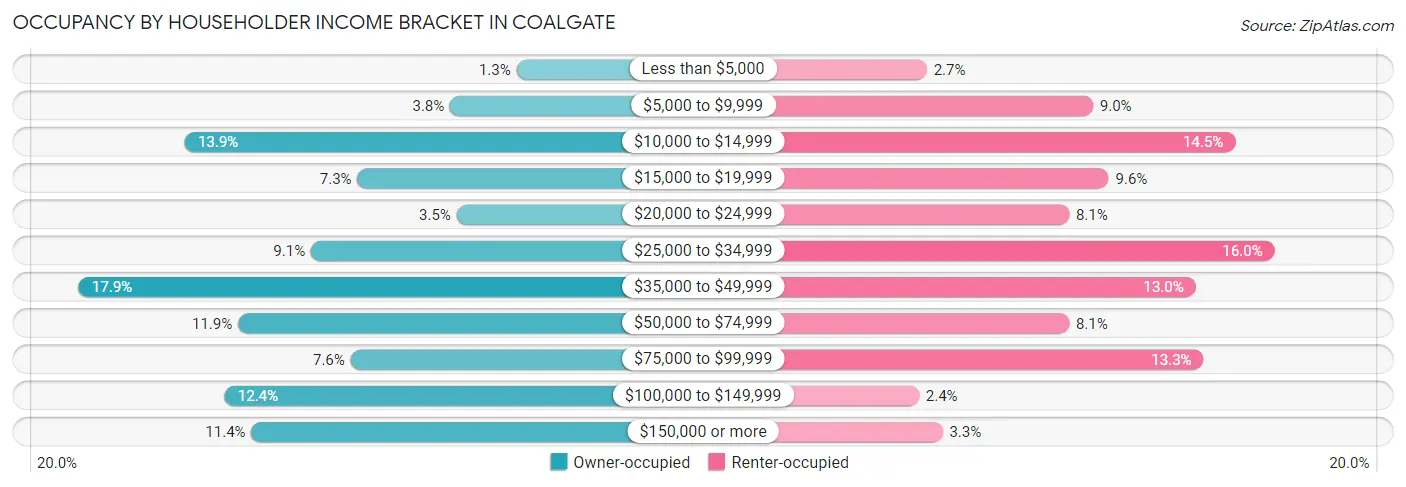
| Income Bracket | Owner-occupied | Renter-occupied |
| Less than $5,000 | 5 (1.3%) | 9 (2.7%) |
| $5,000 to $9,999 | 15 (3.8%) | 30 (9.0%) |
| $10,000 to $14,999 | 55 (13.9%) | 48 (14.5%) |
| $15,000 to $19,999 | 29 (7.3%) | 32 (9.6%) |
| $20,000 to $24,999 | 14 (3.5%) | 27 (8.1%) |
| $25,000 to $34,999 | 36 (9.1%) | 53 (16.0%) |
| $35,000 to $49,999 | 71 (17.9%) | 43 (13.0%) |
| $50,000 to $74,999 | 47 (11.9%) | 27 (8.1%) |
| $75,000 to $99,999 | 30 (7.6%) | 44 (13.3%) |
| $100,000 to $149,999 | 49 (12.4%) | 8 (2.4%) |
| $150,000 or more | 45 (11.4%) | 11 (3.3%) |
| Total | 396 (100.0%) | 332 (100.0%) |
Monthly Housing Cost Tiers in Coalgate
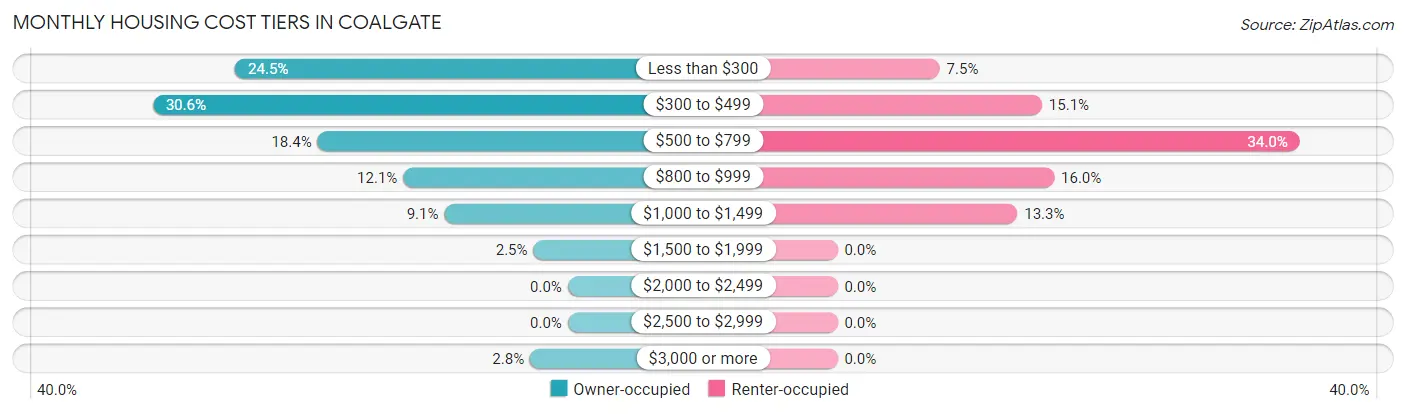
| Monthly Cost | Owner-occupied | Renter-occupied |
| Less than $300 | 97 (24.5%) | 25 (7.5%) |
| $300 to $499 | 121 (30.6%) | 50 (15.1%) |
| $500 to $799 | 73 (18.4%) | 113 (34.0%) |
| $800 to $999 | 48 (12.1%) | 53 (16.0%) |
| $1,000 to $1,499 | 36 (9.1%) | 44 (13.3%) |
| $1,500 to $1,999 | 10 (2.5%) | 0 (0.0%) |
| $2,000 to $2,499 | 0 (0.0%) | 0 (0.0%) |
| $2,500 to $2,999 | 0 (0.0%) | 0 (0.0%) |
| $3,000 or more | 11 (2.8%) | 0 (0.0%) |
| Total | 396 (100.0%) | 332 (100.0%) |
Physical Housing Characteristics in Coalgate
Housing Structures in Coalgate
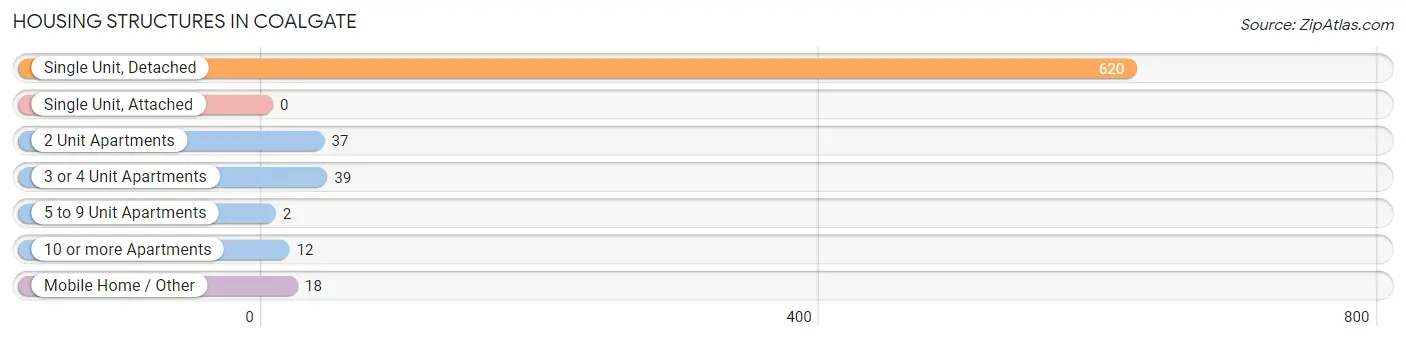
| Structure Type | # Housing Units | % Housing Units |
| Single Unit, Detached | 620 | 85.2% |
| Single Unit, Attached | 0 | 0.0% |
| 2 Unit Apartments | 37 | 5.1% |
| 3 or 4 Unit Apartments | 39 | 5.4% |
| 5 to 9 Unit Apartments | 2 | 0.3% |
| 10 or more Apartments | 12 | 1.7% |
| Mobile Home / Other | 18 | 2.5% |
| Total | 728 | 100.0% |
Housing Structures by Occupancy in Coalgate
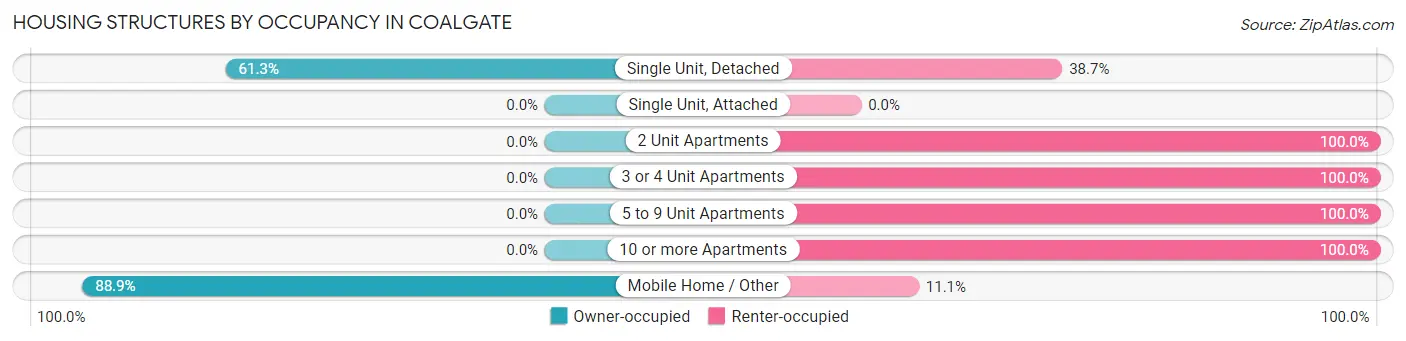
| Structure Type | Owner-occupied | Renter-occupied |
| Single Unit, Detached | 380 (61.3%) | 240 (38.7%) |
| Single Unit, Attached | 0 (0.0%) | 0 (0.0%) |
| 2 Unit Apartments | 0 (0.0%) | 37 (100.0%) |
| 3 or 4 Unit Apartments | 0 (0.0%) | 39 (100.0%) |
| 5 to 9 Unit Apartments | 0 (0.0%) | 2 (100.0%) |
| 10 or more Apartments | 0 (0.0%) | 12 (100.0%) |
| Mobile Home / Other | 16 (88.9%) | 2 (11.1%) |
| Total | 396 (54.4%) | 332 (45.6%) |
Housing Structures by Number of Rooms in Coalgate
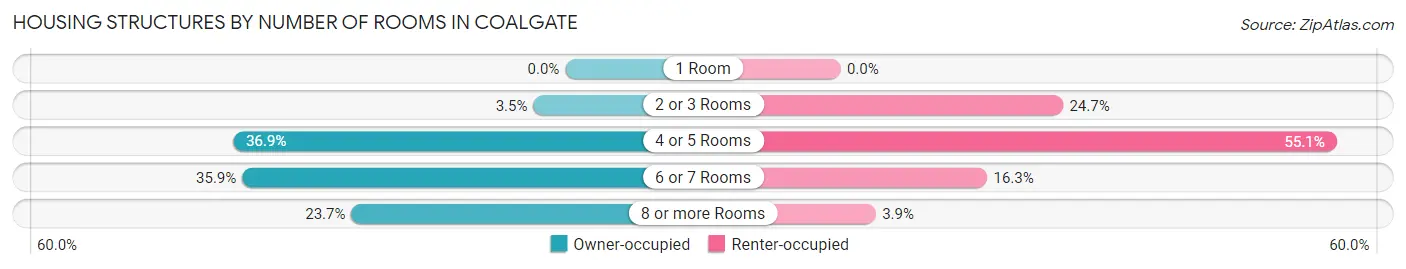
| Number of Rooms | Owner-occupied | Renter-occupied |
| 1 Room | 0 (0.0%) | 0 (0.0%) |
| 2 or 3 Rooms | 14 (3.5%) | 82 (24.7%) |
| 4 or 5 Rooms | 146 (36.9%) | 183 (55.1%) |
| 6 or 7 Rooms | 142 (35.9%) | 54 (16.3%) |
| 8 or more Rooms | 94 (23.7%) | 13 (3.9%) |
| Total | 396 (100.0%) | 332 (100.0%) |
Housing Structure by Heating Type in Coalgate
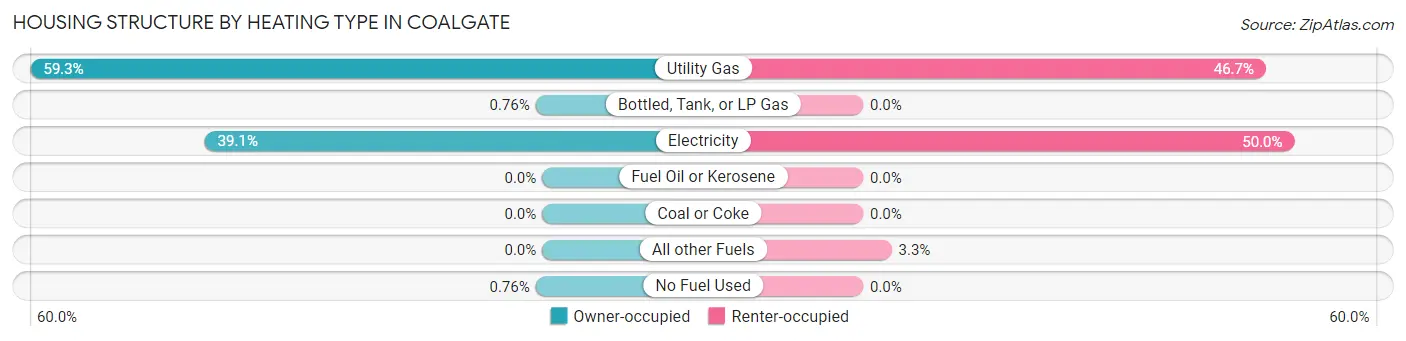
| Heating Type | Owner-occupied | Renter-occupied |
| Utility Gas | 235 (59.3%) | 155 (46.7%) |
| Bottled, Tank, or LP Gas | 3 (0.8%) | 0 (0.0%) |
| Electricity | 155 (39.1%) | 166 (50.0%) |
| Fuel Oil or Kerosene | 0 (0.0%) | 0 (0.0%) |
| Coal or Coke | 0 (0.0%) | 0 (0.0%) |
| All other Fuels | 0 (0.0%) | 11 (3.3%) |
| No Fuel Used | 3 (0.8%) | 0 (0.0%) |
| Total | 396 (100.0%) | 332 (100.0%) |
Household Vehicle Usage in Coalgate
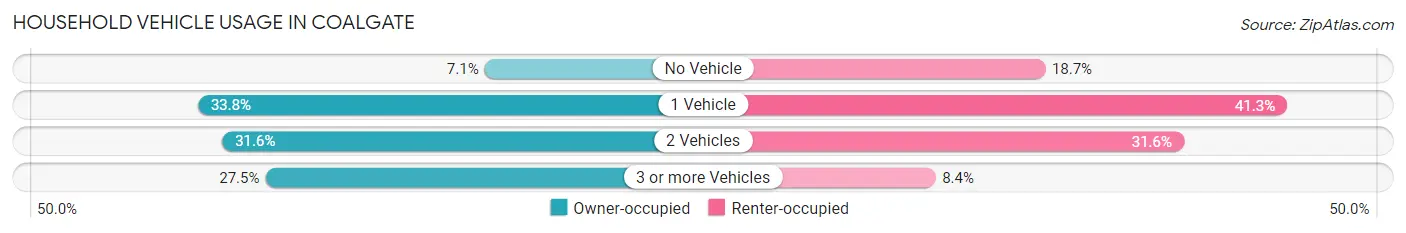
| Vehicles per Household | Owner-occupied | Renter-occupied |
| No Vehicle | 28 (7.1%) | 62 (18.7%) |
| 1 Vehicle | 134 (33.8%) | 137 (41.3%) |
| 2 Vehicles | 125 (31.6%) | 105 (31.6%) |
| 3 or more Vehicles | 109 (27.5%) | 28 (8.4%) |
| Total | 396 (100.0%) | 332 (100.0%) |
Real Estate & Mortgages in Coalgate
Real Estate and Mortgage Overview in Coalgate
| Characteristic | Without Mortgage | With Mortgage |
| Housing Units | 257 | 139 |
| Median Property Value | $82,600 | $84,700 |
| Median Household Income | $36,141 | $24 |
| Monthly Housing Costs | $334 | $11 |
| Real Estate Taxes | $440 | $21 |
Property Value by Mortgage Status in Coalgate
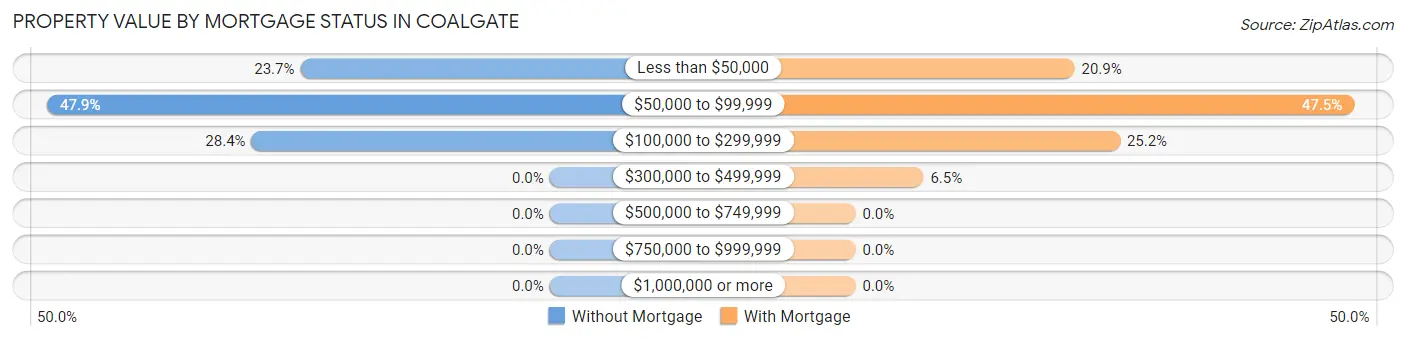
| Property Value | Without Mortgage | With Mortgage |
| Less than $50,000 | 61 (23.7%) | 29 (20.9%) |
| $50,000 to $99,999 | 123 (47.9%) | 66 (47.5%) |
| $100,000 to $299,999 | 73 (28.4%) | 35 (25.2%) |
| $300,000 to $499,999 | 0 (0.0%) | 9 (6.5%) |
| $500,000 to $749,999 | 0 (0.0%) | 0 (0.0%) |
| $750,000 to $999,999 | 0 (0.0%) | 0 (0.0%) |
| $1,000,000 or more | 0 (0.0%) | 0 (0.0%) |
| Total | 257 (100.0%) | 139 (100.0%) |
Household Income by Mortgage Status in Coalgate
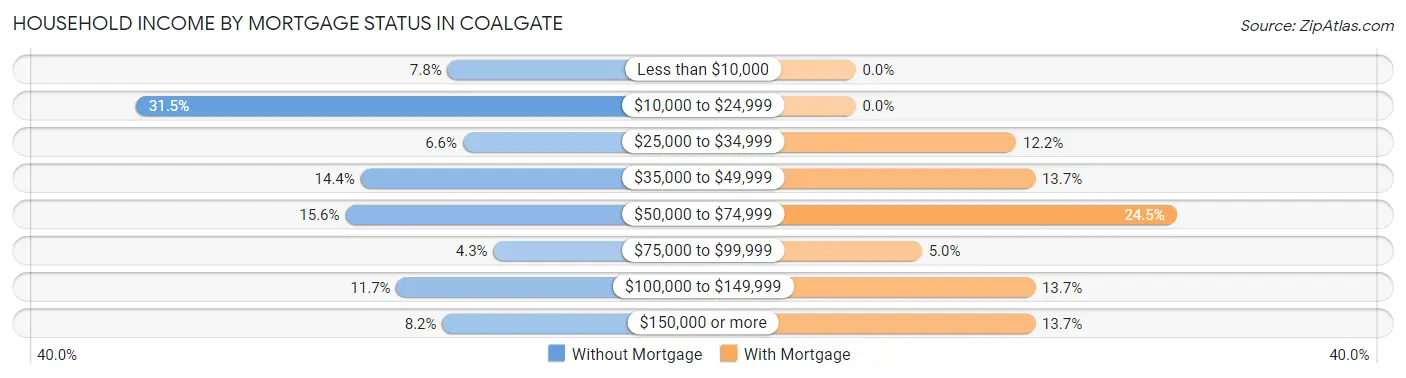
| Household Income | Without Mortgage | With Mortgage |
| Less than $10,000 | 20 (7.8%) | 0 (0.0%) |
| $10,000 to $24,999 | 81 (31.5%) | 0 (0.0%) |
| $25,000 to $34,999 | 17 (6.6%) | 17 (12.2%) |
| $35,000 to $49,999 | 37 (14.4%) | 19 (13.7%) |
| $50,000 to $74,999 | 40 (15.6%) | 34 (24.5%) |
| $75,000 to $99,999 | 11 (4.3%) | 7 (5.0%) |
| $100,000 to $149,999 | 30 (11.7%) | 19 (13.7%) |
| $150,000 or more | 21 (8.2%) | 19 (13.7%) |
| Total | 257 (100.0%) | 139 (100.0%) |
Property Value to Household Income Ratio in Coalgate
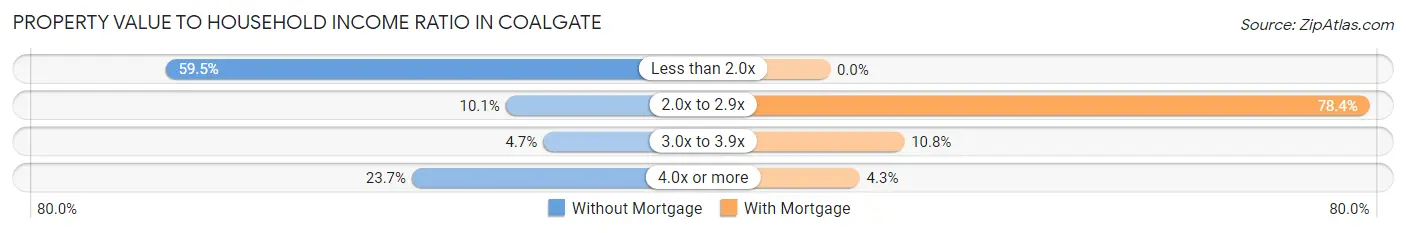
| Value-to-Income Ratio | Without Mortgage | With Mortgage |
| Less than 2.0x | 153 (59.5%) | 0 (0.0%) |
| 2.0x to 2.9x | 26 (10.1%) | 109 (78.4%) |
| 3.0x to 3.9x | 12 (4.7%) | 15 (10.8%) |
| 4.0x or more | 61 (23.7%) | 6 (4.3%) |
| Total | 257 (100.0%) | 139 (100.0%) |
Real Estate Taxes by Mortgage Status in Coalgate
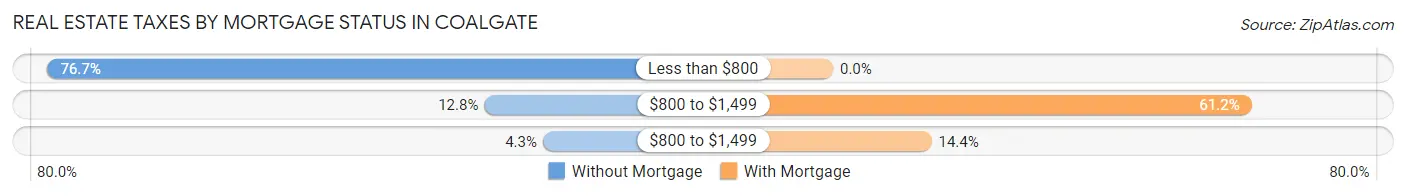
| Property Taxes | Without Mortgage | With Mortgage |
| Less than $800 | 197 (76.6%) | 0 (0.0%) |
| $800 to $1,499 | 33 (12.8%) | 85 (61.2%) |
| $800 to $1,499 | 11 (4.3%) | 20 (14.4%) |
| Total | 257 (100.0%) | 139 (100.0%) |
Health & Disability in Coalgate
Health Insurance Coverage by Age in Coalgate
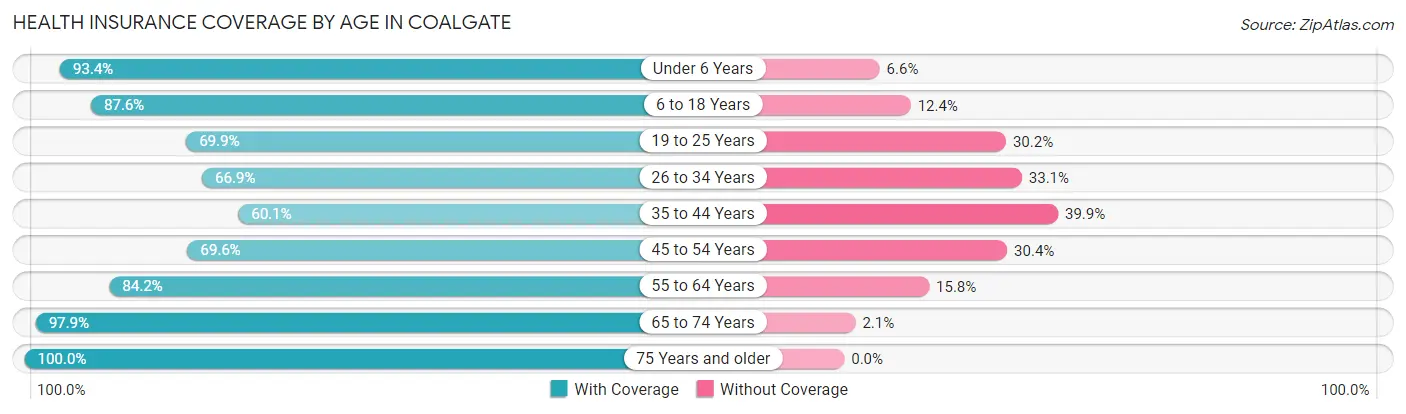
| Age Bracket | With Coverage | Without Coverage |
| Under 6 Years | 156 (93.4%) | 11 (6.6%) |
| 6 to 18 Years | 276 (87.6%) | 39 (12.4%) |
| 19 to 25 Years | 139 (69.9%) | 60 (30.1%) |
| 26 to 34 Years | 101 (66.9%) | 50 (33.1%) |
| 35 to 44 Years | 169 (60.1%) | 112 (39.9%) |
| 45 to 54 Years | 133 (69.6%) | 58 (30.4%) |
| 55 to 64 Years | 165 (84.2%) | 31 (15.8%) |
| 65 to 74 Years | 188 (97.9%) | 4 (2.1%) |
| 75 Years and older | 132 (100.0%) | 0 (0.0%) |
| Total | 1,459 (80.0%) | 365 (20.0%) |
Health Insurance Coverage by Citizenship Status in Coalgate
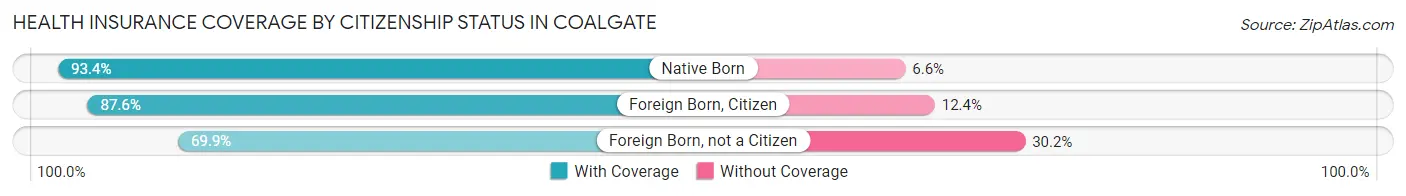
| Citizenship Status | With Coverage | Without Coverage |
| Native Born | 156 (93.4%) | 11 (6.6%) |
| Foreign Born, Citizen | 276 (87.6%) | 39 (12.4%) |
| Foreign Born, not a Citizen | 139 (69.9%) | 60 (30.1%) |
Health Insurance Coverage by Household Income in Coalgate
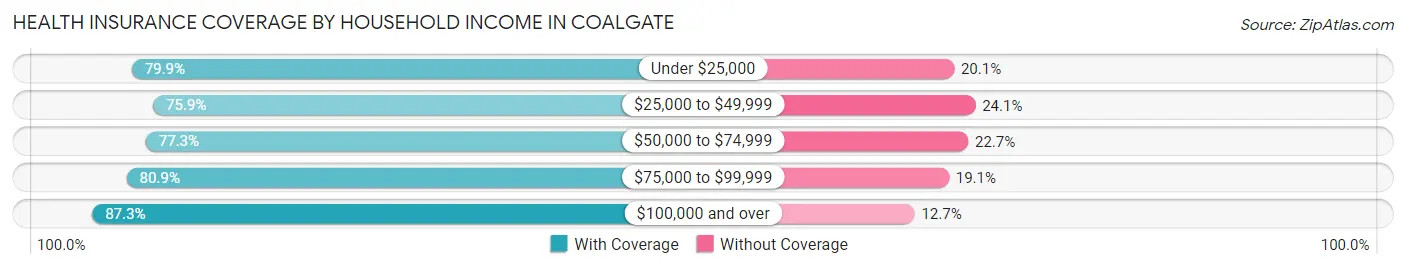
| Household Income | With Coverage | Without Coverage |
| Under $25,000 | 410 (79.9%) | 103 (20.1%) |
| $25,000 to $49,999 | 404 (75.9%) | 128 (24.1%) |
| $50,000 to $74,999 | 160 (77.3%) | 47 (22.7%) |
| $75,000 to $99,999 | 182 (80.9%) | 43 (19.1%) |
| $100,000 and over | 303 (87.3%) | 44 (12.7%) |
Public vs Private Health Insurance Coverage by Age in Coalgate
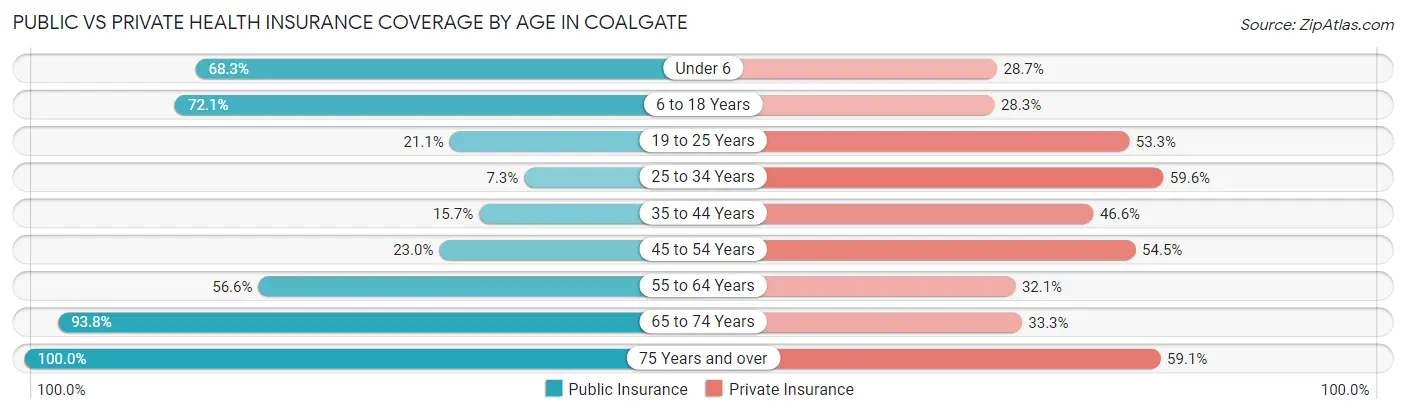
| Age Bracket | Public Insurance | Private Insurance |
| Under 6 | 114 (68.3%) | 48 (28.7%) |
| 6 to 18 Years | 227 (72.1%) | 89 (28.2%) |
| 19 to 25 Years | 42 (21.1%) | 106 (53.3%) |
| 25 to 34 Years | 11 (7.3%) | 90 (59.6%) |
| 35 to 44 Years | 44 (15.7%) | 131 (46.6%) |
| 45 to 54 Years | 44 (23.0%) | 104 (54.4%) |
| 55 to 64 Years | 111 (56.6%) | 63 (32.1%) |
| 65 to 74 Years | 180 (93.8%) | 64 (33.3%) |
| 75 Years and over | 132 (100.0%) | 78 (59.1%) |
| Total | 905 (49.6%) | 773 (42.4%) |
Disability Status by Sex by Age in Coalgate
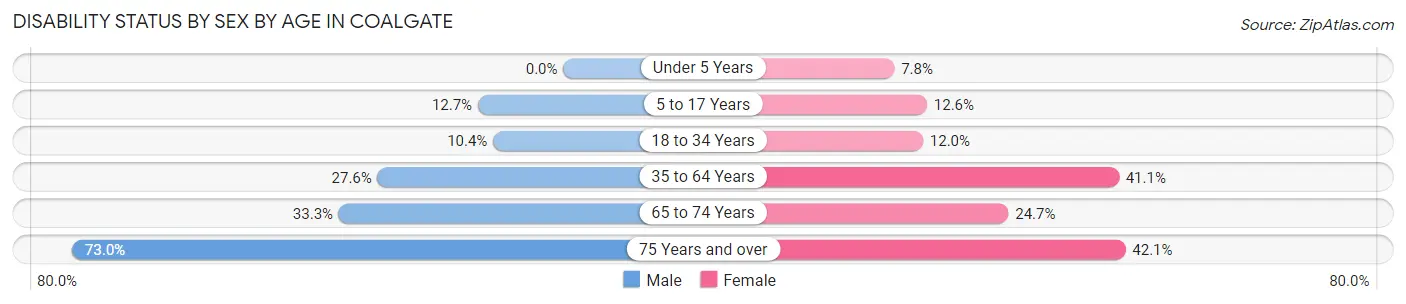
| Age Bracket | Male | Female |
| Under 5 Years | 0 (0.0%) | 6 (7.8%) |
| 5 to 17 Years | 27 (12.7%) | 12 (12.6%) |
| 18 to 34 Years | 20 (10.4%) | 23 (12.0%) |
| 35 to 64 Years | 91 (27.6%) | 139 (41.1%) |
| 65 to 74 Years | 33 (33.3%) | 23 (24.7%) |
| 75 Years and over | 27 (73.0%) | 40 (42.1%) |
Disability Class by Sex by Age in Coalgate
Disability Class: Hearing Difficulty
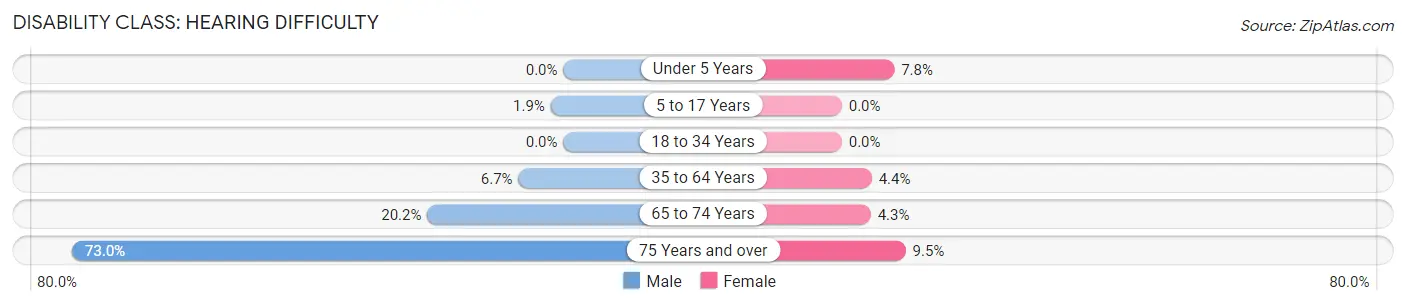
| Age Bracket | Male | Female |
| Under 5 Years | 0 (0.0%) | 6 (7.8%) |
| 5 to 17 Years | 4 (1.9%) | 0 (0.0%) |
| 18 to 34 Years | 0 (0.0%) | 0 (0.0%) |
| 35 to 64 Years | 22 (6.7%) | 15 (4.4%) |
| 65 to 74 Years | 20 (20.2%) | 4 (4.3%) |
| 75 Years and over | 27 (73.0%) | 9 (9.5%) |
Disability Class: Vision Difficulty
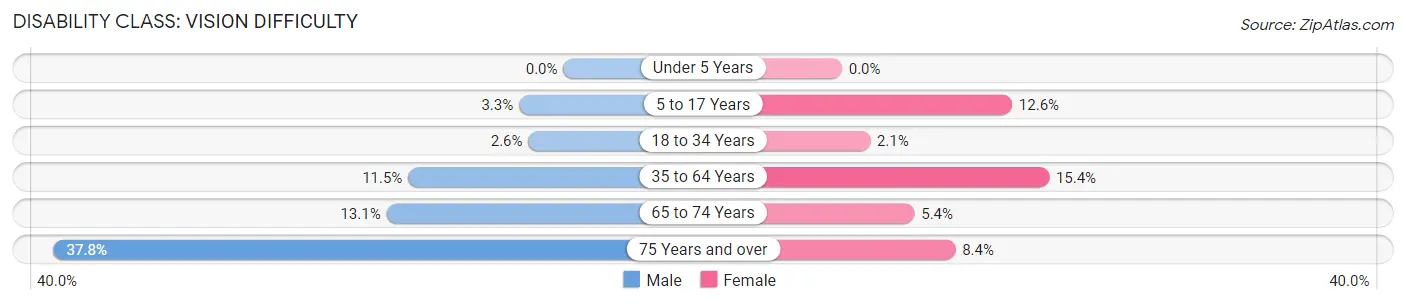
| Age Bracket | Male | Female |
| Under 5 Years | 0 (0.0%) | 0 (0.0%) |
| 5 to 17 Years | 7 (3.3%) | 12 (12.6%) |
| 18 to 34 Years | 5 (2.6%) | 4 (2.1%) |
| 35 to 64 Years | 38 (11.5%) | 52 (15.4%) |
| 65 to 74 Years | 13 (13.1%) | 5 (5.4%) |
| 75 Years and over | 14 (37.8%) | 8 (8.4%) |
Disability Class: Cognitive Difficulty
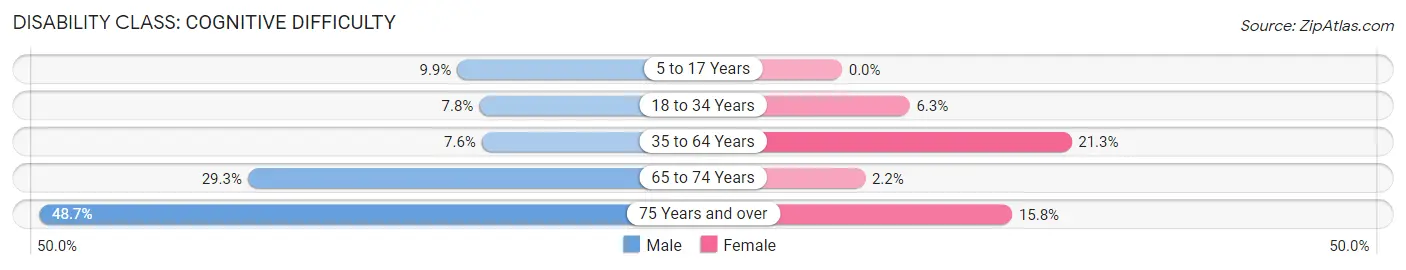
| Age Bracket | Male | Female |
| 5 to 17 Years | 21 (9.9%) | 0 (0.0%) |
| 18 to 34 Years | 15 (7.8%) | 12 (6.3%) |
| 35 to 64 Years | 25 (7.6%) | 72 (21.3%) |
| 65 to 74 Years | 29 (29.3%) | 2 (2.1%) |
| 75 Years and over | 18 (48.6%) | 15 (15.8%) |
Disability Class: Ambulatory Difficulty
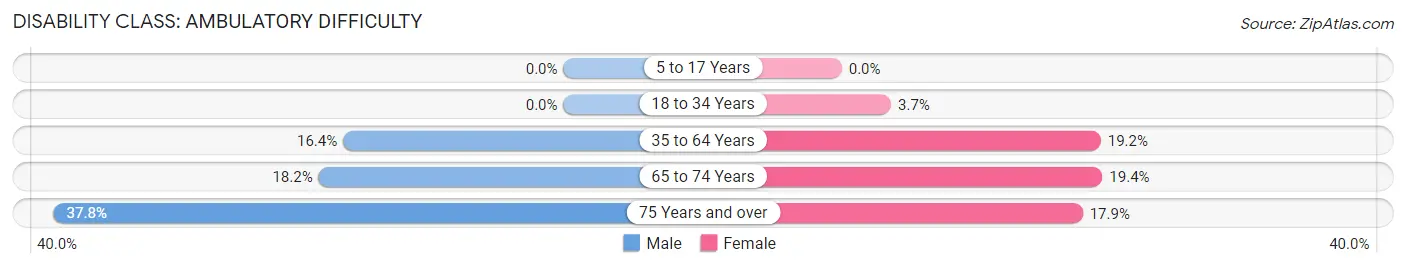
| Age Bracket | Male | Female |
| 5 to 17 Years | 0 (0.0%) | 0 (0.0%) |
| 18 to 34 Years | 0 (0.0%) | 7 (3.7%) |
| 35 to 64 Years | 54 (16.4%) | 65 (19.2%) |
| 65 to 74 Years | 18 (18.2%) | 18 (19.4%) |
| 75 Years and over | 14 (37.8%) | 17 (17.9%) |
Disability Class: Self-Care Difficulty
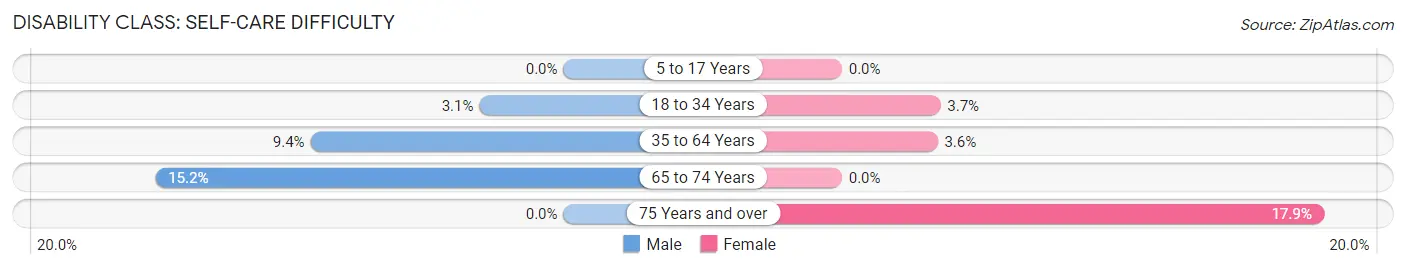
| Age Bracket | Male | Female |
| 5 to 17 Years | 0 (0.0%) | 0 (0.0%) |
| 18 to 34 Years | 6 (3.1%) | 7 (3.7%) |
| 35 to 64 Years | 31 (9.4%) | 12 (3.5%) |
| 65 to 74 Years | 15 (15.1%) | 0 (0.0%) |
| 75 Years and over | 0 (0.0%) | 17 (17.9%) |
Technology Access in Coalgate
Computing Device Access in Coalgate
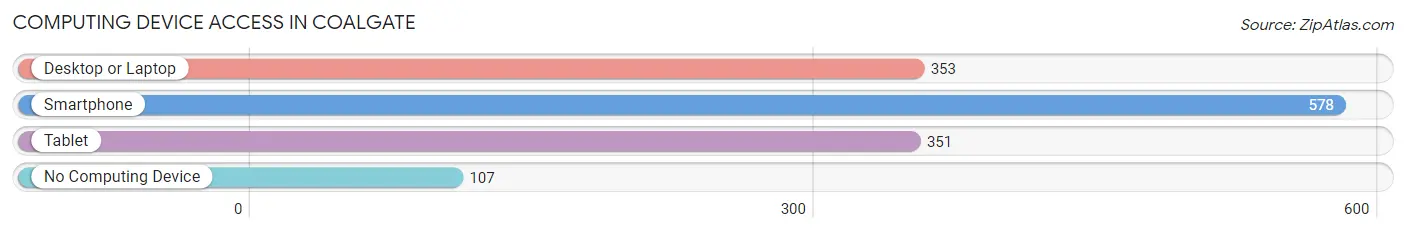
| Device Type | # Households | % Households |
| Desktop or Laptop | 353 | 48.5% |
| Smartphone | 578 | 79.4% |
| Tablet | 351 | 48.2% |
| No Computing Device | 107 | 14.7% |
| Total | 728 | 100.0% |
Internet Access in Coalgate
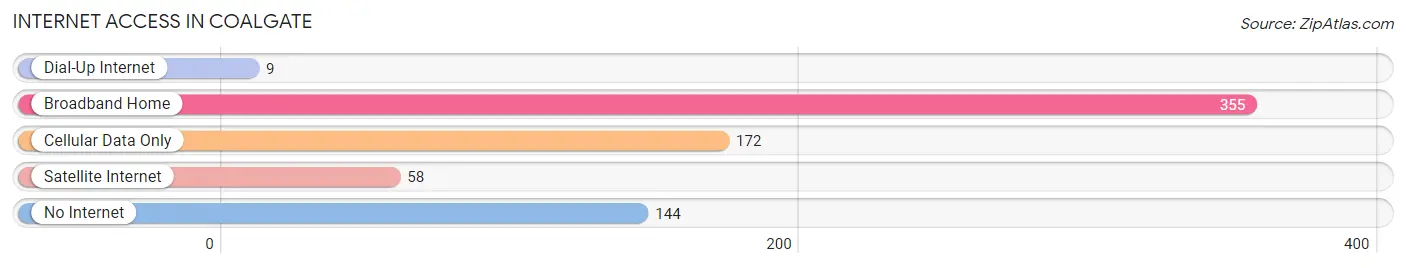
| Internet Type | # Households | % Households |
| Dial-Up Internet | 9 | 1.2% |
| Broadband Home | 355 | 48.8% |
| Cellular Data Only | 172 | 23.6% |
| Satellite Internet | 58 | 8.0% |
| No Internet | 144 | 19.8% |
| Total | 728 | 100.0% |
Coalgate Summary
Coalgate is a small town located in southeastern Oklahoma, in the United States. It is the county seat of Coal County, and is situated in the foothills of the Arbuckle Mountains. The town was founded in 1887, and was named after the coal mining industry that was prevalent in the area at the time.
Geography
Coalgate is located at the intersection of U.S. Highway 75 and State Highway 31, approximately 90 miles south of Oklahoma City. The town is situated in the foothills of the Arbuckle Mountains, and is surrounded by rolling hills and wooded areas. The town is located in a humid subtropical climate, with hot summers and mild winters. The average annual temperature is around 64°F (18°C), and the average annual precipitation is around 40 inches (101 cm).
Economy
Coalgate’s economy is largely based on agriculture and manufacturing. The town is home to several large agricultural operations, including cattle ranches, poultry farms, and cotton farms. The town is also home to several manufacturing companies, including a furniture factory, a plastics factory, and a paper mill. The town is also home to several retail stores, restaurants, and other businesses.
Demographics
As of the 2010 census, the population of Coalgate was 2,091. The racial makeup of the town was 88.3% White, 8.2% Native American, 0.7% African American, 0.3% Asian, and 2.5% from other races. The median household income was $30,938, and the median family income was $37,813. The per capita income was $15,945.
History
Coalgate was founded in 1887, and was named after the coal mining industry that was prevalent in the area at the time. The town was incorporated in 1901, and the first post office was established in 1902. The town was a major center for coal mining in the early 20th century, and the coal industry was the primary source of employment for the town’s residents. The coal industry declined in the mid-20th century, and the town’s economy shifted to agriculture and manufacturing.
Today, Coalgate is a small town with a population of just over 2,000. The town is home to several large agricultural operations, manufacturing companies, and other businesses. The town is also home to several retail stores, restaurants, and other businesses. The town is served by the Coal County School District, and is home to several churches and other community organizations.
Common Questions
What is Per Capita Income in Coalgate?
Per Capita income in Coalgate is $24,377.
What is the Median Family Income in Coalgate?
Median Family Income in Coalgate is $47,083.
What is the Median Household income in Coalgate?
Median Household Income in Coalgate is $36,019.
What is Income or Wage Gap in Coalgate?
Income or Wage Gap in Coalgate is 7.6%.
Women in Coalgate earn 92.4 cents for every dollar earned by a man.
What is Inequality or Gini Index in Coalgate?
Inequality or Gini Index in Coalgate is 0.54.
What is the Total Population of Coalgate?
Total Population of Coalgate is 1,886.
What is the Total Male Population of Coalgate?
Total Male Population of Coalgate is 948.
What is the Total Female Population of Coalgate?
Total Female Population of Coalgate is 938.
What is the Ratio of Males per 100 Females in Coalgate?
There are 101.07 Males per 100 Females in Coalgate.
What is the Ratio of Females per 100 Males in Coalgate?
There are 98.95 Females per 100 Males in Coalgate.
What is the Median Population Age in Coalgate?
Median Population Age in Coalgate is 38.4 Years.
What is the Average Family Size in Coalgate
Average Family Size in Coalgate is 3.1 People.
What is the Average Household Size in Coalgate
Average Household Size in Coalgate is 2.5 People.
How Large is the Labor Force in Coalgate?
There are 803 People in the Labor Forcein in Coalgate.
What is the Percentage of People in the Labor Force in Coalgate?
52.6% of People are in the Labor Force in Coalgate.
What is the Unemployment Rate in Coalgate?
Unemployment Rate in Coalgate is 8.8%.