Zip Codes with the Highest Percentage of Families with Income Above $100,000 in Minnesota
RELATED REPORTS & OPTIONS
Family Income | $100k+
Minnesota
Compare Zip Codes
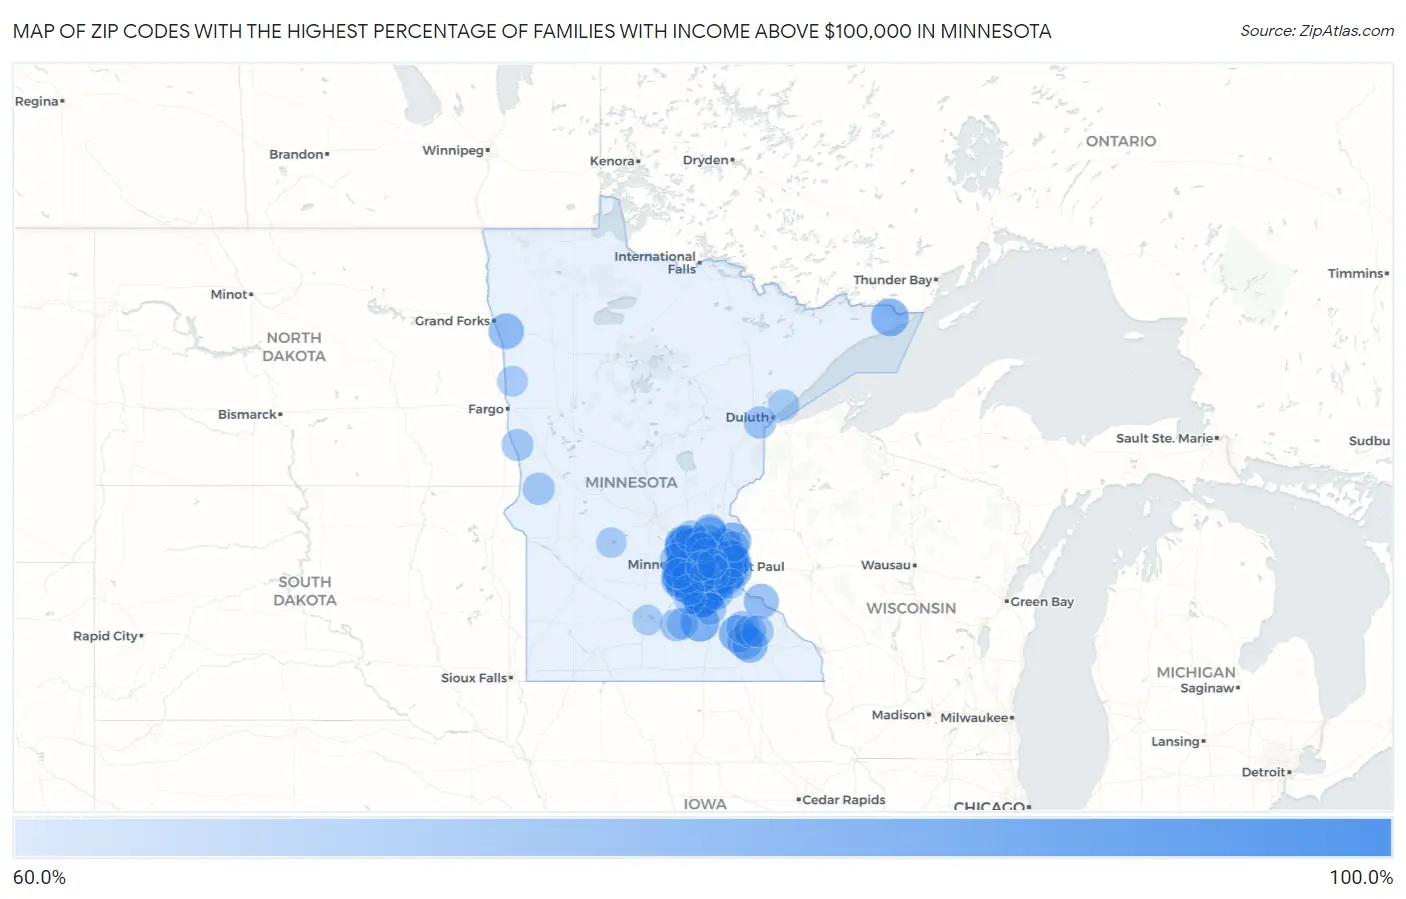
Map of Zip Codes with the Highest Percentage of Families with Income Above $100,000 in Minnesota
60.0%
100.0%
Zip Codes with the Highest Percentage of Families with Income Above $100,000 in Minnesota
| Zip Code | Families with Income > $100k | vs State | vs National | |
| 1. | 55415 | 92.9% | 53.9%(+39.0)#1 | 46.1%(+46.8)#314 |
| 2. | 55386 | 87.9% | 53.9%(+34.0)#2 | 46.1%(+41.8)#432 |
| 3. | 55439 | 85.6% | 53.9%(+31.7)#3 | 46.1%(+39.5)#560 |
| 4. | 55446 | 83.7% | 53.9%(+29.8)#4 | 46.1%(+37.6)#690 |
| 5. | 55347 | 83.3% | 53.9%(+29.4)#5 | 46.1%(+37.2)#715 |
| 6. | 55424 | 82.7% | 53.9%(+28.8)#6 | 46.1%(+36.6)#754 |
| 7. | 55105 | 80.5% | 53.9%(+26.6)#7 | 46.1%(+34.4)#972 |
| 8. | 55391 | 80.3% | 53.9%(+26.4)#8 | 46.1%(+34.2)#989 |
| 9. | 55436 | 80.3% | 53.9%(+26.4)#9 | 46.1%(+34.2)#990 |
| 10. | 55054 | 80.3% | 53.9%(+26.4)#10 | 46.1%(+34.2)#995 |
| 11. | 55340 | 79.8% | 53.9%(+25.9)#11 | 46.1%(+33.7)#1,049 |
| 12. | 55356 | 79.6% | 53.9%(+25.7)#12 | 46.1%(+33.5)#1,071 |
| 13. | 55331 | 79.2% | 53.9%(+25.3)#13 | 46.1%(+33.1)#1,117 |
| 14. | 55341 | 78.4% | 53.9%(+24.5)#14 | 46.1%(+32.3)#1,223 |
| 15. | 55129 | 78.1% | 53.9%(+24.2)#15 | 46.1%(+32.0)#1,242 |
| 16. | 55042 | 77.8% | 53.9%(+23.9)#16 | 46.1%(+31.7)#1,287 |
| 17. | 55376 | 77.6% | 53.9%(+23.7)#17 | 46.1%(+31.5)#1,323 |
| 18. | 55419 | 77.5% | 53.9%(+23.6)#18 | 46.1%(+31.4)#1,336 |
| 19. | 55401 | 77.4% | 53.9%(+23.5)#19 | 46.1%(+31.3)#1,355 |
| 20. | 55020 | 77.1% | 53.9%(+23.2)#20 | 46.1%(+31.0)#1,393 |
| 21. | 55357 | 76.8% | 53.9%(+22.9)#21 | 46.1%(+30.7)#1,441 |
| 22. | 55410 | 76.7% | 53.9%(+22.8)#22 | 46.1%(+30.6)#1,451 |
| 23. | 55123 | 76.3% | 53.9%(+22.4)#23 | 46.1%(+30.2)#1,502 |
| 24. | 55345 | 76.0% | 53.9%(+22.1)#24 | 46.1%(+29.9)#1,560 |
| 25. | 55044 | 75.3% | 53.9%(+21.4)#25 | 46.1%(+29.2)#1,652 |
| 26. | 55346 | 75.2% | 53.9%(+21.3)#26 | 46.1%(+29.1)#1,673 |
| 27. | 55374 | 75.2% | 53.9%(+21.3)#27 | 46.1%(+29.1)#1,674 |
| 28. | 55087 | 74.9% | 53.9%(+21.0)#28 | 46.1%(+28.8)#1,731 |
| 29. | 55311 | 74.6% | 53.9%(+20.7)#29 | 46.1%(+28.5)#1,757 |
| 30. | 55150 | 74.4% | 53.9%(+20.5)#30 | 46.1%(+28.3)#1,813 |
| 31. | 55038 | 74.2% | 53.9%(+20.3)#31 | 46.1%(+28.1)#1,841 |
| 32. | 55606 | 73.8% | 53.9%(+19.9)#32 | 46.1%(+27.7)#1,919 |
| 33. | 55327 | 73.3% | 53.9%(+19.4)#33 | 46.1%(+27.2)#1,994 |
| 34. | 55073 | 73.3% | 53.9%(+19.4)#34 | 46.1%(+27.2)#1,995 |
| 35. | 55447 | 73.2% | 53.9%(+19.3)#35 | 46.1%(+27.1)#2,006 |
| 36. | 55317 | 72.9% | 53.9%(+19.0)#36 | 46.1%(+26.8)#2,054 |
| 37. | 55375 | 72.9% | 53.9%(+19.0)#37 | 46.1%(+26.8)#2,062 |
| 38. | 55955 | 72.9% | 53.9%(+19.0)#38 | 46.1%(+26.8)#2,065 |
| 39. | 55417 | 72.8% | 53.9%(+18.9)#39 | 46.1%(+26.7)#2,071 |
| 40. | 55364 | 72.6% | 53.9%(+18.7)#40 | 46.1%(+26.5)#2,123 |
| 41. | 55001 | 72.0% | 53.9%(+18.1)#41 | 46.1%(+25.9)#2,223 |
| 42. | 55115 | 71.9% | 53.9%(+18.0)#42 | 46.1%(+25.8)#2,245 |
| 43. | 55315 | 71.5% | 53.9%(+17.6)#43 | 46.1%(+25.4)#2,316 |
| 44. | 55372 | 71.3% | 53.9%(+17.4)#44 | 46.1%(+25.2)#2,345 |
| 45. | 55011 | 71.3% | 53.9%(+17.4)#45 | 46.1%(+25.2)#2,348 |
| 46. | 55416 | 71.2% | 53.9%(+17.3)#46 | 46.1%(+25.1)#2,360 |
| 47. | 55088 | 70.8% | 53.9%(+16.9)#47 | 46.1%(+24.7)#2,449 |
| 48. | 55920 | 70.7% | 53.9%(+16.8)#48 | 46.1%(+24.6)#2,466 |
| 49. | 55902 | 70.4% | 53.9%(+16.5)#49 | 46.1%(+24.3)#2,520 |
| 50. | 56723 | 70.4% | 53.9%(+16.5)#50 | 46.1%(+24.3)#2,530 |
| 51. | 55378 | 70.0% | 53.9%(+16.1)#51 | 46.1%(+23.9)#2,592 |
| 52. | 55127 | 69.5% | 53.9%(+15.6)#52 | 46.1%(+23.4)#2,717 |
| 53. | 55026 | 69.4% | 53.9%(+15.5)#53 | 46.1%(+23.3)#2,750 |
| 54. | 55126 | 69.3% | 53.9%(+15.4)#54 | 46.1%(+23.2)#2,756 |
| 55. | 55068 | 69.2% | 53.9%(+15.3)#55 | 46.1%(+23.1)#2,768 |
| 56. | 55442 | 69.2% | 53.9%(+15.3)#56 | 46.1%(+23.1)#2,779 |
| 57. | 55077 | 69.1% | 53.9%(+15.2)#57 | 46.1%(+23.0)#2,803 |
| 58. | 55322 | 69.1% | 53.9%(+15.2)#58 | 46.1%(+23.0)#2,806 |
| 59. | 55082 | 68.9% | 53.9%(+15.0)#59 | 46.1%(+22.8)#2,832 |
| 60. | 55016 | 68.7% | 53.9%(+14.8)#60 | 46.1%(+22.6)#2,879 |
| 61. | 55369 | 68.1% | 53.9%(+14.2)#61 | 46.1%(+22.0)#2,991 |
| 62. | 55024 | 68.1% | 53.9%(+14.2)#62 | 46.1%(+22.0)#2,992 |
| 63. | 55449 | 67.7% | 53.9%(+13.8)#63 | 46.1%(+21.6)#3,090 |
| 64. | 55304 | 67.4% | 53.9%(+13.5)#64 | 46.1%(+21.3)#3,155 |
| 65. | 55305 | 67.4% | 53.9%(+13.5)#65 | 46.1%(+21.3)#3,165 |
| 66. | 55359 | 67.1% | 53.9%(+13.2)#66 | 46.1%(+21.0)#3,228 |
| 67. | 55125 | 67.0% | 53.9%(+13.1)#67 | 46.1%(+20.9)#3,240 |
| 68. | 55301 | 66.5% | 53.9%(+12.6)#68 | 46.1%(+20.4)#3,368 |
| 69. | 55120 | 66.5% | 53.9%(+12.6)#69 | 46.1%(+20.4)#3,373 |
| 70. | 55409 | 66.4% | 53.9%(+12.5)#70 | 46.1%(+20.3)#3,389 |
| 71. | 55328 | 66.4% | 53.9%(+12.5)#71 | 46.1%(+20.3)#3,390 |
| 72. | 55963 | 66.4% | 53.9%(+12.5)#72 | 46.1%(+20.3)#3,396 |
| 73. | 55438 | 65.7% | 53.9%(+11.8)#73 | 46.1%(+19.6)#3,555 |
| 74. | 55733 | 65.5% | 53.9%(+11.6)#74 | 46.1%(+19.4)#3,613 |
| 75. | 55960 | 65.4% | 53.9%(+11.5)#75 | 46.1%(+19.3)#3,642 |
| 76. | 55019 | 65.4% | 53.9%(+11.5)#76 | 46.1%(+19.3)#3,646 |
| 77. | 55003 | 65.3% | 53.9%(+11.4)#77 | 46.1%(+19.2)#3,677 |
| 78. | 56063 | 65.3% | 53.9%(+11.4)#78 | 46.1%(+19.2)#3,678 |
| 79. | 56274 | 65.2% | 53.9%(+11.3)#79 | 46.1%(+19.1)#3,712 |
| 80. | 55906 | 64.8% | 53.9%(+10.9)#80 | 46.1%(+18.7)#3,793 |
| 81. | 55005 | 64.8% | 53.9%(+10.9)#81 | 46.1%(+18.7)#3,802 |
| 82. | 56553 | 64.7% | 53.9%(+10.8)#82 | 46.1%(+18.6)#3,838 |
| 83. | 56028 | 64.2% | 53.9%(+10.3)#83 | 46.1%(+18.1)#3,964 |
| 84. | 55330 | 64.1% | 53.9%(+10.2)#84 | 46.1%(+18.0)#3,973 |
| 85. | 56071 | 63.9% | 53.9%(+10.00)#85 | 46.1%(+17.8)#4,037 |
| 86. | 55318 | 63.5% | 53.9%(+9.60)#86 | 46.1%(+17.4)#4,138 |
| 87. | 55804 | 63.5% | 53.9%(+9.60)#87 | 46.1%(+17.4)#4,143 |
| 88. | 55444 | 63.4% | 53.9%(+9.50)#88 | 46.1%(+17.3)#4,168 |
| 89. | 55116 | 63.1% | 53.9%(+9.20)#89 | 46.1%(+17.0)#4,254 |
| 90. | 55431 | 63.1% | 53.9%(+9.20)#90 | 46.1%(+17.0)#4,256 |
| 91. | 55352 | 62.9% | 53.9%(+9.00)#91 | 46.1%(+16.8)#4,308 |
| 92. | 55047 | 62.7% | 53.9%(+8.80)#92 | 46.1%(+16.6)#4,367 |
| 93. | 55316 | 62.6% | 53.9%(+8.70)#93 | 46.1%(+16.5)#4,383 |
| 94. | 56574 | 62.6% | 53.9%(+8.70)#94 | 46.1%(+16.5)#4,403 |
| 95. | 56021 | 62.5% | 53.9%(+8.60)#95 | 46.1%(+16.4)#4,430 |
| 96. | 55033 | 62.3% | 53.9%(+8.40)#96 | 46.1%(+16.2)#4,466 |
| 97. | 55387 | 62.3% | 53.9%(+8.40)#97 | 46.1%(+16.2)#4,473 |
| 98. | 56288 | 62.3% | 53.9%(+8.40)#98 | 46.1%(+16.2)#4,480 |
| 99. | 55426 | 62.1% | 53.9%(+8.20)#99 | 46.1%(+16.0)#4,521 |
| 100. | 55108 | 62.1% | 53.9%(+8.20)#100 | 46.1%(+16.0)#4,525 |
Common Questions
What are the Top 10 Zip Codes with the Highest Percentage of Families with Income Above $100,000 in Minnesota?
Top 10 Zip Codes with the Highest Percentage of Families with Income Above $100,000 in Minnesota are:
What zip code has the Highest Percentage of Families with Income Above $100,000 in Minnesota?
55415 has the Highest Percentage of Families with Income Above $100,000 in Minnesota with 92.9%.
What is the Percentage of Families with Income Above $100,000 in the State of Minnesota?
Percentage of Families with Income Above $100,000 in Minnesota is 53.9%.
What is the Percentage of Families with Income Above $100,000 in the United States?
Percentage of Families with Income Above $100,000 in the United States is 46.1%.