Area Code 906 Map & Demographics
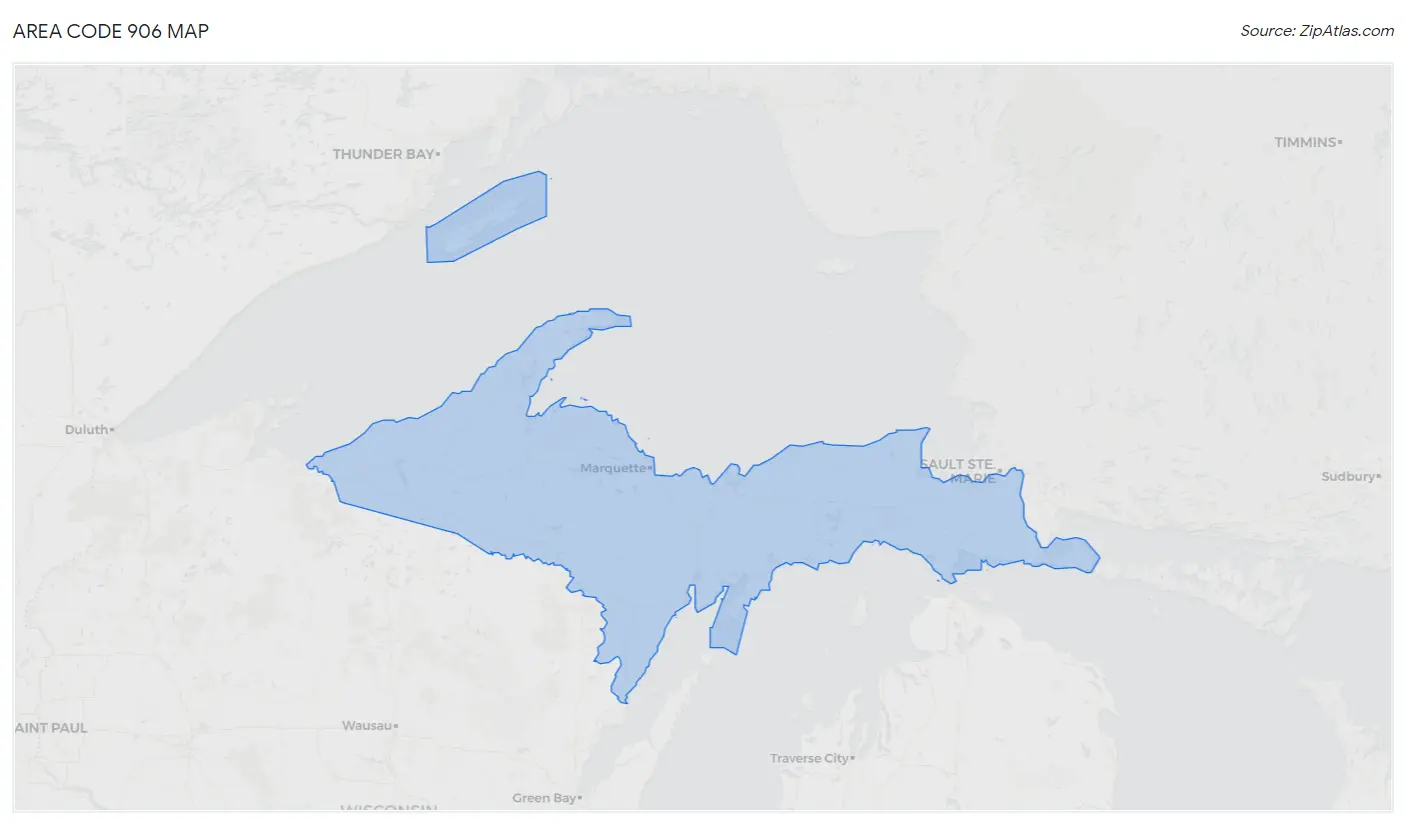
Area Code 906 Map
Area Code 906 Overview
$32,113
PER CAPITA INCOME
$70,886
AVG FAMILY INCOME
$55,775
AVG HOUSEHOLD INCOME
35.5%
WAGE / INCOME GAP [ % ]
64.5¢/ $1
WAGE / INCOME GAP [ $ ]
$11,007
FAMILY INCOME DEFICIT
53.88
INEQUALITY / GINI INDEX
302,509
TOTAL POPULATION
157,740
MALE POPULATION
144,769
FEMALE POPULATION
108.96
MALES / 100 FEMALES
91.78
FEMALES / 100 MALES
50.4
MEDIAN AGE
2.8
AVG FAMILY SIZE
2.2
AVG HOUSEHOLD SIZE
123,994
LABOR FORCE [ PEOPLE ]
48.7%
PERCENT IN LABOR FORCE
7.7%
UNEMPLOYMENT RATE
Income in Area Code 906
Income Overview in Area Code 906
Per Capita Income in Area Code 906 is $32,113, while median incomes of families and households are $70,886 and $55,775 respectively.
| Characteristic | Number | Measure |
| Per Capita Income | 302,509 | $32,113 |
| Median Family Income | 76,209 | $70,886 |
| Mean Family Income | 76,209 | $11,515,473 |
| Median Household Income | 126,437 | $55,775 |
| Mean Household Income | 126,437 | $9,556,406 |
| Income Deficit | 76,209 | $11,007 |
| Wage / Income Gap (%) | 302,509 | 35.50% |
| Wage / Income Gap ($) | 302,509 | 64.50¢ per $1 |
| Gini / Inequality Index | 302,509 | 53.88 |
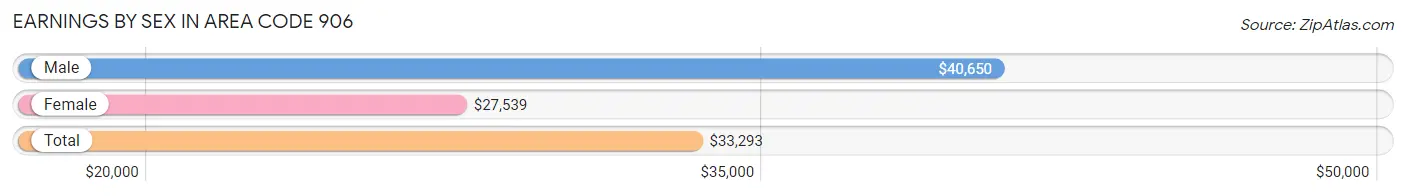
Earnings by Sex in Area Code 906
Average Earnings in Area Code 906 are $33,293, $40,650 for men and $27,539 for women, a difference of 32.3%.
| Sex | Number | Average Earnings |
| Male | 81,092 (53.8%) | $40,650 |
| Female | 69,657 (46.2%) | $27,539 |
| Total | 150,749 (100.0%) | $33,293 |
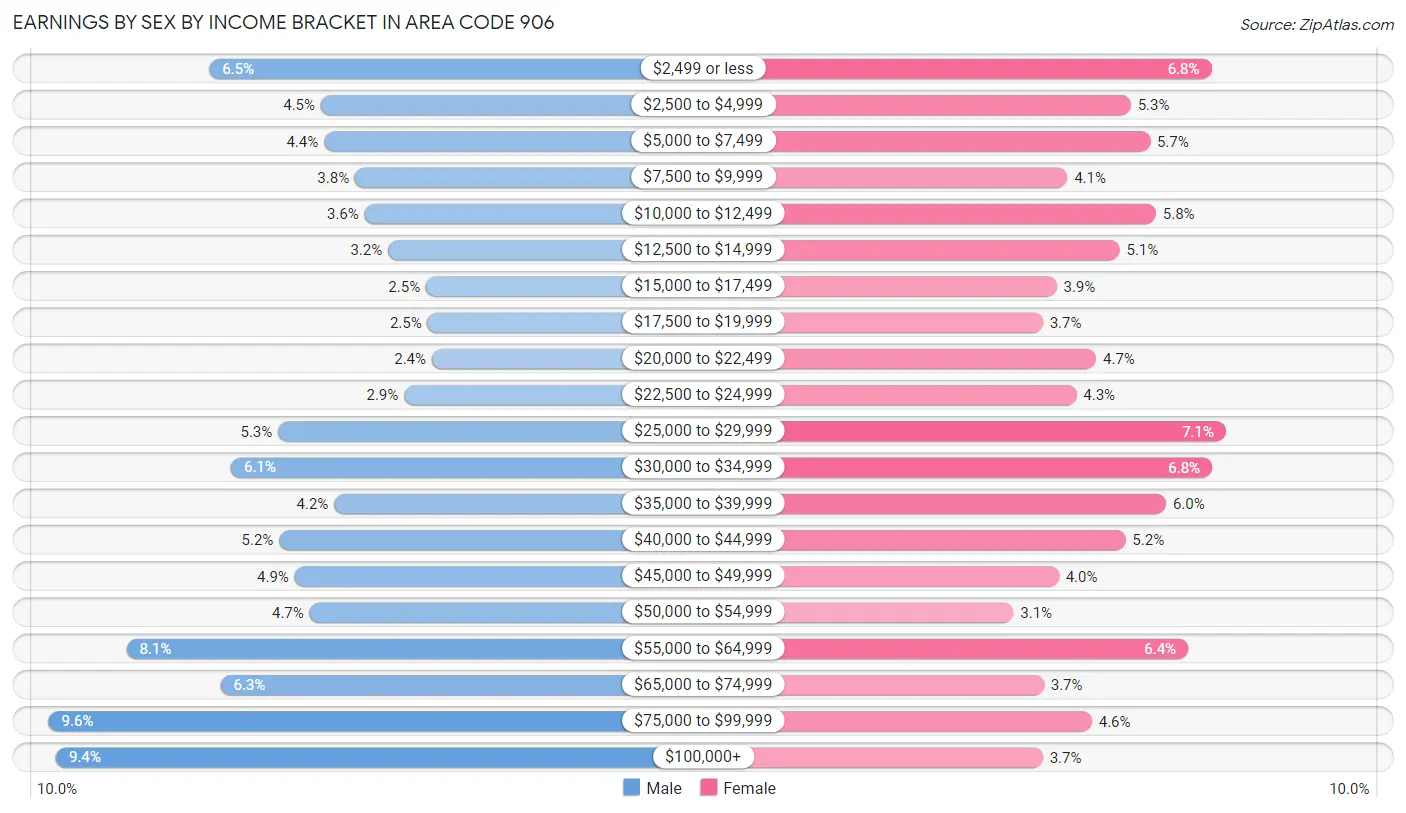
Earnings by Sex by Income Bracket in Area Code 906
The most common earnings brackets in Area Code 906 are $75,000 to $99,999 for men (7,742 | 9.6%) and $25,000 to $29,999 for women (4,948 | 7.1%).
| Income | Male | Female |
| $2,499 or less | 5,307 (6.5%) | 4,756 (6.8%) |
| $2,500 to $4,999 | 3,612 (4.4%) | 3,707 (5.3%) |
| $5,000 to $7,499 | 3,562 (4.4%) | 3,955 (5.7%) |
| $7,500 to $9,999 | 3,092 (3.8%) | 2,877 (4.1%) |
| $10,000 to $12,499 | 2,944 (3.6%) | 4,034 (5.8%) |
| $12,500 to $14,999 | 2,585 (3.2%) | 3,560 (5.1%) |
| $15,000 to $17,499 | 2,015 (2.5%) | 2,737 (3.9%) |
| $17,500 to $19,999 | 1,990 (2.5%) | 2,554 (3.7%) |
| $20,000 to $22,499 | 1,919 (2.4%) | 3,250 (4.7%) |
| $22,500 to $24,999 | 2,340 (2.9%) | 2,996 (4.3%) |
| $25,000 to $29,999 | 4,257 (5.2%) | 4,948 (7.1%) |
| $30,000 to $34,999 | 4,974 (6.1%) | 4,764 (6.8%) |
| $35,000 to $39,999 | 3,405 (4.2%) | 4,166 (6.0%) |
| $40,000 to $44,999 | 4,240 (5.2%) | 3,636 (5.2%) |
| $45,000 to $49,999 | 4,004 (4.9%) | 2,768 (4.0%) |
| $50,000 to $54,999 | 3,779 (4.7%) | 2,176 (3.1%) |
| $55,000 to $64,999 | 6,562 (8.1%) | 4,448 (6.4%) |
| $65,000 to $74,999 | 5,132 (6.3%) | 2,570 (3.7%) |
| $75,000 to $99,999 | 7,742 (9.6%) | 3,198 (4.6%) |
| $100,000+ | 7,631 (9.4%) | 2,557 (3.7%) |
| Total | 81,092 (100.0%) | 69,657 (100.0%) |
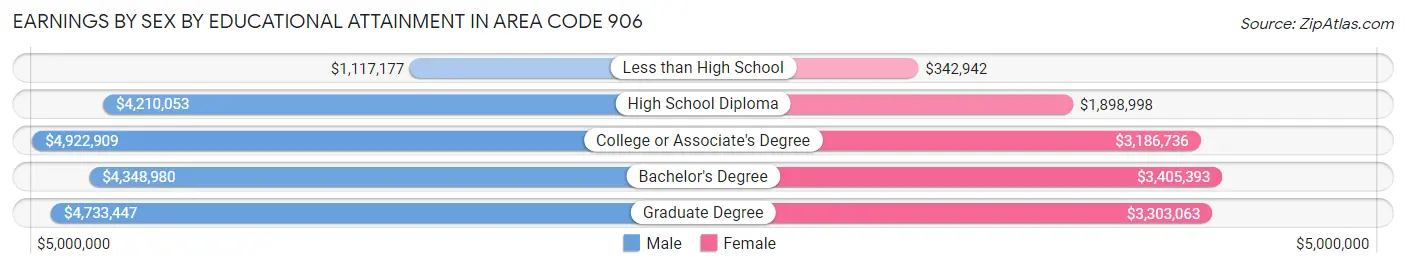
Earnings by Sex by Educational Attainment in Area Code 906
Average earnings in Area Code 906 are $5,411,926 for men and $3,560,793 for women, a difference of 34.2%. Men with an educational attainment of college or associate's degree enjoy the highest average annual earnings of $4,922,909, while those with less than high school education earn the least with $1,117,177. Women with an educational attainment of bachelor's degree earn the most with the average annual earnings of $3,405,393, while those with less than high school education have the smallest earnings of $342,942.
| Educational Attainment | Male Income | Female Income |
| Less than High School | $1,117,177 | $342,942 |
| High School Diploma | $4,210,053 | $1,898,998 |
| College or Associate's Degree | $4,922,909 | $3,186,736 |
| Bachelor's Degree | $4,348,980 | $3,405,393 |
| Graduate Degree | $4,733,447 | $3,303,063 |
| Total | $5,411,926 | $3,560,793 |
Family Income in Area Code 906
Family Income Brackets in Area Code 906
According to the Area Code 906 family income data, there are 2,340,074 families falling into the $50,000 to $74,999 income range, which is the most common income bracket and makes up 3,070.6% of all families. Conversely, the $10,000 to $14,999 income bracket is the least frequent group with only 221,616 families (290.8%) belonging to this category.
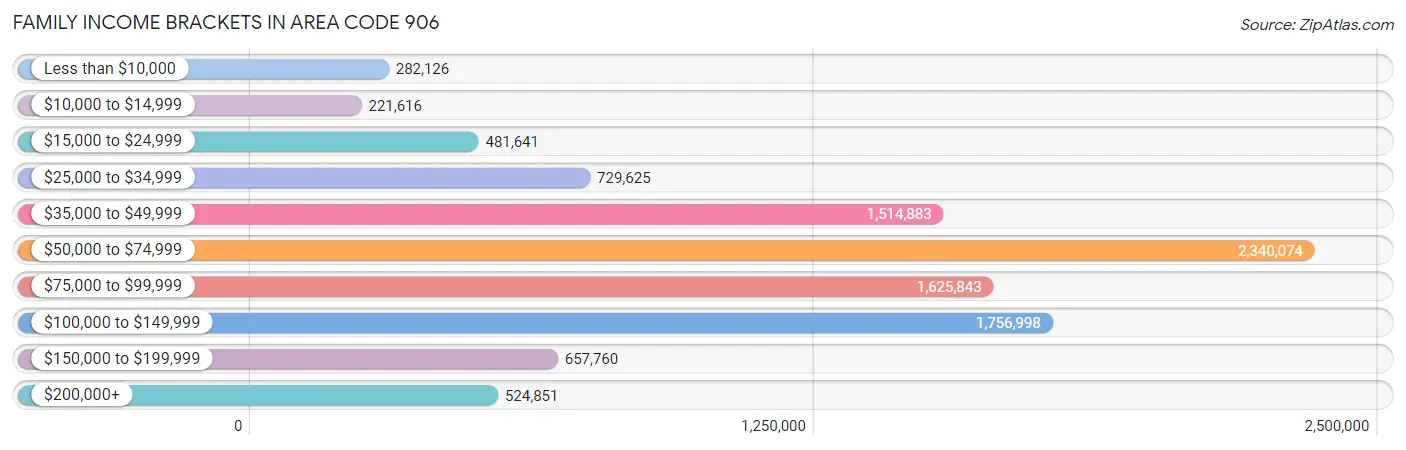
| Income Bracket | # Families | % Families |
| Less than $10,000 | 282,126 | 370.2% |
| $10,000 to $14,999 | 221,616 | 290.8% |
| $15,000 to $24,999 | 481,641 | 632.0% |
| $25,000 to $34,999 | 729,625 | 957.4% |
| $35,000 to $49,999 | 1,514,883 | 1,987.8% |
| $50,000 to $74,999 | 2,340,074 | 3,070.6% |
| $75,000 to $99,999 | 1,625,843 | 2,133.4% |
| $100,000 to $149,999 | 1,756,998 | 2,305.5% |
| $150,000 to $199,999 | 657,760 | 863.1% |
| $200,000+ | 524,851 | 688.7% |
Family Income by Famaliy Size in Area Code 906
6-person families (1,597 | 2.1%) account for the highest median family income in Area Code 906 with $104,505 per family, while 2-person families (46,025 | 60.4%) have the highest median income of $33,712 per family member.
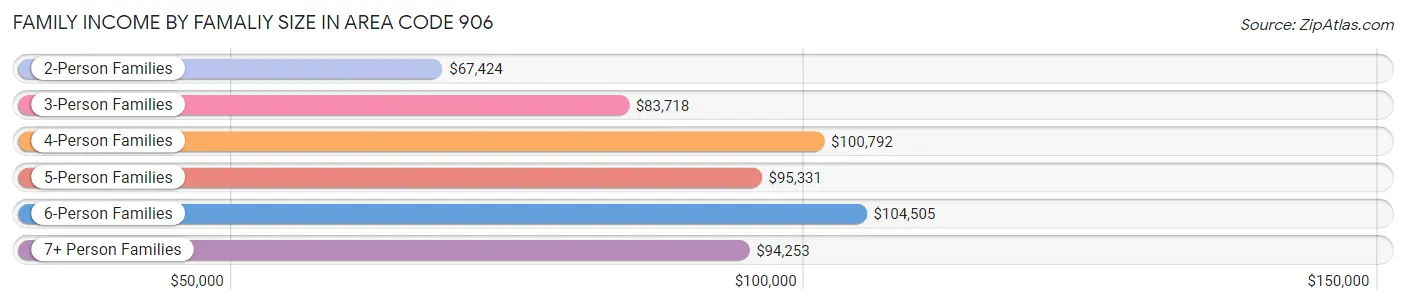
| Income Bracket | # Families | Median Income |
| 2-Person Families | 46,025 (60.4%) | $67,424 |
| 3-Person Families | 14,030 (18.4%) | $83,718 |
| 4-Person Families | 9,560 (12.5%) | $100,792 |
| 5-Person Families | 3,964 (5.2%) | $95,331 |
| 6-Person Families | 1,597 (2.1%) | $104,505 |
| 7+ Person Families | 1,033 (1.4%) | $94,253 |
| Total | 76,209 (100.0%) | $70,886 |
Family Income by Number of Earners in Area Code 906
The median family income in Area Code 906 is $70,886, with families comprising 3+ earners (6,650) having the highest median family income of $126,667, while families with no earners (18,931) have the lowest median family income of $53,268, accounting for 8.7% and 24.8% of families, respectively.
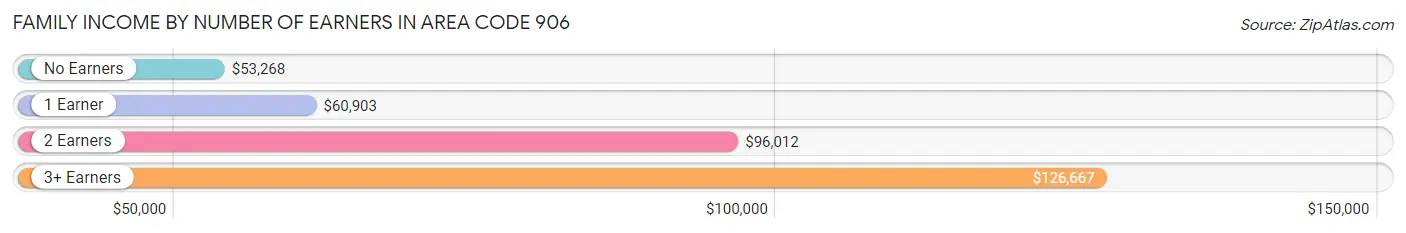
| Number of Earners | # Families | Median Income |
| No Earners | 18,931 (24.8%) | $53,268 |
| 1 Earner | 23,012 (30.2%) | $60,903 |
| 2 Earners | 27,616 (36.2%) | $96,012 |
| 3+ Earners | 6,650 (8.7%) | $126,667 |
| Total | 76,209 (100.0%) | $70,886 |
Household Income in Area Code 906
Household Income Brackets in Area Code 906
With 3,508,247 households falling in the category, the $50,000 to $74,999 income range is the most frequent in Area Code 906, accounting for 2,774.7% of all households. In contrast, only 539,001 households (426.3%) fall into the $200,000+ income bracket, making it the least populous group.
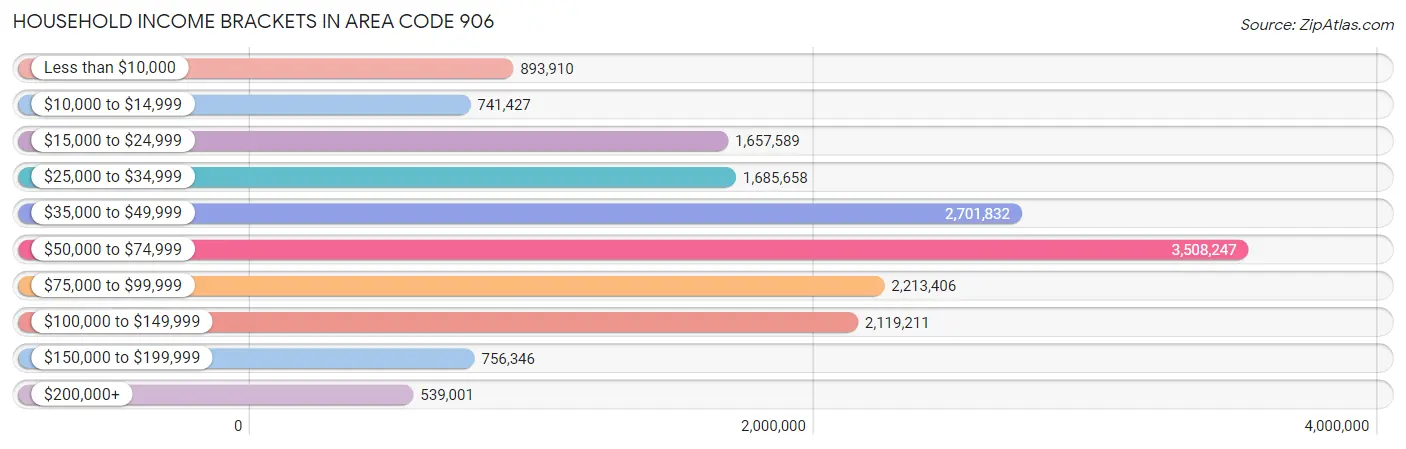
| Income Bracket | # Households | % Households |
| Less than $10,000 | 893,910 | 707.0% |
| $10,000 to $14,999 | 741,427 | 586.4% |
| $15,000 to $24,999 | 1,657,589 | 1,311.0% |
| $25,000 to $34,999 | 1,685,658 | 1,333.2% |
| $35,000 to $49,999 | 2,701,832 | 2,136.9% |
| $50,000 to $74,999 | 3,508,247 | 2,774.7% |
| $75,000 to $99,999 | 2,213,406 | 1,750.6% |
| $100,000 to $149,999 | 2,119,211 | 1,676.1% |
| $150,000 to $199,999 | 756,346 | 598.2% |
| $200,000+ | 539,001 | 426.3% |
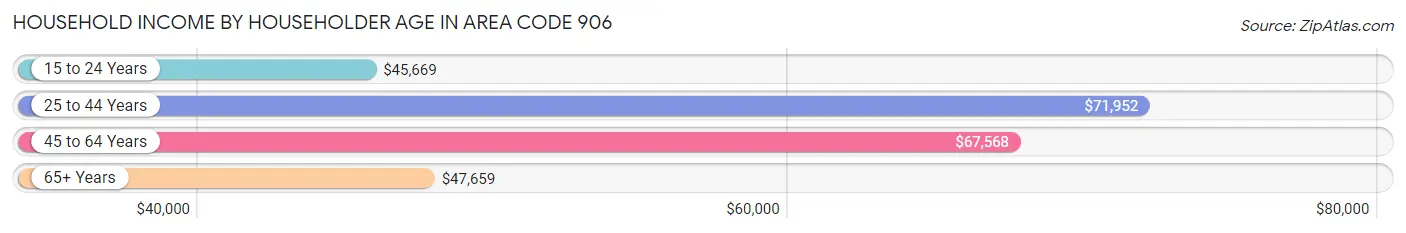
Household Income by Householder Age in Area Code 906
The median household income in Area Code 906 is $55,775, with the highest median household income of $71,952 found in the 25 to 44 years age bracket for the primary householder. A total of 30,568 households (24.2%) fall into this category. Meanwhile, the 15 to 24 years age bracket for the primary householder has the lowest median household income of $45,669, with 6,921 households (5.5%) in this group.
| Income Bracket | # Households | Median Income |
| 15 to 24 Years | 6,921 (5.5%) | $45,669 |
| 25 to 44 Years | 30,568 (24.2%) | $71,952 |
| 45 to 64 Years | 44,838 (35.5%) | $67,568 |
| 65+ Years | 44,110 (34.9%) | $47,659 |
| Total | 126,437 (100.0%) | $55,775 |
Poverty in Area Code 906
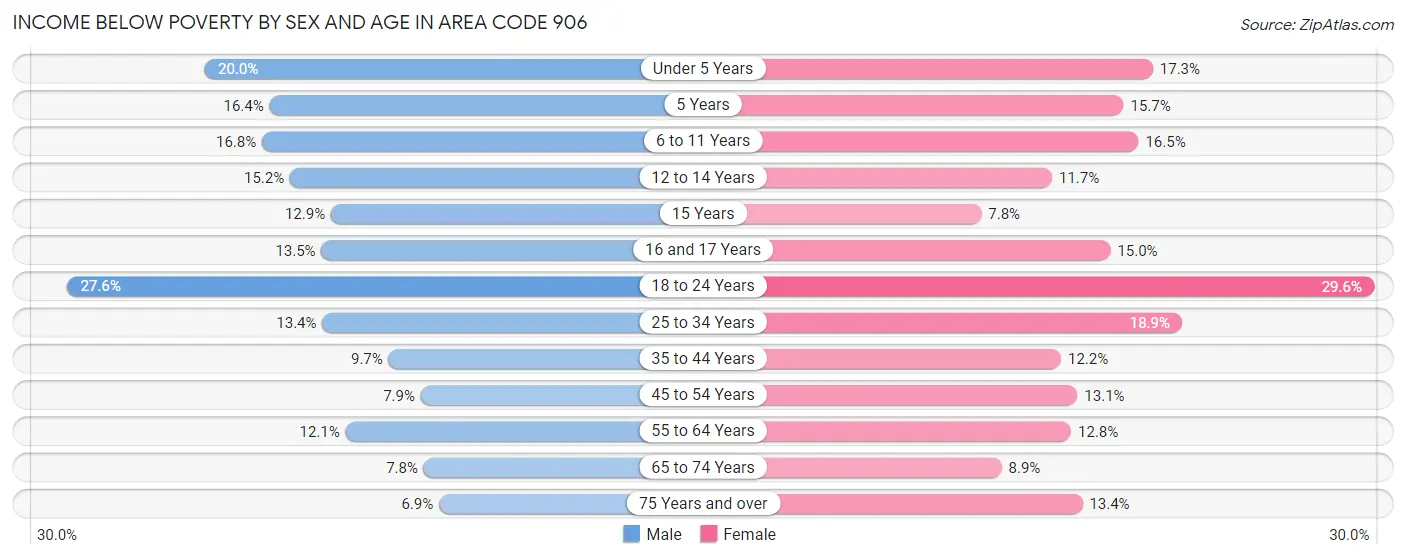
Income Below Poverty by Sex and Age in Area Code 906
With 12.9% poverty level for males and 14.9% for females among the residents of Area Code 906, 18 to 24 year old males and 18 to 24 year old females are the most vulnerable to poverty, with 4,122 males (27.6%) and 3,879 females (29.6%) in their respective age groups living below the poverty level.
| Age Bracket | Male | Female |
| Under 5 Years | 1,349 (20.0%) | 1,121 (17.3%) |
| 5 Years | 248 (16.4%) | 196 (15.7%) |
| 6 to 11 Years | 1,544 (16.8%) | 1,392 (16.5%) |
| 12 to 14 Years | 735 (15.2%) | 561 (11.7%) |
| 15 Years | 236 (12.9%) | 125 (7.8%) |
| 16 and 17 Years | 469 (13.5%) | 476 (15.0%) |
| 18 to 24 Years | 4,122 (27.6%) | 3,879 (29.6%) |
| 25 to 34 Years | 2,058 (13.4%) | 2,736 (18.9%) |
| 35 to 44 Years | 1,559 (9.7%) | 1,807 (12.2%) |
| 45 to 54 Years | 1,305 (7.9%) | 2,117 (13.1%) |
| 55 to 64 Years | 2,724 (12.1%) | 2,819 (12.8%) |
| 65 to 74 Years | 1,608 (7.8%) | 1,753 (8.9%) |
| 75 Years and over | 821 (6.9%) | 1,956 (13.4%) |
| Total | 18,778 (12.9%) | 20,938 (14.9%) |
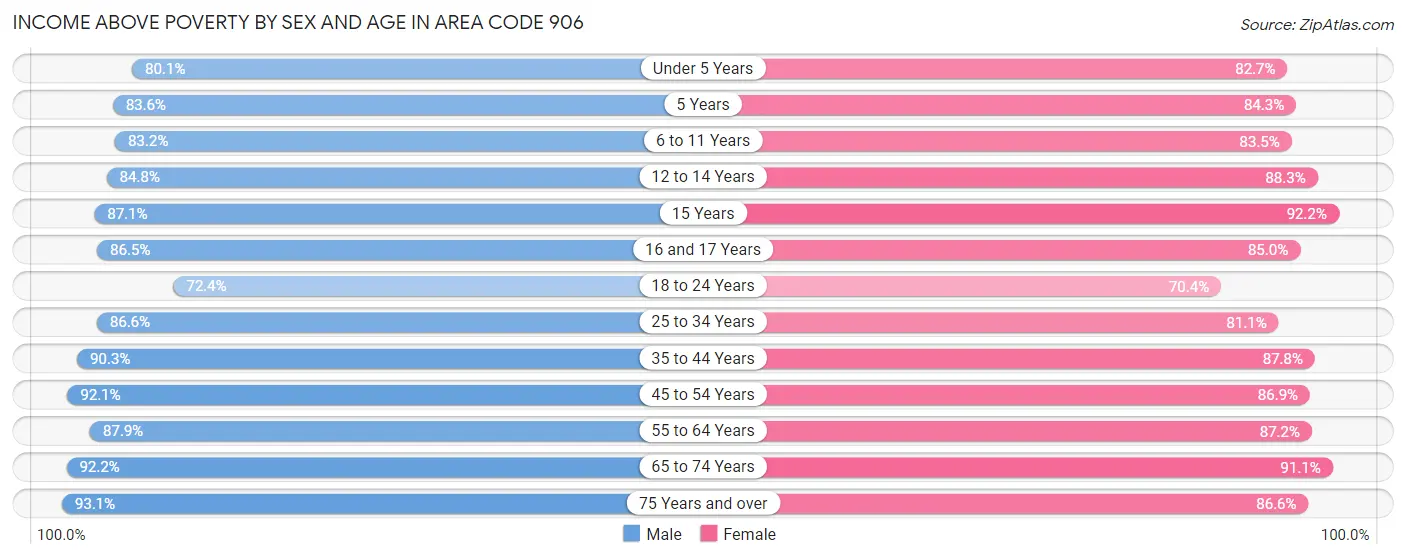
Income Above Poverty by Sex and Age in Area Code 906
According to the poverty statistics in Area Code 906, males aged 75 years and over and females aged 15 years are the age groups that are most secure financially, with 93.1% of males and 92.2% of females in these age groups living above the poverty line.
| Age Bracket | Male | Female |
| Under 5 Years | 5,412 (80.0%) | 5,351 (82.7%) |
| 5 Years | 1,268 (83.6%) | 1,053 (84.3%) |
| 6 to 11 Years | 7,656 (83.2%) | 7,036 (83.5%) |
| 12 to 14 Years | 4,093 (84.8%) | 4,229 (88.3%) |
| 15 Years | 1,588 (87.1%) | 1,484 (92.2%) |
| 16 and 17 Years | 3,014 (86.5%) | 2,706 (85.0%) |
| 18 to 24 Years | 10,810 (72.4%) | 9,217 (70.4%) |
| 25 to 34 Years | 13,275 (86.6%) | 11,718 (81.1%) |
| 35 to 44 Years | 14,465 (90.3%) | 12,992 (87.8%) |
| 45 to 54 Years | 15,131 (92.1%) | 14,018 (86.9%) |
| 55 to 64 Years | 19,727 (87.9%) | 19,250 (87.2%) |
| 65 to 74 Years | 19,083 (92.2%) | 17,939 (91.1%) |
| 75 Years and over | 11,039 (93.1%) | 12,636 (86.6%) |
| Total | 126,561 (87.1%) | 119,629 (85.1%) |
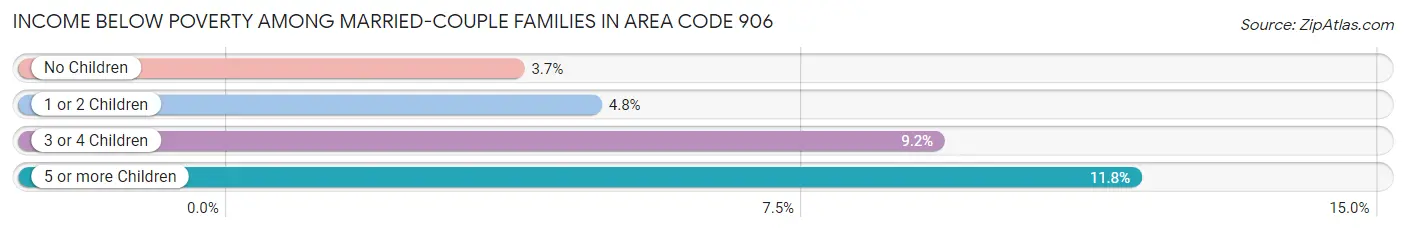
Income Below Poverty Among Married-Couple Families in Area Code 906
The poverty statistics for married-couple families in Area Code 906 show that 4.4% or 2,666 of the total 60,725 families live below the poverty line. Families with 5 or more children have the highest poverty rate of 11.8%, comprising of 76 families. On the other hand, families with no children have the lowest poverty rate of 3.7%, which includes 1,598 families.
| Children | Above Poverty | Below Poverty |
| No Children | 41,110 (96.3%) | 1,598 (3.7%) |
| 1 or 2 Children | 12,999 (95.3%) | 648 (4.8%) |
| 3 or 4 Children | 3,382 (90.8%) | 344 (9.2%) |
| 5 or more Children | 568 (88.2%) | 76 (11.8%) |
| Total | 58,059 (95.6%) | 2,666 (4.4%) |
Income Below Poverty Among Single-Parent Households in Area Code 906
According to the poverty data in Area Code 906, 14.3% or 806 single-father households and 29.6% or 2,916 single-mother households are living below the poverty line. Among single-father households, those with 3 or 4 children have the highest poverty rate, with 146 households (34.8%) experiencing poverty. Likewise, among single-mother households, those with 5 or more children have the highest poverty rate, with 62 households (63.9%) falling below the poverty line.
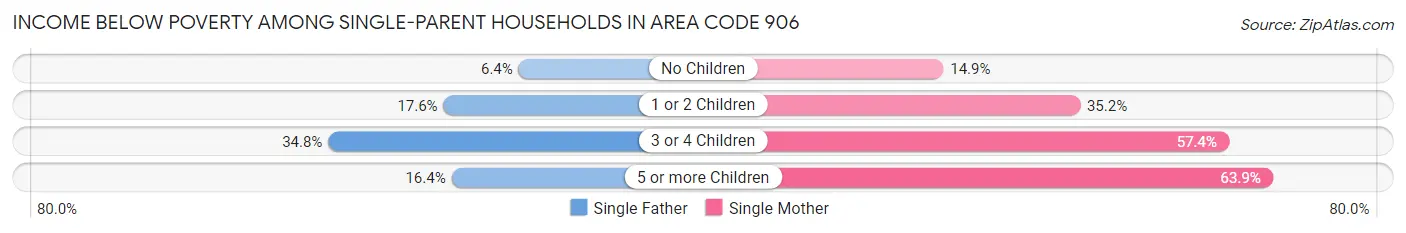
| Children | Single Father | Single Mother |
| No Children | 147 (6.4%) | 570 (14.8%) |
| 1 or 2 Children | 503 (17.6%) | 1,755 (35.2%) |
| 3 or 4 Children | 146 (34.8%) | 529 (57.4%) |
| 5 or more Children | 10 (16.4%) | 62 (63.9%) |
| Total | 806 (14.3%) | 2,916 (29.6%) |
Income Below Poverty Among Married-Couple vs Single-Parent Households in Area Code 906
The poverty data for Area Code 906 shows that 2,666 of the married-couple family households (4.4%) and 3,722 of the single-parent households (24.0%) are living below the poverty level. Within the married-couple family households, those with 5 or more children have the highest poverty rate, with 76 households (11.8%) falling below the poverty line. Among the single-parent households, those with 3 or 4 children have the highest poverty rate, with 675 household (50.3%) living below poverty.
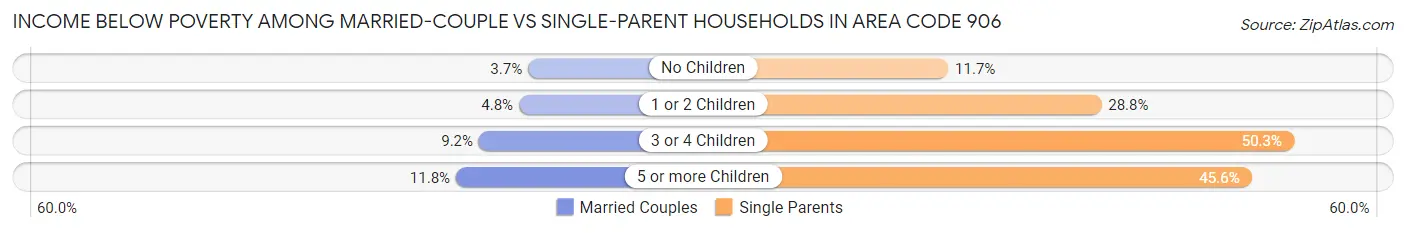
| Children | Married-Couple Families | Single-Parent Households |
| No Children | 1,598 (3.7%) | 717 (11.7%) |
| 1 or 2 Children | 648 (4.8%) | 2,258 (28.8%) |
| 3 or 4 Children | 344 (9.2%) | 675 (50.3%) |
| 5 or more Children | 76 (11.8%) | 72 (45.6%) |
| Total | 2,666 (4.4%) | 3,722 (24.0%) |
Race in Area Code 906
The most populous races in Area Code 906 are White / Caucasian (265,048 | 87.6%), Two or more Races (15,820 | 5.2%), and Native / Alaskan (10,694 | 3.5%).
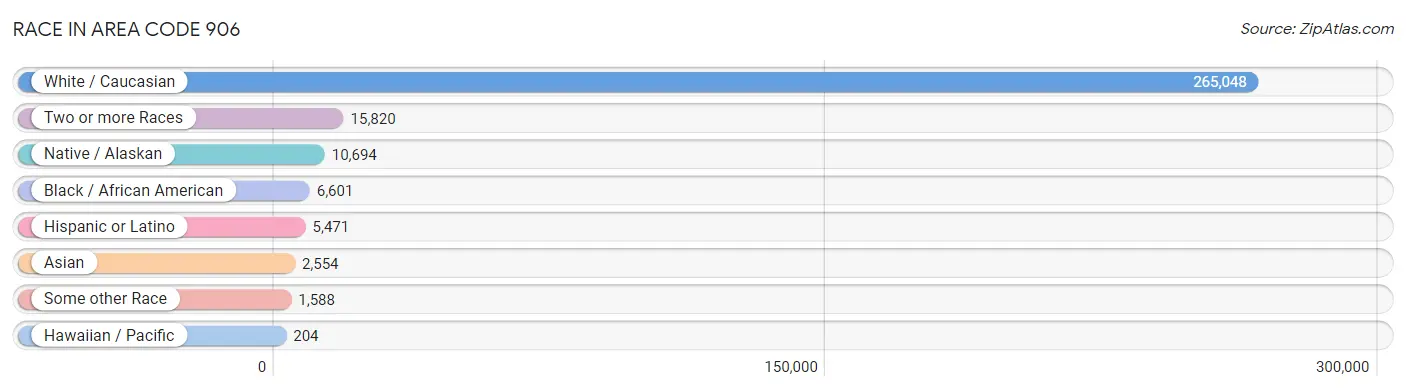
| Race | # Population | % Population |
| Asian | 2,554 | 0.8% |
| Black / African American | 6,601 | 2.2% |
| Hawaiian / Pacific | 204 | 0.1% |
| Hispanic or Latino | 5,471 | 1.8% |
| Native / Alaskan | 10,694 | 3.5% |
| White / Caucasian | 265,048 | 87.6% |
| Two or more Races | 15,820 | 5.2% |
| Some other Race | 1,588 | 0.5% |
| Total | 302,509 | 100.0% |
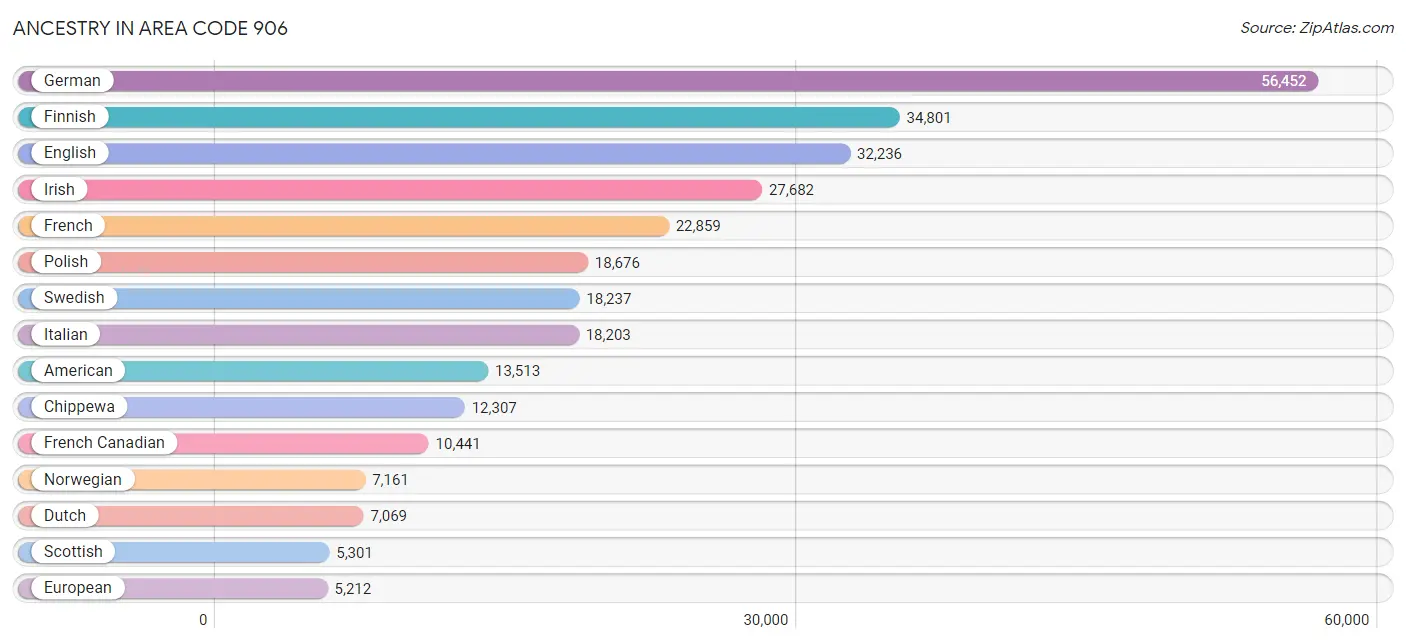
Ancestry in Area Code 906
The most populous ancestries reported in Area Code 906 are German (56,452 | 18.7%), Finnish (34,801 | 11.5%), English (32,236 | 10.7%), Irish (27,682 | 9.1%), and French (22,859 | 7.6%), together accounting for 57.5% of all Area Code 906 residents.
| Ancestry | # Population | % Population |
| African | 436 | 0.1% |
| Alaska Native | 2 | 0.0% |
| Alaskan Athabascan | 6 | 0.0% |
| Albanian | 23 | 0.0% |
| Alsatian | 1 | 0.0% |
| American | 13,513 | 4.5% |
| Apache | 33 | 0.0% |
| Arab | 716 | 0.2% |
| Arapaho | 8 | 0.0% |
| Argentinean | 46 | 0.0% |
| Armenian | 110 | 0.0% |
| Assyrian / Chaldean / Syriac | 94 | 0.0% |
| Australian | 18 | 0.0% |
| Austrian | 996 | 0.3% |
| Bangladeshi | 59 | 0.0% |
| Belgian | 2,860 | 0.9% |
| Bhutanese | 474 | 0.2% |
| Blackfeet | 300 | 0.1% |
| Bolivian | 30 | 0.0% |
| Brazilian | 99 | 0.0% |
| British | 1,148 | 0.4% |
| Bulgarian | 89 | 0.0% |
| Burmese | 458 | 0.2% |
| Cajun | 14 | 0.0% |
| Cambodian | 10 | 0.0% |
| Canadian | 708 | 0.2% |
| Carpatho Rusyn | 9 | 0.0% |
| Celtic | 21 | 0.0% |
| Central American | 376 | 0.1% |
| Central American Indian | 34 | 0.0% |
| Cherokee | 729 | 0.2% |
| Chickasaw | 40 | 0.0% |
| Chilean | 11 | 0.0% |
| Chinese | 5 | 0.0% |
| Chippewa | 12,307 | 4.1% |
| Choctaw | 41 | 0.0% |
| Colombian | 41 | 0.0% |
| Comanche | 16 | 0.0% |
| Costa Rican | 99 | 0.0% |
| Cree | 26 | 0.0% |
| Creek | 40 | 0.0% |
| Croatian | 2,536 | 0.8% |
| Crow | 3 | 0.0% |
| Cuban | 174 | 0.1% |
| Czech | 1,662 | 0.5% |
| Czechoslovakian | 448 | 0.2% |
| Danish | 1,516 | 0.5% |
| Dominican | 29 | 0.0% |
| Dutch | 7,069 | 2.3% |
| Eastern European | 765 | 0.3% |
| Ecuadorian | 29 | 0.0% |
| Egyptian | 3 | 0.0% |
| English | 32,236 | 10.7% |
| Estonian | 5 | 0.0% |
| Ethiopian | 68 | 0.0% |
| European | 5,212 | 1.7% |
| Fijian | 5 | 0.0% |
| Filipino | 2 | 0.0% |
| Finnish | 34,801 | 11.5% |
| French | 22,859 | 7.6% |
| French American Indian | 285 | 0.1% |
| French Canadian | 10,441 | 3.5% |
| German | 56,452 | 18.7% |
| Greek | 759 | 0.3% |
| Guamanian / Chamorro | 32 | 0.0% |
| Guatemalan | 52 | 0.0% |
| Haitian | 17 | 0.0% |
| Honduran | 23 | 0.0% |
| Hungarian | 1,402 | 0.5% |
| Icelander | 2 | 0.0% |
| Indian (Asian) | 1,086 | 0.4% |
| Inupiat | 18 | 0.0% |
| Iranian | 91 | 0.0% |
| Iraqi | 27 | 0.0% |
| Irish | 27,682 | 9.1% |
| Iroquois | 119 | 0.0% |
| Israeli | 30 | 0.0% |
| Italian | 18,203 | 6.0% |
| Jamaican | 420 | 0.1% |
| Japanese | 52 | 0.0% |
| Jordanian | 15 | 0.0% |
| Kenyan | 64 | 0.0% |
| Korean | 887 | 0.3% |
| Laotian | 41 | 0.0% |
| Latvian | 84 | 0.0% |
| Lebanese | 347 | 0.1% |
| Lithuanian | 692 | 0.2% |
| Lumbee | 19 | 0.0% |
| Luxembourger | 71 | 0.0% |
| Macedonian | 165 | 0.1% |
| Malaysian | 45 | 0.0% |
| Maltese | 39 | 0.0% |
| Menominee | 30 | 0.0% |
| Mexican | 3,346 | 1.1% |
| Mexican American Indian | 47 | 0.0% |
| Moroccan | 88 | 0.0% |
| Native Hawaiian | 326 | 0.1% |
| Navajo | 42 | 0.0% |
| New Zealander | 5 | 0.0% |
| Nicaraguan | 26 | 0.0% |
| Nigerian | 133 | 0.0% |
| Northern European | 607 | 0.2% |
| Norwegian | 7,161 | 2.4% |
| Okinawan | 2 | 0.0% |
| Ottawa | 455 | 0.2% |
| Paiute | 36 | 0.0% |
| Pakistani | 67 | 0.0% |
| Panamanian | 122 | 0.0% |
| Pennsylvania German | 200 | 0.1% |
| Peruvian | 127 | 0.0% |
| Polish | 18,676 | 6.2% |
| Portuguese | 155 | 0.1% |
| Potawatomi | 726 | 0.2% |
| Pueblo | 27 | 0.0% |
| Puerto Rican | 490 | 0.2% |
| Romanian | 194 | 0.1% |
| Russian | 931 | 0.3% |
| Salvadoran | 54 | 0.0% |
| Samoan | 79 | 0.0% |
| Scandinavian | 1,821 | 0.6% |
| Scotch-Irish | 2,295 | 0.8% |
| Scottish | 5,301 | 1.8% |
| Seminole | 6 | 0.0% |
| Serbian | 148 | 0.1% |
| Sioux | 256 | 0.1% |
| Slavic | 308 | 0.1% |
| Slovak | 555 | 0.2% |
| Slovene | 287 | 0.1% |
| South African | 17 | 0.0% |
| South American | 329 | 0.1% |
| South American Indian | 50 | 0.0% |
| Spaniard | 249 | 0.1% |
| Spanish | 279 | 0.1% |
| Spanish American | 14 | 0.0% |
| Spanish American Indian | 6 | 0.0% |
| Sri Lankan | 275 | 0.1% |
| Subsaharan African | 748 | 0.3% |
| Swedish | 18,237 | 6.0% |
| Swiss | 794 | 0.3% |
| Syrian | 21 | 0.0% |
| Thai | 658 | 0.2% |
| Trinidadian and Tobagonian | 6 | 0.0% |
| Turkish | 52 | 0.0% |
| Ukrainian | 642 | 0.2% |
| Uruguayan | 7 | 0.0% |
| Venezuelan | 38 | 0.0% |
| Vietnamese | 112 | 0.0% |
| Welsh | 1,130 | 0.4% |
| West Indian | 28 | 0.0% |
| Yaqui | 8 | 0.0% |
| Yugoslavian | 347 | 0.1% |
| Yuman | 4 | 0.0% |
| Yup'ik | 10 | 0.0% |
| Zimbabwean | 15 | 0.0% | View All 154 Rows |
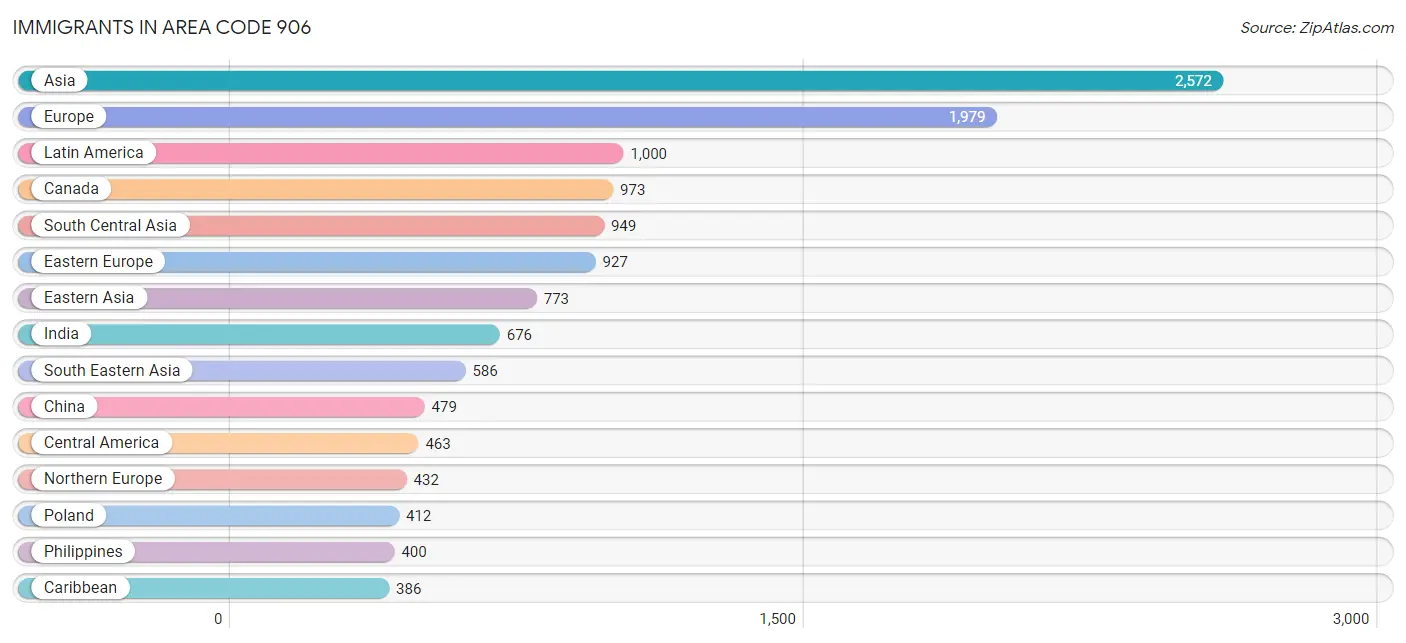
Immigrants in Area Code 906
The most numerous immigrant groups reported in Area Code 906 came from Asia (2,572 | 0.9%), Europe (1,979 | 0.6%), Latin America (1,000 | 0.3%), Canada (973 | 0.3%), and South Central Asia (949 | 0.3%), together accounting for 2.5% of all Area Code 906 residents.
| Immigration Origin | # Population | % Population |
| Africa | 288 | 0.1% |
| Albania | 13 | 0.0% |
| Argentina | 46 | 0.0% |
| Asia | 2,572 | 0.9% |
| Australia | 11 | 0.0% |
| Austria | 26 | 0.0% |
| Azores | 8 | 0.0% |
| Bangladesh | 133 | 0.0% |
| Belgium | 12 | 0.0% |
| Bolivia | 10 | 0.0% |
| Bosnia and Herzegovina | 5 | 0.0% |
| Brazil | 8 | 0.0% |
| Bulgaria | 4 | 0.0% |
| Cambodia | 12 | 0.0% |
| Cameroon | 16 | 0.0% |
| Canada | 973 | 0.3% |
| Caribbean | 386 | 0.1% |
| Central America | 463 | 0.2% |
| Chile | 11 | 0.0% |
| China | 479 | 0.2% |
| Colombia | 24 | 0.0% |
| Costa Rica | 90 | 0.0% |
| Croatia | 2 | 0.0% |
| Cuba | 10 | 0.0% |
| Czechoslovakia | 30 | 0.0% |
| Eastern Africa | 78 | 0.0% |
| Eastern Asia | 773 | 0.3% |
| Eastern Europe | 927 | 0.3% |
| Ecuador | 13 | 0.0% |
| El Salvador | 23 | 0.0% |
| England | 167 | 0.1% |
| Ethiopia | 9 | 0.0% |
| Europe | 1,979 | 0.6% |
| Fiji | 7 | 0.0% |
| France | 12 | 0.0% |
| Germany | 244 | 0.1% |
| Greece | 24 | 0.0% |
| Guatemala | 10 | 0.0% |
| Guyana | 6 | 0.0% |
| Haiti | 6 | 0.0% |
| Honduras | 5 | 0.0% |
| Hong Kong | 2 | 0.0% |
| Hungary | 22 | 0.0% |
| India | 676 | 0.2% |
| Iran | 60 | 0.0% |
| Iraq | 62 | 0.0% |
| Ireland | 24 | 0.0% |
| Israel | 8 | 0.0% |
| Italy | 191 | 0.1% |
| Jamaica | 339 | 0.1% |
| Japan | 82 | 0.0% |
| Kazakhstan | 10 | 0.0% |
| Kenya | 68 | 0.0% |
| Korea | 212 | 0.1% |
| Laos | 12 | 0.0% |
| Latin America | 1,000 | 0.3% |
| Latvia | 50 | 0.0% |
| Lebanon | 17 | 0.0% |
| Lithuania | 14 | 0.0% |
| Mexico | 335 | 0.1% |
| Middle Africa | 16 | 0.0% |
| Morocco | 1 | 0.0% |
| Nepal | 2 | 0.0% |
| Netherlands | 19 | 0.0% |
| Nigeria | 134 | 0.0% |
| North Macedonia | 65 | 0.0% |
| Northern Africa | 8 | 0.0% |
| Northern Europe | 432 | 0.1% |
| Norway | 4 | 0.0% |
| Oceania | 37 | 0.0% |
| Pakistan | 68 | 0.0% |
| Peru | 15 | 0.0% |
| Philippines | 400 | 0.1% |
| Poland | 412 | 0.1% |
| Portugal | 8 | 0.0% |
| Romania | 38 | 0.0% |
| Russia | 160 | 0.1% |
| Scotland | 56 | 0.0% |
| Singapore | 10 | 0.0% |
| South Africa | 38 | 0.0% |
| South America | 151 | 0.1% |
| South Central Asia | 949 | 0.3% |
| South Eastern Asia | 586 | 0.2% |
| Southern Europe | 274 | 0.1% |
| Spain | 51 | 0.0% |
| Sweden | 24 | 0.0% |
| Switzerland | 12 | 0.0% |
| Syria | 13 | 0.0% |
| Taiwan | 23 | 0.0% |
| Thailand | 52 | 0.0% |
| Trinidad and Tobago | 29 | 0.0% |
| Turkey | 50 | 0.0% |
| Ukraine | 102 | 0.0% |
| Uruguay | 7 | 0.0% |
| Venezuela | 11 | 0.0% |
| Vietnam | 100 | 0.0% |
| Western Africa | 134 | 0.0% |
| Western Asia | 245 | 0.1% |
| Western Europe | 346 | 0.1% |
| Yemen | 95 | 0.0% | View All 100 Rows |
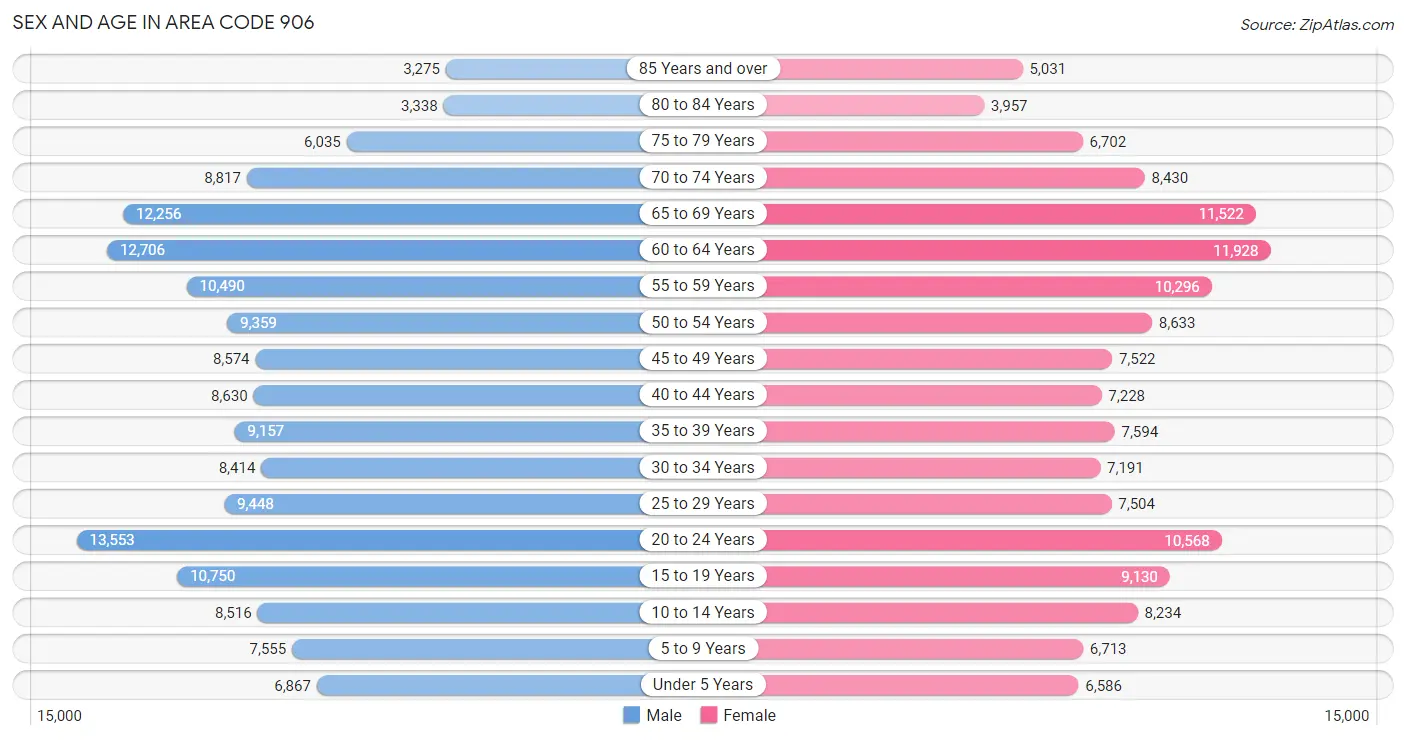
Sex and Age in Area Code 906
Sex and Age in Area Code 906
The most populous age groups in Area Code 906 are 20 to 24 Years (13,553 | 8.6%) for men and 60 to 64 Years (11,928 | 8.2%) for women.
| Age Bracket | Male | Female |
| Under 5 Years | 6,867 (4.3%) | 6,586 (4.5%) |
| 5 to 9 Years | 7,555 (4.8%) | 6,713 (4.6%) |
| 10 to 14 Years | 8,516 (5.4%) | 8,234 (5.7%) |
| 15 to 19 Years | 10,750 (6.8%) | 9,130 (6.3%) |
| 20 to 24 Years | 13,553 (8.6%) | 10,568 (7.3%) |
| 25 to 29 Years | 9,448 (6.0%) | 7,504 (5.2%) |
| 30 to 34 Years | 8,414 (5.3%) | 7,191 (5.0%) |
| 35 to 39 Years | 9,157 (5.8%) | 7,594 (5.2%) |
| 40 to 44 Years | 8,630 (5.5%) | 7,228 (5.0%) |
| 45 to 49 Years | 8,574 (5.4%) | 7,522 (5.2%) |
| 50 to 54 Years | 9,359 (5.9%) | 8,633 (6.0%) |
| 55 to 59 Years | 10,490 (6.7%) | 10,296 (7.1%) |
| 60 to 64 Years | 12,706 (8.1%) | 11,928 (8.2%) |
| 65 to 69 Years | 12,256 (7.8%) | 11,522 (8.0%) |
| 70 to 74 Years | 8,817 (5.6%) | 8,430 (5.8%) |
| 75 to 79 Years | 6,035 (3.8%) | 6,702 (4.6%) |
| 80 to 84 Years | 3,338 (2.1%) | 3,957 (2.7%) |
| 85 Years and over | 3,275 (2.1%) | 5,031 (3.5%) |
| Total | 157,740 (100.0%) | 144,769 (100.0%) |
Families and Households in Area Code 906
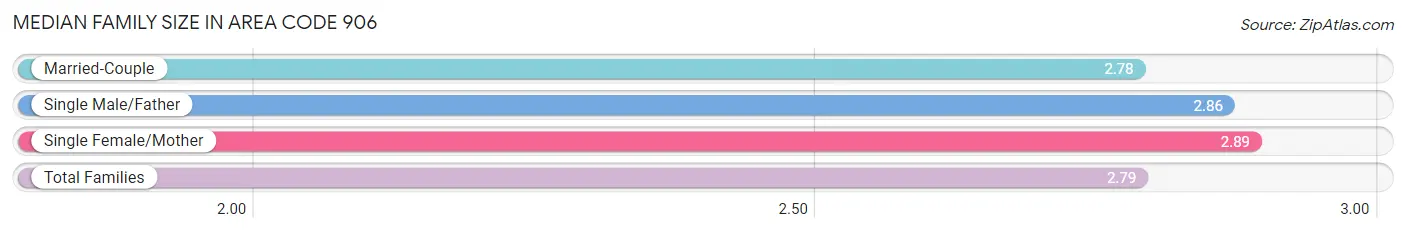
Median Family Size in Area Code 906
The median family size in Area Code 906 is 2.79 persons per family, with single female/mother families (9,842 | 12.9%) accounting for the largest median family size of 2.8885 persons per family. On the other hand, married-couple families (60,725 | 79.7%) represent the smallest median family size with 2.78 persons per family.
| Family Type | # Families | Family Size |
| Married-Couple | 60,725 (79.7%) | 2.78 |
| Single Male/Father | 5,642 (7.4%) | 2.86 |
| Single Female/Mother | 9,842 (12.9%) | 2.89 |
| Total Families | 76,209 (100.0%) | 2.79 |
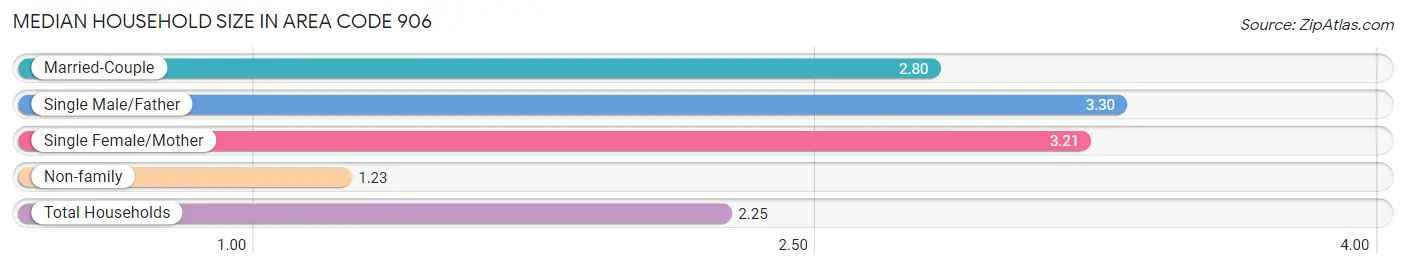
Median Household Size in Area Code 906
The median household size in Area Code 906 is 2.25 persons per household, with single male/father households (5,642 | 4.5%) accounting for the largest median household size of 3.30419 persons per household. non-family households (50,228 | 39.7%) represent the smallest median household size with 1.23 persons per household.
| Household Type | # Households | Household Size |
| Married-Couple | 60,725 (48.0%) | 2.80 |
| Single Male/Father | 5,642 (4.5%) | 3.30 |
| Single Female/Mother | 9,842 (7.8%) | 3.21 |
| Non-family | 50,228 (39.7%) | 1.23 |
| Total Households | 126,437 (100.0%) | 2.25 |
Household Size by Marriage Status in Area Code 906
Out of a total of 126,437 households in Area Code 906, 76,209 (60.3%) are family households, while 50,228 (39.7%) are nonfamily households. The most numerous type of family households are 2-person households, comprising 43,712, and the most common type of nonfamily households are 1-person households, comprising 41,409.
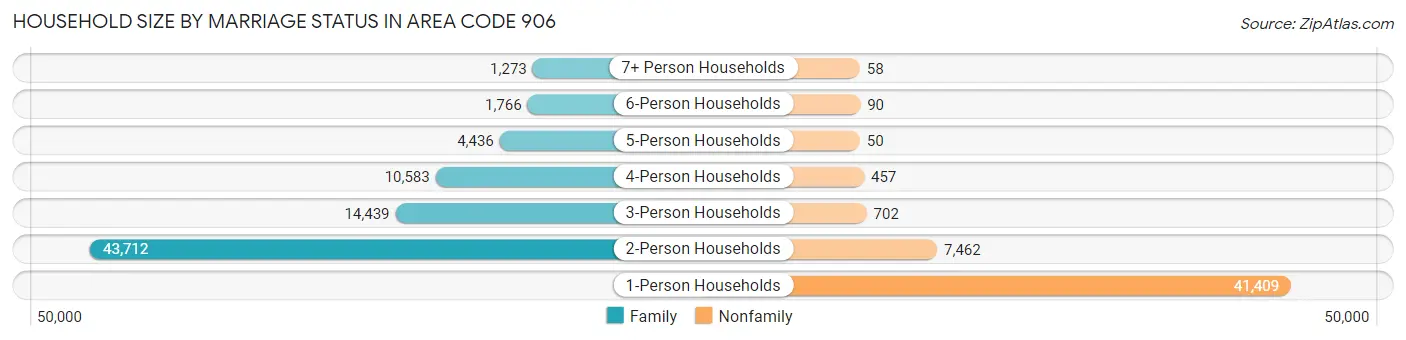
| Household Size | Family Households | Nonfamily Households |
| 1-Person Households | - | 41,409 (32.8%) |
| 2-Person Households | 43,712 (34.6%) | 7,462 (5.9%) |
| 3-Person Households | 14,439 (11.4%) | 702 (0.6%) |
| 4-Person Households | 10,583 (8.4%) | 457 (0.4%) |
| 5-Person Households | 4,436 (3.5%) | 50 (0.0%) |
| 6-Person Households | 1,766 (1.4%) | 90 (0.1%) |
| 7+ Person Households | 1,273 (1.0%) | 58 (0.1%) |
| Total | 76,209 (60.3%) | 50,228 (39.7%) |
Female Fertility in Area Code 906
Fertility by Age in Area Code 906
Average fertility rate in Area Code 906 is 79.8 births per 1,000 women. Women in the age bracket of 20 to 34 years have the highest fertility rate with 180.4 births per 1,000 women. Women in the age bracket of 20 to 34 years acount for 81.7% of all women with births.
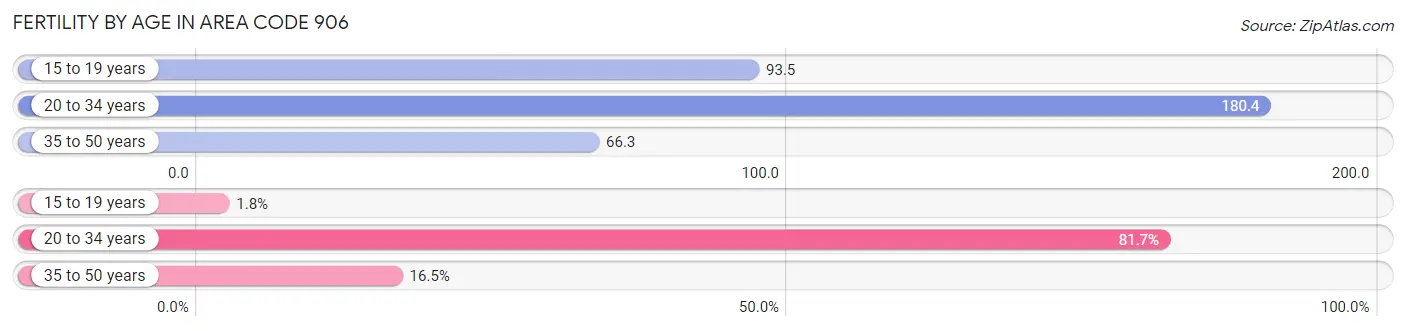
| Age Bracket | Women with Births | Births / 1,000 Women |
| 15 to 19 years | 49 (1.8%) | 93.5 |
| 20 to 34 years | 2,212 (81.7%) | 180.4 |
| 35 to 50 years | 447 (16.5%) | 66.3 |
| Total | 2,708 (100.0%) | 79.8 |
Fertility by Age by Marriage Status in Area Code 906
45.9% of women with births (2,708) in Area Code 906 are married. The highest percentage of unmarried women with births falls into 15 to 19 years age bracket with 100.0% of them unmarried at the time of birth, while the lowest percentage of unmarried women with births belong to 20 to 34 years age bracket with 55.6% of them unmarried.
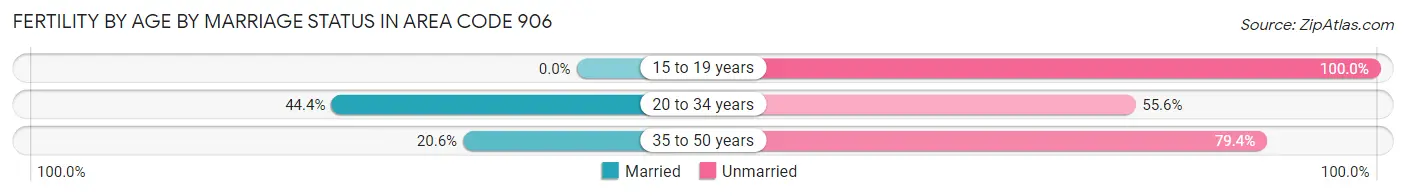
| Age Bracket | Married | Unmarried |
| 15 to 19 years | 0 (0.0%) | 49 (100.0%) |
| 20 to 34 years | 983 (44.4%) | 1,229 (55.6%) |
| 35 to 50 years | 92 (20.6%) | 355 (79.4%) |
| Total | 1,243 (45.9%) | 1,465 (54.1%) |
Fertility by Education in Area Code 906
Average fertility rate in Area Code 906 is 79.8 births per 1,000 women. Women with the education attainment of graduate degree have the highest fertility rate of 285.1 births per 1,000 women, while women with the education attainment of high school diploma have the lowest fertility at 111.8 births per 1,000 women. Women with the education attainment of college or associate's degree represent 44.8% of all women with births.
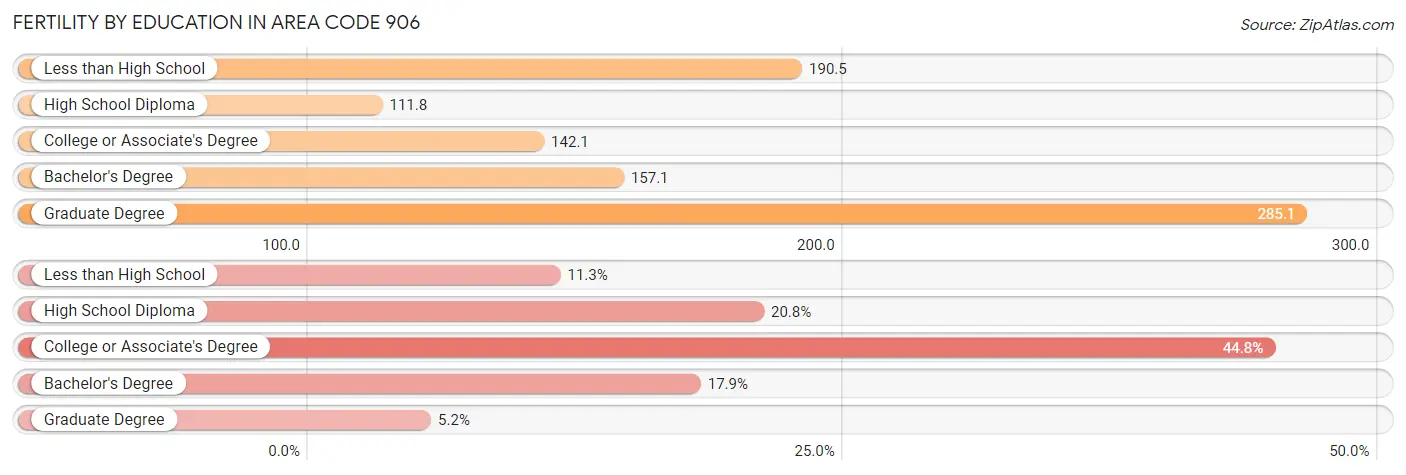
| Educational Attainment | Women with Births | Births / 1,000 Women |
| Less than High School | 306 (11.3%) | 190.5 |
| High School Diploma | 564 (20.8%) | 111.8 |
| College or Associate's Degree | 1,212 (44.8%) | 142.1 |
| Bachelor's Degree | 484 (17.9%) | 157.1 |
| Graduate Degree | 142 (5.2%) | 285.1 |
| Total | 2,708 (100.0%) | 79.8 |
Fertility by Education by Marriage Status in Area Code 906
54.1% of women with births in Area Code 906 are unmarried. Women with the educational attainment of college or associate's degree are most likely to be married with 37.7% of them married at childbirth, while women with the educational attainment of less than high school are least likely to be married with 93.1% of them unmarried at childbirth.
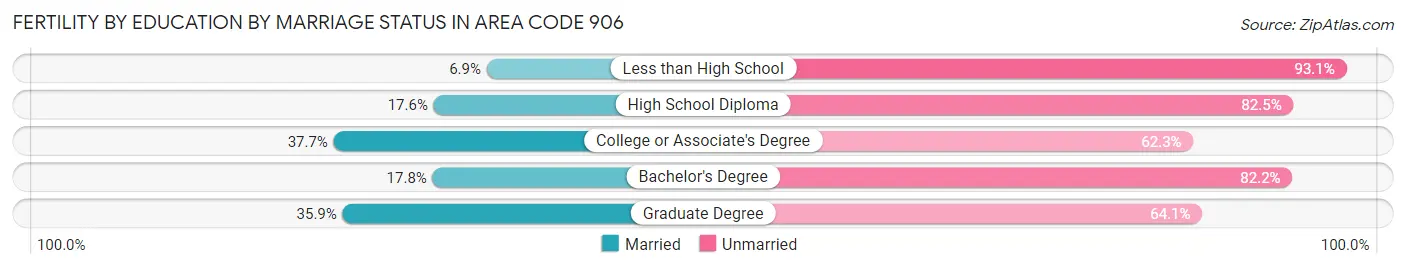
| Educational Attainment | Married | Unmarried |
| Less than High School | 21 (6.9%) | 285 (93.1%) |
| High School Diploma | 99 (17.5%) | 465 (82.5%) |
| College or Associate's Degree | 457 (37.7%) | 755 (62.3%) |
| Bachelor's Degree | 86 (17.8%) | 398 (82.2%) |
| Graduate Degree | 51 (35.9%) | 91 (64.1%) |
| Total | 1,243 (45.9%) | 1,465 (54.1%) |
Employment Characteristics in Area Code 906
Employment by Class of Employer in Area Code 906
Among the 127,145 employed individuals in Area Code 906, private company employees (80,650 | 63.4%), not-for-profit organizations (11,406 | 9.0%), and local government employees (10,406 | 8.2%) make up the most common classes of employment.
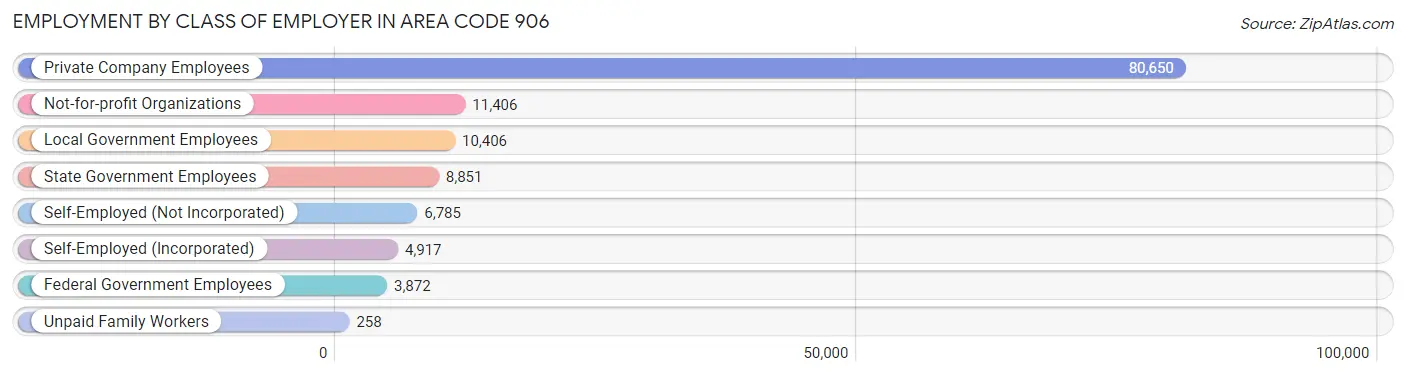
| Employer Class | # Employees | % Employees |
| Private Company Employees | 80,650 | 63.4% |
| Self-Employed (Incorporated) | 4,917 | 3.9% |
| Self-Employed (Not Incorporated) | 6,785 | 5.3% |
| Not-for-profit Organizations | 11,406 | 9.0% |
| Local Government Employees | 10,406 | 8.2% |
| State Government Employees | 8,851 | 7.0% |
| Federal Government Employees | 3,872 | 3.0% |
| Unpaid Family Workers | 258 | 0.2% |
| Total | 127,145 | 100.0% |
Employment Status by Age in Area Code 906
According to the labor force statistics for Area Code 906, out of the total population over 16 years of age (254,600), 48.7% or 123,990 individuals are in the labor force, with 7.7% or 9,597 of them unemployed. The age group with the highest labor force participation rate is 25 to 29 years, with 86.0% or 14,574 individuals in the labor force. Within the labor force, the 16 to 19 years age range has the highest percentage of unemployed individuals, with 1,515.8% or 120,733 of them being unemployed.
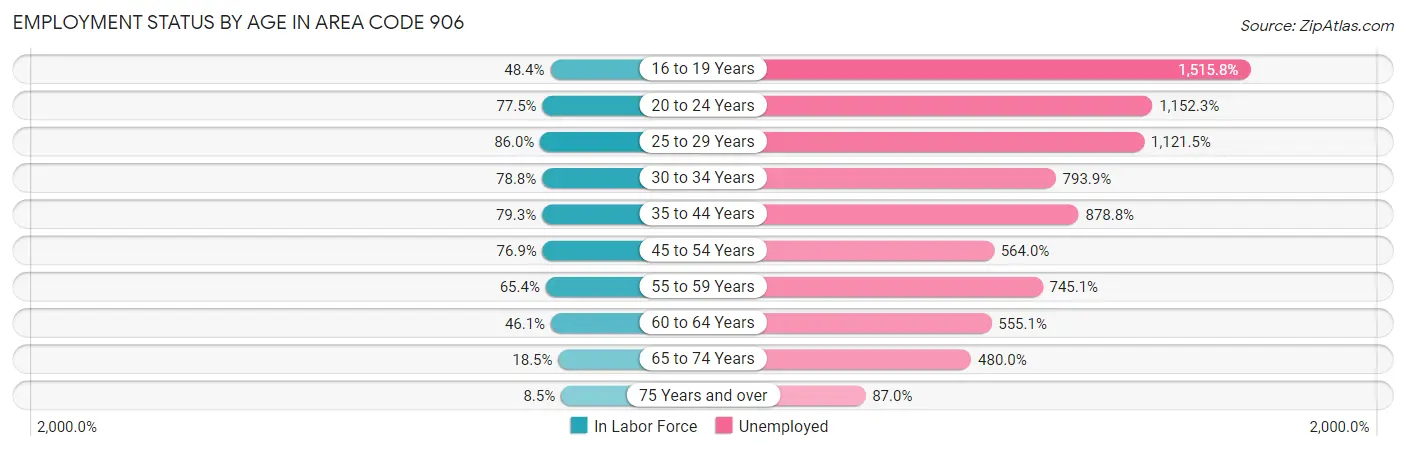
| Age Bracket | In Labor Force | Unemployed |
| 16 to 19 Years | 7,965 (48.4%) | 120,733 (1,515.8%) |
| 20 to 24 Years | 18,700 (77.5%) | 215,492 (1,152.3%) |
| 25 to 29 Years | 14,574 (86.0%) | 163,447 (1,121.5%) |
| 30 to 34 Years | 12,304 (78.8%) | 97,674 (793.9%) |
| 35 to 44 Years | 25,866 (79.3%) | 227,302 (878.8%) |
| 45 to 54 Years | 26,217 (76.9%) | 147,864 (564.0%) |
| 55 to 59 Years | 13,601 (65.4%) | 101,334 (745.1%) |
| 60 to 64 Years | 11,346 (46.1%) | 62,982 (555.1%) |
| 65 to 74 Years | 7,594 (18.5%) | 36,451 (480.0%) |
| 75 Years and over | 2,413 (8.5%) | 2,100 (87.0%) |
| Total | 123,994 (48.7%) | 9,602 (7.7%) |
Employment Status by Educational Attainment in Area Code 906
According to labor force statistics for Area Code 906, 68.8% of individuals (99,536) out of the total population between 25 and 64 years of age (144,674) are in the labor force, with 825.9% or 822,068 of them being unemployed. The group with the highest labor force participation rate are those with the educational attainment of bachelor's degree or higher, with 80.8% or 30,349 individuals in the labor force. Within the labor force, individuals with less than high school education have the highest percentage of unemployment, with 1,079.1% or 51,074 of them being unemployed.
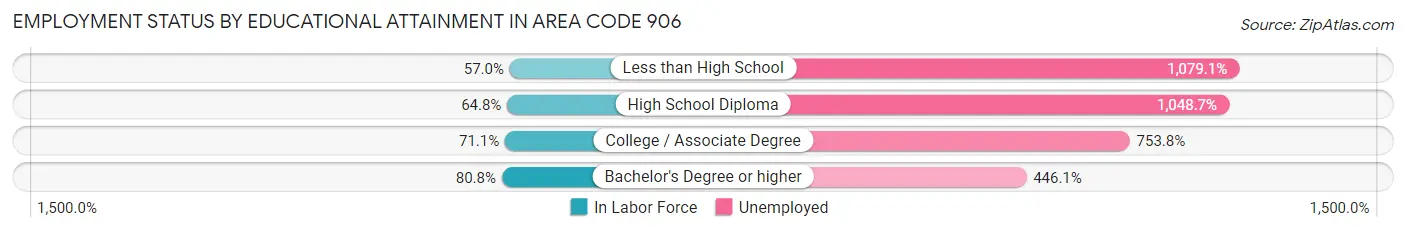
| Educational Attainment | In Labor Force | Unemployed |
| Less than High School | 4,733 (57.0%) | 89,587 (1,079.1%) |
| High School Diploma | 30,141 (64.8%) | 487,614 (1,048.7%) |
| College / Associate Degree | 37,188 (71.1%) | 394,418 (753.8%) |
| Bachelor's Degree or higher | 30,347 (80.8%) | 167,515 (446.1%) |
| Total | 99,532 (68.8%) | 1,194,863 (825.9%) |
Employment Occupations by Sex in Area Code 906
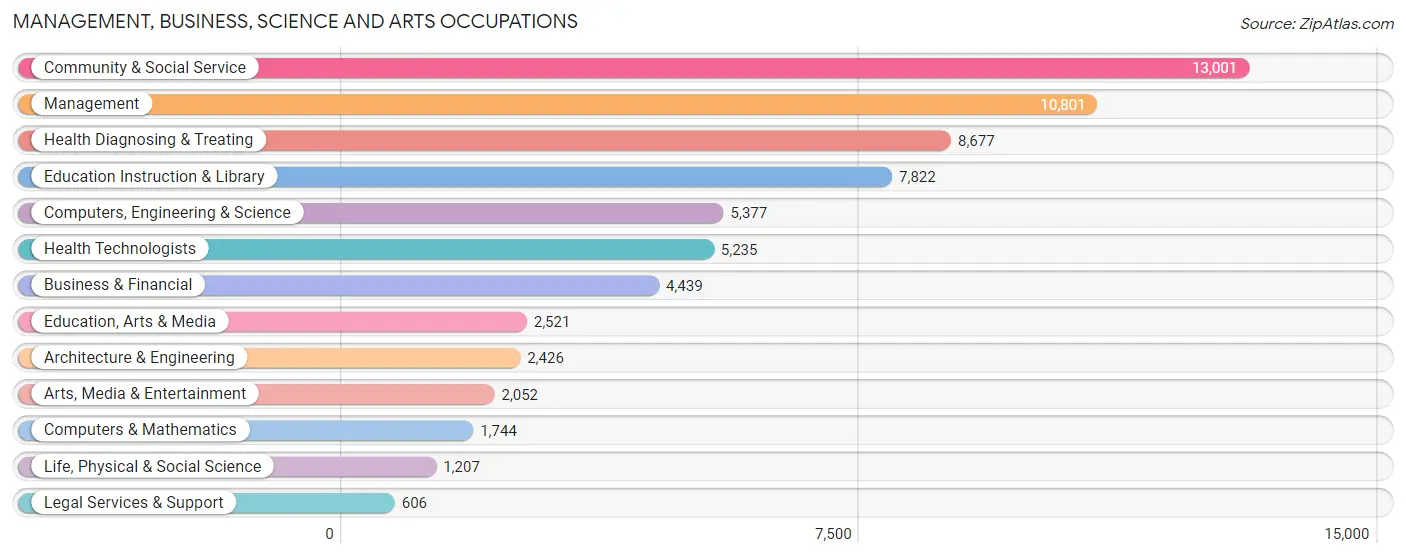
Management, Business, Science and Arts Occupations
The most common Management, Business, Science and Arts occupations in Area Code 906 are Community & Social Service (13,001 | 10.1%), Management (10,801 | 8.4%), Health Diagnosing & Treating (8,677 | 6.7%), Education Instruction & Library (7,822 | 6.0%), and Computers, Engineering & Science (5,377 | 4.2%).
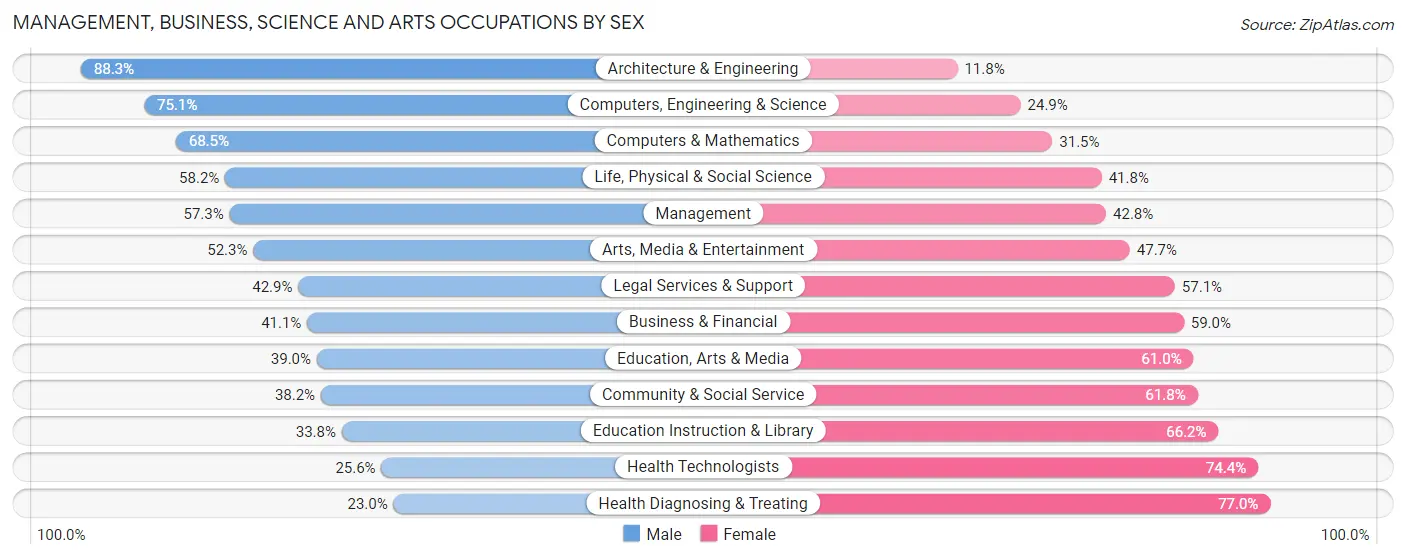
Management, Business, Science and Arts Occupations by Sex
Within the Management, Business, Science and Arts occupations in Area Code 906, the most male-oriented occupations are Architecture & Engineering (88.2%), Computers, Engineering & Science (75.1%), and Computers & Mathematics (68.5%), while the most female-oriented occupations are Health Diagnosing & Treating (77.0%), Health Technologists (74.4%), and Education Instruction & Library (66.2%).
| Occupation | Male | Female |
| Management | 6,184 (57.3%) | 4,617 (42.7%) |
| Business & Financial | 1,822 (41.0%) | 2,617 (59.0%) |
| Computers, Engineering & Science | 4,037 (75.1%) | 1,340 (24.9%) |
| Computers & Mathematics | 1,194 (68.5%) | 550 (31.5%) |
| Architecture & Engineering | 2,141 (88.2%) | 285 (11.7%) |
| Life, Physical & Social Science | 702 (58.2%) | 505 (41.8%) |
| Community & Social Service | 4,964 (38.2%) | 8,037 (61.8%) |
| Education, Arts & Media | 984 (39.0%) | 1,537 (61.0%) |
| Legal Services & Support | 260 (42.9%) | 346 (57.1%) |
| Education Instruction & Library | 2,647 (33.8%) | 5,175 (66.2%) |
| Arts, Media & Entertainment | 1,073 (52.3%) | 979 (47.7%) |
| Health Diagnosing & Treating | 1,998 (23.0%) | 6,679 (77.0%) |
| Health Technologists | 1,338 (25.6%) | 3,897 (74.4%) |
| Total (Category) | 19,005 (44.9%) | 23,290 (55.1%) |
| Total (Overall) | 68,241 (52.7%) | 61,177 (47.3%) |
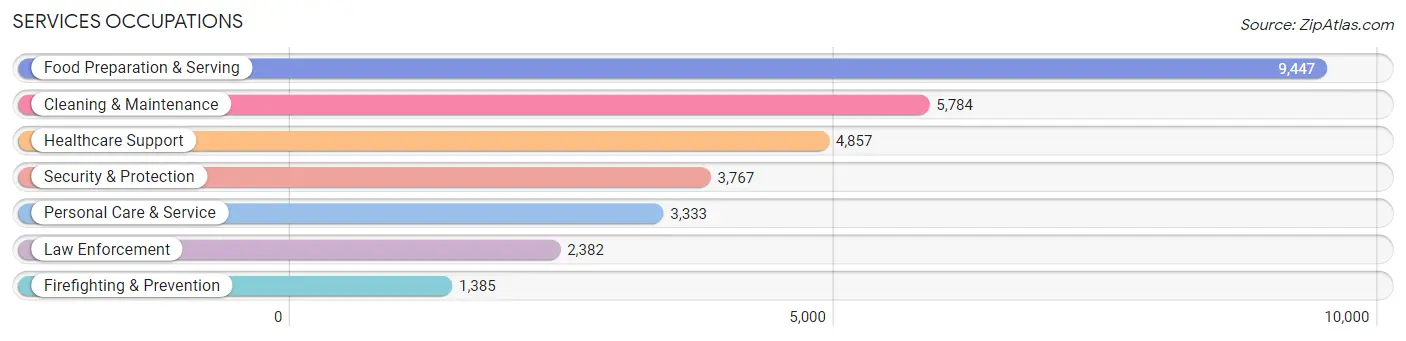
Services Occupations
The most common Services occupations in Area Code 906 are Food Preparation & Serving (9,447 | 7.3%), Cleaning & Maintenance (5,784 | 4.5%), Healthcare Support (4,857 | 3.7%), Security & Protection (3,767 | 2.9%), and Personal Care & Service (3,333 | 2.6%).
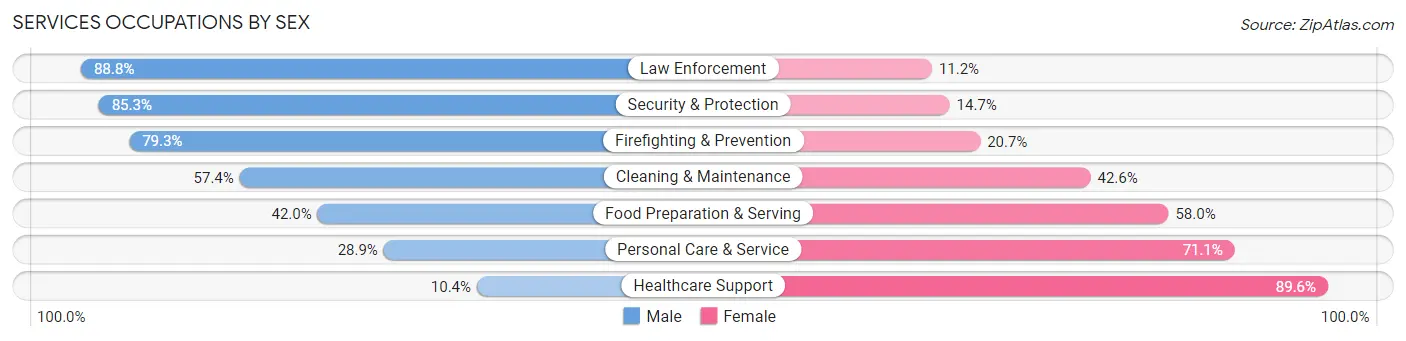
Services Occupations by Sex
Within the Services occupations in Area Code 906, the most male-oriented occupations are Law Enforcement (88.8%), Security & Protection (85.3%), and Firefighting & Prevention (79.3%), while the most female-oriented occupations are Healthcare Support (89.6%), Personal Care & Service (71.1%), and Food Preparation & Serving (58.0%).
| Occupation | Male | Female |
| Healthcare Support | 507 (10.4%) | 4,350 (89.6%) |
| Security & Protection | 3,214 (85.3%) | 553 (14.7%) |
| Firefighting & Prevention | 1,098 (79.3%) | 287 (20.7%) |
| Law Enforcement | 2,116 (88.8%) | 266 (11.2%) |
| Food Preparation & Serving | 3,967 (42.0%) | 5,480 (58.0%) |
| Cleaning & Maintenance | 3,321 (57.4%) | 2,463 (42.6%) |
| Personal Care & Service | 963 (28.9%) | 2,370 (71.1%) |
| Total (Category) | 11,972 (44.0%) | 15,216 (56.0%) |
| Total (Overall) | 68,241 (52.7%) | 61,177 (47.3%) |
Sales and Office Occupations
The most common Sales and Office occupations in Area Code 906 are Office & Administration (14,282 | 11.0%), and Sales & Related (12,426 | 9.6%).
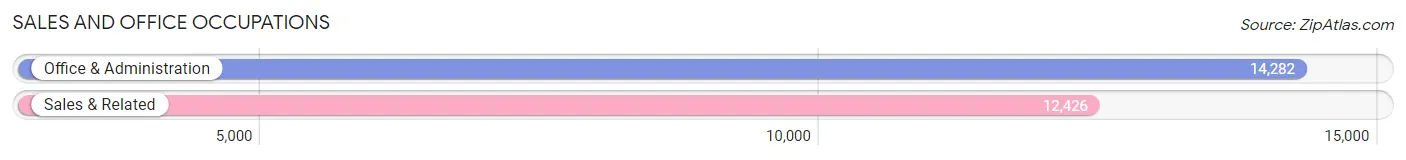
Sales and Office Occupations by Sex
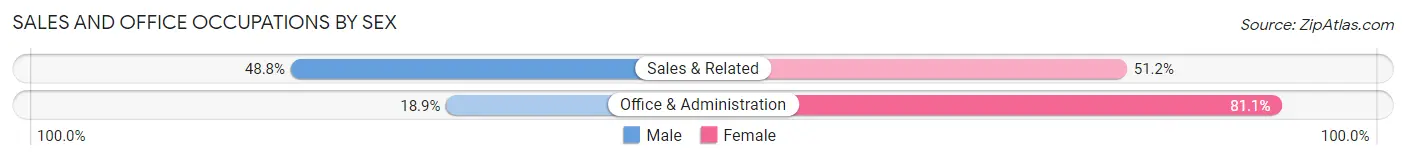
| Occupation | Male | Female |
| Sales & Related | 6,064 (48.8%) | 6,362 (51.2%) |
| Office & Administration | 2,699 (18.9%) | 11,583 (81.1%) |
| Total (Category) | 8,763 (32.8%) | 17,945 (67.2%) |
| Total (Overall) | 68,241 (52.7%) | 61,177 (47.3%) |
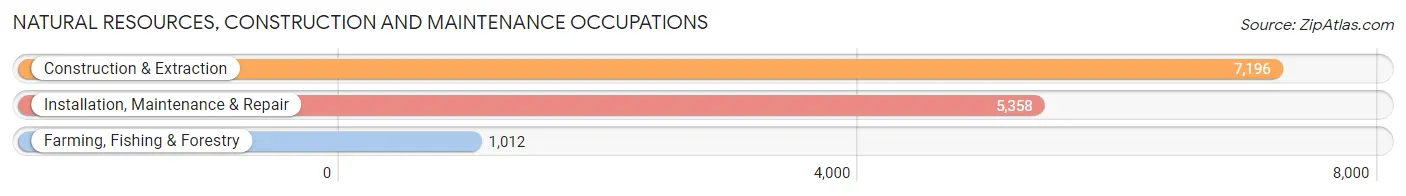
Natural Resources, Construction and Maintenance Occupations
The most common Natural Resources, Construction and Maintenance occupations in Area Code 906 are Construction & Extraction (7,196 | 5.6%), Installation, Maintenance & Repair (5,358 | 4.1%), and Farming, Fishing & Forestry (1,012 | 0.8%).
Natural Resources, Construction and Maintenance Occupations by Sex
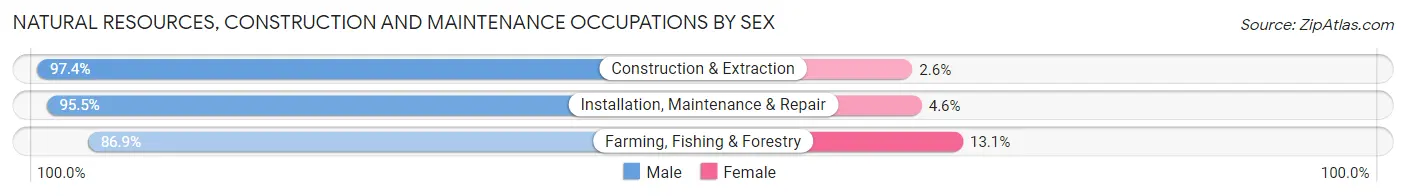
| Occupation | Male | Female |
| Farming, Fishing & Forestry | 879 (86.9%) | 133 (13.1%) |
| Construction & Extraction | 7,009 (97.4%) | 187 (2.6%) |
| Installation, Maintenance & Repair | 5,114 (95.5%) | 244 (4.5%) |
| Total (Category) | 13,002 (95.8%) | 564 (4.2%) |
| Total (Overall) | 68,241 (52.7%) | 61,177 (47.3%) |
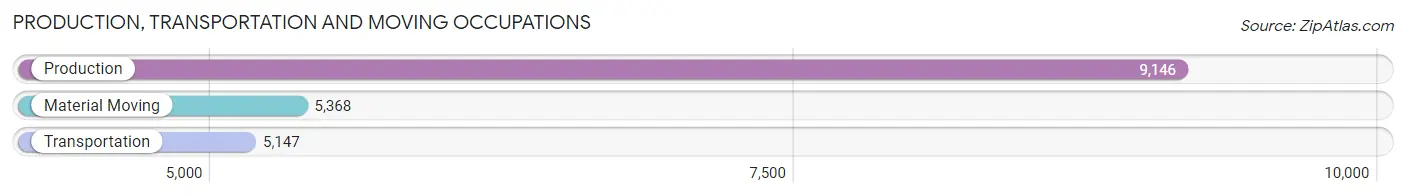
Production, Transportation and Moving Occupations
The most common Production, Transportation and Moving occupations in Area Code 906 are Production (9,146 | 7.1%), Material Moving (5,368 | 4.2%), and Transportation (5,147 | 4.0%).
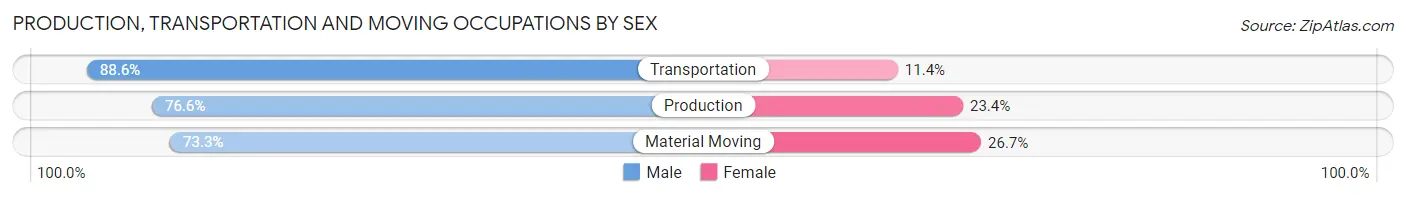
Production, Transportation and Moving Occupations by Sex
| Occupation | Male | Female |
| Production | 7,007 (76.6%) | 2,139 (23.4%) |
| Transportation | 4,558 (88.6%) | 589 (11.4%) |
| Material Moving | 3,934 (73.3%) | 1,434 (26.7%) |
| Total (Category) | 15,499 (78.8%) | 4,162 (21.2%) |
| Total (Overall) | 68,241 (52.7%) | 61,177 (47.3%) |
Employment Industries by Sex in Area Code 906
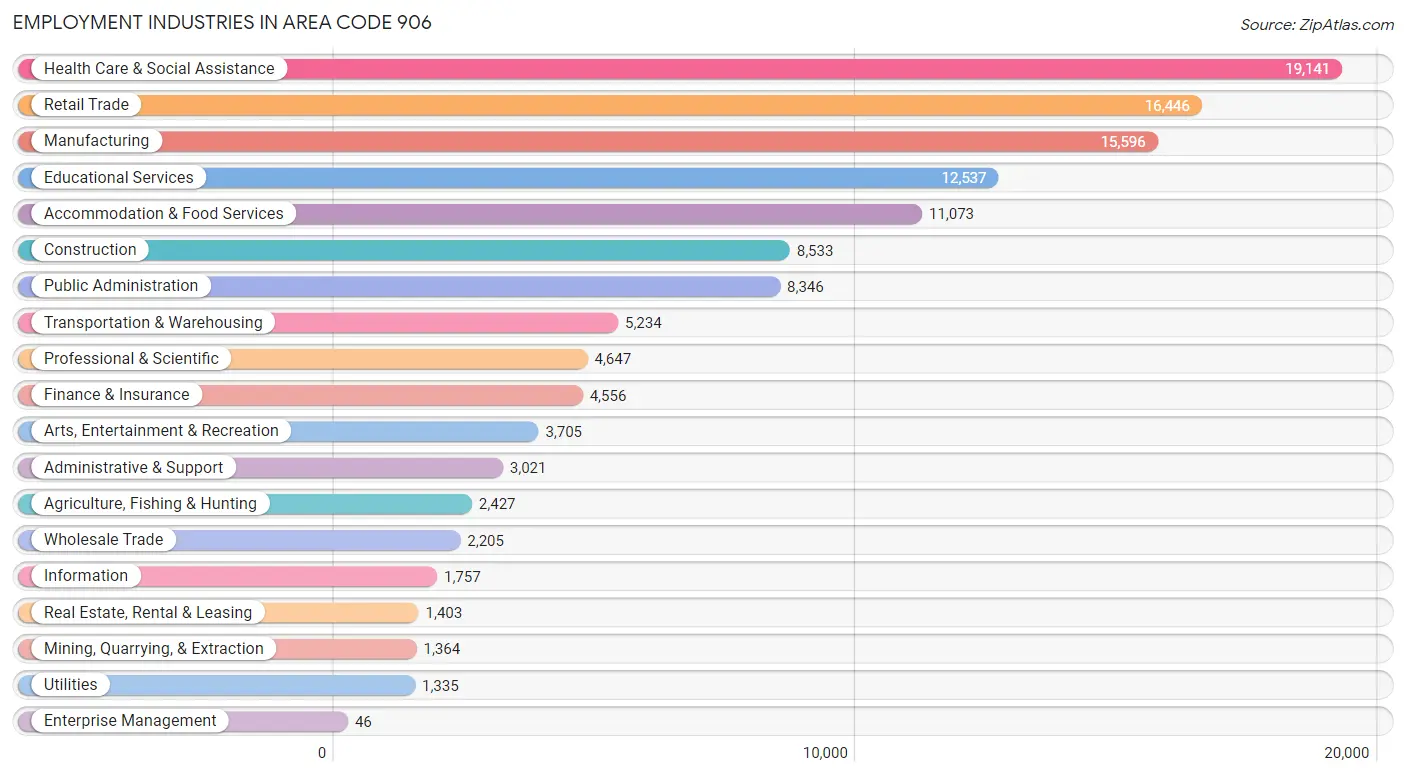
Employment Industries in Area Code 906
The major employment industries in Area Code 906 include Health Care & Social Assistance (19,141 | 14.8%), Retail Trade (16,446 | 12.7%), Manufacturing (15,596 | 12.0%), Educational Services (12,537 | 9.7%), and Accommodation & Food Services (11,073 | 8.6%).
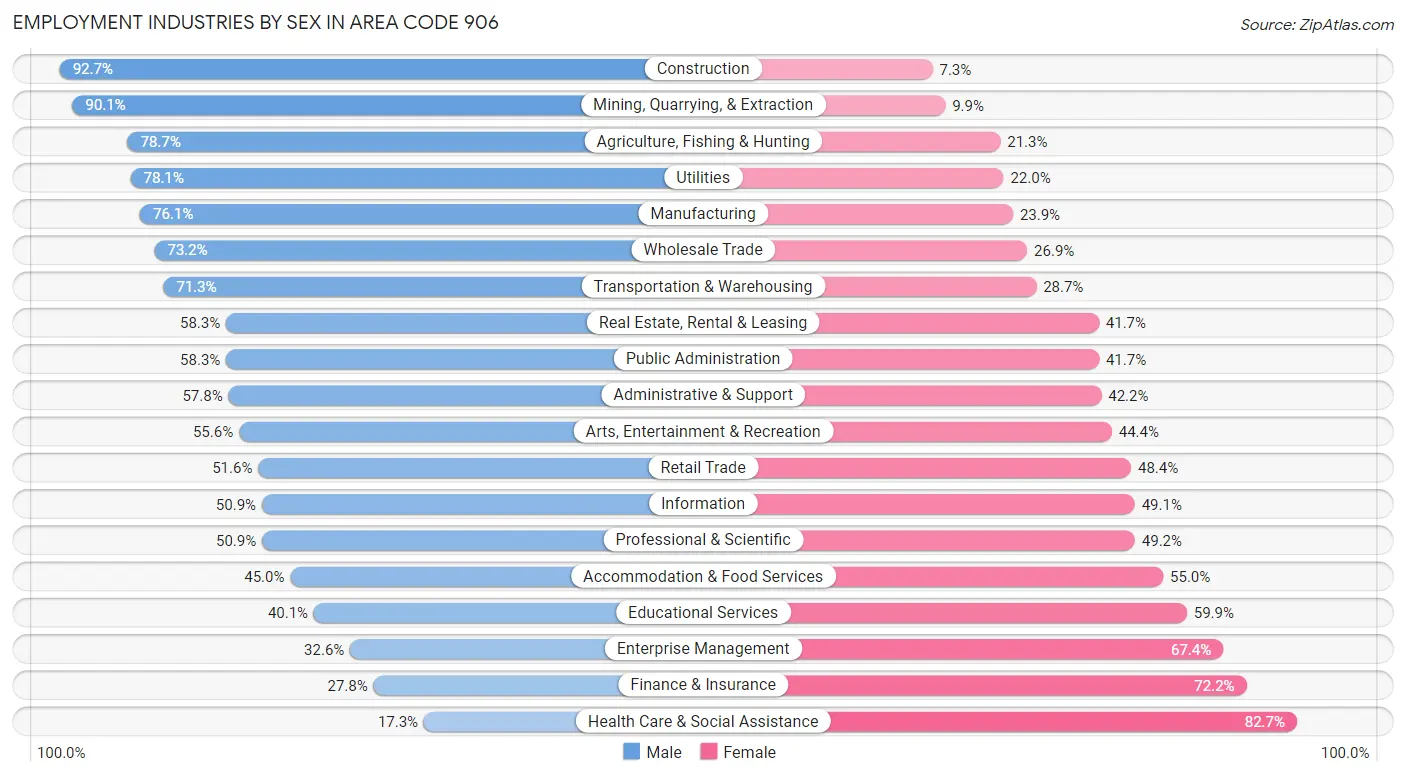
Employment Industries by Sex in Area Code 906
The Area Code 906 industries that see more men than women are Construction (92.7%), Mining, Quarrying, & Extraction (90.1%), and Agriculture, Fishing & Hunting (78.7%), whereas the industries that tend to have a higher number of women are Health Care & Social Assistance (82.7%), Finance & Insurance (72.2%), and Enterprise Management (67.4%).
| Industry | Male | Female |
| Agriculture, Fishing & Hunting | 1,910 (78.7%) | 517 (21.3%) |
| Mining, Quarrying, & Extraction | 1,229 (90.1%) | 135 (9.9%) |
| Construction | 7,913 (92.7%) | 620 (7.3%) |
| Manufacturing | 11,867 (76.1%) | 3,729 (23.9%) |
| Wholesale Trade | 1,613 (73.2%) | 592 (26.9%) |
| Retail Trade | 8,493 (51.6%) | 7,953 (48.4%) |
| Transportation & Warehousing | 3,731 (71.3%) | 1,503 (28.7%) |
| Utilities | 1,042 (78.0%) | 293 (22.0%) |
| Information | 894 (50.9%) | 863 (49.1%) |
| Finance & Insurance | 1,265 (27.8%) | 3,291 (72.2%) |
| Real Estate, Rental & Leasing | 818 (58.3%) | 585 (41.7%) |
| Professional & Scientific | 2,363 (50.8%) | 2,284 (49.1%) |
| Enterprise Management | 15 (32.6%) | 31 (67.4%) |
| Administrative & Support | 1,746 (57.8%) | 1,275 (42.2%) |
| Educational Services | 5,029 (40.1%) | 7,508 (59.9%) |
| Health Care & Social Assistance | 3,320 (17.3%) | 15,821 (82.7%) |
| Arts, Entertainment & Recreation | 2,061 (55.6%) | 1,644 (44.4%) |
| Accommodation & Food Services | 4,984 (45.0%) | 6,089 (55.0%) |
| Public Administration | 4,864 (58.3%) | 3,482 (41.7%) |
| Total | 68,241 (52.7%) | 61,177 (47.3%) |
Education in Area Code 906
School Enrollment in Area Code 906
The most common levels of schooling among the 66,765 students in Area Code 906 are college / undergraduate (18,278 | 27.4%), high school (14,020 | 21.0%), and middle school (13,276 | 19.9%).
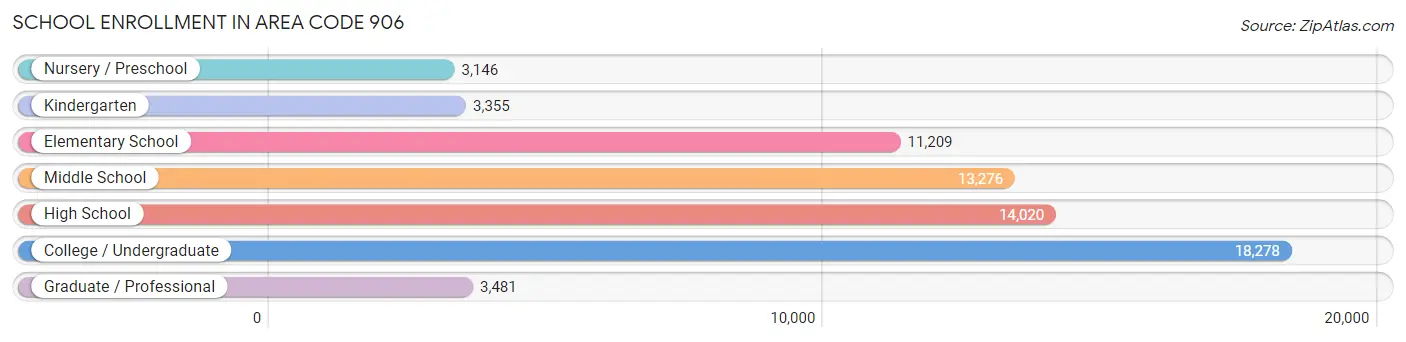
| School Level | # Students | % Students |
| Nursery / Preschool | 3,146 | 4.7% |
| Kindergarten | 3,355 | 5.0% |
| Elementary School | 11,209 | 16.8% |
| Middle School | 13,276 | 19.9% |
| High School | 14,020 | 21.0% |
| College / Undergraduate | 18,278 | 27.4% |
| Graduate / Professional | 3,481 | 5.2% |
| Total | 66,765 | 100.0% |
School Enrollment by Age by Funding Source in Area Code 906
Out of a total of 66,765 students who are enrolled in schools in Area Code 906, 7,570 (11.3%) attend a private institution, while the remaining 59,195 (88.7%) are enrolled in public schools. The age group of 3 to 4 year olds has the highest likelihood of being enrolled in private schools, with 693 (29.4% in the age bracket) enrolled. Conversely, the age group of 15 to 17 year olds has the lowest likelihood of being enrolled in a private school, with 9,303 (93.4% in the age bracket) attending a public institution.
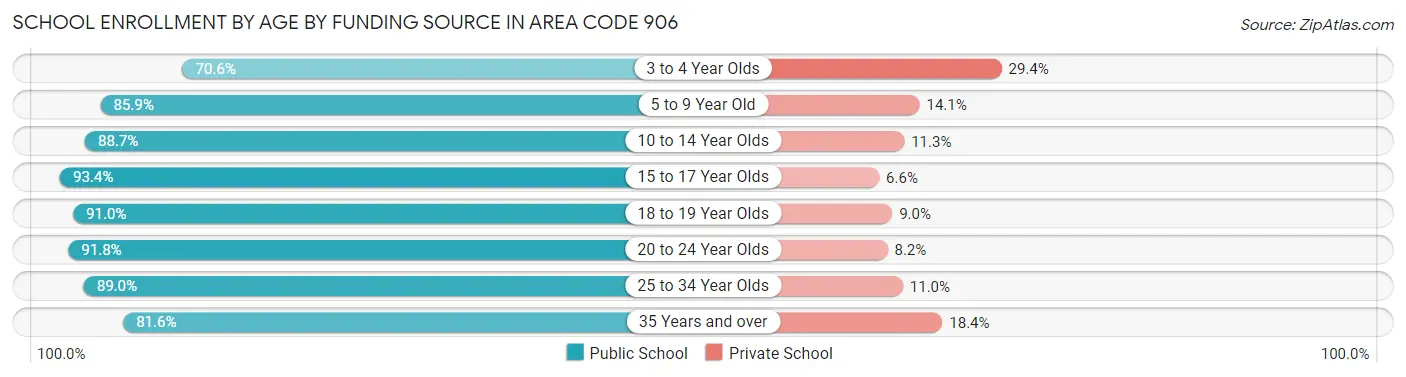
| Age Bracket | Public School | Private School |
| 3 to 4 Year Olds | 1,663 (70.6%) | 693 (29.4%) |
| 5 to 9 Year Old | 11,602 (85.9%) | 1,911 (14.1%) |
| 10 to 14 Year Olds | 14,495 (88.7%) | 1,842 (11.3%) |
| 15 to 17 Year Olds | 9,303 (93.4%) | 658 (6.6%) |
| 18 to 19 Year Olds | 6,724 (91.0%) | 668 (9.0%) |
| 20 to 24 Year Olds | 10,188 (91.8%) | 907 (8.2%) |
| 25 to 34 Year Olds | 2,848 (89.0%) | 353 (11.0%) |
| 35 Years and over | 2,375 (81.6%) | 535 (18.4%) |
| Total | 59,195 (88.7%) | 7,570 (11.3%) |
Educational Attainment by Field of Study in Area Code 906
Education (9,868 | 16.7%), business (9,119 | 15.5%), science & technology (7,784 | 13.2%), arts & humanities (4,935 | 8.4%), and bio, nature & agricultural (4,809 | 8.2%) are the most common fields of study among 58,959 individuals in Area Code 906 who have obtained a bachelor's degree or higher.
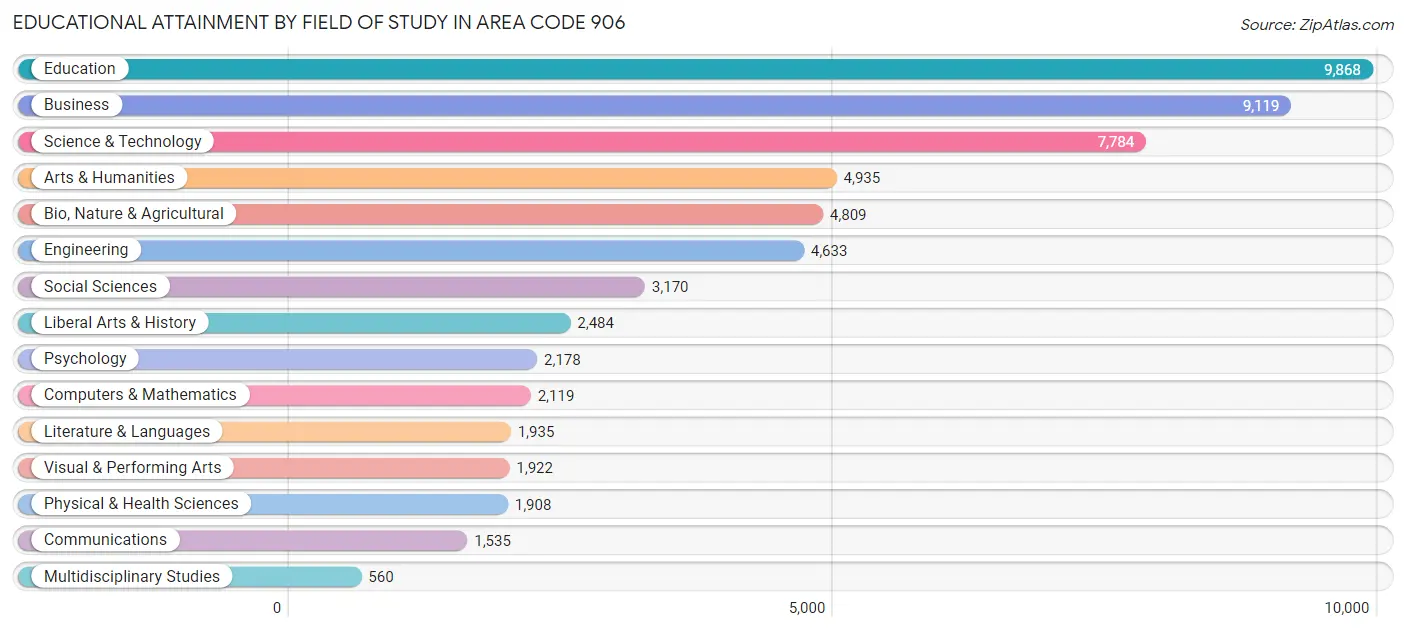
| Field of Study | # Graduates | % Graduates |
| Computers & Mathematics | 2,119 | 3.6% |
| Bio, Nature & Agricultural | 4,809 | 8.2% |
| Physical & Health Sciences | 1,908 | 3.2% |
| Psychology | 2,178 | 3.7% |
| Social Sciences | 3,170 | 5.4% |
| Engineering | 4,633 | 7.9% |
| Multidisciplinary Studies | 560 | 0.9% |
| Science & Technology | 7,784 | 13.2% |
| Business | 9,119 | 15.5% |
| Education | 9,868 | 16.7% |
| Literature & Languages | 1,935 | 3.3% |
| Liberal Arts & History | 2,484 | 4.2% |
| Visual & Performing Arts | 1,922 | 3.3% |
| Communications | 1,535 | 2.6% |
| Arts & Humanities | 4,935 | 8.4% |
| Total | 58,959 | 100.0% |
Transportation & Commute in Area Code 906
Vehicle Availability by Sex in Area Code 906
The most prevalent vehicle ownership categories in Area Code 906 are males with 2 vehicles (29,713, accounting for 45.2%) and females with 2 vehicles (25,291, making up 50.4%).
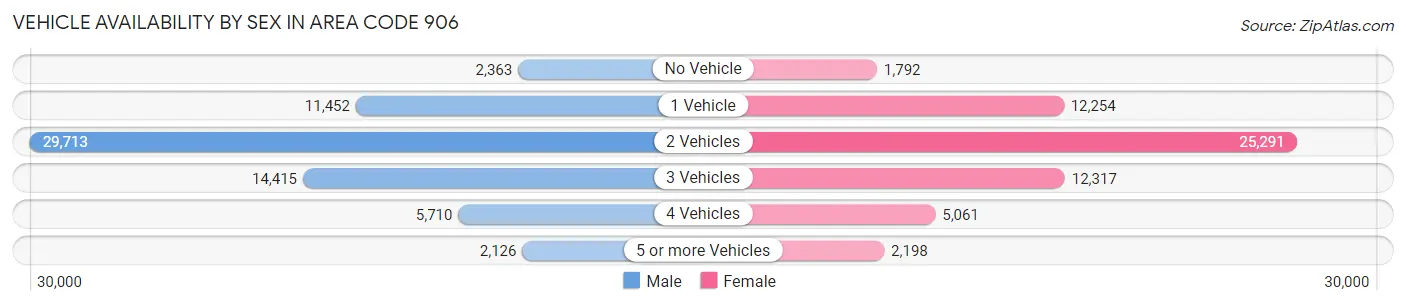
| Vehicles Available | Male | Female |
| No Vehicle | 2,363 (3.6%) | 1,792 (3.0%) |
| 1 Vehicle | 11,452 (17.4%) | 12,254 (20.8%) |
| 2 Vehicles | 29,713 (45.2%) | 25,291 (42.9%) |
| 3 Vehicles | 14,415 (21.9%) | 12,317 (20.9%) |
| 4 Vehicles | 5,710 (8.7%) | 5,061 (8.6%) |
| 5 or more Vehicles | 2,126 (3.2%) | 2,198 (3.7%) |
| Total | 65,779 (100.0%) | 58,913 (100.0%) |
Commute Time in Area Code 906
The most frequently occuring commute durations in Area Code 906 are 5 to 9 minutes (27,640 commuters, 23.3%), 10 to 14 minutes (24,336 commuters, 20.5%), and 15 to 19 minutes (17,218 commuters, 14.5%).
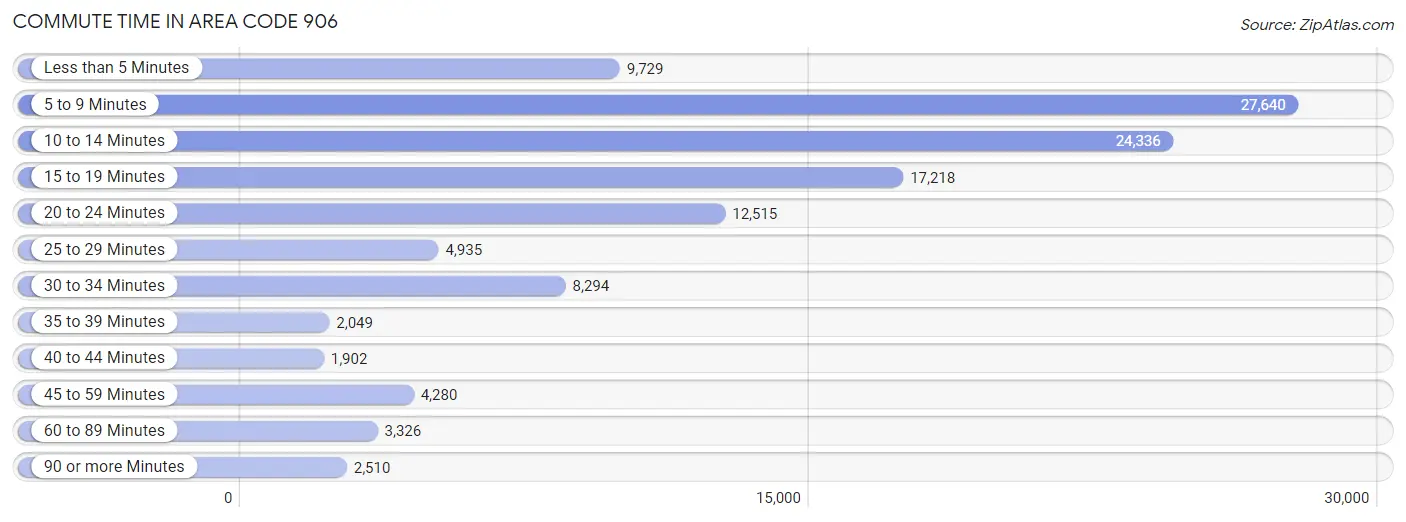
| Commute Time | # Commuters | % Commuters |
| Less than 5 Minutes | 9,729 | 8.2% |
| 5 to 9 Minutes | 27,640 | 23.3% |
| 10 to 14 Minutes | 24,336 | 20.5% |
| 15 to 19 Minutes | 17,218 | 14.5% |
| 20 to 24 Minutes | 12,515 | 10.5% |
| 25 to 29 Minutes | 4,935 | 4.2% |
| 30 to 34 Minutes | 8,294 | 7.0% |
| 35 to 39 Minutes | 2,049 | 1.7% |
| 40 to 44 Minutes | 1,902 | 1.6% |
| 45 to 59 Minutes | 4,280 | 3.6% |
| 60 to 89 Minutes | 3,326 | 2.8% |
| 90 or more Minutes | 2,510 | 2.1% |
Commute Time by Sex in Area Code 906
The most common commute times in Area Code 906 are 5 to 9 minutes (13,336 commuters, 21.1%) for males and 5 to 9 minutes (14,304 commuters, 25.8%) for females.
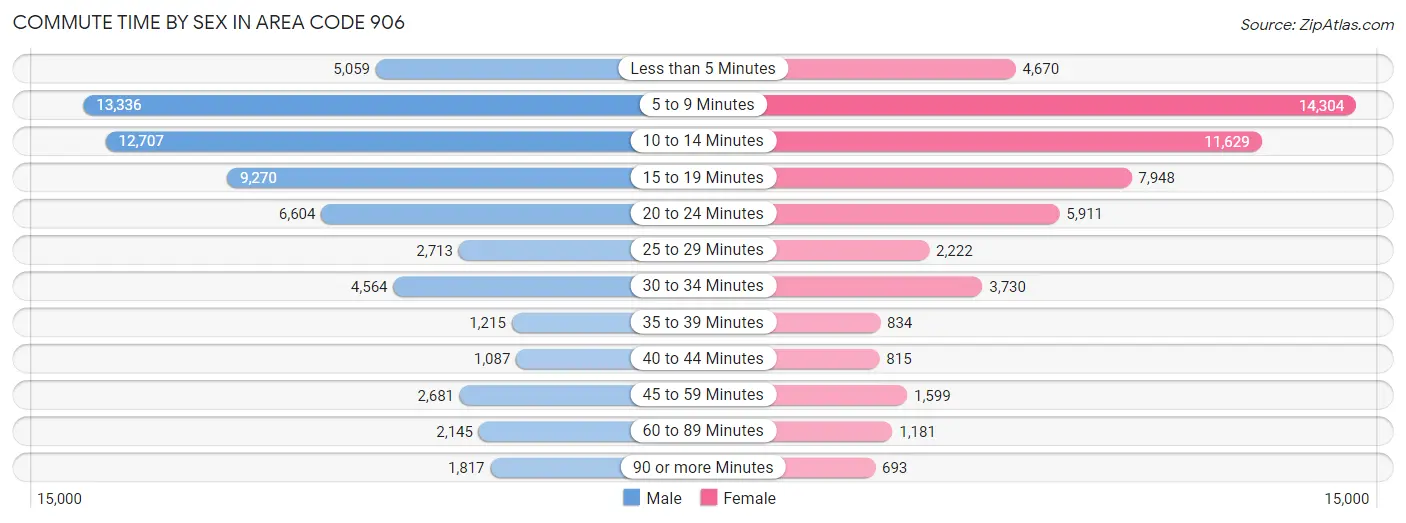
| Commute Time | Male | Female |
| Less than 5 Minutes | 5,059 (8.0%) | 4,670 (8.4%) |
| 5 to 9 Minutes | 13,336 (21.1%) | 14,304 (25.8%) |
| 10 to 14 Minutes | 12,707 (20.1%) | 11,629 (20.9%) |
| 15 to 19 Minutes | 9,270 (14.7%) | 7,948 (14.3%) |
| 20 to 24 Minutes | 6,604 (10.4%) | 5,911 (10.6%) |
| 25 to 29 Minutes | 2,713 (4.3%) | 2,222 (4.0%) |
| 30 to 34 Minutes | 4,564 (7.2%) | 3,730 (6.7%) |
| 35 to 39 Minutes | 1,215 (1.9%) | 834 (1.5%) |
| 40 to 44 Minutes | 1,087 (1.7%) | 815 (1.5%) |
| 45 to 59 Minutes | 2,681 (4.2%) | 1,599 (2.9%) |
| 60 to 89 Minutes | 2,145 (3.4%) | 1,181 (2.1%) |
| 90 or more Minutes | 1,817 (2.9%) | 693 (1.3%) |
Time of Departure to Work by Sex in Area Code 906
The most frequent times of departure to work in Area Code 906 are 7:30 AM to 7:59 AM (8,307, 13.1%) for males and 7:30 AM to 7:59 AM (10,321, 18.6%) for females.
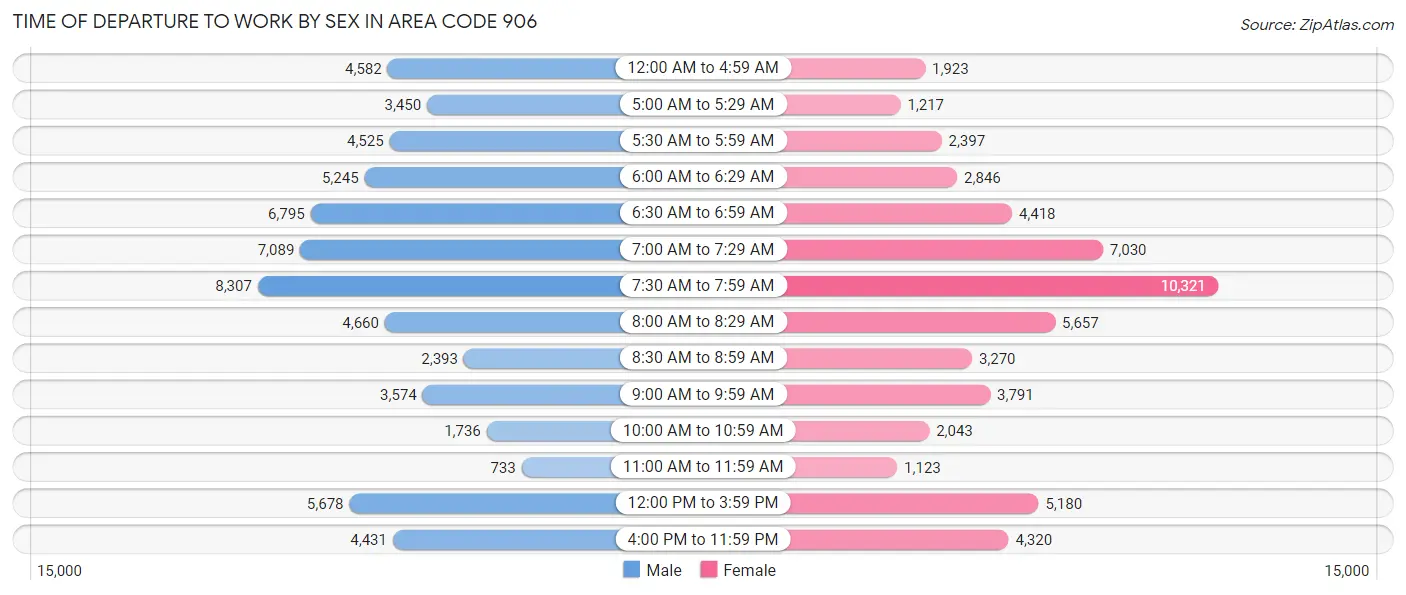
| Time of Departure | Male | Female |
| 12:00 AM to 4:59 AM | 4,582 (7.2%) | 1,923 (3.5%) |
| 5:00 AM to 5:29 AM | 3,450 (5.5%) | 1,217 (2.2%) |
| 5:30 AM to 5:59 AM | 4,525 (7.2%) | 2,397 (4.3%) |
| 6:00 AM to 6:29 AM | 5,245 (8.3%) | 2,846 (5.1%) |
| 6:30 AM to 6:59 AM | 6,795 (10.7%) | 4,418 (8.0%) |
| 7:00 AM to 7:29 AM | 7,089 (11.2%) | 7,030 (12.7%) |
| 7:30 AM to 7:59 AM | 8,307 (13.1%) | 10,321 (18.6%) |
| 8:00 AM to 8:29 AM | 4,660 (7.4%) | 5,657 (10.2%) |
| 8:30 AM to 8:59 AM | 2,393 (3.8%) | 3,270 (5.9%) |
| 9:00 AM to 9:59 AM | 3,574 (5.7%) | 3,791 (6.8%) |
| 10:00 AM to 10:59 AM | 1,736 (2.8%) | 2,043 (3.7%) |
| 11:00 AM to 11:59 AM | 733 (1.2%) | 1,123 (2.0%) |
| 12:00 PM to 3:59 PM | 5,678 (9.0%) | 5,180 (9.3%) |
| 4:00 PM to 11:59 PM | 4,431 (7.0%) | 4,320 (7.8%) |
| Total | 63,198 (100.0%) | 55,536 (100.0%) |
Housing Occupancy in Area Code 906
Occupancy by Ownership in Area Code 906
Of the total 126,437 dwellings in Area Code 906, owner-occupied units account for 97,415 (77.0%), while renter-occupied units make up 29,022 (23.0%).
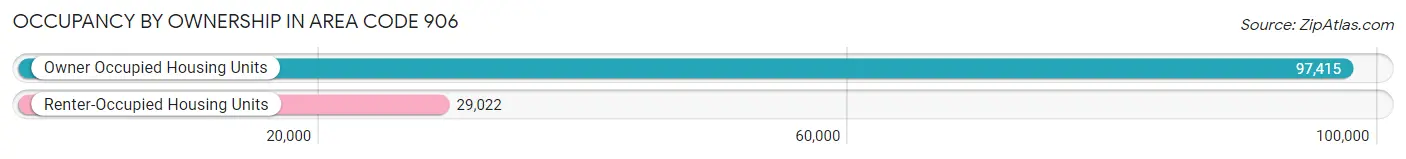
| Occupancy | # Housing Units | % Housing Units |
| Owner Occupied Housing Units | 97,415 | 77.0% |
| Renter-Occupied Housing Units | 29,022 | 23.0% |
| Total Occupied Housing Units | 126,437 | 100.0% |
Occupancy by Household Size in Area Code 906
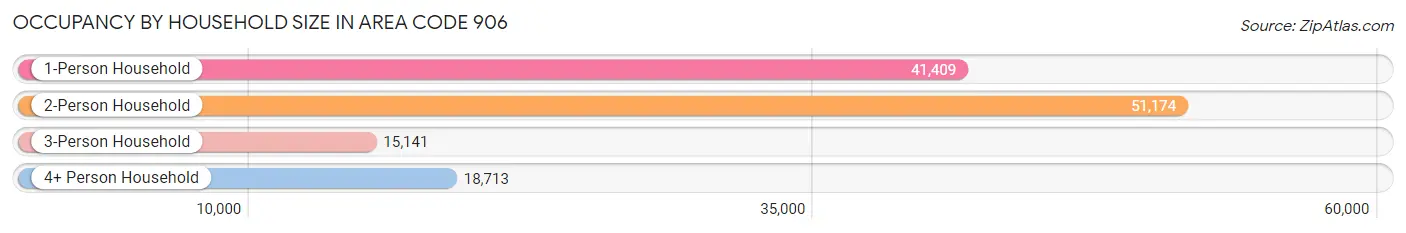
| Household Size | # Housing Units | % Housing Units |
| 1-Person Household | 41,409 | 32.8% |
| 2-Person Household | 51,174 | 40.5% |
| 3-Person Household | 15,141 | 12.0% |
| 4+ Person Household | 18,713 | 14.8% |
| Total Housing Units | 126,437 | 100.0% |
Occupancy by Ownership by Household Size in Area Code 906
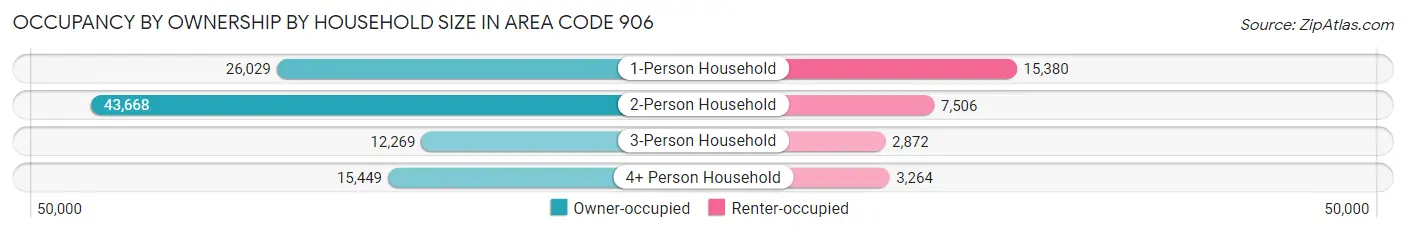
| Household Size | Owner-occupied | Renter-occupied |
| 1-Person Household | 26,029 (62.9%) | 15,380 (37.1%) |
| 2-Person Household | 43,668 (85.3%) | 7,506 (14.7%) |
| 3-Person Household | 12,269 (81.0%) | 2,872 (19.0%) |
| 4+ Person Household | 15,449 (82.6%) | 3,264 (17.4%) |
| Total Housing Units | 97,415 (77.0%) | 29,022 (23.0%) |
Occupancy by Educational Attainment in Area Code 906
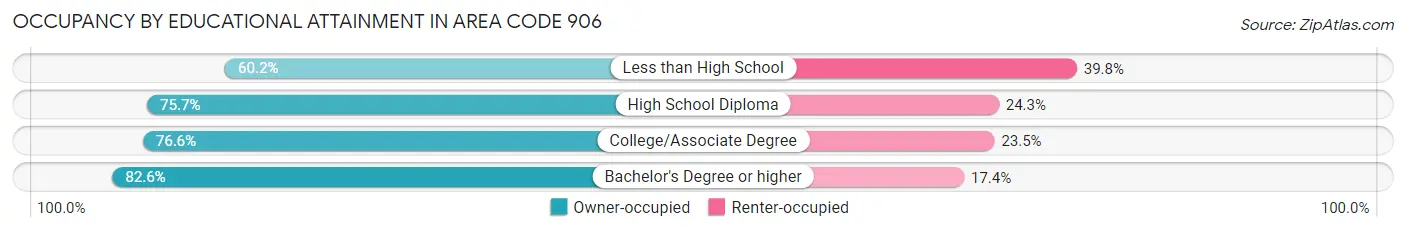
| Household Size | Owner-occupied | Renter-occupied |
| Less than High School | 3,934 (60.2%) | 2,598 (39.8%) |
| High School Diploma | 30,072 (75.7%) | 9,657 (24.3%) |
| College/Associate Degree | 35,578 (76.5%) | 10,897 (23.4%) |
| Bachelor's Degree or higher | 27,831 (82.6%) | 5,870 (17.4%) |
Occupancy by Age of Householder in Area Code 906
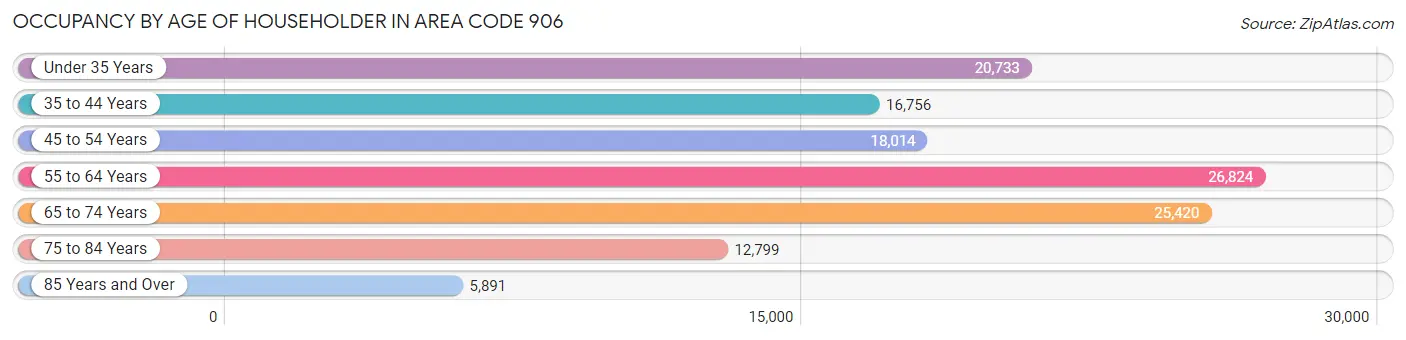
| Age Bracket | # Households | % Households |
| Under 35 Years | 20,733 | 16.4% |
| 35 to 44 Years | 16,756 | 13.3% |
| 45 to 54 Years | 18,014 | 14.2% |
| 55 to 64 Years | 26,824 | 21.2% |
| 65 to 74 Years | 25,420 | 20.1% |
| 75 to 84 Years | 12,799 | 10.1% |
| 85 Years and Over | 5,891 | 4.7% |
| Total | 126,437 | 100.0% |
Housing Finances in Area Code 906
Median Income by Occupancy in Area Code 906
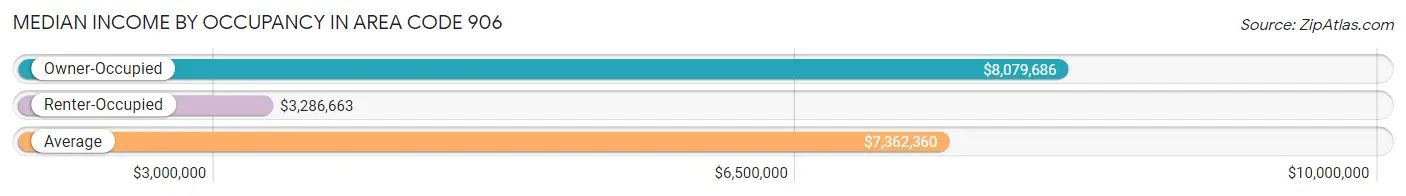
| Occupancy Type | # Households | Median Income |
| Owner-Occupied | 97,415 (77.0%) | $8,079,686 |
| Renter-Occupied | 29,022 (23.0%) | $3,286,663 |
| Average | 126,437 (100.0%) | $7,362,360 |
Occupancy by Householder Income Bracket in Area Code 906
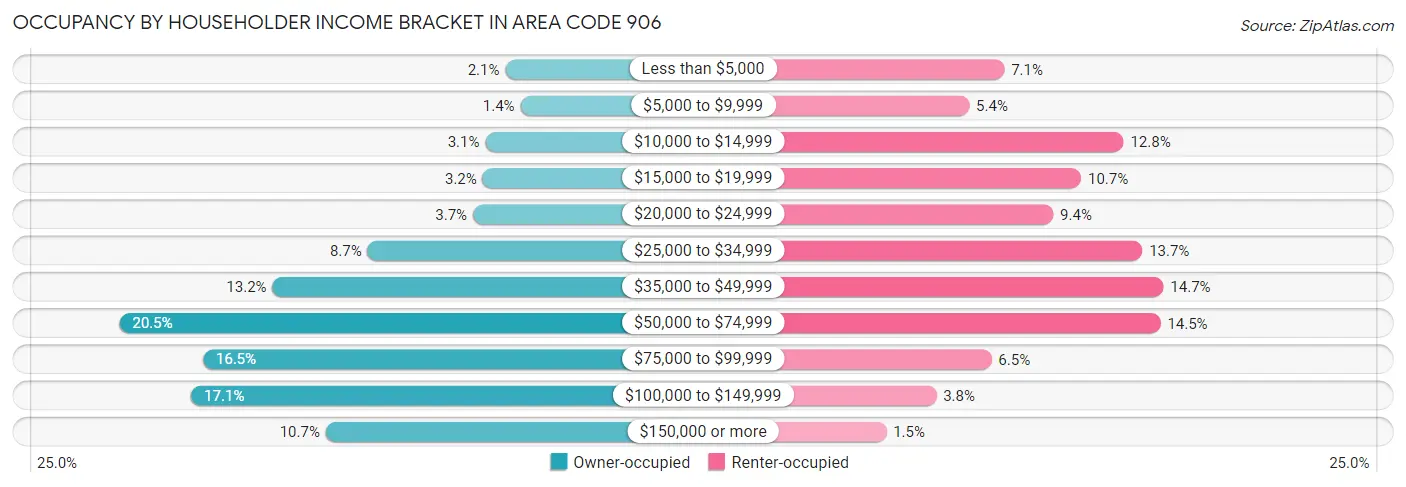
| Income Bracket | Owner-occupied | Renter-occupied |
| Less than $5,000 | 2,060 (2.1%) | 2,054 (7.1%) |
| $5,000 to $9,999 | 1,356 (1.4%) | 1,569 (5.4%) |
| $10,000 to $14,999 | 2,981 (3.1%) | 3,703 (12.8%) |
| $15,000 to $19,999 | 3,111 (3.2%) | 3,117 (10.7%) |
| $20,000 to $24,999 | 3,553 (3.6%) | 2,732 (9.4%) |
| $25,000 to $34,999 | 8,445 (8.7%) | 3,962 (13.7%) |
| $35,000 to $49,999 | 12,857 (13.2%) | 4,254 (14.7%) |
| $50,000 to $74,999 | 19,965 (20.5%) | 4,215 (14.5%) |
| $75,000 to $99,999 | 16,080 (16.5%) | 1,877 (6.5%) |
| $100,000 to $149,999 | 16,625 (17.1%) | 1,114 (3.8%) |
| $150,000 or more | 10,382 (10.7%) | 425 (1.5%) |
| Total | 97,415 (100.0%) | 29,022 (100.0%) |
Monthly Housing Cost Tiers in Area Code 906
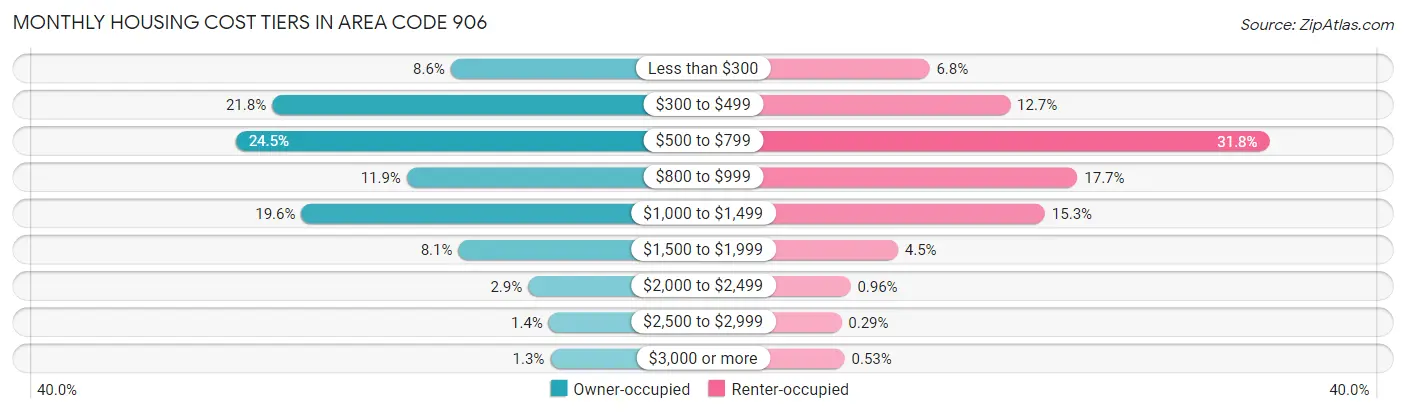
| Monthly Cost | Owner-occupied | Renter-occupied |
| Less than $300 | 8,397 (8.6%) | 1,969 (6.8%) |
| $300 to $499 | 21,213 (21.8%) | 3,691 (12.7%) |
| $500 to $799 | 23,816 (24.4%) | 9,232 (31.8%) |
| $800 to $999 | 11,557 (11.9%) | 5,127 (17.7%) |
| $1,000 to $1,499 | 19,115 (19.6%) | 4,435 (15.3%) |
| $1,500 to $1,999 | 7,851 (8.1%) | 1,292 (4.4%) |
| $2,000 to $2,499 | 2,843 (2.9%) | 280 (1.0%) |
| $2,500 to $2,999 | 1,365 (1.4%) | 84 (0.3%) |
| $3,000 or more | 1,258 (1.3%) | 154 (0.5%) |
| Total | 97,415 (100.0%) | 29,022 (100.0%) |
Physical Housing Characteristics in Area Code 906
Housing Structures in Area Code 906
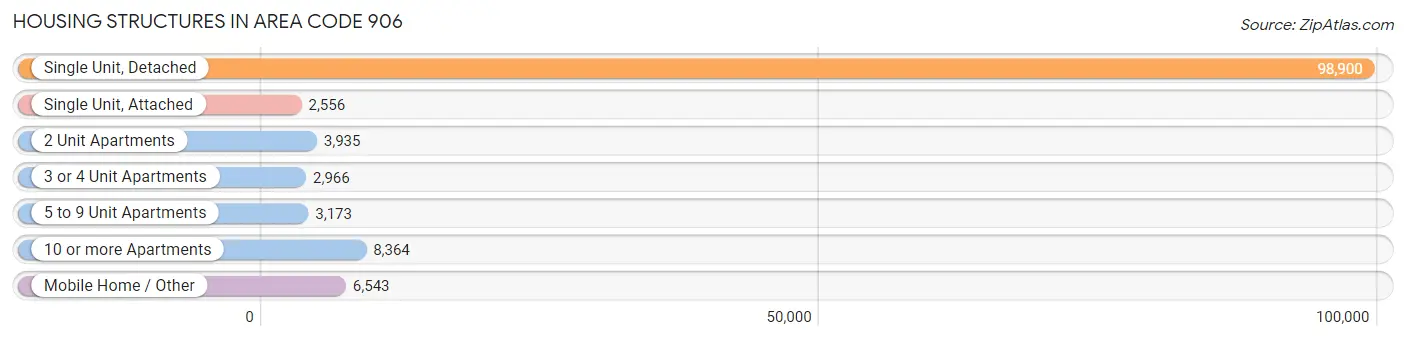
| Structure Type | # Housing Units | % Housing Units |
| Single Unit, Detached | 98,900 | 78.2% |
| Single Unit, Attached | 2,556 | 2.0% |
| 2 Unit Apartments | 3,935 | 3.1% |
| 3 or 4 Unit Apartments | 2,966 | 2.4% |
| 5 to 9 Unit Apartments | 3,173 | 2.5% |
| 10 or more Apartments | 8,364 | 6.6% |
| Mobile Home / Other | 6,543 | 5.2% |
| Total | 126,437 | 100.0% |
Housing Structures by Occupancy in Area Code 906
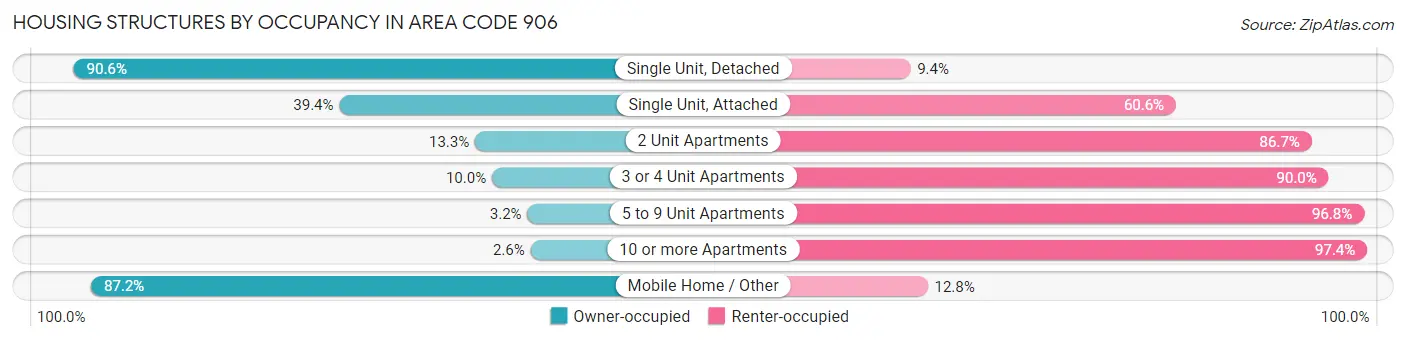
| Structure Type | Owner-occupied | Renter-occupied |
| Single Unit, Detached | 89,564 (90.6%) | 9,336 (9.4%) |
| Single Unit, Attached | 1,007 (39.4%) | 1,549 (60.6%) |
| 2 Unit Apartments | 522 (13.3%) | 3,413 (86.7%) |
| 3 or 4 Unit Apartments | 297 (10.0%) | 2,669 (90.0%) |
| 5 to 9 Unit Apartments | 101 (3.2%) | 3,072 (96.8%) |
| 10 or more Apartments | 217 (2.6%) | 8,147 (97.4%) |
| Mobile Home / Other | 5,707 (87.2%) | 836 (12.8%) |
| Total | 97,415 (77.0%) | 29,022 (23.0%) |
Housing Structures by Number of Rooms in Area Code 906
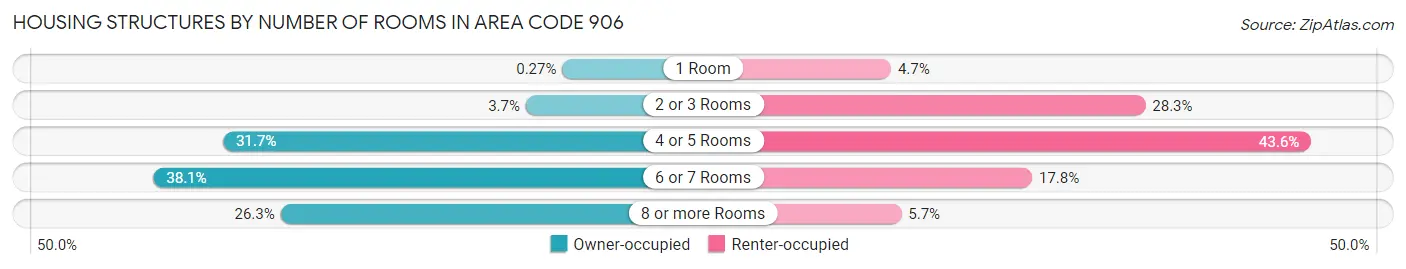
| Number of Rooms | Owner-occupied | Renter-occupied |
| 1 Room | 266 (0.3%) | 1,370 (4.7%) |
| 2 or 3 Rooms | 3,557 (3.6%) | 8,199 (28.2%) |
| 4 or 5 Rooms | 30,831 (31.7%) | 12,649 (43.6%) |
| 6 or 7 Rooms | 37,109 (38.1%) | 5,157 (17.8%) |
| 8 or more Rooms | 25,652 (26.3%) | 1,647 (5.7%) |
| Total | 97,415 (100.0%) | 29,022 (100.0%) |
Housing Structure by Heating Type in Area Code 906
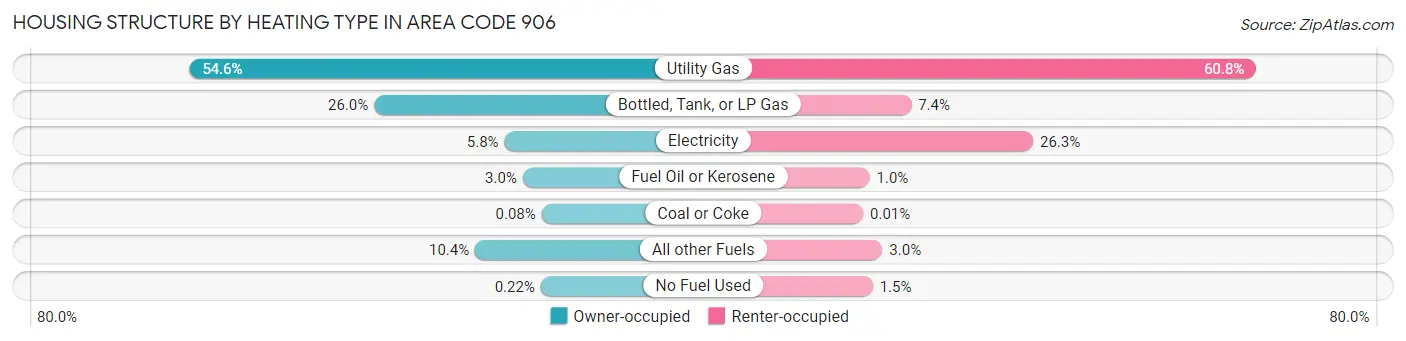
| Heating Type | Owner-occupied | Renter-occupied |
| Utility Gas | 53,138 (54.5%) | 17,638 (60.8%) |
| Bottled, Tank, or LP Gas | 25,310 (26.0%) | 2,160 (7.4%) |
| Electricity | 5,678 (5.8%) | 7,626 (26.3%) |
| Fuel Oil or Kerosene | 2,908 (3.0%) | 294 (1.0%) |
| Coal or Coke | 81 (0.1%) | 3 (0.0%) |
| All other Fuels | 10,089 (10.4%) | 867 (3.0%) |
| No Fuel Used | 211 (0.2%) | 434 (1.5%) |
| Total | 97,415 (100.0%) | 29,022 (100.0%) |
Household Vehicle Usage in Area Code 906
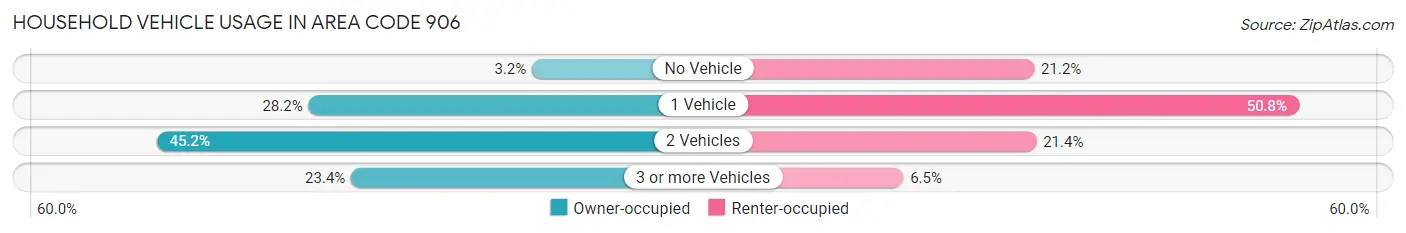
| Vehicles per Household | Owner-occupied | Renter-occupied |
| No Vehicle | 3,073 (3.2%) | 6,152 (21.2%) |
| 1 Vehicle | 27,473 (28.2%) | 14,755 (50.8%) |
| 2 Vehicles | 44,053 (45.2%) | 6,219 (21.4%) |
| 3 or more Vehicles | 22,816 (23.4%) | 1,896 (6.5%) |
| Total | 97,415 (100.0%) | 29,022 (100.0%) |
Real Estate & Mortgages in Area Code 906
Real Estate and Mortgage Overview in Area Code 906
| Characteristic | Without Mortgage | With Mortgage |
| Housing Units | 48,846 | 48,569 |
| Median Property Value | $16,348,400 | $18,696,700 |
| Median Household Income | $6,539,111 | $6,355 |
| Monthly Housing Costs | $57,133 | $1,193 |
| Real Estate Taxes | $179,083 | $2,024 |
Property Value by Mortgage Status in Area Code 906
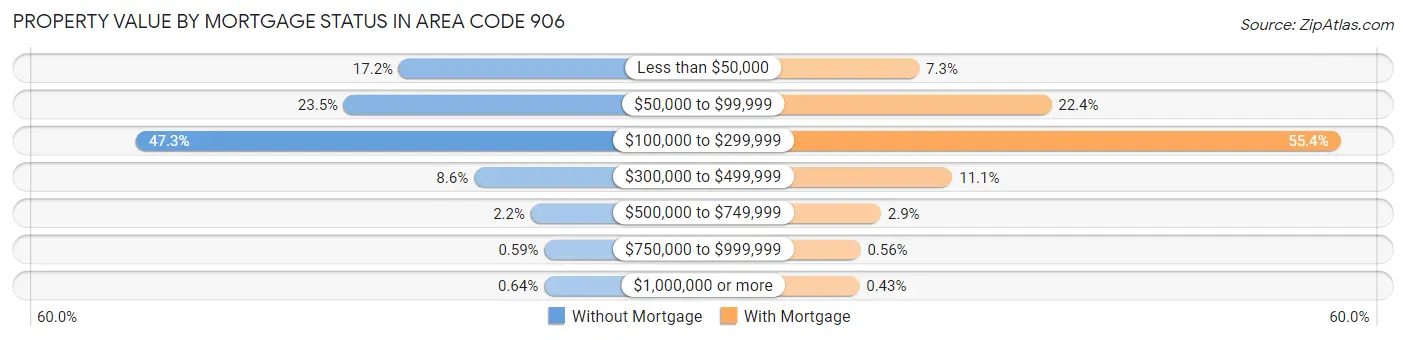
| Property Value | Without Mortgage | With Mortgage |
| Less than $50,000 | 8,409 (17.2%) | 3,529 (7.3%) |
| $50,000 to $99,999 | 11,483 (23.5%) | 10,867 (22.4%) |
| $100,000 to $299,999 | 23,082 (47.2%) | 26,917 (55.4%) |
| $300,000 to $499,999 | 4,222 (8.6%) | 5,372 (11.1%) |
| $500,000 to $749,999 | 1,052 (2.1%) | 1,405 (2.9%) |
| $750,000 to $999,999 | 286 (0.6%) | 272 (0.6%) |
| $1,000,000 or more | 312 (0.6%) | 207 (0.4%) |
| Total | 48,846 (100.0%) | 48,569 (100.0%) |
Household Income by Mortgage Status in Area Code 906
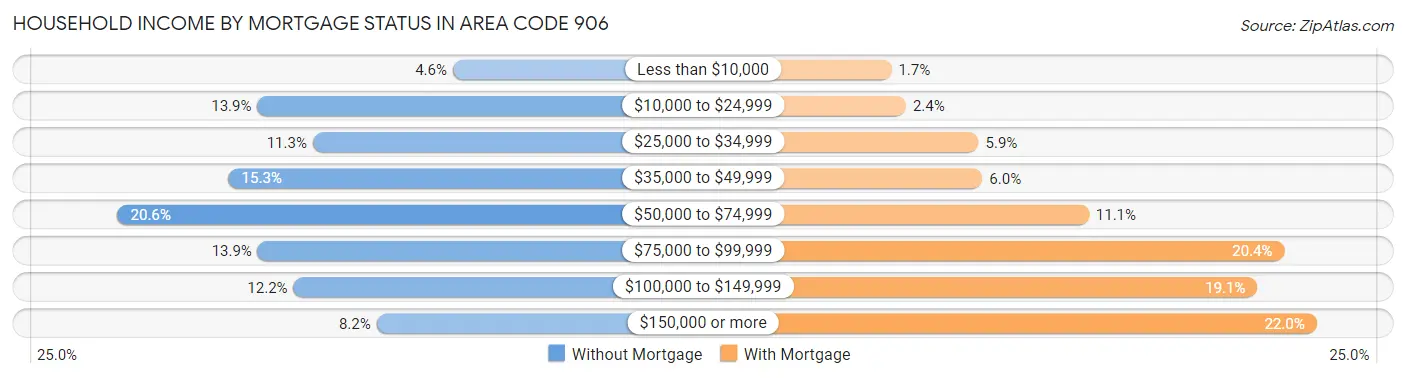
| Household Income | Without Mortgage | With Mortgage |
| Less than $10,000 | 2,251 (4.6%) | 830 (1.7%) |
| $10,000 to $24,999 | 6,798 (13.9%) | 1,165 (2.4%) |
| $25,000 to $34,999 | 5,510 (11.3%) | 2,847 (5.9%) |
| $35,000 to $49,999 | 7,462 (15.3%) | 2,935 (6.0%) |
| $50,000 to $74,999 | 10,049 (20.6%) | 5,395 (11.1%) |
| $75,000 to $99,999 | 6,790 (13.9%) | 9,916 (20.4%) |
| $100,000 to $149,999 | 5,959 (12.2%) | 9,290 (19.1%) |
| $150,000 or more | 4,027 (8.2%) | 10,666 (22.0%) |
| Total | 48,846 (100.0%) | 48,569 (100.0%) |
Property Value to Household Income Ratio in Area Code 906
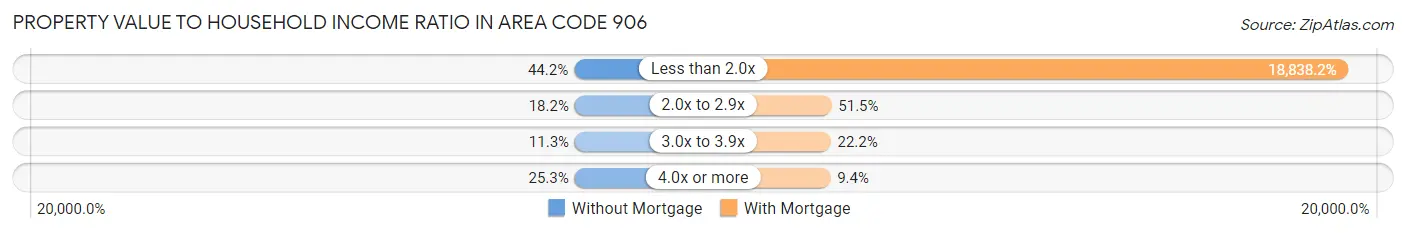
| Value-to-Income Ratio | Without Mortgage | With Mortgage |
| Less than 2.0x | 21,583 (44.2%) | 9,149,536 (18,838.2%) |
| 2.0x to 2.9x | 8,874 (18.2%) | 25,004 (51.5%) |
| 3.0x to 3.9x | 5,496 (11.3%) | 10,803 (22.2%) |
| 4.0x or more | 12,378 (25.3%) | 4,582 (9.4%) |
| Total | 48,846 (100.0%) | 48,569 (100.0%) |
Real Estate Taxes by Mortgage Status in Area Code 906
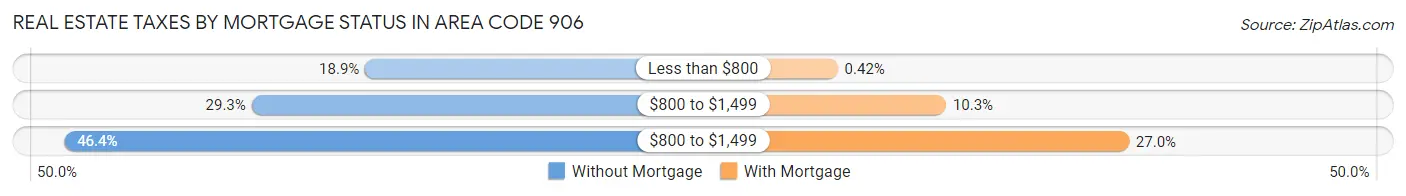
| Property Taxes | Without Mortgage | With Mortgage |
| Less than $800 | 9,231 (18.9%) | 206 (0.4%) |
| $800 to $1,499 | 14,298 (29.3%) | 5,006 (10.3%) |
| $800 to $1,499 | 22,656 (46.4%) | 13,123 (27.0%) |
| Total | 48,846 (100.0%) | 48,569 (100.0%) |
Health & Disability in Area Code 906
Health Insurance Coverage by Age in Area Code 906
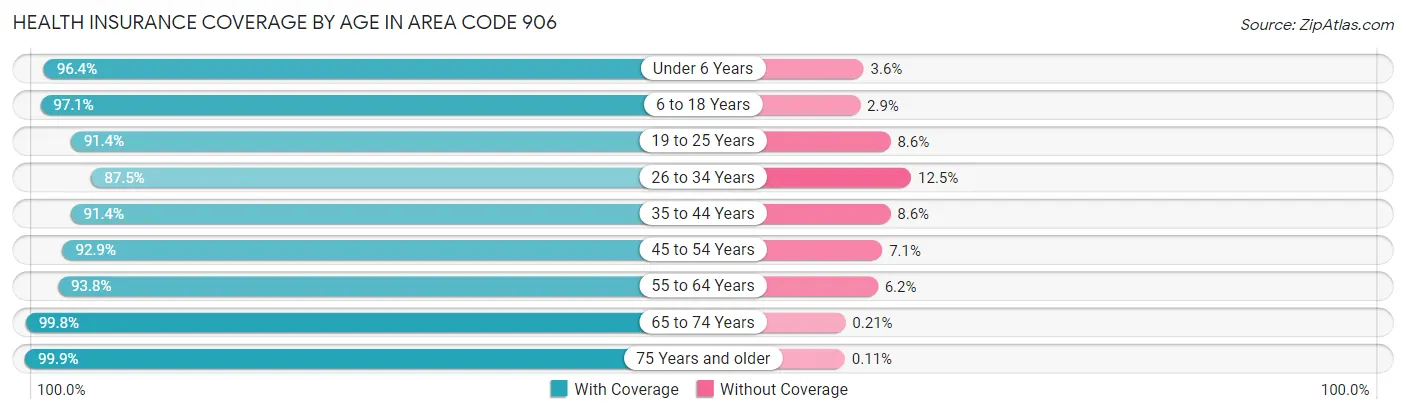
| Age Bracket | With Coverage | Without Coverage |
| Under 6 Years | 15,681 (96.4%) | 585 (3.6%) |
| 6 to 18 Years | 41,432 (97.1%) | 1,257 (2.9%) |
| 19 to 25 Years | 28,813 (91.4%) | 2,716 (8.6%) |
| 26 to 34 Years | 23,760 (87.5%) | 3,382 (12.5%) |
| 35 to 44 Years | 28,132 (91.4%) | 2,642 (8.6%) |
| 45 to 54 Years | 30,255 (92.9%) | 2,302 (7.1%) |
| 55 to 64 Years | 41,745 (93.8%) | 2,773 (6.2%) |
| 65 to 74 Years | 40,299 (99.8%) | 84 (0.2%) |
| 75 Years and older | 26,422 (99.9%) | 30 (0.1%) |
| Total | 276,539 (94.6%) | 15,771 (5.4%) |
Health Insurance Coverage by Citizenship Status in Area Code 906
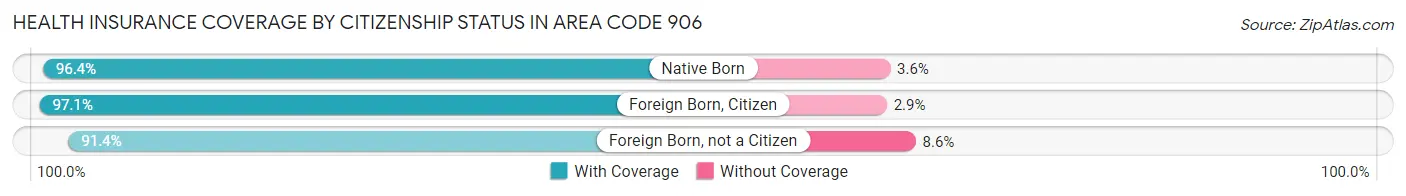
| Citizenship Status | With Coverage | Without Coverage |
| Native Born | 15,681 (96.4%) | 585 (3.6%) |
| Foreign Born, Citizen | 41,432 (97.1%) | 1,257 (2.9%) |
| Foreign Born, not a Citizen | 28,813 (91.4%) | 2,716 (8.6%) |
Health Insurance Coverage by Household Income in Area Code 906
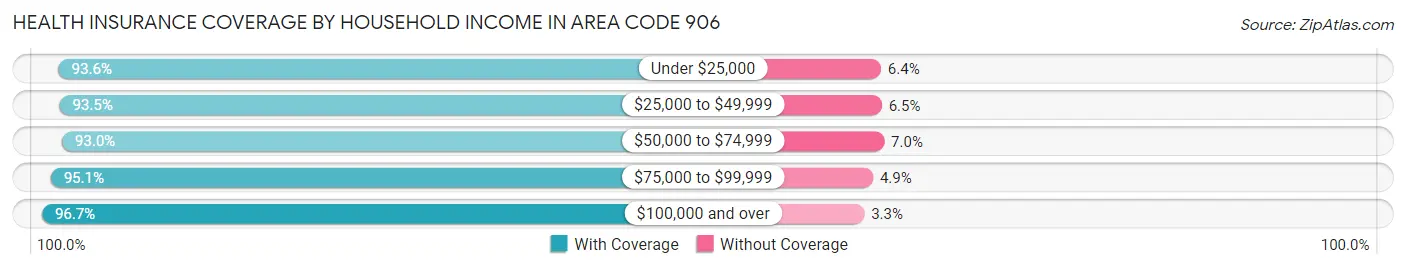
| Household Income | With Coverage | Without Coverage |
| Under $25,000 | 36,992 (93.6%) | 2,525 (6.4%) |
| $25,000 to $49,999 | 52,108 (93.5%) | 3,644 (6.5%) |
| $50,000 to $74,999 | 52,192 (93.0%) | 3,928 (7.0%) |
| $75,000 to $99,999 | 45,064 (95.1%) | 2,324 (4.9%) |
| $100,000 and over | 83,961 (96.7%) | 2,826 (3.3%) |
Public vs Private Health Insurance Coverage by Age in Area Code 906
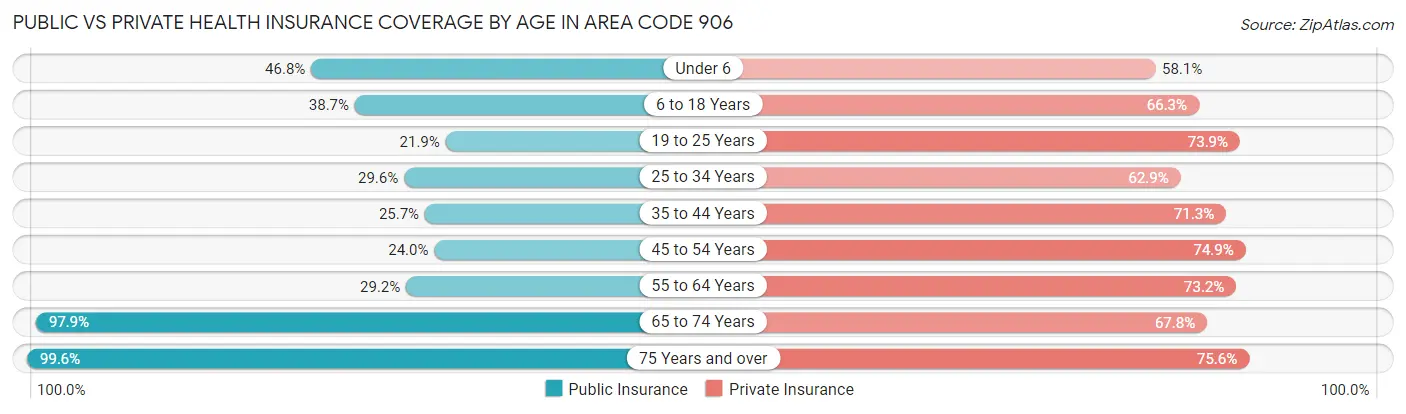
| Age Bracket | Public Insurance | Private Insurance |
| Under 6 | 7,614 (46.8%) | 9,457 (58.1%) |
| 6 to 18 Years | 16,521 (38.7%) | 28,288 (66.3%) |
| 19 to 25 Years | 6,890 (21.8%) | 23,295 (73.9%) |
| 25 to 34 Years | 8,026 (29.6%) | 17,063 (62.9%) |
| 35 to 44 Years | 7,906 (25.7%) | 21,946 (71.3%) |
| 45 to 54 Years | 7,802 (24.0%) | 24,399 (74.9%) |
| 55 to 64 Years | 12,995 (29.2%) | 32,581 (73.2%) |
| 65 to 74 Years | 39,539 (97.9%) | 27,371 (67.8%) |
| 75 Years and over | 26,337 (99.6%) | 19,995 (75.6%) |
| Total | 133,630 (45.7%) | 204,395 (69.9%) |
Disability Status by Sex by Age in Area Code 906
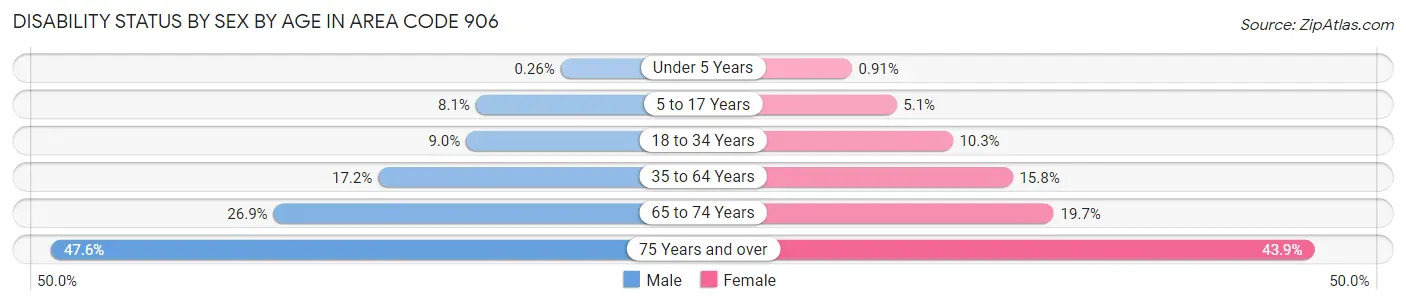
| Age Bracket | Male | Female |
| Under 5 Years | 18 (0.3%) | 60 (0.9%) |
| 5 to 17 Years | 1,739 (8.1%) | 999 (5.1%) |
| 18 to 34 Years | 3,036 (9.0%) | 3,020 (10.3%) |
| 35 to 64 Years | 9,441 (17.2%) | 8,391 (15.8%) |
| 65 to 74 Years | 5,568 (26.9%) | 3,871 (19.7%) |
| 75 Years and over | 5,640 (47.5%) | 6,399 (43.9%) |
Disability Class by Sex by Age in Area Code 906
Disability Class: Hearing Difficulty
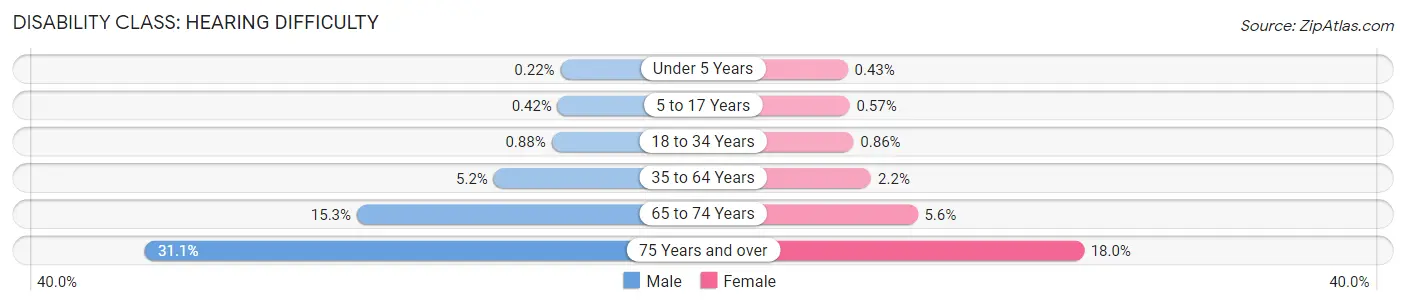
| Age Bracket | Male | Female |
| Under 5 Years | 15 (0.2%) | 28 (0.4%) |
| 5 to 17 Years | 89 (0.4%) | 112 (0.6%) |
| 18 to 34 Years | 297 (0.9%) | 254 (0.9%) |
| 35 to 64 Years | 2,835 (5.2%) | 1,154 (2.2%) |
| 65 to 74 Years | 3,172 (15.3%) | 1,107 (5.6%) |
| 75 Years and over | 3,682 (31.0%) | 2,620 (18.0%) |
Disability Class: Vision Difficulty
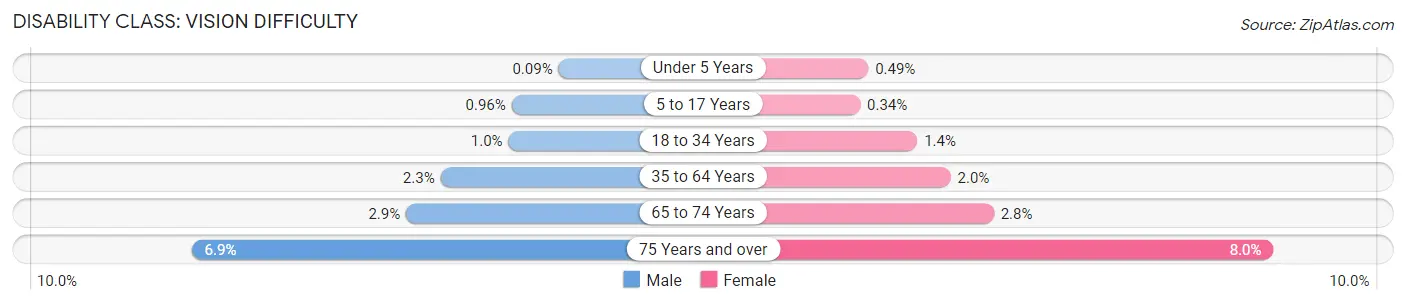
| Age Bracket | Male | Female |
| Under 5 Years | 6 (0.1%) | 32 (0.5%) |
| 5 to 17 Years | 205 (1.0%) | 68 (0.3%) |
| 18 to 34 Years | 343 (1.0%) | 411 (1.4%) |
| 35 to 64 Years | 1,249 (2.3%) | 1,070 (2.0%) |
| 65 to 74 Years | 605 (2.9%) | 555 (2.8%) |
| 75 Years and over | 818 (6.9%) | 1,169 (8.0%) |
Disability Class: Cognitive Difficulty
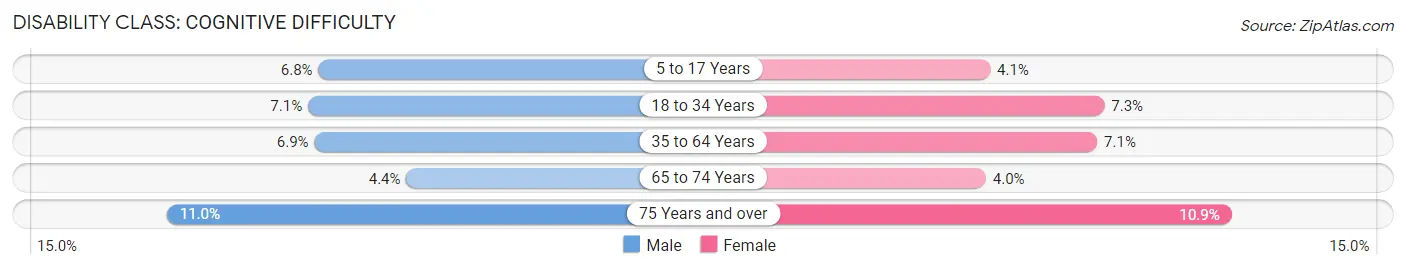
| Age Bracket | Male | Female |
| 5 to 17 Years | 1,457 (6.8%) | 815 (4.1%) |
| 18 to 34 Years | 2,393 (7.1%) | 2,150 (7.3%) |
| 35 to 64 Years | 3,804 (6.9%) | 3,766 (7.1%) |
| 65 to 74 Years | 904 (4.4%) | 790 (4.0%) |
| 75 Years and over | 1,309 (11.0%) | 1,583 (10.8%) |
Disability Class: Ambulatory Difficulty
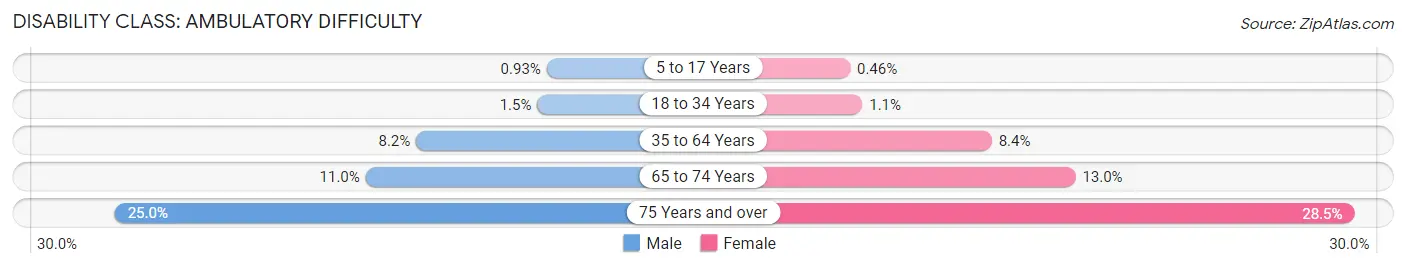
| Age Bracket | Male | Female |
| 5 to 17 Years | 198 (0.9%) | 90 (0.5%) |
| 18 to 34 Years | 488 (1.5%) | 336 (1.1%) |
| 35 to 64 Years | 4,501 (8.2%) | 4,424 (8.4%) |
| 65 to 74 Years | 2,279 (11.0%) | 2,562 (13.0%) |
| 75 Years and over | 2,963 (25.0%) | 4,165 (28.5%) |
Disability Class: Self-Care Difficulty
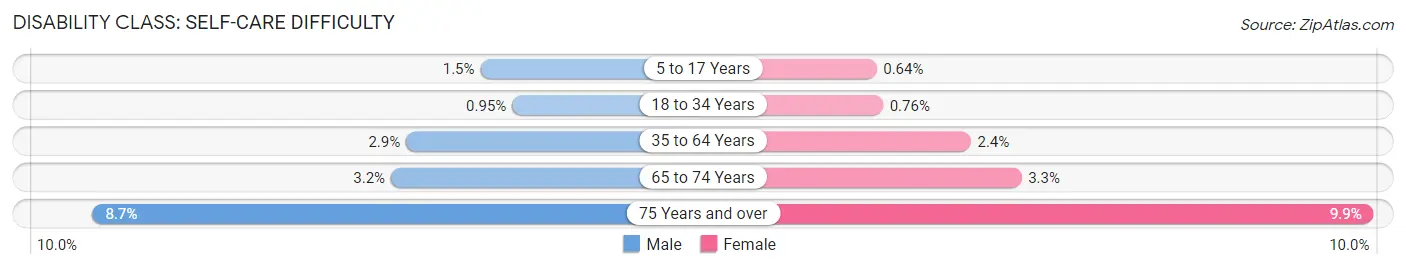
| Age Bracket | Male | Female |
| 5 to 17 Years | 328 (1.5%) | 127 (0.6%) |
| 18 to 34 Years | 320 (0.9%) | 225 (0.8%) |
| 35 to 64 Years | 1,605 (2.9%) | 1,265 (2.4%) |
| 65 to 74 Years | 663 (3.2%) | 655 (3.3%) |
| 75 Years and over | 1,036 (8.7%) | 1,440 (9.9%) |
Technology Access in Area Code 906
Computing Device Access in Area Code 906
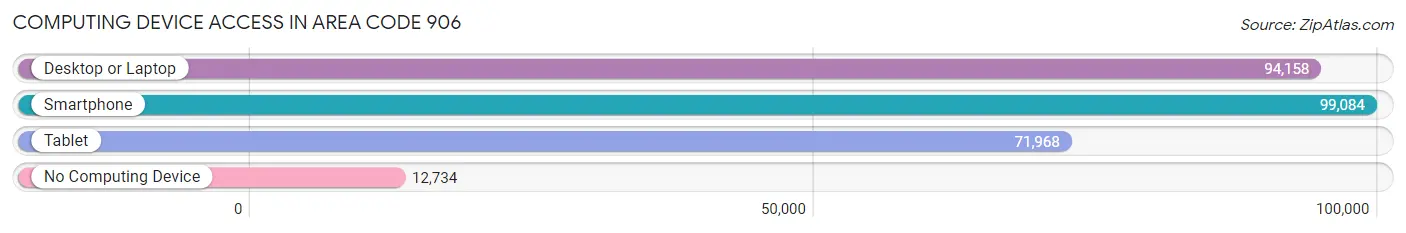
| Device Type | # Households | % Households |
| Desktop or Laptop | 94,158 | 74.5% |
| Smartphone | 99,084 | 78.4% |
| Tablet | 71,968 | 56.9% |
| No Computing Device | 12,734 | 10.1% |
| Total | 126,437 | 100.0% |
Internet Access in Area Code 906
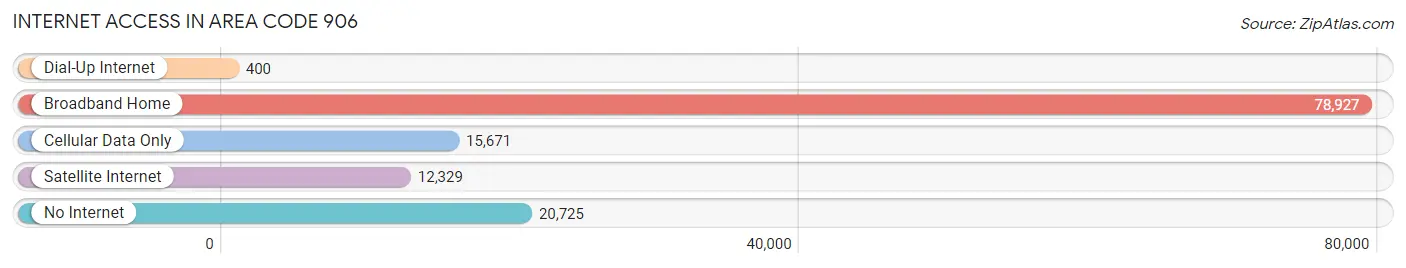
| Internet Type | # Households | % Households |
| Dial-Up Internet | 400 | 0.3% |
| Broadband Home | 78,927 | 62.4% |
| Cellular Data Only | 15,671 | 12.4% |
| Satellite Internet | 12,329 | 9.8% |
| No Internet | 20,725 | 16.4% |
| Total | 126,437 | 100.0% |
Area Code 906 Summary
Geography
Area code 906 is located in the Upper Peninsula of Michigan. It covers the entire Upper Peninsula, including the cities of Marquette, Escanaba, and Iron Mountain.
Social
Area code 906 is home to a diverse population of people from all walks of life. The area is known for its outdoor activities, such as fishing, hunting, and camping. It is also home to a number of universities and colleges, including Northern Michigan University and Michigan Technological University.
Economics
Area code 906 is a largely rural area, with a strong agricultural and forestry industry. The area is also home to a number of manufacturing and technology companies, as well as a growing tourism industry.
Demographics
The population of area code 906 is largely white, with a small percentage of African Americans, Native Americans, and other ethnicities. The median household income is slightly below the national average, and the unemployment rate is slightly higher than the national average.
Common Questions
What is Per Capita Income in Area Code 906?
Per Capita income in Area Code 906 is $32,113.
What is the Median Family Income in Area Code 906?
Median Family Income in Area Code 906 is $70,886.
What is the Median Household income in Area Code 906?
Median Household Income in Area Code 906 is $55,775.
What is Income or Wage Gap in Area Code 906?
Income or Wage Gap in Area Code 906 is 35.5%.
Women in Area Code 906 earn 64.5 cents for every dollar earned by a man.
What is Family Income Deficit in Area Code 906?
Family Income Deficit in Area Code 906 is $11,007.
Families that are below poverty line in Area Code 906 earn $11,007 less on average than the poverty threshold level.
What is Inequality or Gini Index in Area Code 906?
Inequality or Gini Index in Area Code 906 is 53.88.
What is the Total Population of Area Code 906?
Total Population of Area Code 906 is 302,509.
What is the Total Male Population of Area Code 906?
Total Male Population of Area Code 906 is 157,740.
What is the Total Female Population of Area Code 906?
Total Female Population of Area Code 906 is 144,769.
What is the Ratio of Males per 100 Females in Area Code 906?
There are 108.96 Males per 100 Females in Area Code 906.
What is the Ratio of Females per 100 Males in Area Code 906?
There are 91.78 Females per 100 Males in Area Code 906.
What is the Median Population Age in Area Code 906?
Median Population Age in Area Code 906 is 50.4 Years.
What is the Average Family Size in Area Code 906
Average Family Size in Area Code 906 is 2.8 People.
What is the Average Household Size in Area Code 906
Average Household Size in Area Code 906 is 2.2 People.
How Large is the Labor Force in Area Code 906?
There are 123,994 People in the Labor Forcein in Area Code 906.
What is the Percentage of People in the Labor Force in Area Code 906?
48.7% of People are in the Labor Force in Area Code 906.
What is the Unemployment Rate in Area Code 906?
Unemployment Rate in Area Code 906 is 7.7%.