Wayne County, MI Map & Demographics
Wayne County Map
Wayne County Overview
$32,643
PER CAPITA INCOME
$74,650
AVG FAMILY INCOME
$57,223
AVG HOUSEHOLD INCOME
25.3%
WAGE / INCOME GAP [ % ]
74.7¢/ $1
WAGE / INCOME GAP [ $ ]
$12,336
FAMILY INCOME DEFICIT
0.49
INEQUALITY / GINI INDEX
1,781,641
TOTAL POPULATION
864,475
MALE POPULATION
917,166
FEMALE POPULATION
94.26
MALES / 100 FEMALES
106.10
FEMALES / 100 MALES
37.7
MEDIAN AGE
3.4
AVG FAMILY SIZE
2.6
AVG HOUSEHOLD SIZE
836,649
LABOR FORCE [ PEOPLE ]
59.4%
PERCENT IN LABOR FORCE
9.0%
UNEMPLOYMENT RATE
Income in Wayne County
Income Overview in Wayne County
Per Capita Income in Wayne County is $32,643, while median incomes of families and households are $74,650 and $57,223 respectively.
| Characteristic | Number | Measure |
| Per Capita Income | 1,781,641 | $32,643 |
| Median Family Income | 411,619 | $74,650 |
| Mean Family Income | 411,619 | $98,698 |
| Median Household Income | 688,461 | $57,223 |
| Mean Household Income | 688,461 | $81,036 |
| Income Deficit | 411,619 | $12,336 |
| Wage / Income Gap (%) | 1,781,641 | 25.28% |
| Wage / Income Gap ($) | 1,781,641 | 74.72¢ per $1 |
| Gini / Inequality Index | 1,781,641 | 0.49 |
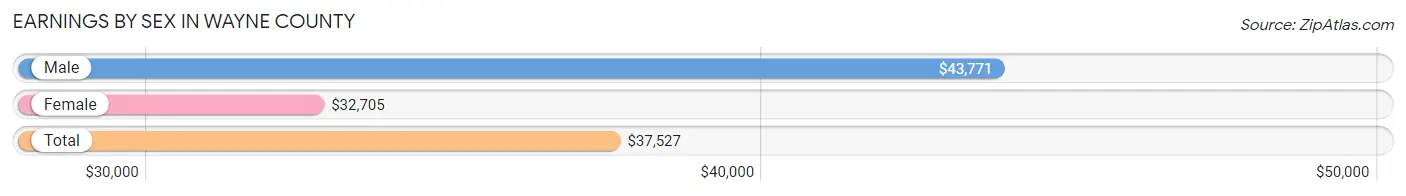
Earnings by Sex in Wayne County
Average Earnings in Wayne County are $37,527, $43,771 for men and $32,705 for women, a difference of 25.3%.
| Sex | Number | Average Earnings |
| Male | 436,070 (51.1%) | $43,771 |
| Female | 417,252 (48.9%) | $32,705 |
| Total | 853,322 (100.0%) | $37,527 |
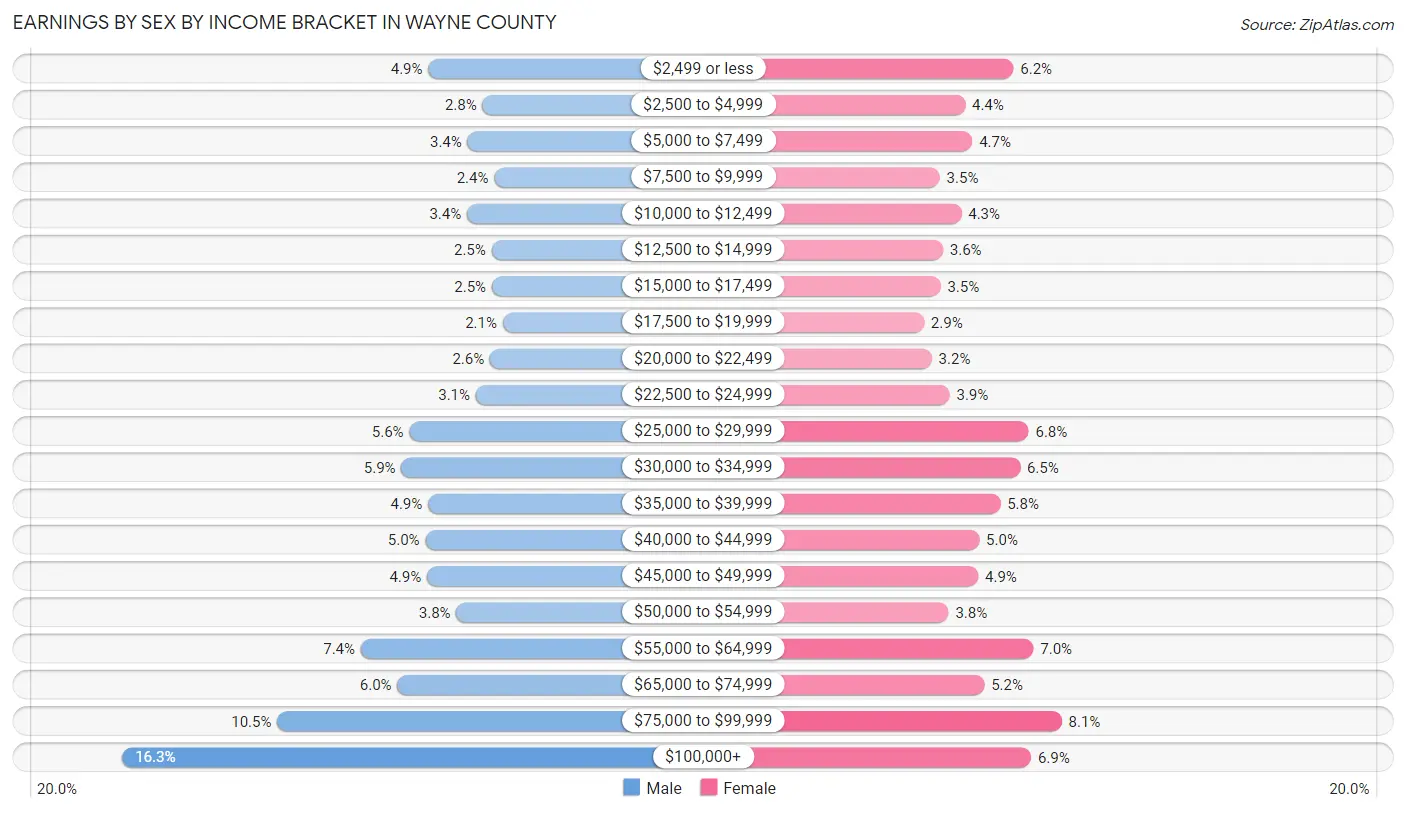
Earnings by Sex by Income Bracket in Wayne County
The most common earnings brackets in Wayne County are $100,000+ for men (71,233 | 16.3%) and $75,000 to $99,999 for women (33,597 | 8.1%).
| Income | Male | Female |
| $2,499 or less | 21,232 (4.9%) | 26,021 (6.2%) |
| $2,500 to $4,999 | 12,388 (2.8%) | 18,489 (4.4%) |
| $5,000 to $7,499 | 14,831 (3.4%) | 19,625 (4.7%) |
| $7,500 to $9,999 | 10,450 (2.4%) | 14,527 (3.5%) |
| $10,000 to $12,499 | 14,900 (3.4%) | 17,919 (4.3%) |
| $12,500 to $14,999 | 10,908 (2.5%) | 15,009 (3.6%) |
| $15,000 to $17,499 | 10,856 (2.5%) | 14,640 (3.5%) |
| $17,500 to $19,999 | 9,062 (2.1%) | 12,043 (2.9%) |
| $20,000 to $22,499 | 11,160 (2.6%) | 13,249 (3.2%) |
| $22,500 to $24,999 | 13,455 (3.1%) | 16,062 (3.8%) |
| $25,000 to $29,999 | 24,336 (5.6%) | 28,417 (6.8%) |
| $30,000 to $34,999 | 25,654 (5.9%) | 27,067 (6.5%) |
| $35,000 to $39,999 | 21,282 (4.9%) | 24,010 (5.8%) |
| $40,000 to $44,999 | 21,712 (5.0%) | 20,680 (5.0%) |
| $45,000 to $49,999 | 21,476 (4.9%) | 20,533 (4.9%) |
| $50,000 to $54,999 | 16,669 (3.8%) | 15,897 (3.8%) |
| $55,000 to $64,999 | 32,252 (7.4%) | 29,181 (7.0%) |
| $65,000 to $74,999 | 26,300 (6.0%) | 21,475 (5.1%) |
| $75,000 to $99,999 | 45,914 (10.5%) | 33,597 (8.1%) |
| $100,000+ | 71,233 (16.3%) | 28,811 (6.9%) |
| Total | 436,070 (100.0%) | 417,252 (100.0%) |
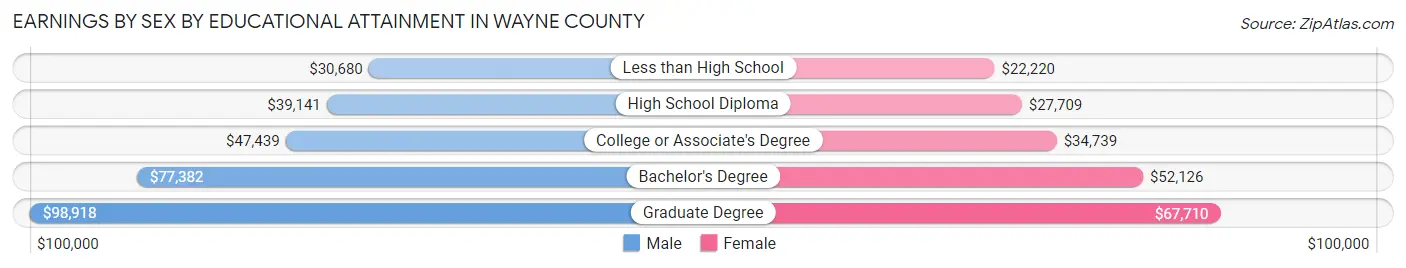
Earnings by Sex by Educational Attainment in Wayne County
Average earnings in Wayne County are $50,185 for men and $37,449 for women, a difference of 25.4%. Men with an educational attainment of graduate degree enjoy the highest average annual earnings of $98,918, while those with less than high school education earn the least with $30,680. Women with an educational attainment of graduate degree earn the most with the average annual earnings of $67,710, while those with less than high school education have the smallest earnings of $22,220.
| Educational Attainment | Male Income | Female Income |
| Less than High School | $30,680 | $22,220 |
| High School Diploma | $39,141 | $27,709 |
| College or Associate's Degree | $47,439 | $34,739 |
| Bachelor's Degree | $77,382 | $52,126 |
| Graduate Degree | $98,918 | $67,710 |
| Total | $50,185 | $37,449 |
Family Income in Wayne County
Family Income Brackets in Wayne County
According to the Wayne County family income data, there are 73,680 families falling into the $100,000 to $149,999 income range, which is the most common income bracket and makes up 17.9% of all families. Conversely, the $10,000 to $14,999 income bracket is the least frequent group with only 13,583 families (3.3%) belonging to this category.
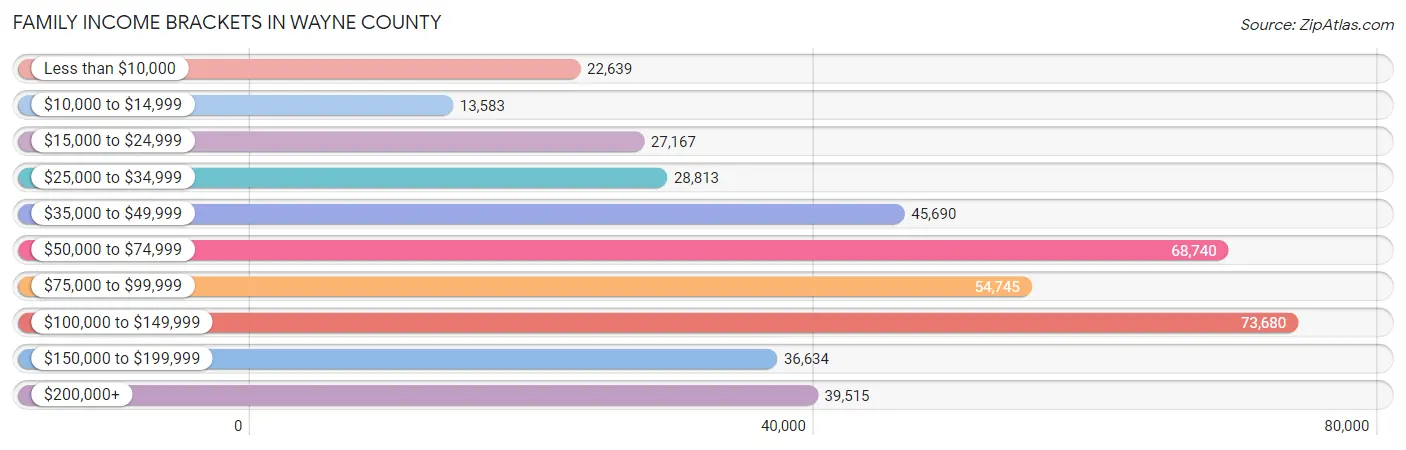
| Income Bracket | # Families | % Families |
| Less than $10,000 | 22,639 | 5.5% |
| $10,000 to $14,999 | 13,583 | 3.3% |
| $15,000 to $24,999 | 27,167 | 6.6% |
| $25,000 to $34,999 | 28,813 | 7.0% |
| $35,000 to $49,999 | 45,690 | 11.1% |
| $50,000 to $74,999 | 68,740 | 16.7% |
| $75,000 to $99,999 | 54,745 | 13.3% |
| $100,000 to $149,999 | 73,680 | 17.9% |
| $150,000 to $199,999 | 36,634 | 8.9% |
| $200,000+ | 39,515 | 9.6% |
Family Income by Famaliy Size in Wayne County
4-person families (71,578 | 17.4%) account for the highest median family income in Wayne County with $97,555 per family, while 2-person families (186,137 | 45.2%) have the highest median income of $33,498 per family member.
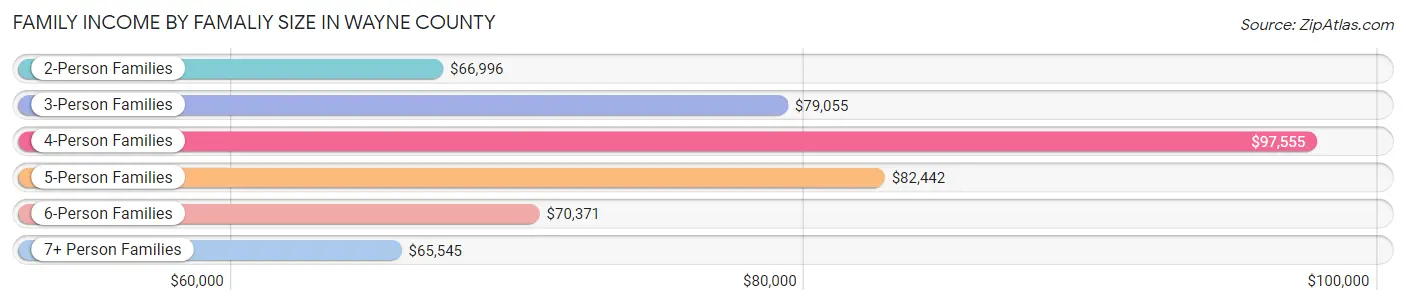
| Income Bracket | # Families | Median Income |
| 2-Person Families | 186,137 (45.2%) | $66,996 |
| 3-Person Families | 94,824 (23.0%) | $79,055 |
| 4-Person Families | 71,578 (17.4%) | $97,555 |
| 5-Person Families | 33,481 (8.1%) | $82,442 |
| 6-Person Families | 14,760 (3.6%) | $70,371 |
| 7+ Person Families | 10,839 (2.6%) | $65,545 |
| Total | 411,619 (100.0%) | $74,650 |
Family Income by Number of Earners in Wayne County
The median family income in Wayne County is $74,650, with families comprising 3+ earners (47,394) having the highest median family income of $140,750, while families with no earners (70,559) have the lowest median family income of $39,201, accounting for 11.5% and 17.1% of families, respectively.
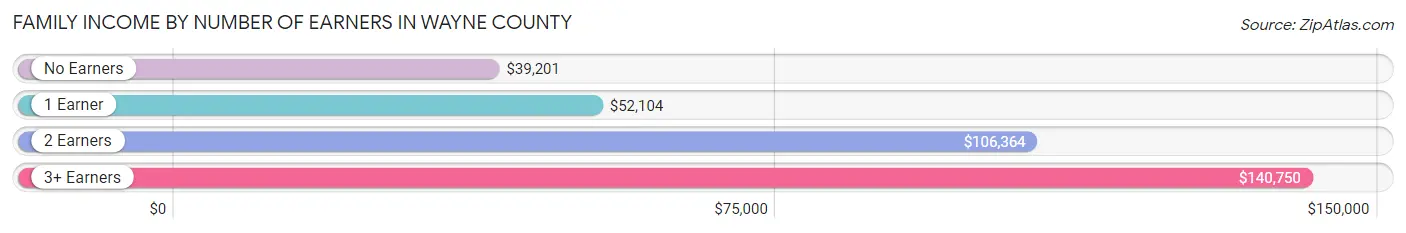
| Number of Earners | # Families | Median Income |
| No Earners | 70,559 (17.1%) | $39,201 |
| 1 Earner | 150,476 (36.6%) | $52,104 |
| 2 Earners | 143,190 (34.8%) | $106,364 |
| 3+ Earners | 47,394 (11.5%) | $140,750 |
| Total | 411,619 (100.0%) | $74,650 |
Household Income in Wayne County
Household Income Brackets in Wayne County
With 112,908 households falling in the category, the $50,000 to $74,999 income range is the most frequent in Wayne County, accounting for 16.4% of all households. In contrast, only 41,996 households (6.1%) fall into the $10,000 to $14,999 income bracket, making it the least populous group.
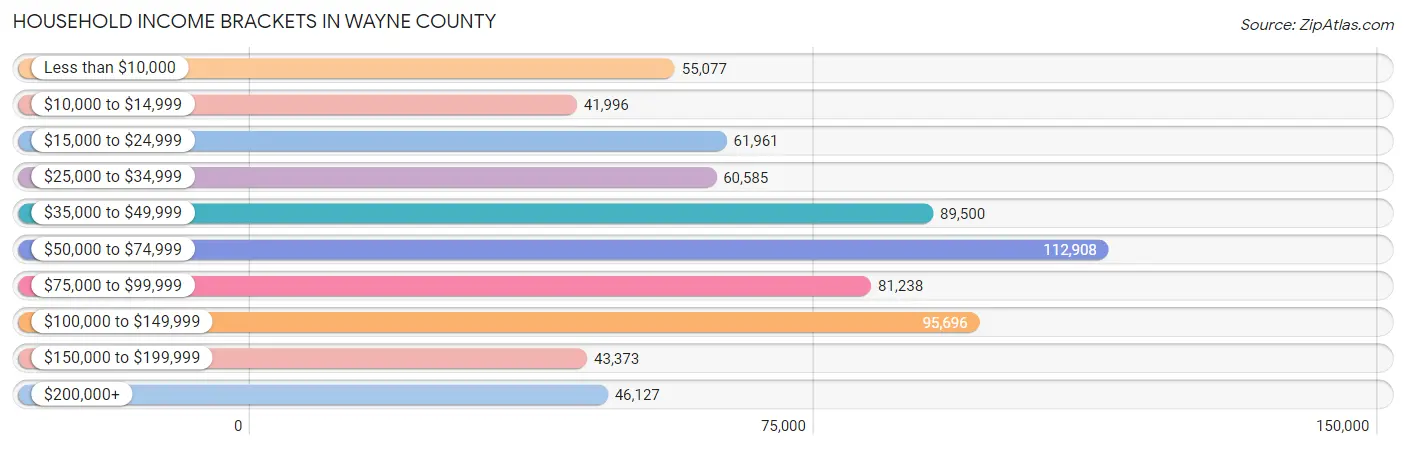
| Income Bracket | # Households | % Households |
| Less than $10,000 | 55,077 | 8.0% |
| $10,000 to $14,999 | 41,996 | 6.1% |
| $15,000 to $24,999 | 61,961 | 9.0% |
| $25,000 to $34,999 | 60,585 | 8.8% |
| $35,000 to $49,999 | 89,500 | 13.0% |
| $50,000 to $74,999 | 112,908 | 16.4% |
| $75,000 to $99,999 | 81,238 | 11.8% |
| $100,000 to $149,999 | 95,696 | 13.9% |
| $150,000 to $199,999 | 43,373 | 6.3% |
| $200,000+ | 46,127 | 6.7% |
Household Income by Householder Age in Wayne County
The median household income in Wayne County is $57,223, with the highest median household income of $68,453 found in the 45 to 64 years age bracket for the primary householder. A total of 265,906 households (38.6%) fall into this category. Meanwhile, the 15 to 24 years age bracket for the primary householder has the lowest median household income of $34,228, with 18,343 households (2.7%) in this group.
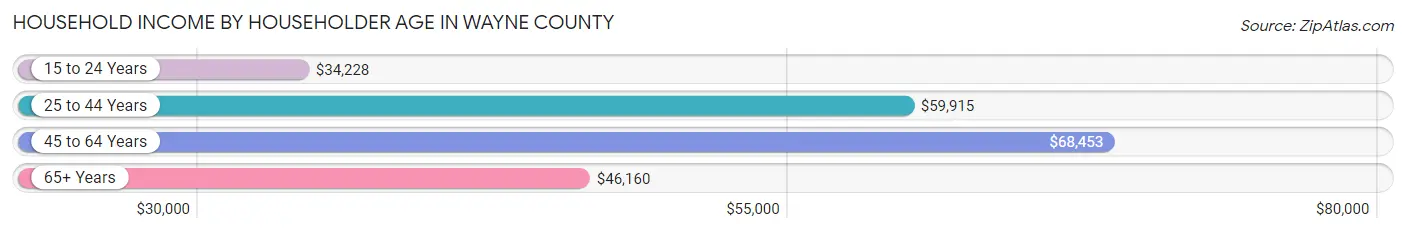
| Income Bracket | # Households | Median Income |
| 15 to 24 Years | 18,343 (2.7%) | $34,228 |
| 25 to 44 Years | 218,600 (31.8%) | $59,915 |
| 45 to 64 Years | 265,906 (38.6%) | $68,453 |
| 65+ Years | 185,612 (27.0%) | $46,160 |
| Total | 688,461 (100.0%) | $57,223 |
Poverty in Wayne County
Income Below Poverty by Sex and Age in Wayne County
With 18.9% poverty level for males and 21.4% for females among the residents of Wayne County, under 5 year old males and under 5 year old females are the most vulnerable to poverty, with 19,160 males (33.4%) and 17,658 females (32.2%) in their respective age groups living below the poverty level.
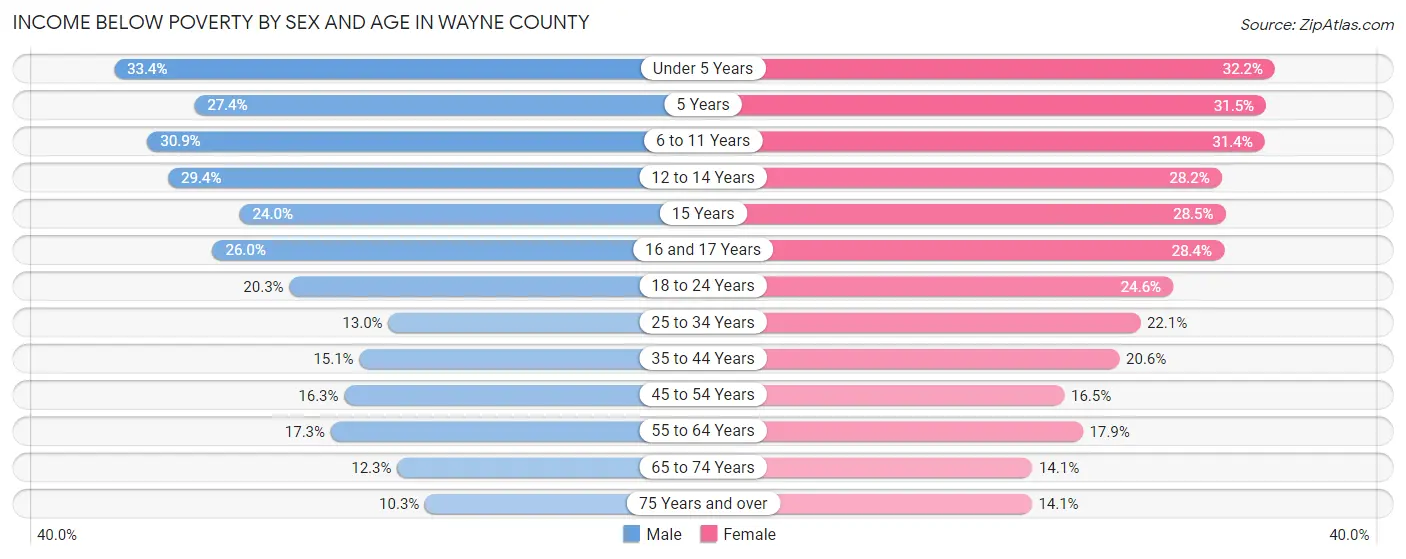
| Age Bracket | Male | Female |
| Under 5 Years | 19,160 (33.4%) | 17,658 (32.2%) |
| 5 Years | 3,259 (27.4%) | 3,681 (31.5%) |
| 6 to 11 Years | 21,066 (30.9%) | 20,640 (31.4%) |
| 12 to 14 Years | 11,255 (29.3%) | 9,847 (28.2%) |
| 15 Years | 3,214 (24.0%) | 3,345 (28.5%) |
| 16 and 17 Years | 6,052 (26.0%) | 6,664 (28.4%) |
| 18 to 24 Years | 15,636 (20.3%) | 18,605 (24.6%) |
| 25 to 34 Years | 16,189 (13.0%) | 28,655 (22.1%) |
| 35 to 44 Years | 15,310 (15.1%) | 22,453 (20.6%) |
| 45 to 54 Years | 17,672 (16.3%) | 18,931 (16.5%) |
| 55 to 64 Years | 19,364 (17.3%) | 21,311 (17.9%) |
| 65 to 74 Years | 9,353 (12.3%) | 12,928 (14.1%) |
| 75 Years and over | 4,377 (10.3%) | 9,232 (14.1%) |
| Total | 161,907 (18.9%) | 193,950 (21.4%) |
Income Above Poverty by Sex and Age in Wayne County
According to the poverty statistics in Wayne County, males aged 75 years and over and females aged 75 years and over are the age groups that are most secure financially, with 89.7% of males and 85.9% of females in these age groups living above the poverty line.
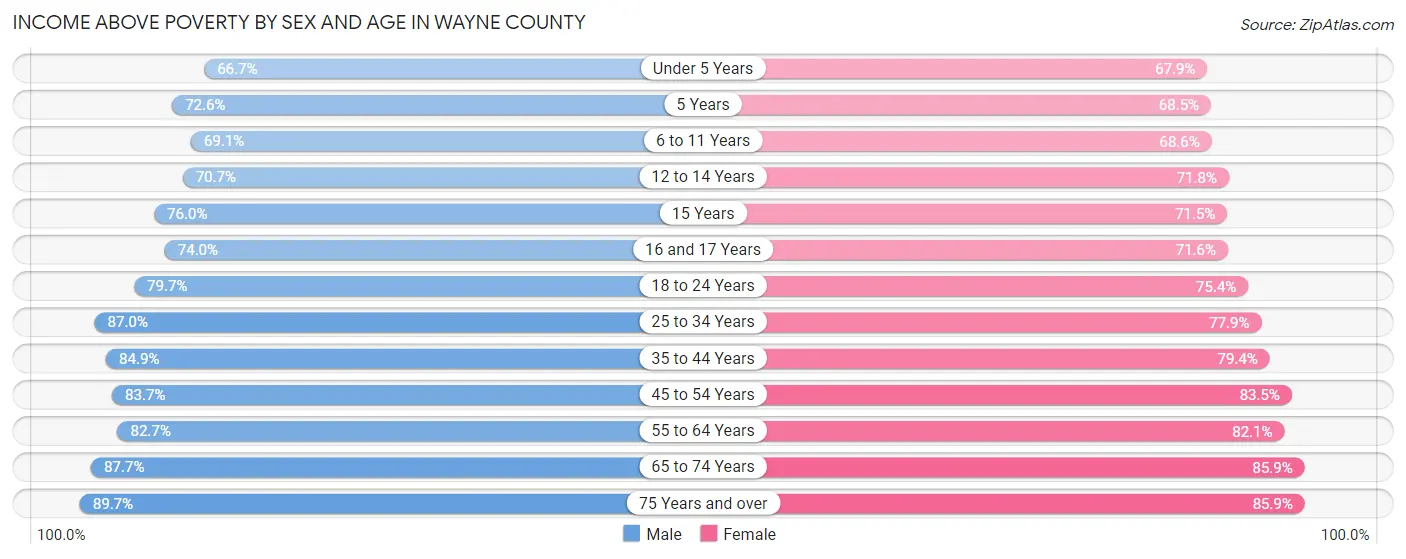
| Age Bracket | Male | Female |
| Under 5 Years | 38,290 (66.6%) | 37,270 (67.8%) |
| 5 Years | 8,633 (72.6%) | 8,008 (68.5%) |
| 6 to 11 Years | 47,152 (69.1%) | 45,140 (68.6%) |
| 12 to 14 Years | 27,099 (70.7%) | 25,082 (71.8%) |
| 15 Years | 10,159 (76.0%) | 8,405 (71.5%) |
| 16 and 17 Years | 17,189 (74.0%) | 16,832 (71.6%) |
| 18 to 24 Years | 61,255 (79.7%) | 57,081 (75.4%) |
| 25 to 34 Years | 108,479 (87.0%) | 100,761 (77.9%) |
| 35 to 44 Years | 85,808 (84.9%) | 86,592 (79.4%) |
| 45 to 54 Years | 91,027 (83.7%) | 95,819 (83.5%) |
| 55 to 64 Years | 92,850 (82.7%) | 97,962 (82.1%) |
| 65 to 74 Years | 66,498 (87.7%) | 78,643 (85.9%) |
| 75 Years and over | 38,284 (89.7%) | 56,317 (85.9%) |
| Total | 692,723 (81.1%) | 713,912 (78.6%) |
Income Below Poverty Among Married-Couple Families in Wayne County
The poverty statistics for married-couple families in Wayne County show that 7.6% or 19,085 of the total 250,511 families live below the poverty line. Families with 5 or more children have the highest poverty rate of 44.4%, comprising of 1,218 families. On the other hand, families with no children have the lowest poverty rate of 4.3%, which includes 6,210 families.
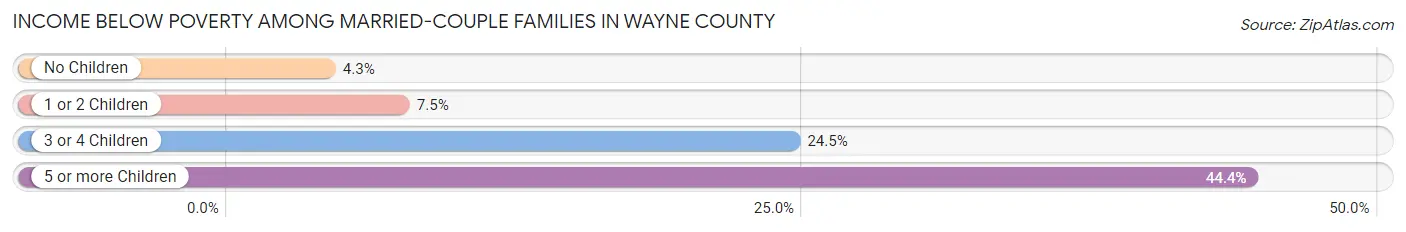
| Children | Above Poverty | Below Poverty |
| No Children | 139,489 (95.7%) | 6,210 (4.3%) |
| 1 or 2 Children | 72,551 (92.5%) | 5,868 (7.5%) |
| 3 or 4 Children | 17,861 (75.5%) | 5,789 (24.5%) |
| 5 or more Children | 1,525 (55.6%) | 1,218 (44.4%) |
| Total | 231,426 (92.4%) | 19,085 (7.6%) |
Income Below Poverty Among Single-Parent Households in Wayne County
According to the poverty data in Wayne County, 17.9% or 6,986 single-father households and 30.1% or 36,770 single-mother households are living below the poverty line. Among single-father households, those with 3 or 4 children have the highest poverty rate, with 1,303 households (50.3%) experiencing poverty. Likewise, among single-mother households, those with 5 or more children have the highest poverty rate, with 1,822 households (75.1%) falling below the poverty line.
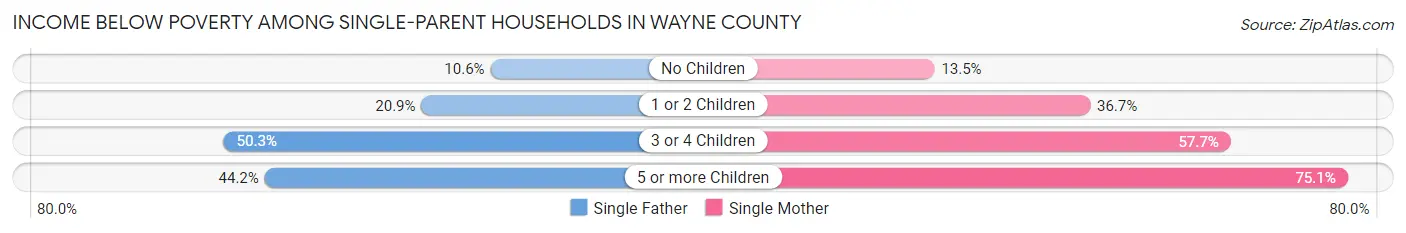
| Children | Single Father | Single Mother |
| No Children | 2,106 (10.6%) | 6,795 (13.5%) |
| 1 or 2 Children | 3,385 (20.9%) | 20,727 (36.7%) |
| 3 or 4 Children | 1,303 (50.3%) | 7,426 (57.7%) |
| 5 or more Children | 192 (44.2%) | 1,822 (75.1%) |
| Total | 6,986 (17.9%) | 36,770 (30.1%) |
Income Below Poverty Among Married-Couple vs Single-Parent Households in Wayne County
The poverty data for Wayne County shows that 19,085 of the married-couple family households (7.6%) and 43,756 of the single-parent households (27.2%) are living below the poverty level. Within the married-couple family households, those with 5 or more children have the highest poverty rate, with 1,218 households (44.4%) falling below the poverty line. Among the single-parent households, those with 5 or more children have the highest poverty rate, with 2,014 household (70.4%) living below poverty.
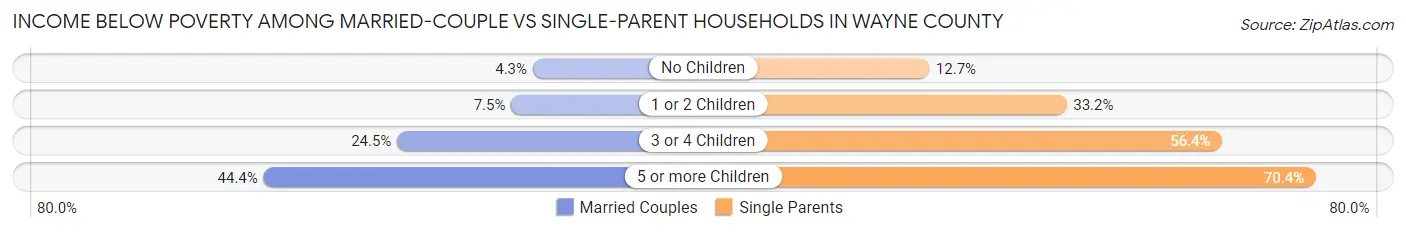
| Children | Married-Couple Families | Single-Parent Households |
| No Children | 6,210 (4.3%) | 8,901 (12.7%) |
| 1 or 2 Children | 5,868 (7.5%) | 24,112 (33.2%) |
| 3 or 4 Children | 5,789 (24.5%) | 8,729 (56.4%) |
| 5 or more Children | 1,218 (44.4%) | 2,014 (70.4%) |
| Total | 19,085 (7.6%) | 43,756 (27.2%) |
Race in Wayne County
The most populous races in Wayne County are White / Caucasian (905,956 | 50.8%), Black / African American (670,722 | 37.7%), and Hispanic or Latino (112,699 | 6.3%).
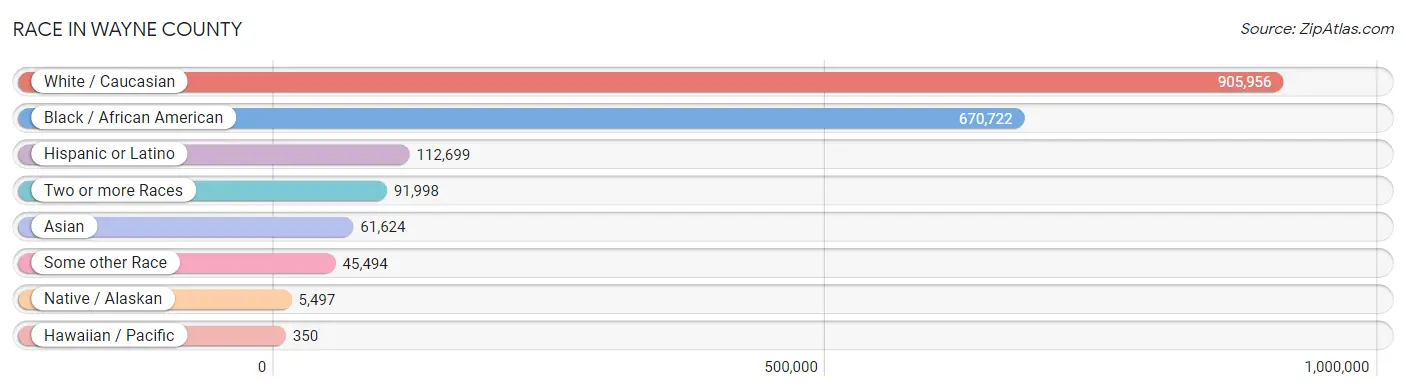
| Race | # Population | % Population |
| Asian | 61,624 | 3.5% |
| Black / African American | 670,722 | 37.7% |
| Hawaiian / Pacific | 350 | 0.0% |
| Hispanic or Latino | 112,699 | 6.3% |
| Native / Alaskan | 5,497 | 0.3% |
| White / Caucasian | 905,956 | 50.8% |
| Two or more Races | 91,998 | 5.2% |
| Some other Race | 45,494 | 2.5% |
| Total | 1,781,641 | 100.0% |
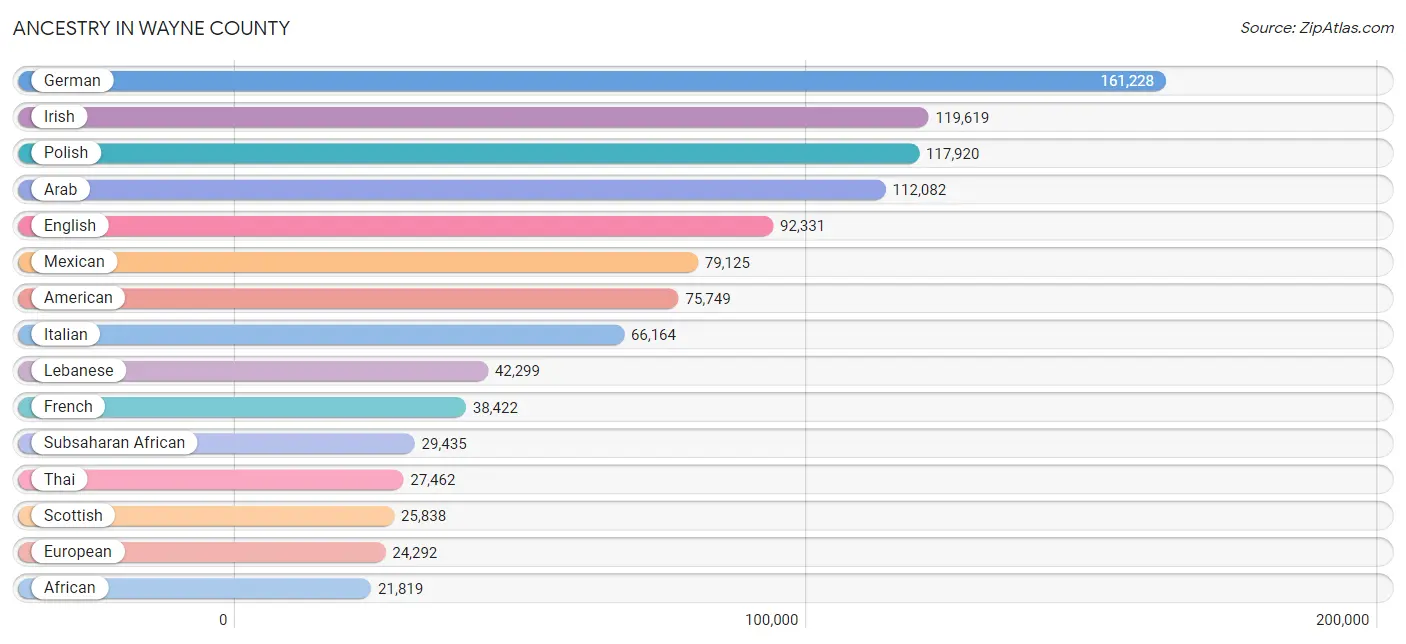
Ancestry in Wayne County
The most populous ancestries reported in Wayne County are German (161,228 | 9.0%), Irish (119,619 | 6.7%), Polish (117,920 | 6.6%), Arab (112,082 | 6.3%), and English (92,331 | 5.2%), together accounting for 33.9% of all Wayne County residents.
| Ancestry | # Population | % Population |
| Afghan | 307 | 0.0% |
| African | 21,819 | 1.2% |
| Alaskan Athabascan | 5 | 0.0% |
| Albanian | 4,933 | 0.3% |
| Alsatian | 14 | 0.0% |
| American | 75,749 | 4.3% |
| Apache | 157 | 0.0% |
| Arab | 112,082 | 6.3% |
| Argentinean | 329 | 0.0% |
| Armenian | 2,771 | 0.2% |
| Assyrian / Chaldean / Syriac | 1,066 | 0.1% |
| Australian | 466 | 0.0% |
| Austrian | 2,464 | 0.1% |
| Bahamian | 472 | 0.0% |
| Bangladeshi | 427 | 0.0% |
| Barbadian | 66 | 0.0% |
| Basque | 45 | 0.0% |
| Belgian | 3,533 | 0.2% |
| Belizean | 165 | 0.0% |
| Bermudan | 38 | 0.0% |
| Bhutanese | 2,809 | 0.2% |
| Blackfeet | 1,639 | 0.1% |
| Bolivian | 4 | 0.0% |
| Brazilian | 806 | 0.1% |
| British | 5,186 | 0.3% |
| British West Indian | 126 | 0.0% |
| Bulgarian | 479 | 0.0% |
| Burmese | 4,250 | 0.2% |
| Cajun | 16 | 0.0% |
| Cambodian | 31 | 0.0% |
| Canadian | 5,096 | 0.3% |
| Cape Verdean | 42 | 0.0% |
| Carpatho Rusyn | 46 | 0.0% |
| Celtic | 108 | 0.0% |
| Central American | 5,506 | 0.3% |
| Central American Indian | 439 | 0.0% |
| Cherokee | 4,566 | 0.3% |
| Cheyenne | 22 | 0.0% |
| Chickasaw | 4 | 0.0% |
| Chilean | 134 | 0.0% |
| Chinese | 13 | 0.0% |
| Chippewa | 2,558 | 0.1% |
| Choctaw | 502 | 0.0% |
| Colombian | 1,105 | 0.1% |
| Colville | 25 | 0.0% |
| Costa Rican | 89 | 0.0% |
| Cree | 41 | 0.0% |
| Creek | 311 | 0.0% |
| Croatian | 2,350 | 0.1% |
| Crow | 54 | 0.0% |
| Cuban | 2,472 | 0.1% |
| Cypriot | 17 | 0.0% |
| Czech | 2,873 | 0.2% |
| Czechoslovakian | 1,406 | 0.1% |
| Danish | 2,286 | 0.1% |
| Delaware | 46 | 0.0% |
| Dominican | 2,343 | 0.1% |
| Dutch | 11,962 | 0.7% |
| Dutch West Indian | 76 | 0.0% |
| Eastern European | 3,047 | 0.2% |
| Ecuadorian | 548 | 0.0% |
| Egyptian | 1,035 | 0.1% |
| English | 92,331 | 5.2% |
| Estonian | 60 | 0.0% |
| Ethiopian | 721 | 0.0% |
| European | 24,292 | 1.4% |
| Filipino | 259 | 0.0% |
| Finnish | 7,056 | 0.4% |
| French | 38,422 | 2.2% |
| French American Indian | 394 | 0.0% |
| French Canadian | 16,975 | 0.9% |
| German | 161,228 | 9.0% |
| German Russian | 13 | 0.0% |
| Ghanaian | 274 | 0.0% |
| Greek | 7,962 | 0.4% |
| Guamanian / Chamorro | 249 | 0.0% |
| Guatemalan | 1,486 | 0.1% |
| Guyanese | 163 | 0.0% |
| Haitian | 1,098 | 0.1% |
| Honduran | 2,123 | 0.1% |
| Hopi | 15 | 0.0% |
| Houma | 15 | 0.0% |
| Hungarian | 18,841 | 1.1% |
| Icelander | 122 | 0.0% |
| Indian (Asian) | 8,876 | 0.5% |
| Indonesian | 131 | 0.0% |
| Inupiat | 37 | 0.0% |
| Iranian | 760 | 0.0% |
| Iraqi | 11,665 | 0.6% |
| Irish | 119,619 | 6.7% |
| Iroquois | 619 | 0.0% |
| Israeli | 261 | 0.0% |
| Italian | 66,164 | 3.7% |
| Jamaican | 2,330 | 0.1% |
| Japanese | 333 | 0.0% |
| Jordanian | 2,209 | 0.1% |
| Kenyan | 77 | 0.0% |
| Kiowa | 17 | 0.0% |
| Korean | 8,206 | 0.5% |
| Laotian | 106 | 0.0% |
| Latvian | 306 | 0.0% |
| Lebanese | 42,299 | 2.4% |
| Liberian | 243 | 0.0% |
| Lithuanian | 4,778 | 0.3% |
| Lumbee | 217 | 0.0% |
| Luxembourger | 131 | 0.0% |
| Macedonian | 2,735 | 0.2% |
| Malaysian | 248 | 0.0% |
| Maltese | 5,475 | 0.3% |
| Menominee | 175 | 0.0% |
| Mexican | 79,125 | 4.4% |
| Mexican American Indian | 1,480 | 0.1% |
| Mongolian | 131 | 0.0% |
| Moroccan | 1,509 | 0.1% |
| Native Hawaiian | 776 | 0.0% |
| Navajo | 373 | 0.0% |
| New Zealander | 40 | 0.0% |
| Nicaraguan | 131 | 0.0% |
| Nigerian | 3,945 | 0.2% |
| Northern European | 858 | 0.1% |
| Norwegian | 6,018 | 0.3% |
| Osage | 20 | 0.0% |
| Ottawa | 354 | 0.0% |
| Pakistani | 412 | 0.0% |
| Palestinian | 3,091 | 0.2% |
| Panamanian | 373 | 0.0% |
| Paraguayan | 15 | 0.0% |
| Pennsylvania German | 134 | 0.0% |
| Peruvian | 501 | 0.0% |
| Polish | 117,920 | 6.6% |
| Portuguese | 876 | 0.1% |
| Potawatomi | 437 | 0.0% |
| Pueblo | 46 | 0.0% |
| Puerto Rican | 12,923 | 0.7% |
| Romanian | 4,591 | 0.3% |
| Russian | 6,093 | 0.3% |
| Salvadoran | 1,304 | 0.1% |
| Samoan | 333 | 0.0% |
| Scandinavian | 2,048 | 0.1% |
| Scotch-Irish | 9,237 | 0.5% |
| Scottish | 25,838 | 1.5% |
| Seminole | 60 | 0.0% |
| Senegalese | 182 | 0.0% |
| Serbian | 1,415 | 0.1% |
| Sierra Leonean | 65 | 0.0% |
| Sioux | 196 | 0.0% |
| Slavic | 730 | 0.0% |
| Slovak | 3,674 | 0.2% |
| Slovene | 640 | 0.0% |
| Somali | 133 | 0.0% |
| South African | 252 | 0.0% |
| South American | 3,424 | 0.2% |
| South American Indian | 75 | 0.0% |
| Soviet Union | 11 | 0.0% |
| Spaniard | 1,269 | 0.1% |
| Spanish | 2,573 | 0.1% |
| Spanish American | 12 | 0.0% |
| Spanish American Indian | 12 | 0.0% |
| Sri Lankan | 3,385 | 0.2% |
| Subsaharan African | 29,435 | 1.7% |
| Sudanese | 395 | 0.0% |
| Swedish | 8,513 | 0.5% |
| Swiss | 1,181 | 0.1% |
| Syrian | 3,154 | 0.2% |
| Thai | 27,462 | 1.5% |
| Tongan | 23 | 0.0% |
| Trinidadian and Tobagonian | 131 | 0.0% |
| Turkish | 447 | 0.0% |
| U.S. Virgin Islander | 60 | 0.0% |
| Ukrainian | 6,152 | 0.4% |
| Uruguayan | 89 | 0.0% |
| Venezuelan | 684 | 0.0% |
| Vietnamese | 8,448 | 0.5% |
| Welsh | 4,665 | 0.3% |
| West Indian | 302 | 0.0% |
| Yakama | 32 | 0.0% |
| Yaqui | 32 | 0.0% |
| Yugoslavian | 1,708 | 0.1% |
| Zimbabwean | 16 | 0.0% | View All 179 Rows |
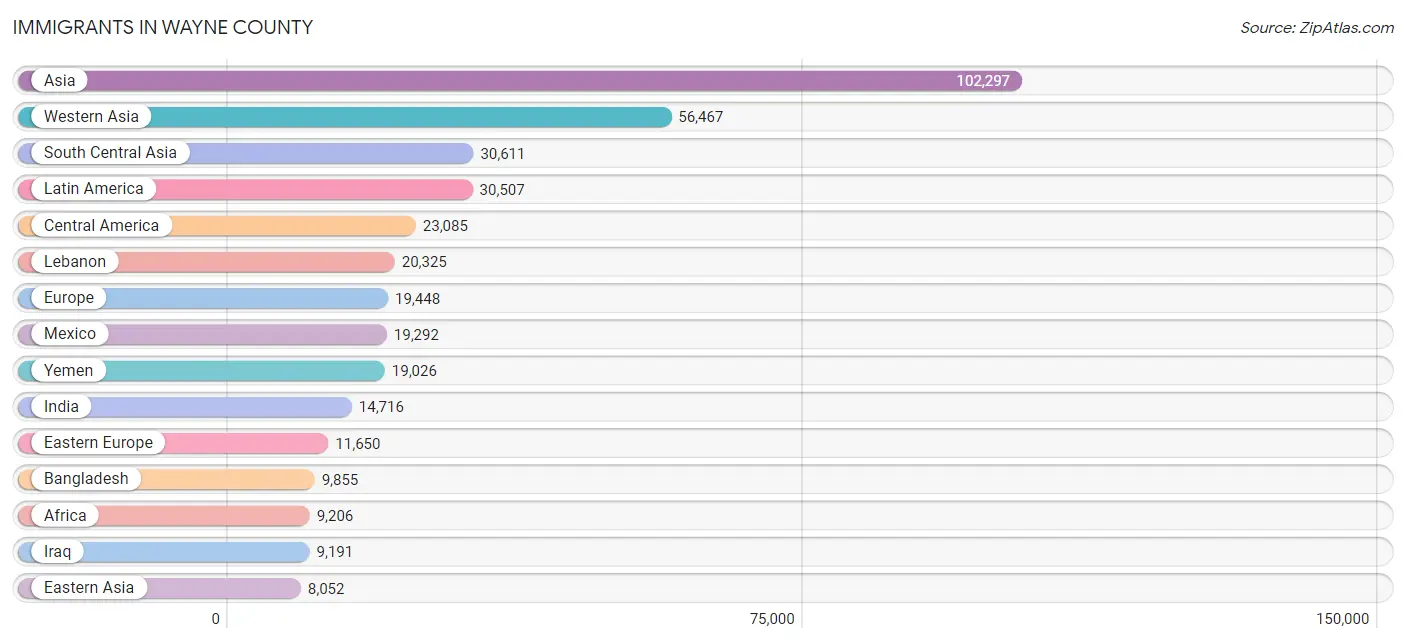
Immigrants in Wayne County
The most numerous immigrant groups reported in Wayne County came from Asia (102,297 | 5.7%), Western Asia (56,467 | 3.2%), South Central Asia (30,611 | 1.7%), Latin America (30,507 | 1.7%), and Central America (23,085 | 1.3%), together accounting for 13.6% of all Wayne County residents.
| Immigration Origin | # Population | % Population |
| Afghanistan | 442 | 0.0% |
| Africa | 9,206 | 0.5% |
| Albania | 2,405 | 0.1% |
| Argentina | 119 | 0.0% |
| Armenia | 54 | 0.0% |
| Asia | 102,297 | 5.7% |
| Australia | 324 | 0.0% |
| Austria | 124 | 0.0% |
| Bahamas | 201 | 0.0% |
| Bangladesh | 9,855 | 0.5% |
| Barbados | 8 | 0.0% |
| Belarus | 47 | 0.0% |
| Belgium | 32 | 0.0% |
| Belize | 130 | 0.0% |
| Bolivia | 4 | 0.0% |
| Bosnia and Herzegovina | 644 | 0.0% |
| Brazil | 1,420 | 0.1% |
| Bulgaria | 237 | 0.0% |
| Cambodia | 241 | 0.0% |
| Cameroon | 255 | 0.0% |
| Canada | 6,318 | 0.4% |
| Caribbean | 4,039 | 0.2% |
| Central America | 23,085 | 1.3% |
| Chile | 139 | 0.0% |
| China | 5,023 | 0.3% |
| Colombia | 824 | 0.1% |
| Congo | 7 | 0.0% |
| Costa Rica | 45 | 0.0% |
| Croatia | 144 | 0.0% |
| Cuba | 795 | 0.0% |
| Czechoslovakia | 278 | 0.0% |
| Denmark | 63 | 0.0% |
| Dominican Republic | 1,078 | 0.1% |
| Eastern Africa | 1,277 | 0.1% |
| Eastern Asia | 8,052 | 0.4% |
| Eastern Europe | 11,650 | 0.6% |
| Ecuador | 175 | 0.0% |
| Egypt | 598 | 0.0% |
| El Salvador | 1,165 | 0.1% |
| England | 711 | 0.0% |
| Eritrea | 222 | 0.0% |
| Ethiopia | 345 | 0.0% |
| Europe | 19,448 | 1.1% |
| Fiji | 15 | 0.0% |
| France | 285 | 0.0% |
| Germany | 1,883 | 0.1% |
| Ghana | 172 | 0.0% |
| Greece | 802 | 0.1% |
| Grenada | 6 | 0.0% |
| Guatemala | 897 | 0.1% |
| Guyana | 20 | 0.0% |
| Haiti | 228 | 0.0% |
| Honduras | 1,365 | 0.1% |
| Hong Kong | 282 | 0.0% |
| Hungary | 141 | 0.0% |
| India | 14,716 | 0.8% |
| Indonesia | 80 | 0.0% |
| Iran | 981 | 0.1% |
| Iraq | 9,191 | 0.5% |
| Ireland | 241 | 0.0% |
| Israel | 299 | 0.0% |
| Italy | 1,501 | 0.1% |
| Jamaica | 1,268 | 0.1% |
| Japan | 959 | 0.1% |
| Jordan | 2,769 | 0.2% |
| Kazakhstan | 17 | 0.0% |
| Kenya | 240 | 0.0% |
| Korea | 2,063 | 0.1% |
| Kuwait | 711 | 0.0% |
| Laos | 96 | 0.0% |
| Latin America | 30,507 | 1.7% |
| Latvia | 45 | 0.0% |
| Lebanon | 20,325 | 1.1% |
| Liberia | 384 | 0.0% |
| Lithuania | 264 | 0.0% |
| Malaysia | 130 | 0.0% |
| Mexico | 19,292 | 1.1% |
| Middle Africa | 501 | 0.0% |
| Moldova | 19 | 0.0% |
| Morocco | 687 | 0.0% |
| Nepal | 221 | 0.0% |
| Netherlands | 139 | 0.0% |
| Nicaragua | 45 | 0.0% |
| Nigeria | 2,380 | 0.1% |
| North Macedonia | 738 | 0.0% |
| Northern Africa | 2,881 | 0.2% |
| Northern Europe | 2,114 | 0.1% |
| Norway | 21 | 0.0% |
| Oceania | 466 | 0.0% |
| Pakistan | 3,981 | 0.2% |
| Panama | 121 | 0.0% |
| Peru | 326 | 0.0% |
| Philippines | 3,678 | 0.2% |
| Poland | 2,060 | 0.1% |
| Portugal | 31 | 0.0% |
| Romania | 2,031 | 0.1% |
| Russia | 675 | 0.0% |
| Saudi Arabia | 983 | 0.1% |
| Scotland | 350 | 0.0% |
| Senegal | 200 | 0.0% |
| Serbia | 24 | 0.0% |
| Sierra Leone | 384 | 0.0% |
| Somalia | 39 | 0.0% |
| South Africa | 184 | 0.0% |
| South America | 3,383 | 0.2% |
| South Central Asia | 30,611 | 1.7% |
| South Eastern Asia | 6,158 | 0.4% |
| Southern Europe | 3,035 | 0.2% |
| Spain | 307 | 0.0% |
| Sri Lanka | 139 | 0.0% |
| St. Vincent and the Grenadines | 22 | 0.0% |
| Sudan | 370 | 0.0% |
| Sweden | 25 | 0.0% |
| Switzerland | 70 | 0.0% |
| Syria | 2,162 | 0.1% |
| Taiwan | 631 | 0.0% |
| Thailand | 174 | 0.0% |
| Trinidad and Tobago | 433 | 0.0% |
| Turkey | 253 | 0.0% |
| Uganda | 143 | 0.0% |
| Ukraine | 1,045 | 0.1% |
| Uruguay | 59 | 0.0% |
| Uzbekistan | 259 | 0.0% |
| Venezuela | 265 | 0.0% |
| Vietnam | 1,633 | 0.1% |
| Western Africa | 3,975 | 0.2% |
| Western Asia | 56,467 | 3.2% |
| Western Europe | 2,533 | 0.1% |
| Yemen | 19,026 | 1.1% |
| Zaire | 34 | 0.0% |
| Zimbabwe | 48 | 0.0% | View All 131 Rows |
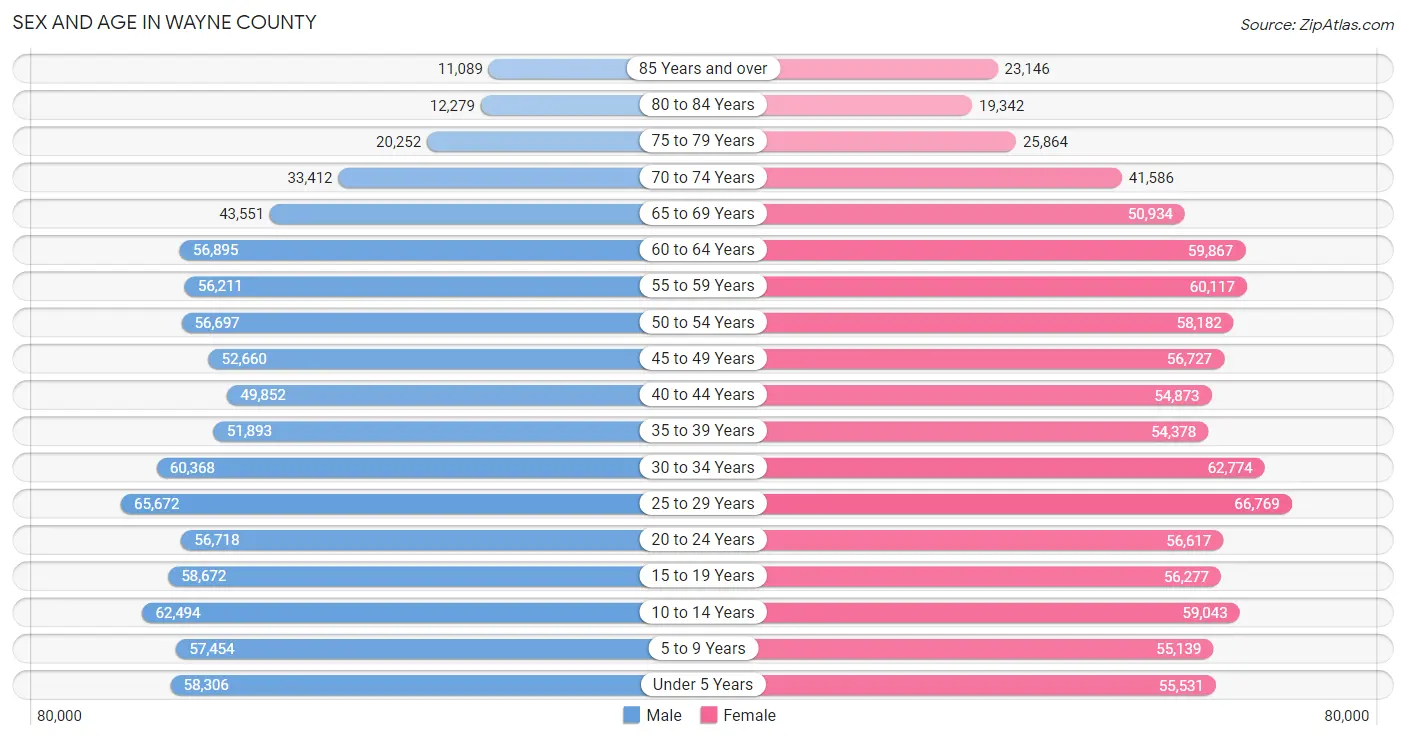
Sex and Age in Wayne County
Sex and Age in Wayne County
The most populous age groups in Wayne County are 25 to 29 Years (65,672 | 7.6%) for men and 25 to 29 Years (66,769 | 7.3%) for women.
| Age Bracket | Male | Female |
| Under 5 Years | 58,306 (6.7%) | 55,531 (6.0%) |
| 5 to 9 Years | 57,454 (6.7%) | 55,139 (6.0%) |
| 10 to 14 Years | 62,494 (7.2%) | 59,043 (6.4%) |
| 15 to 19 Years | 58,672 (6.8%) | 56,277 (6.1%) |
| 20 to 24 Years | 56,718 (6.6%) | 56,617 (6.2%) |
| 25 to 29 Years | 65,672 (7.6%) | 66,769 (7.3%) |
| 30 to 34 Years | 60,368 (7.0%) | 62,774 (6.8%) |
| 35 to 39 Years | 51,893 (6.0%) | 54,378 (5.9%) |
| 40 to 44 Years | 49,852 (5.8%) | 54,873 (6.0%) |
| 45 to 49 Years | 52,660 (6.1%) | 56,727 (6.2%) |
| 50 to 54 Years | 56,697 (6.6%) | 58,182 (6.3%) |
| 55 to 59 Years | 56,211 (6.5%) | 60,117 (6.6%) |
| 60 to 64 Years | 56,895 (6.6%) | 59,867 (6.5%) |
| 65 to 69 Years | 43,551 (5.0%) | 50,934 (5.6%) |
| 70 to 74 Years | 33,412 (3.9%) | 41,586 (4.5%) |
| 75 to 79 Years | 20,252 (2.3%) | 25,864 (2.8%) |
| 80 to 84 Years | 12,279 (1.4%) | 19,342 (2.1%) |
| 85 Years and over | 11,089 (1.3%) | 23,146 (2.5%) |
| Total | 864,475 (100.0%) | 917,166 (100.0%) |
Families and Households in Wayne County
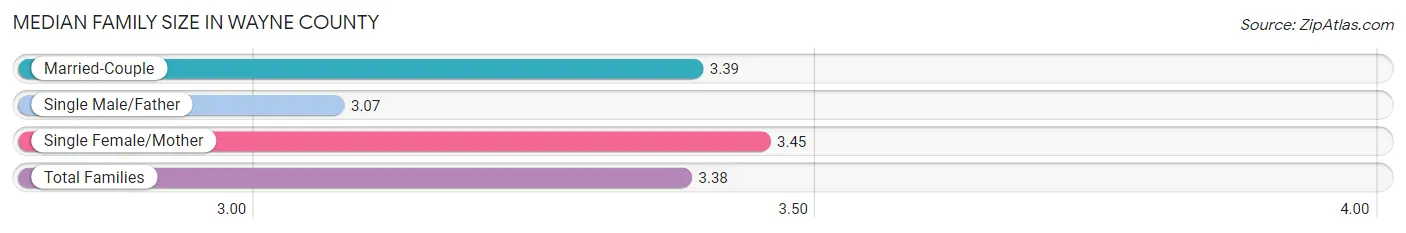
Median Family Size in Wayne County
The median family size in Wayne County is 3.38 persons per family, with single female/mother families (121,984 | 29.6%) accounting for the largest median family size of 3.45 persons per family. On the other hand, single male/father families (39,124 | 9.5%) represent the smallest median family size with 3.07 persons per family.
| Family Type | # Families | Family Size |
| Married-Couple | 250,511 (60.9%) | 3.39 |
| Single Male/Father | 39,124 (9.5%) | 3.07 |
| Single Female/Mother | 121,984 (29.6%) | 3.45 |
| Total Families | 411,619 (100.0%) | 3.38 |
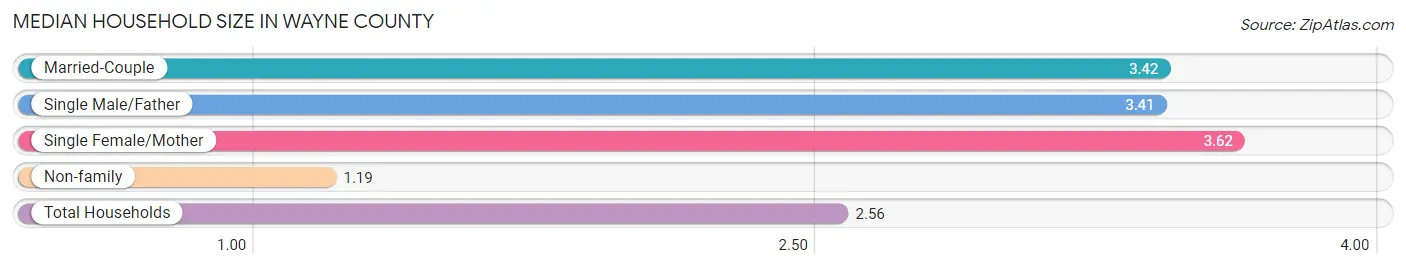
Median Household Size in Wayne County
The median household size in Wayne County is 2.56 persons per household, with single female/mother households (121,984 | 17.7%) accounting for the largest median household size of 3.62 persons per household. non-family households (276,842 | 40.2%) represent the smallest median household size with 1.19 persons per household.
| Household Type | # Households | Household Size |
| Married-Couple | 250,511 (36.4%) | 3.42 |
| Single Male/Father | 39,124 (5.7%) | 3.41 |
| Single Female/Mother | 121,984 (17.7%) | 3.62 |
| Non-family | 276,842 (40.2%) | 1.19 |
| Total Households | 688,461 (100.0%) | 2.56 |
Household Size by Marriage Status in Wayne County
Out of a total of 688,461 households in Wayne County, 411,619 (59.8%) are family households, while 276,842 (40.2%) are nonfamily households. The most numerous type of family households are 2-person households, comprising 173,566, and the most common type of nonfamily households are 1-person households, comprising 238,113.
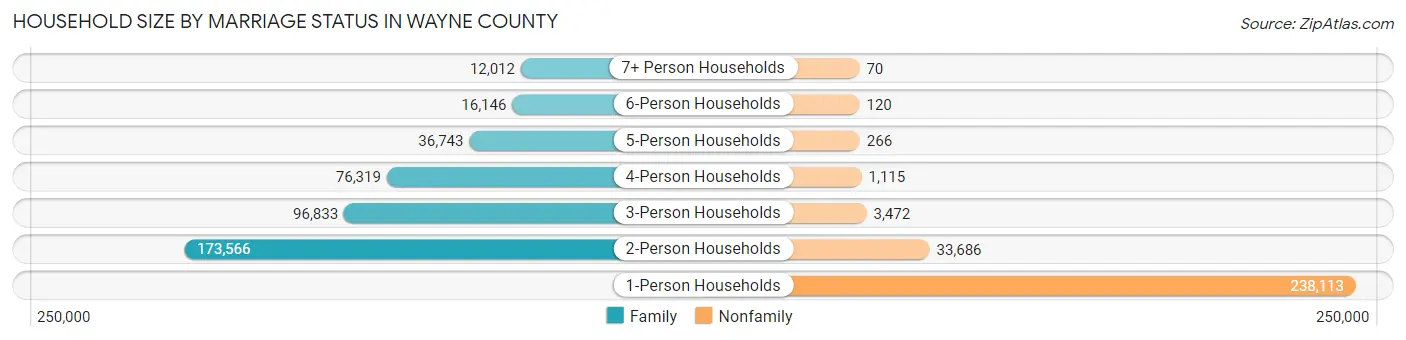
| Household Size | Family Households | Nonfamily Households |
| 1-Person Households | - | 238,113 (34.6%) |
| 2-Person Households | 173,566 (25.2%) | 33,686 (4.9%) |
| 3-Person Households | 96,833 (14.1%) | 3,472 (0.5%) |
| 4-Person Households | 76,319 (11.1%) | 1,115 (0.2%) |
| 5-Person Households | 36,743 (5.3%) | 266 (0.0%) |
| 6-Person Households | 16,146 (2.4%) | 120 (0.0%) |
| 7+ Person Households | 12,012 (1.7%) | 70 (0.0%) |
| Total | 411,619 (59.8%) | 276,842 (40.2%) |
Female Fertility in Wayne County
Fertility by Age in Wayne County
Average fertility rate in Wayne County is 57.0 births per 1,000 women. Women in the age bracket of 20 to 34 years have the highest fertility rate with 94.0 births per 1,000 women. Women in the age bracket of 20 to 34 years acount for 73.3% of all women with births.
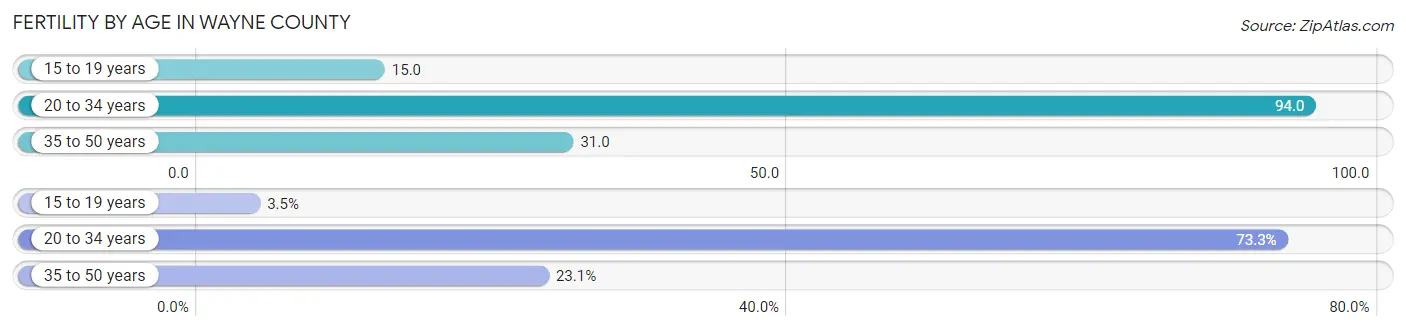
| Age Bracket | Women with Births | Births / 1,000 Women |
| 15 to 19 years | 844 (3.5%) | 15.0 |
| 20 to 34 years | 17,488 (73.3%) | 94.0 |
| 35 to 50 years | 5,519 (23.1%) | 31.0 |
| Total | 23,851 (100.0%) | 57.0 |
Fertility by Age by Marriage Status in Wayne County
51.2% of women with births (23,851) in Wayne County are married. The highest percentage of unmarried women with births falls into 15 to 19 years age bracket with 84.2% of them unmarried at the time of birth, while the lowest percentage of unmarried women with births belong to 35 to 50 years age bracket with 29.7% of them unmarried.
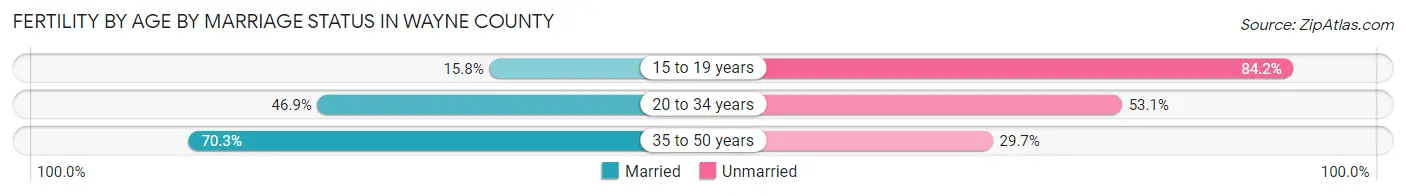
| Age Bracket | Married | Unmarried |
| 15 to 19 years | 133 (15.8%) | 711 (84.2%) |
| 20 to 34 years | 8,202 (46.9%) | 9,286 (53.1%) |
| 35 to 50 years | 3,880 (70.3%) | 1,639 (29.7%) |
| Total | 12,212 (51.2%) | 11,639 (48.8%) |
Fertility by Education in Wayne County
Average fertility rate in Wayne County is 57.0 births per 1,000 women. Women with the education attainment of graduate degree have the highest fertility rate of 66.0 births per 1,000 women, while women with the education attainment of less than high school have the lowest fertility at 41.0 births per 1,000 women. Women with the education attainment of college or associate's degree represent 31.9% of all women with births.
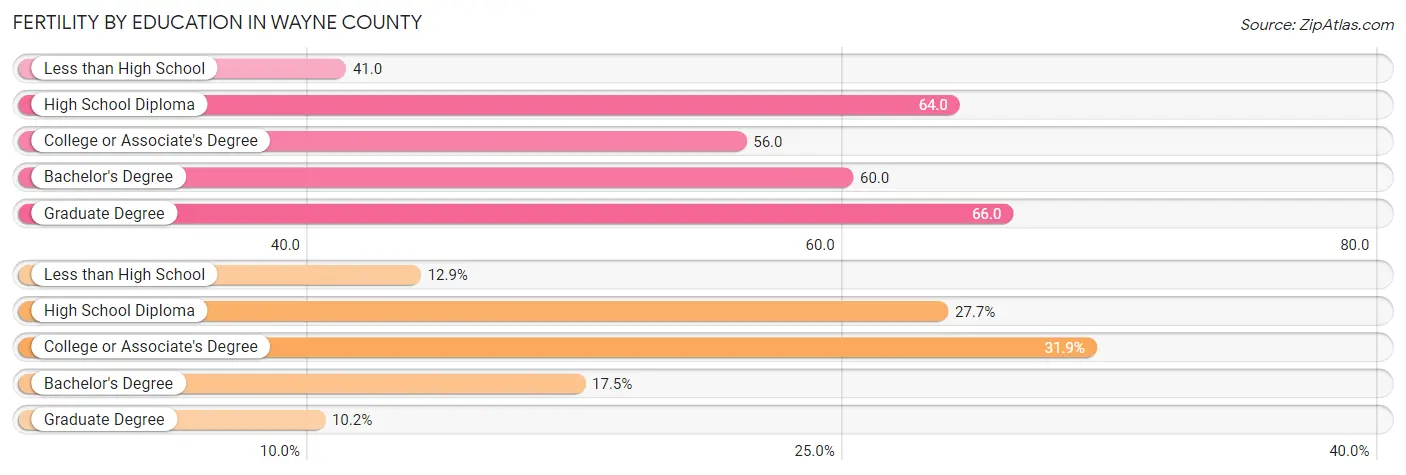
| Educational Attainment | Women with Births | Births / 1,000 Women |
| Less than High School | 3,064 (12.9%) | 41.0 |
| High School Diploma | 6,600 (27.7%) | 64.0 |
| College or Associate's Degree | 7,597 (31.9%) | 56.0 |
| Bachelor's Degree | 4,167 (17.5%) | 60.0 |
| Graduate Degree | 2,423 (10.2%) | 66.0 |
| Total | 23,851 (100.0%) | 57.0 |
Fertility by Education by Marriage Status in Wayne County
48.8% of women with births in Wayne County are unmarried. Women with the educational attainment of graduate degree are most likely to be married with 87.9% of them married at childbirth, while women with the educational attainment of high school diploma are least likely to be married with 67.8% of them unmarried at childbirth.
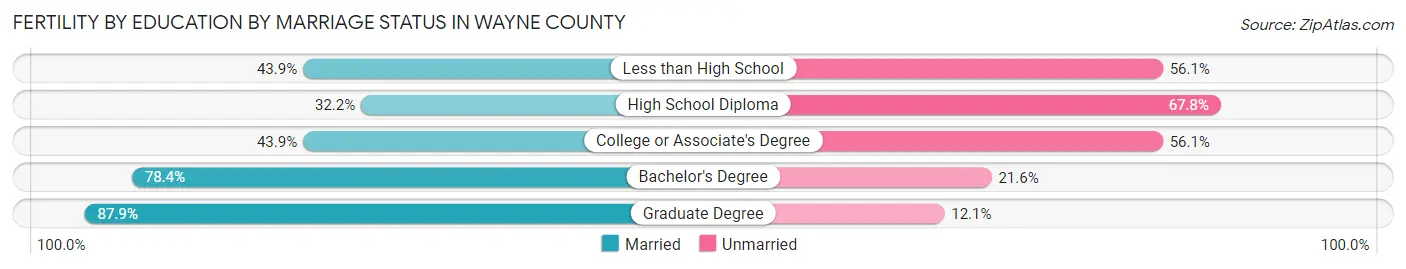
| Educational Attainment | Married | Unmarried |
| Less than High School | 1,345 (43.9%) | 1,719 (56.1%) |
| High School Diploma | 2,125 (32.2%) | 4,475 (67.8%) |
| College or Associate's Degree | 3,335 (43.9%) | 4,262 (56.1%) |
| Bachelor's Degree | 3,267 (78.4%) | 900 (21.6%) |
| Graduate Degree | 2,130 (87.9%) | 293 (12.1%) |
| Total | 12,212 (51.2%) | 11,639 (48.8%) |
Employment Characteristics in Wayne County
Employment by Class of Employer in Wayne County
Among the 742,431 employed individuals in Wayne County, private company employees (549,684 | 74.0%), not-for-profit organizations (65,579 | 8.8%), and local government employees (40,236 | 5.4%) make up the most common classes of employment.
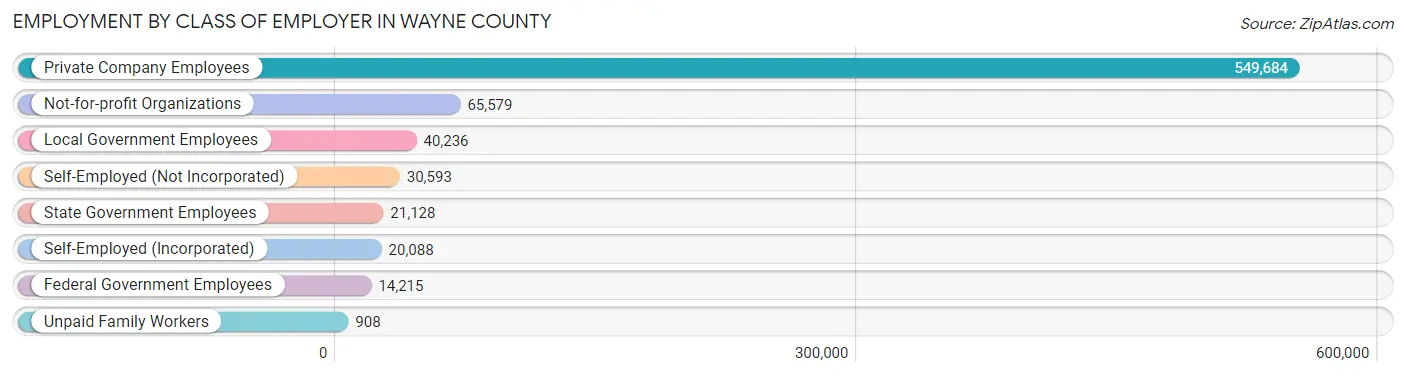
| Employer Class | # Employees | % Employees |
| Private Company Employees | 549,684 | 74.0% |
| Self-Employed (Incorporated) | 20,088 | 2.7% |
| Self-Employed (Not Incorporated) | 30,593 | 4.1% |
| Not-for-profit Organizations | 65,579 | 8.8% |
| Local Government Employees | 40,236 | 5.4% |
| State Government Employees | 21,128 | 2.9% |
| Federal Government Employees | 14,215 | 1.9% |
| Unpaid Family Workers | 908 | 0.1% |
| Total | 742,431 | 100.0% |
Employment Status by Age in Wayne County
According to the labor force statistics for Wayne County, out of the total population over 16 years of age (1,408,500), 59.4% or 836,649 individuals are in the labor force, with 9.0% or 75,298 of them unemployed. The age group with the highest labor force participation rate is 25 to 29 years, with 80.2% or 106,218 individuals in the labor force. Within the labor force, the 16 to 19 years age range has the highest percentage of unemployed individuals, with 20.8% or 7,040 of them being unemployed.
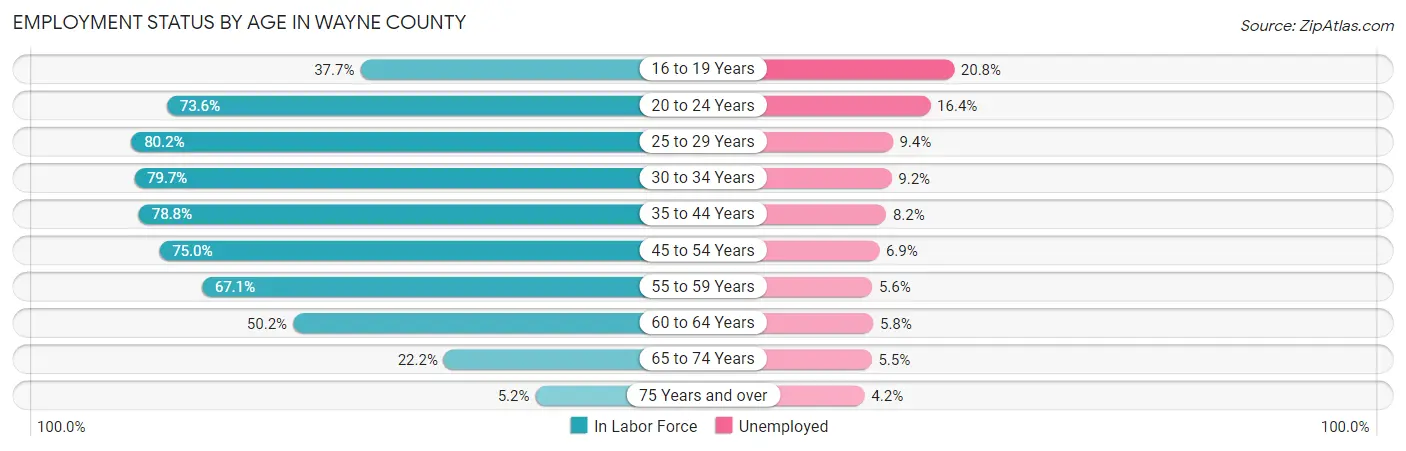
| Age Bracket | In Labor Force | Unemployed |
| 16 to 19 Years | 33,845 (37.7%) | 7,040 (20.8%) |
| 20 to 24 Years | 83,415 (73.6%) | 13,680 (16.4%) |
| 25 to 29 Years | 106,218 (80.2%) | 9,984 (9.4%) |
| 30 to 34 Years | 98,144 (79.7%) | 9,029 (9.2%) |
| 35 to 44 Years | 166,265 (78.8%) | 13,634 (8.2%) |
| 45 to 54 Years | 168,200 (75.0%) | 11,606 (6.9%) |
| 55 to 59 Years | 78,056 (67.1%) | 4,371 (5.6%) |
| 60 to 64 Years | 58,615 (50.2%) | 3,400 (5.8%) |
| 65 to 74 Years | 37,625 (22.2%) | 2,069 (5.5%) |
| 75 Years and over | 5,823 (5.2%) | 245 (4.2%) |
| Total | 836,649 (59.4%) | 75,298 (9.0%) |
Employment Status by Educational Attainment in Wayne County
According to labor force statistics for Wayne County, 73.1% of individuals (675,396) out of the total population between 25 and 64 years of age (923,935) are in the labor force, with 7.7% or 52,005 of them being unemployed. The group with the highest labor force participation rate are those with the educational attainment of bachelor's degree or higher, with 86.3% or 221,594 individuals in the labor force. Within the labor force, individuals with less than high school education have the highest percentage of unemployment, with 17.0% or 8,516 of them being unemployed.
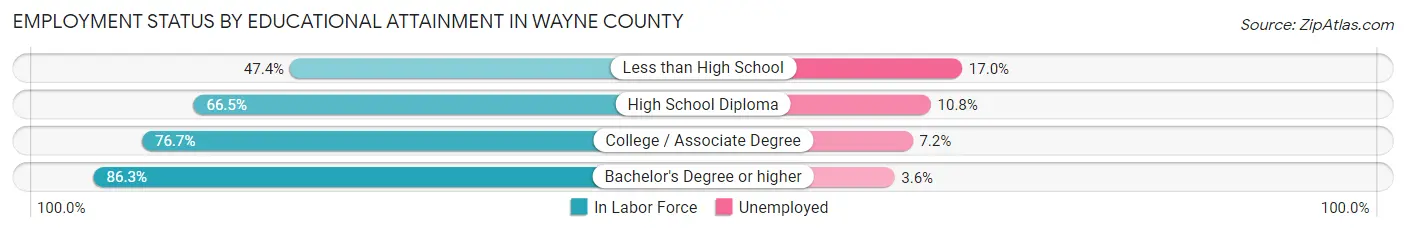
| Educational Attainment | In Labor Force | Unemployed |
| Less than High School | 50,092 (47.4%) | 17,965 (17.0%) |
| High School Diploma | 174,485 (66.5%) | 28,337 (10.8%) |
| College / Associate Degree | 229,410 (76.7%) | 21,535 (7.2%) |
| Bachelor's Degree or higher | 221,594 (86.3%) | 9,244 (3.6%) |
| Total | 675,396 (73.1%) | 71,143 (7.7%) |
Employment Occupations by Sex in Wayne County
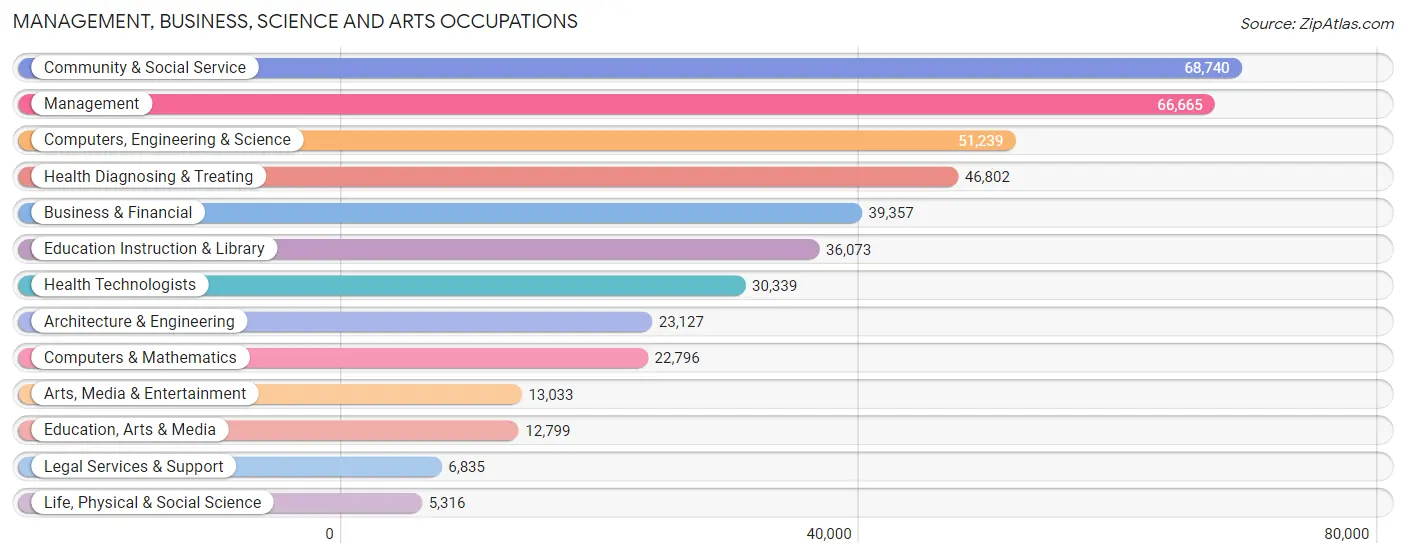
Management, Business, Science and Arts Occupations
The most common Management, Business, Science and Arts occupations in Wayne County are Community & Social Service (68,740 | 9.0%), Management (66,665 | 8.8%), Computers, Engineering & Science (51,239 | 6.7%), Health Diagnosing & Treating (46,802 | 6.1%), and Business & Financial (39,357 | 5.2%).
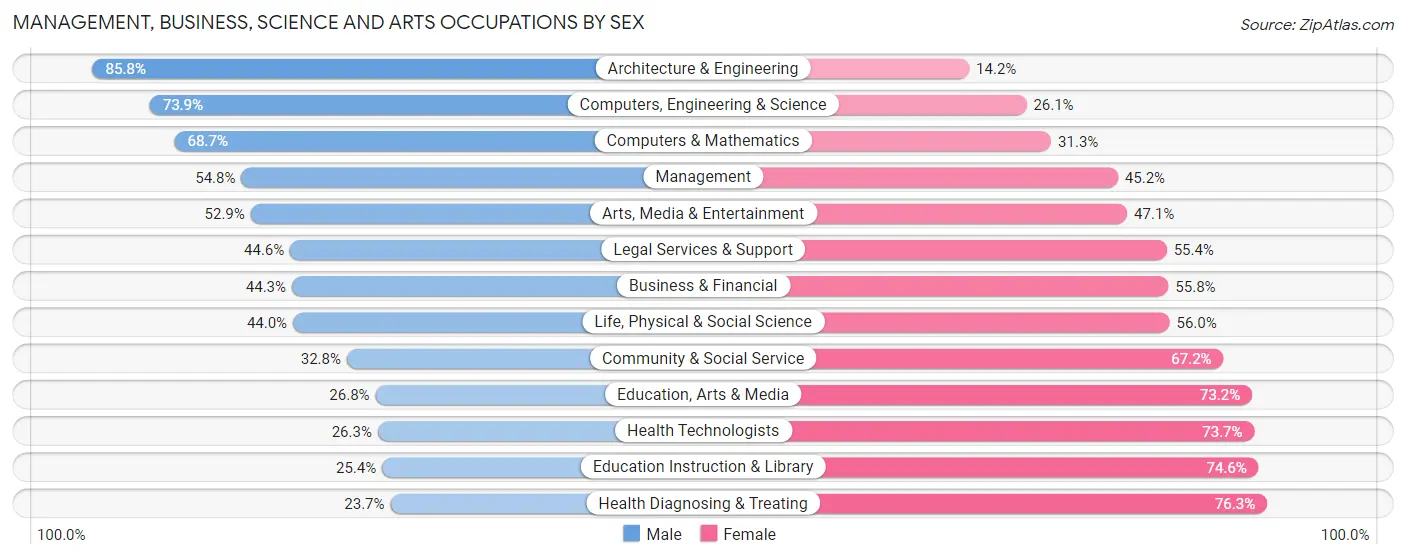
Management, Business, Science and Arts Occupations by Sex
Within the Management, Business, Science and Arts occupations in Wayne County, the most male-oriented occupations are Architecture & Engineering (85.8%), Computers, Engineering & Science (73.9%), and Computers & Mathematics (68.7%), while the most female-oriented occupations are Health Diagnosing & Treating (76.3%), Education Instruction & Library (74.6%), and Health Technologists (73.7%).
| Occupation | Male | Female |
| Management | 36,523 (54.8%) | 30,142 (45.2%) |
| Business & Financial | 17,414 (44.3%) | 21,943 (55.7%) |
| Computers, Engineering & Science | 37,850 (73.9%) | 13,389 (26.1%) |
| Computers & Mathematics | 15,662 (68.7%) | 7,134 (31.3%) |
| Architecture & Engineering | 19,848 (85.8%) | 3,279 (14.2%) |
| Life, Physical & Social Science | 2,340 (44.0%) | 2,976 (56.0%) |
| Community & Social Service | 22,543 (32.8%) | 46,197 (67.2%) |
| Education, Arts & Media | 3,433 (26.8%) | 9,366 (73.2%) |
| Legal Services & Support | 3,049 (44.6%) | 3,786 (55.4%) |
| Education Instruction & Library | 9,172 (25.4%) | 26,901 (74.6%) |
| Arts, Media & Entertainment | 6,889 (52.9%) | 6,144 (47.1%) |
| Health Diagnosing & Treating | 11,090 (23.7%) | 35,712 (76.3%) |
| Health Technologists | 7,988 (26.3%) | 22,351 (73.7%) |
| Total (Category) | 125,420 (46.0%) | 147,383 (54.0%) |
| Total (Overall) | 389,959 (51.2%) | 370,996 (48.7%) |
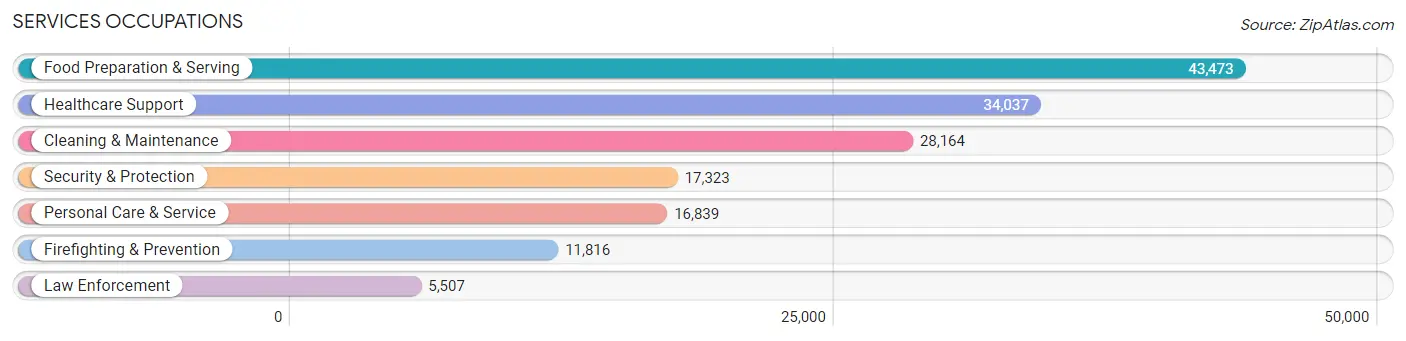
Services Occupations
The most common Services occupations in Wayne County are Food Preparation & Serving (43,473 | 5.7%), Healthcare Support (34,037 | 4.5%), Cleaning & Maintenance (28,164 | 3.7%), Security & Protection (17,323 | 2.3%), and Personal Care & Service (16,839 | 2.2%).
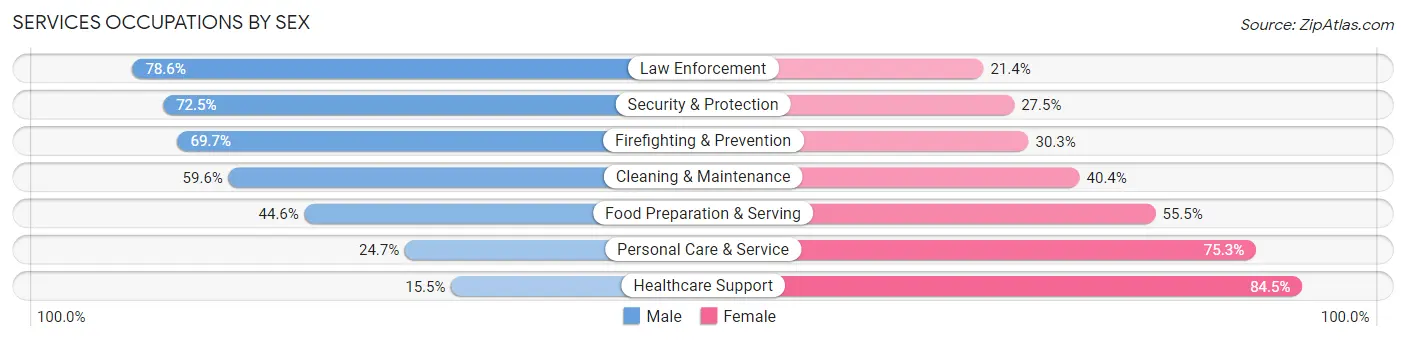
Services Occupations by Sex
Within the Services occupations in Wayne County, the most male-oriented occupations are Law Enforcement (78.6%), Security & Protection (72.5%), and Firefighting & Prevention (69.7%), while the most female-oriented occupations are Healthcare Support (84.5%), Personal Care & Service (75.3%), and Food Preparation & Serving (55.4%).
| Occupation | Male | Female |
| Healthcare Support | 5,278 (15.5%) | 28,759 (84.5%) |
| Security & Protection | 12,566 (72.5%) | 4,757 (27.5%) |
| Firefighting & Prevention | 8,236 (69.7%) | 3,580 (30.3%) |
| Law Enforcement | 4,330 (78.6%) | 1,177 (21.4%) |
| Food Preparation & Serving | 19,366 (44.6%) | 24,107 (55.4%) |
| Cleaning & Maintenance | 16,784 (59.6%) | 11,380 (40.4%) |
| Personal Care & Service | 4,154 (24.7%) | 12,685 (75.3%) |
| Total (Category) | 58,148 (41.6%) | 81,688 (58.4%) |
| Total (Overall) | 389,959 (51.2%) | 370,996 (48.7%) |
Sales and Office Occupations
The most common Sales and Office occupations in Wayne County are Office & Administration (87,191 | 11.5%), and Sales & Related (66,406 | 8.7%).

Sales and Office Occupations by Sex
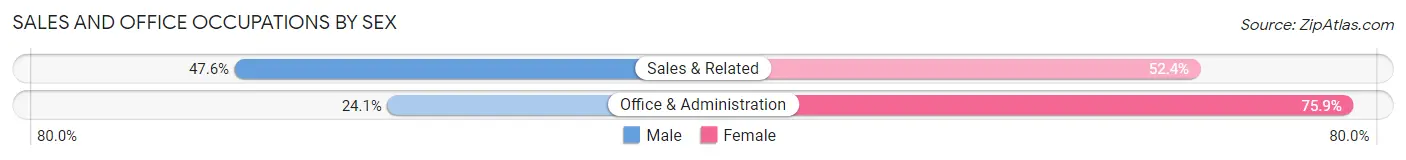
| Occupation | Male | Female |
| Sales & Related | 31,635 (47.6%) | 34,771 (52.4%) |
| Office & Administration | 21,046 (24.1%) | 66,145 (75.9%) |
| Total (Category) | 52,681 (34.3%) | 100,916 (65.7%) |
| Total (Overall) | 389,959 (51.2%) | 370,996 (48.7%) |
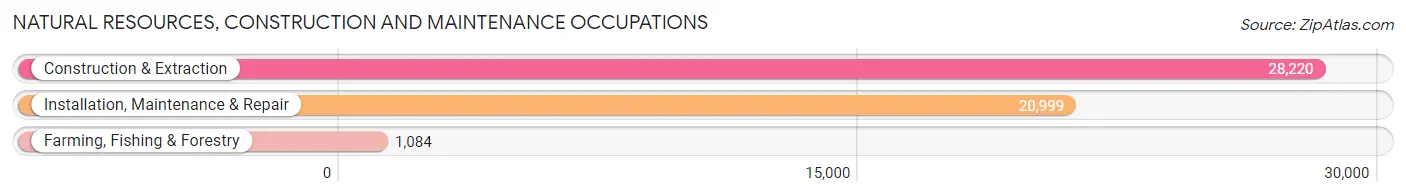
Natural Resources, Construction and Maintenance Occupations
The most common Natural Resources, Construction and Maintenance occupations in Wayne County are Construction & Extraction (28,220 | 3.7%), Installation, Maintenance & Repair (20,999 | 2.8%), and Farming, Fishing & Forestry (1,084 | 0.1%).
Natural Resources, Construction and Maintenance Occupations by Sex
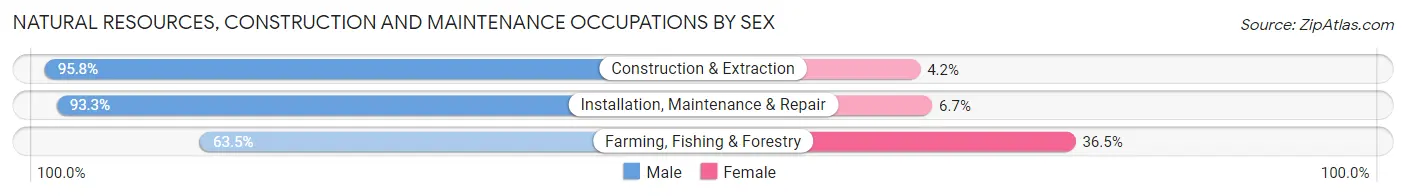
| Occupation | Male | Female |
| Farming, Fishing & Forestry | 688 (63.5%) | 396 (36.5%) |
| Construction & Extraction | 27,029 (95.8%) | 1,191 (4.2%) |
| Installation, Maintenance & Repair | 19,590 (93.3%) | 1,409 (6.7%) |
| Total (Category) | 47,307 (94.0%) | 2,996 (6.0%) |
| Total (Overall) | 389,959 (51.2%) | 370,996 (48.7%) |
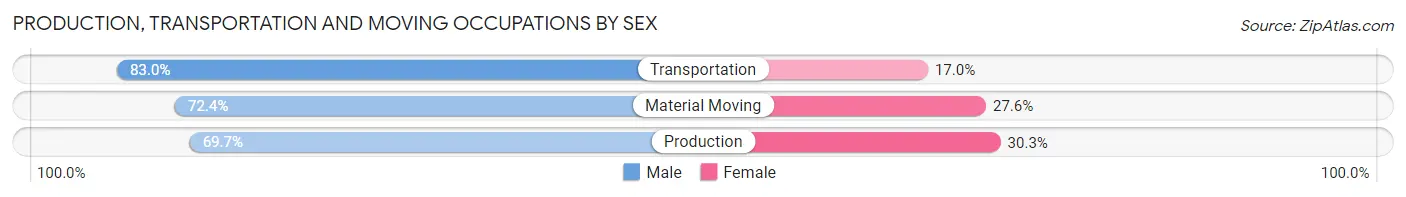
Production, Transportation and Moving Occupations
The most common Production, Transportation and Moving occupations in Wayne County are Production (68,598 | 9.0%), Material Moving (41,021 | 5.4%), and Transportation (34,797 | 4.6%).
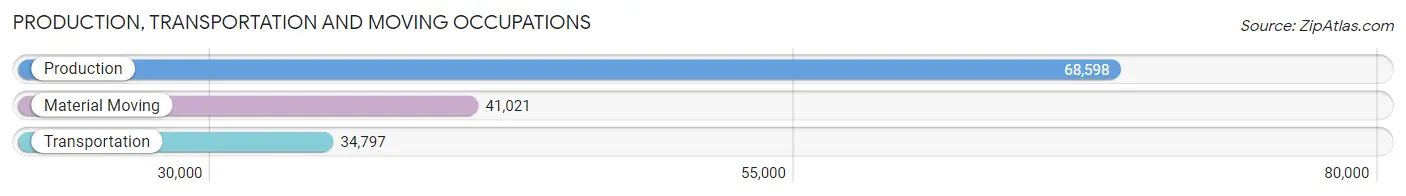
Production, Transportation and Moving Occupations by Sex
| Occupation | Male | Female |
| Production | 47,812 (69.7%) | 20,786 (30.3%) |
| Transportation | 28,896 (83.0%) | 5,901 (17.0%) |
| Material Moving | 29,695 (72.4%) | 11,326 (27.6%) |
| Total (Category) | 106,403 (73.7%) | 38,013 (26.3%) |
| Total (Overall) | 389,959 (51.2%) | 370,996 (48.7%) |
Employment Industries by Sex in Wayne County
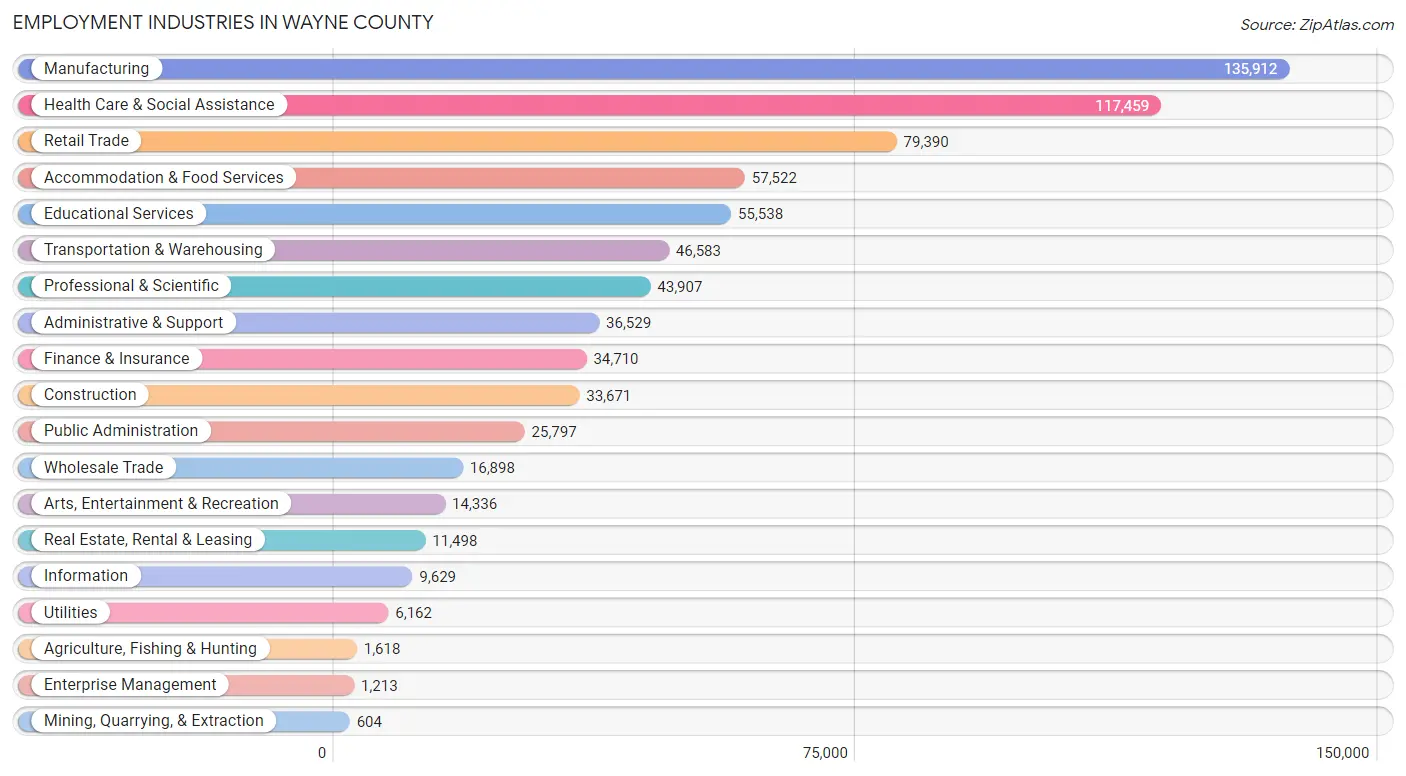
Employment Industries in Wayne County
The major employment industries in Wayne County include Manufacturing (135,912 | 17.9%), Health Care & Social Assistance (117,459 | 15.4%), Retail Trade (79,390 | 10.4%), Accommodation & Food Services (57,522 | 7.6%), and Educational Services (55,538 | 7.3%).
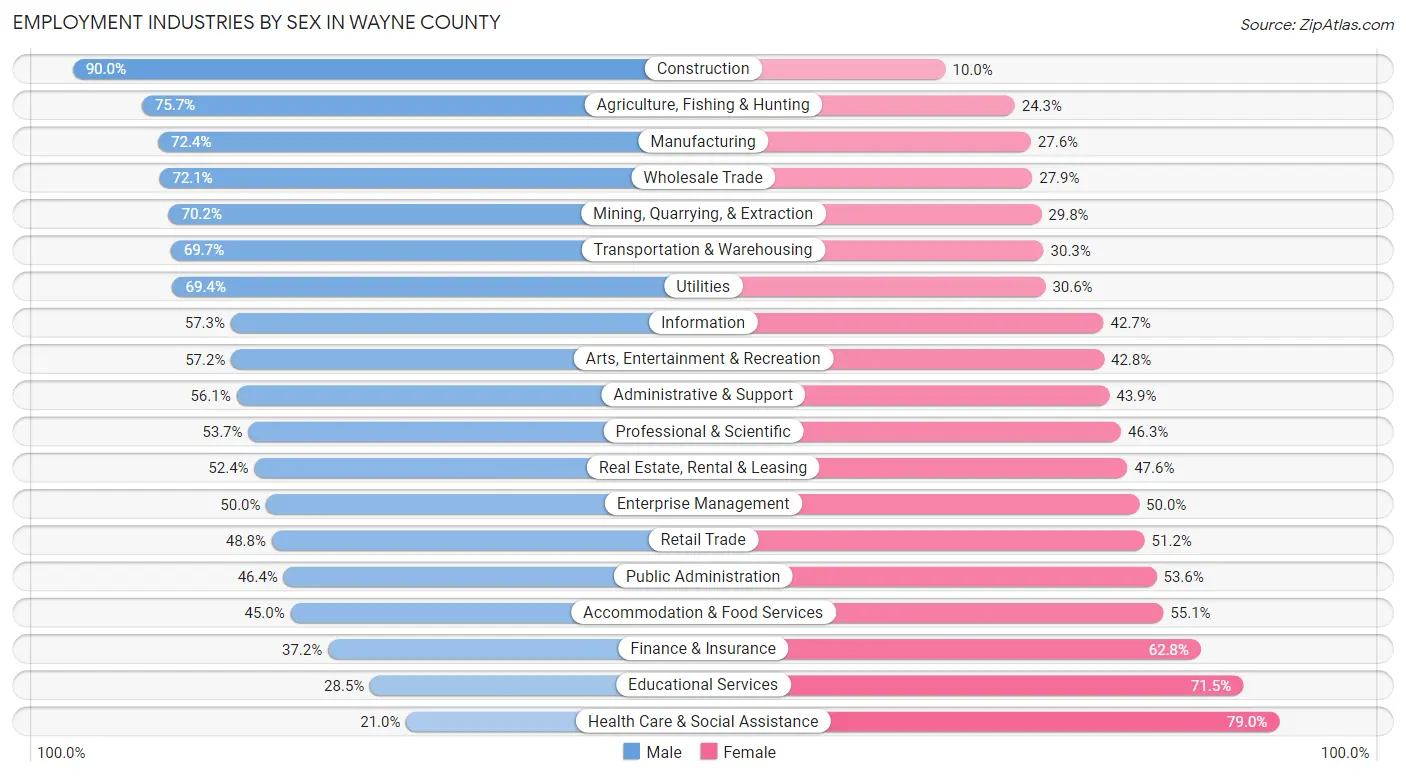
Employment Industries by Sex in Wayne County
The Wayne County industries that see more men than women are Construction (90.0%), Agriculture, Fishing & Hunting (75.7%), and Manufacturing (72.4%), whereas the industries that tend to have a higher number of women are Health Care & Social Assistance (79.0%), Educational Services (71.5%), and Finance & Insurance (62.8%).
| Industry | Male | Female |
| Agriculture, Fishing & Hunting | 1,225 (75.7%) | 393 (24.3%) |
| Mining, Quarrying, & Extraction | 424 (70.2%) | 180 (29.8%) |
| Construction | 30,314 (90.0%) | 3,357 (10.0%) |
| Manufacturing | 98,361 (72.4%) | 37,551 (27.6%) |
| Wholesale Trade | 12,180 (72.1%) | 4,718 (27.9%) |
| Retail Trade | 38,766 (48.8%) | 40,624 (51.2%) |
| Transportation & Warehousing | 32,489 (69.7%) | 14,094 (30.3%) |
| Utilities | 4,274 (69.4%) | 1,888 (30.6%) |
| Information | 5,519 (57.3%) | 4,110 (42.7%) |
| Finance & Insurance | 12,911 (37.2%) | 21,799 (62.8%) |
| Real Estate, Rental & Leasing | 6,028 (52.4%) | 5,470 (47.6%) |
| Professional & Scientific | 23,575 (53.7%) | 20,332 (46.3%) |
| Enterprise Management | 606 (50.0%) | 607 (50.0%) |
| Administrative & Support | 20,509 (56.1%) | 16,020 (43.9%) |
| Educational Services | 15,814 (28.5%) | 39,724 (71.5%) |
| Health Care & Social Assistance | 24,651 (21.0%) | 92,808 (79.0%) |
| Arts, Entertainment & Recreation | 8,204 (57.2%) | 6,132 (42.8%) |
| Accommodation & Food Services | 25,859 (45.0%) | 31,663 (55.0%) |
| Public Administration | 11,961 (46.4%) | 13,836 (53.6%) |
| Total | 389,959 (51.2%) | 370,996 (48.7%) |
Education in Wayne County
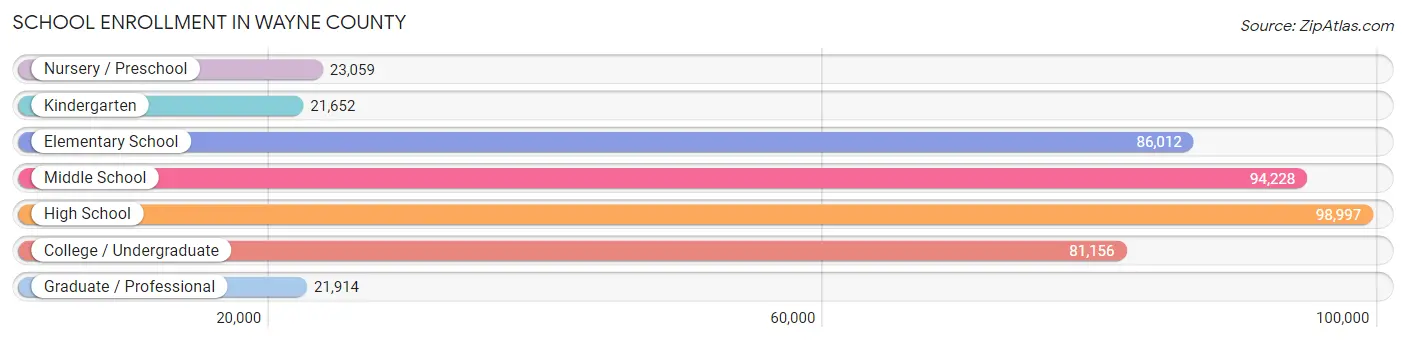
School Enrollment in Wayne County
The most common levels of schooling among the 427,018 students in Wayne County are high school (98,997 | 23.2%), middle school (94,228 | 22.1%), and elementary school (86,012 | 20.1%).
| School Level | # Students | % Students |
| Nursery / Preschool | 23,059 | 5.4% |
| Kindergarten | 21,652 | 5.1% |
| Elementary School | 86,012 | 20.1% |
| Middle School | 94,228 | 22.1% |
| High School | 98,997 | 23.2% |
| College / Undergraduate | 81,156 | 19.0% |
| Graduate / Professional | 21,914 | 5.1% |
| Total | 427,018 | 100.0% |
School Enrollment by Age by Funding Source in Wayne County
Out of a total of 427,018 students who are enrolled in schools in Wayne County, 53,377 (12.5%) attend a private institution, while the remaining 373,641 (87.5%) are enrolled in public schools. The age group of 3 to 4 year olds has the highest likelihood of being enrolled in private schools, with 6,079 (32.6% in the age bracket) enrolled. Conversely, the age group of 15 to 17 year olds has the lowest likelihood of being enrolled in a private school, with 63,502 (91.7% in the age bracket) attending a public institution.
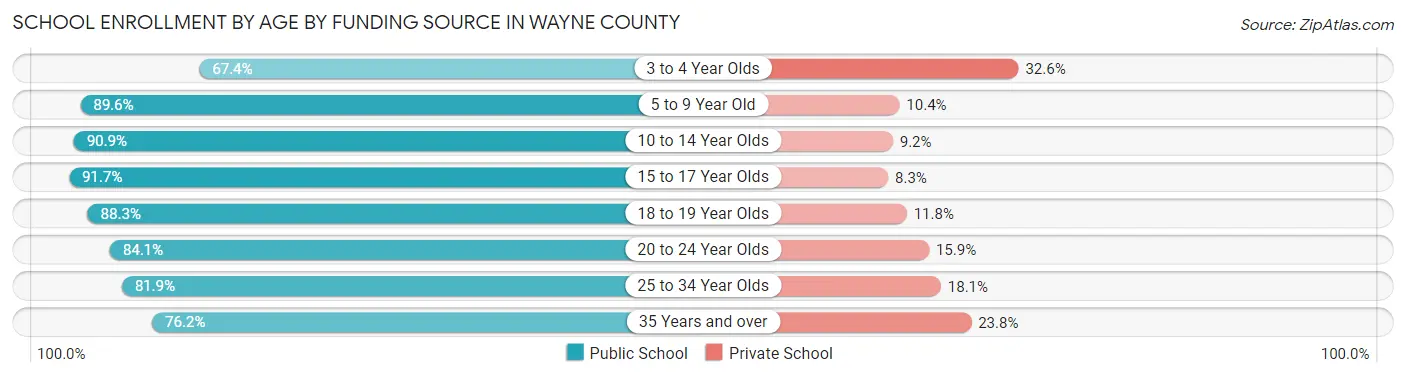
| Age Bracket | Public School | Private School |
| 3 to 4 Year Olds | 12,594 (67.4%) | 6,079 (32.6%) |
| 5 to 9 Year Old | 93,225 (89.6%) | 10,800 (10.4%) |
| 10 to 14 Year Olds | 106,032 (90.8%) | 10,674 (9.1%) |
| 15 to 17 Year Olds | 63,502 (91.7%) | 5,728 (8.3%) |
| 18 to 19 Year Olds | 24,896 (88.2%) | 3,315 (11.7%) |
| 20 to 24 Year Olds | 34,863 (84.1%) | 6,586 (15.9%) |
| 25 to 34 Year Olds | 22,371 (81.9%) | 4,944 (18.1%) |
| 35 Years and over | 16,323 (76.2%) | 5,086 (23.8%) |
| Total | 373,641 (87.5%) | 53,377 (12.5%) |
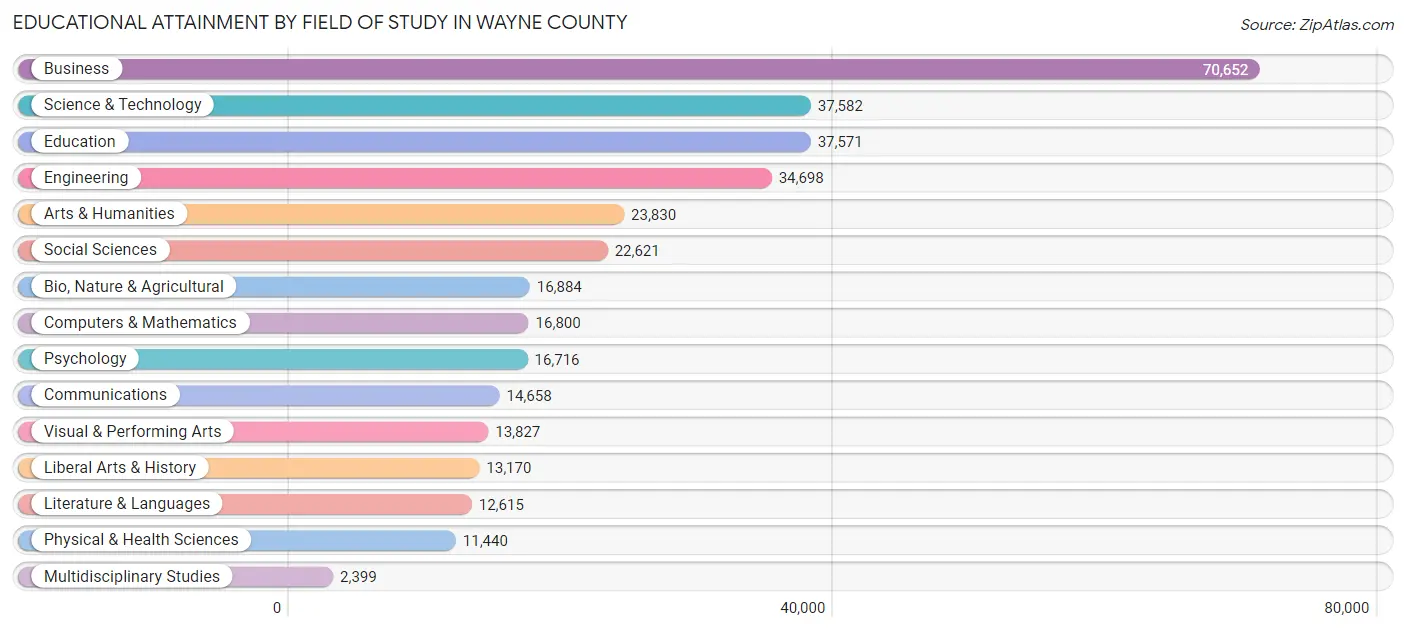
Educational Attainment by Field of Study in Wayne County
Business (70,652 | 20.4%), science & technology (37,582 | 10.9%), education (37,571 | 10.9%), engineering (34,698 | 10.0%), and arts & humanities (23,830 | 6.9%) are the most common fields of study among 345,463 individuals in Wayne County who have obtained a bachelor's degree or higher.
| Field of Study | # Graduates | % Graduates |
| Computers & Mathematics | 16,800 | 4.9% |
| Bio, Nature & Agricultural | 16,884 | 4.9% |
| Physical & Health Sciences | 11,440 | 3.3% |
| Psychology | 16,716 | 4.8% |
| Social Sciences | 22,621 | 6.6% |
| Engineering | 34,698 | 10.0% |
| Multidisciplinary Studies | 2,399 | 0.7% |
| Science & Technology | 37,582 | 10.9% |
| Business | 70,652 | 20.4% |
| Education | 37,571 | 10.9% |
| Literature & Languages | 12,615 | 3.6% |
| Liberal Arts & History | 13,170 | 3.8% |
| Visual & Performing Arts | 13,827 | 4.0% |
| Communications | 14,658 | 4.2% |
| Arts & Humanities | 23,830 | 6.9% |
| Total | 345,463 | 100.0% |
Transportation & Commute in Wayne County
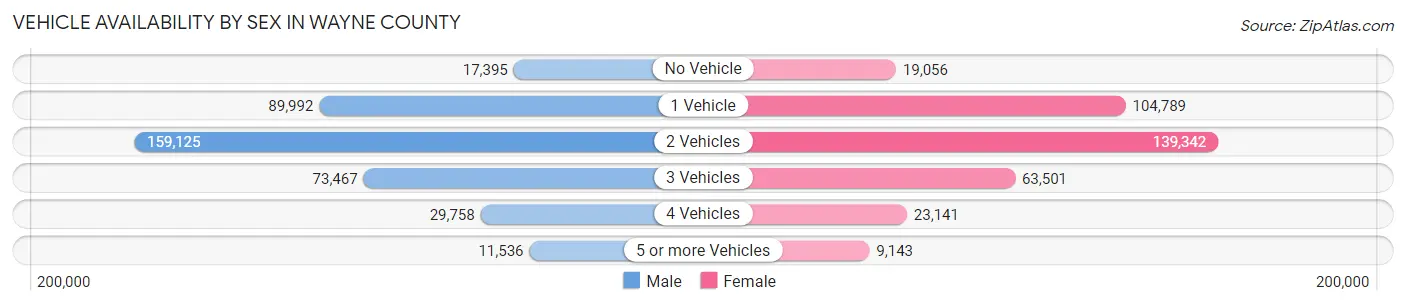
Vehicle Availability by Sex in Wayne County
The most prevalent vehicle ownership categories in Wayne County are males with 2 vehicles (159,125, accounting for 41.7%) and females with 2 vehicles (139,342, making up 44.3%).
| Vehicles Available | Male | Female |
| No Vehicle | 17,395 (4.6%) | 19,056 (5.3%) |
| 1 Vehicle | 89,992 (23.6%) | 104,789 (29.2%) |
| 2 Vehicles | 159,125 (41.7%) | 139,342 (38.8%) |
| 3 Vehicles | 73,467 (19.3%) | 63,501 (17.7%) |
| 4 Vehicles | 29,758 (7.8%) | 23,141 (6.5%) |
| 5 or more Vehicles | 11,536 (3.0%) | 9,143 (2.5%) |
| Total | 381,273 (100.0%) | 358,972 (100.0%) |
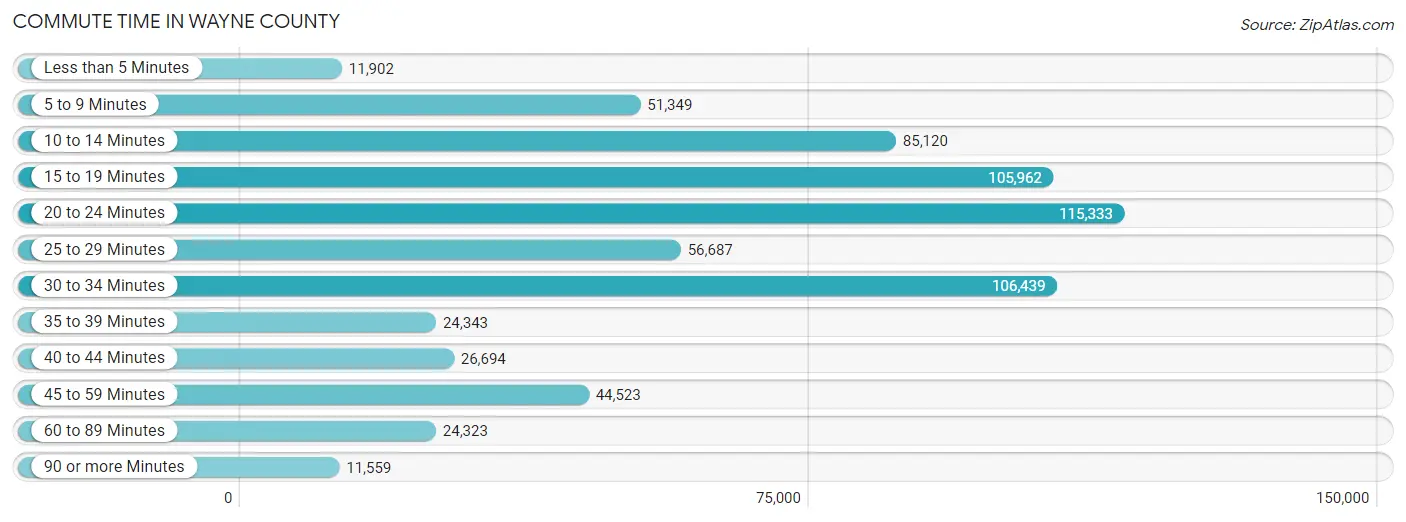
Commute Time in Wayne County
The most frequently occuring commute durations in Wayne County are 20 to 24 minutes (115,333 commuters, 17.4%), 30 to 34 minutes (106,439 commuters, 16.0%), and 15 to 19 minutes (105,962 commuters, 16.0%).
| Commute Time | # Commuters | % Commuters |
| Less than 5 Minutes | 11,902 | 1.8% |
| 5 to 9 Minutes | 51,349 | 7.7% |
| 10 to 14 Minutes | 85,120 | 12.8% |
| 15 to 19 Minutes | 105,962 | 16.0% |
| 20 to 24 Minutes | 115,333 | 17.4% |
| 25 to 29 Minutes | 56,687 | 8.5% |
| 30 to 34 Minutes | 106,439 | 16.0% |
| 35 to 39 Minutes | 24,343 | 3.7% |
| 40 to 44 Minutes | 26,694 | 4.0% |
| 45 to 59 Minutes | 44,523 | 6.7% |
| 60 to 89 Minutes | 24,323 | 3.7% |
| 90 or more Minutes | 11,559 | 1.7% |
Commute Time by Sex in Wayne County
The most common commute times in Wayne County are 20 to 24 minutes (60,802 commuters, 17.6%) for males and 20 to 24 minutes (54,531 commuters, 17.1%) for females.
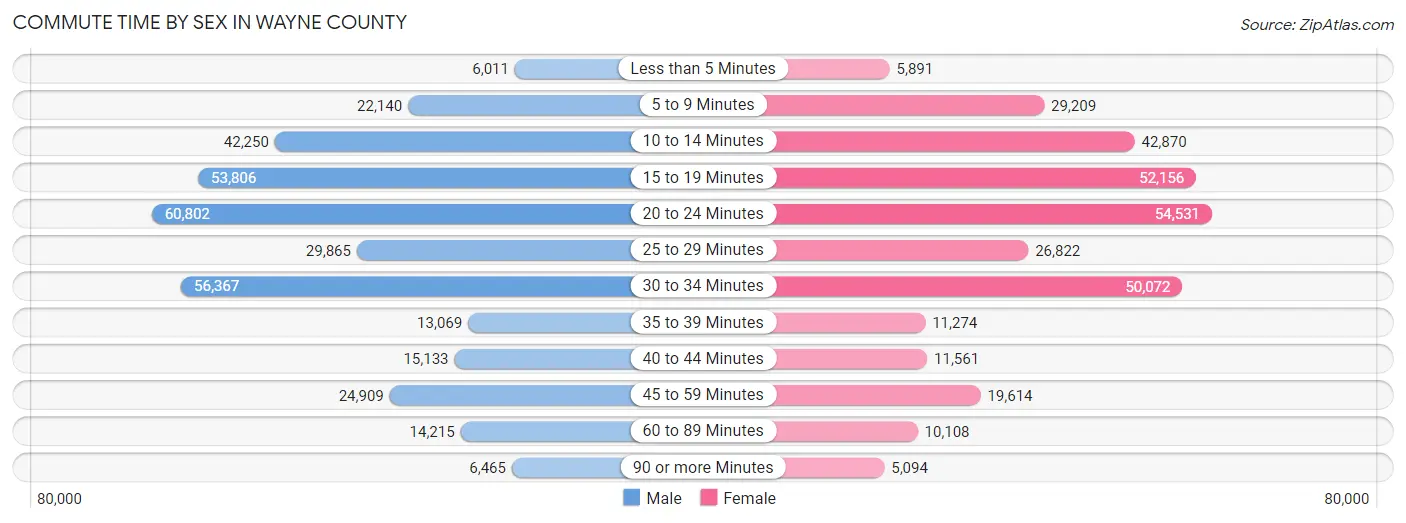
| Commute Time | Male | Female |
| Less than 5 Minutes | 6,011 (1.7%) | 5,891 (1.8%) |
| 5 to 9 Minutes | 22,140 (6.4%) | 29,209 (9.1%) |
| 10 to 14 Minutes | 42,250 (12.2%) | 42,870 (13.4%) |
| 15 to 19 Minutes | 53,806 (15.6%) | 52,156 (16.3%) |
| 20 to 24 Minutes | 60,802 (17.6%) | 54,531 (17.1%) |
| 25 to 29 Minutes | 29,865 (8.7%) | 26,822 (8.4%) |
| 30 to 34 Minutes | 56,367 (16.3%) | 50,072 (15.7%) |
| 35 to 39 Minutes | 13,069 (3.8%) | 11,274 (3.5%) |
| 40 to 44 Minutes | 15,133 (4.4%) | 11,561 (3.6%) |
| 45 to 59 Minutes | 24,909 (7.2%) | 19,614 (6.1%) |
| 60 to 89 Minutes | 14,215 (4.1%) | 10,108 (3.2%) |
| 90 or more Minutes | 6,465 (1.9%) | 5,094 (1.6%) |
Time of Departure to Work by Sex in Wayne County
The most frequent times of departure to work in Wayne County are 7:00 AM to 7:29 AM (38,287, 11.1%) for males and 7:00 AM to 7:29 AM (41,993, 13.2%) for females.
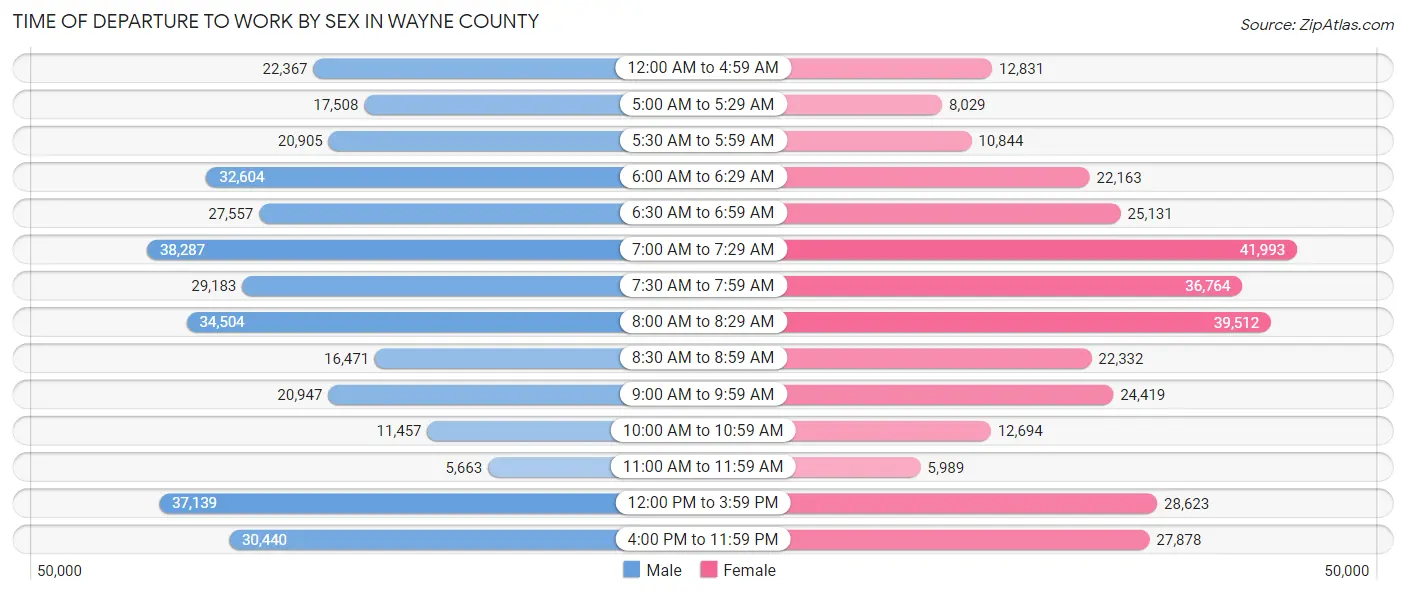
| Time of Departure | Male | Female |
| 12:00 AM to 4:59 AM | 22,367 (6.5%) | 12,831 (4.0%) |
| 5:00 AM to 5:29 AM | 17,508 (5.1%) | 8,029 (2.5%) |
| 5:30 AM to 5:59 AM | 20,905 (6.1%) | 10,844 (3.4%) |
| 6:00 AM to 6:29 AM | 32,604 (9.5%) | 22,163 (6.9%) |
| 6:30 AM to 6:59 AM | 27,557 (8.0%) | 25,131 (7.9%) |
| 7:00 AM to 7:29 AM | 38,287 (11.1%) | 41,993 (13.2%) |
| 7:30 AM to 7:59 AM | 29,183 (8.5%) | 36,764 (11.5%) |
| 8:00 AM to 8:29 AM | 34,504 (10.0%) | 39,512 (12.4%) |
| 8:30 AM to 8:59 AM | 16,471 (4.8%) | 22,332 (7.0%) |
| 9:00 AM to 9:59 AM | 20,947 (6.1%) | 24,419 (7.6%) |
| 10:00 AM to 10:59 AM | 11,457 (3.3%) | 12,694 (4.0%) |
| 11:00 AM to 11:59 AM | 5,663 (1.6%) | 5,989 (1.9%) |
| 12:00 PM to 3:59 PM | 37,139 (10.8%) | 28,623 (9.0%) |
| 4:00 PM to 11:59 PM | 30,440 (8.8%) | 27,878 (8.7%) |
| Total | 345,032 (100.0%) | 319,202 (100.0%) |
Housing Occupancy in Wayne County
Occupancy by Ownership in Wayne County
Of the total 688,461 dwellings in Wayne County, owner-occupied units account for 440,701 (64.0%), while renter-occupied units make up 247,760 (36.0%).
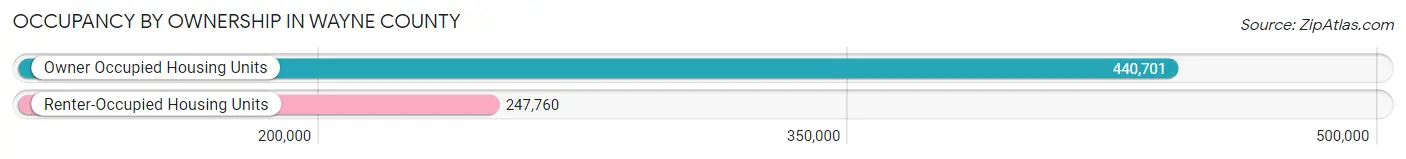
| Occupancy | # Housing Units | % Housing Units |
| Owner Occupied Housing Units | 440,701 | 64.0% |
| Renter-Occupied Housing Units | 247,760 | 36.0% |
| Total Occupied Housing Units | 688,461 | 100.0% |
Occupancy by Household Size in Wayne County
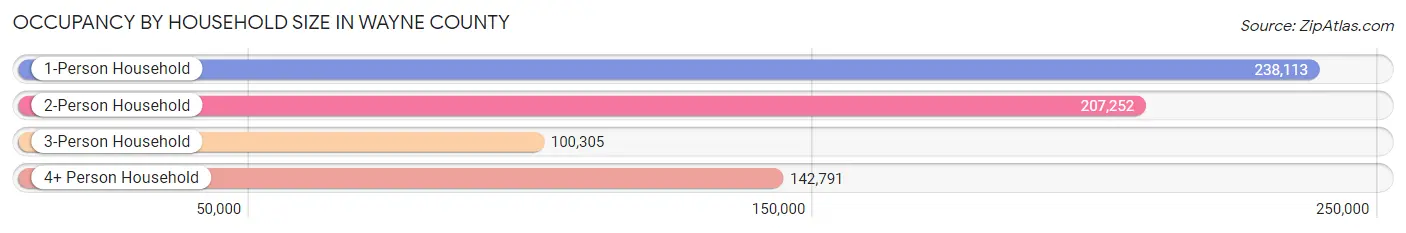
| Household Size | # Housing Units | % Housing Units |
| 1-Person Household | 238,113 | 34.6% |
| 2-Person Household | 207,252 | 30.1% |
| 3-Person Household | 100,305 | 14.6% |
| 4+ Person Household | 142,791 | 20.7% |
| Total Housing Units | 688,461 | 100.0% |
Occupancy by Ownership by Household Size in Wayne County
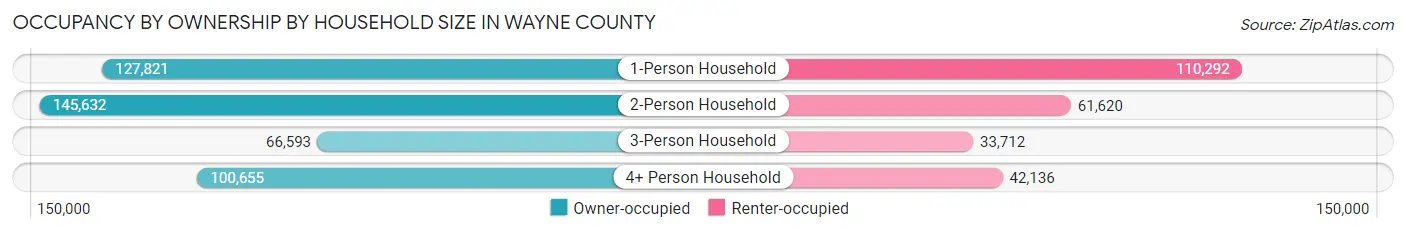
| Household Size | Owner-occupied | Renter-occupied |
| 1-Person Household | 127,821 (53.7%) | 110,292 (46.3%) |
| 2-Person Household | 145,632 (70.3%) | 61,620 (29.7%) |
| 3-Person Household | 66,593 (66.4%) | 33,712 (33.6%) |
| 4+ Person Household | 100,655 (70.5%) | 42,136 (29.5%) |
| Total Housing Units | 440,701 (64.0%) | 247,760 (36.0%) |
Occupancy by Educational Attainment in Wayne County
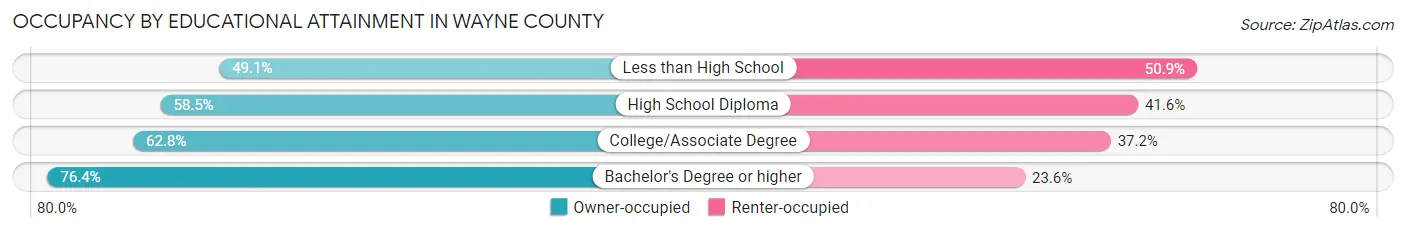
| Household Size | Owner-occupied | Renter-occupied |
| Less than High School | 35,350 (49.1%) | 36,608 (50.9%) |
| High School Diploma | 108,738 (58.5%) | 77,290 (41.5%) |
| College/Associate Degree | 148,846 (62.8%) | 88,162 (37.2%) |
| Bachelor's Degree or higher | 147,767 (76.4%) | 45,700 (23.6%) |
Occupancy by Age of Householder in Wayne County
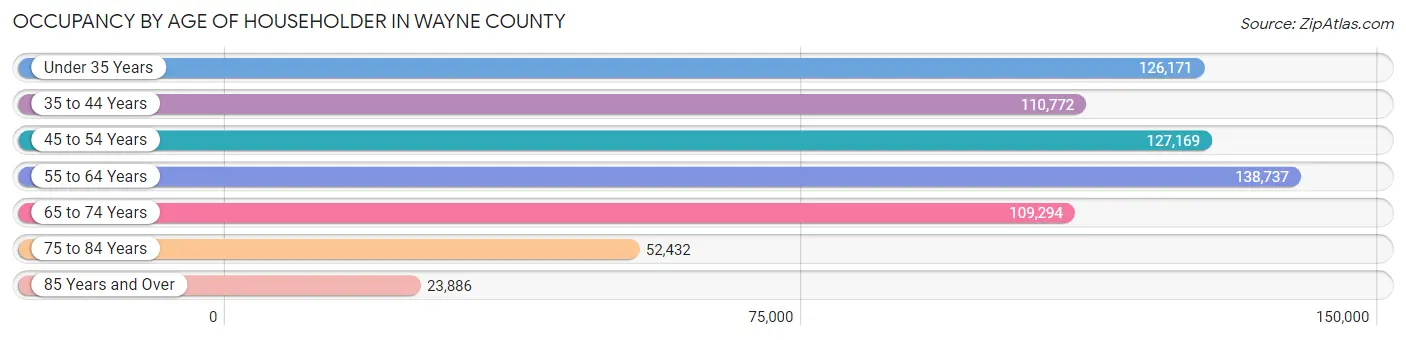
| Age Bracket | # Households | % Households |
| Under 35 Years | 126,171 | 18.3% |
| 35 to 44 Years | 110,772 | 16.1% |
| 45 to 54 Years | 127,169 | 18.5% |
| 55 to 64 Years | 138,737 | 20.2% |
| 65 to 74 Years | 109,294 | 15.9% |
| 75 to 84 Years | 52,432 | 7.6% |
| 85 Years and Over | 23,886 | 3.5% |
| Total | 688,461 | 100.0% |
Housing Finances in Wayne County
Median Income by Occupancy in Wayne County
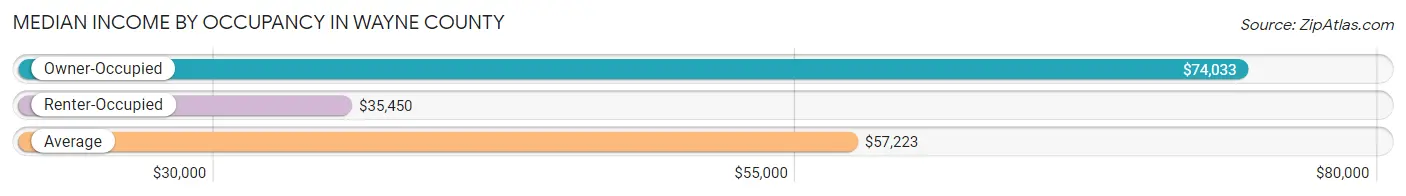
| Occupancy Type | # Households | Median Income |
| Owner-Occupied | 440,701 (64.0%) | $74,033 |
| Renter-Occupied | 247,760 (36.0%) | $35,450 |
| Average | 688,461 (100.0%) | $57,223 |
Occupancy by Householder Income Bracket in Wayne County
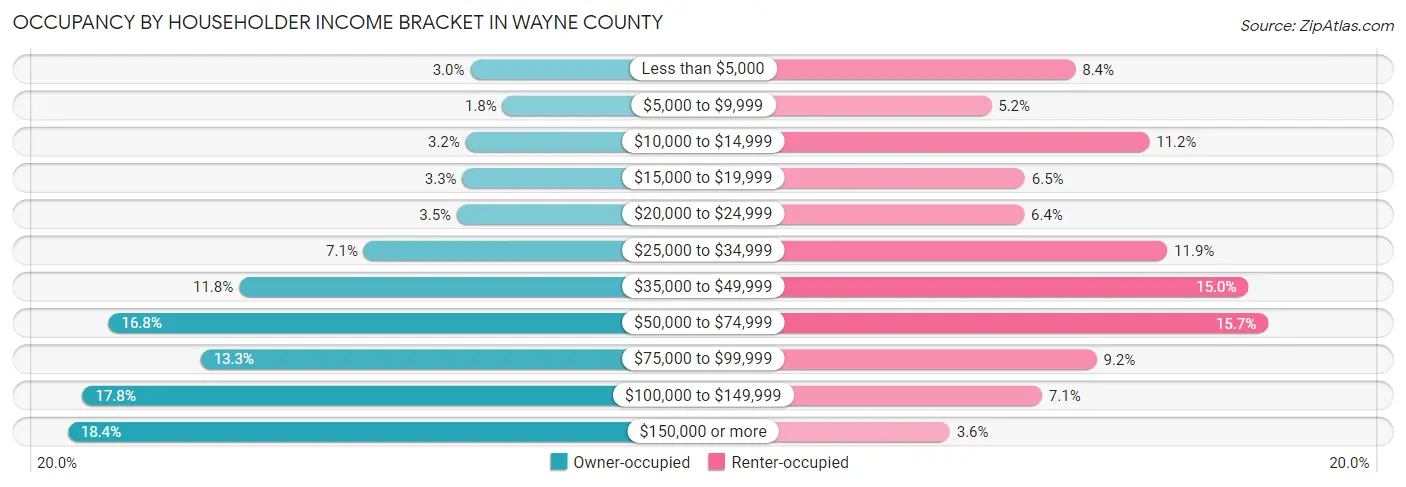
| Income Bracket | Owner-occupied | Renter-occupied |
| Less than $5,000 | 13,326 (3.0%) | 20,728 (8.4%) |
| $5,000 to $9,999 | 7,883 (1.8%) | 12,812 (5.2%) |
| $10,000 to $14,999 | 14,091 (3.2%) | 27,716 (11.2%) |
| $15,000 to $19,999 | 14,633 (3.3%) | 15,972 (6.5%) |
| $20,000 to $24,999 | 15,561 (3.5%) | 15,916 (6.4%) |
| $25,000 to $34,999 | 31,195 (7.1%) | 29,398 (11.9%) |
| $35,000 to $49,999 | 52,144 (11.8%) | 37,064 (15.0%) |
| $50,000 to $74,999 | 74,045 (16.8%) | 38,923 (15.7%) |
| $75,000 to $99,999 | 58,551 (13.3%) | 22,742 (9.2%) |
| $100,000 to $149,999 | 78,408 (17.8%) | 17,592 (7.1%) |
| $150,000 or more | 80,864 (18.3%) | 8,897 (3.6%) |
| Total | 440,701 (100.0%) | 247,760 (100.0%) |
Monthly Housing Cost Tiers in Wayne County
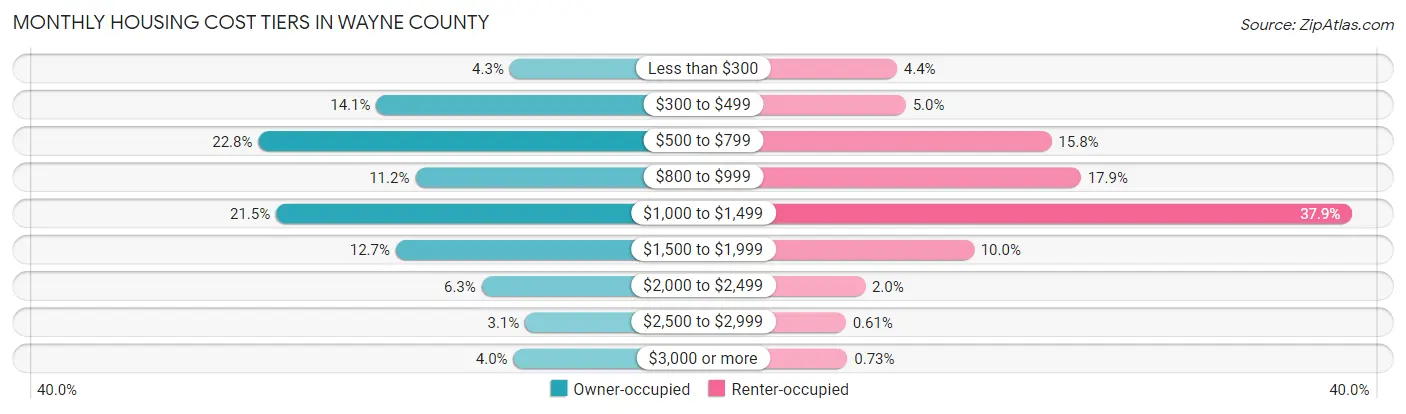
| Monthly Cost | Owner-occupied | Renter-occupied |
| Less than $300 | 18,817 (4.3%) | 10,862 (4.4%) |
| $300 to $499 | 62,130 (14.1%) | 12,457 (5.0%) |
| $500 to $799 | 100,431 (22.8%) | 39,056 (15.8%) |
| $800 to $999 | 49,479 (11.2%) | 44,407 (17.9%) |
| $1,000 to $1,499 | 94,656 (21.5%) | 93,927 (37.9%) |
| $1,500 to $1,999 | 55,806 (12.7%) | 24,875 (10.0%) |
| $2,000 to $2,499 | 27,945 (6.3%) | 5,026 (2.0%) |
| $2,500 to $2,999 | 13,828 (3.1%) | 1,505 (0.6%) |
| $3,000 or more | 17,609 (4.0%) | 1,813 (0.7%) |
| Total | 440,701 (100.0%) | 247,760 (100.0%) |
Physical Housing Characteristics in Wayne County
Housing Structures in Wayne County
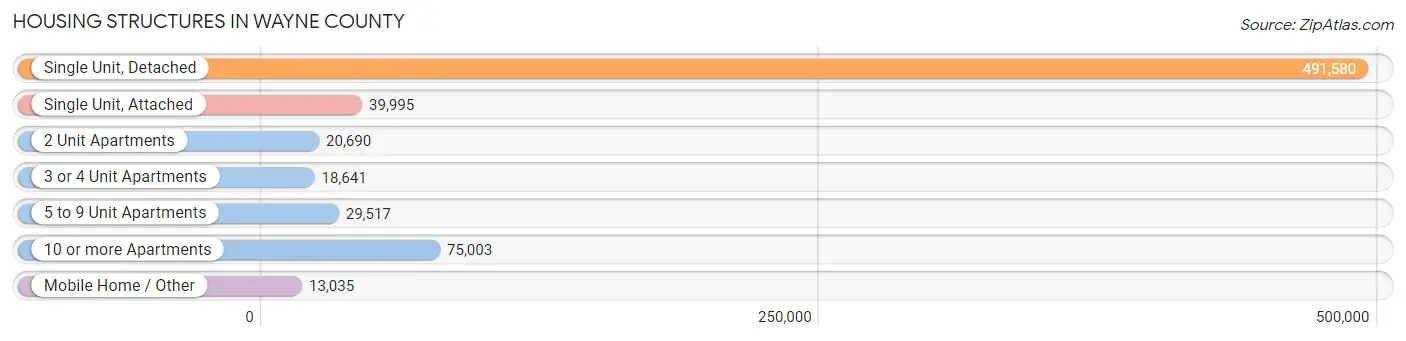
| Structure Type | # Housing Units | % Housing Units |
| Single Unit, Detached | 491,580 | 71.4% |
| Single Unit, Attached | 39,995 | 5.8% |
| 2 Unit Apartments | 20,690 | 3.0% |
| 3 or 4 Unit Apartments | 18,641 | 2.7% |
| 5 to 9 Unit Apartments | 29,517 | 4.3% |
| 10 or more Apartments | 75,003 | 10.9% |
| Mobile Home / Other | 13,035 | 1.9% |
| Total | 688,461 | 100.0% |
Housing Structures by Occupancy in Wayne County
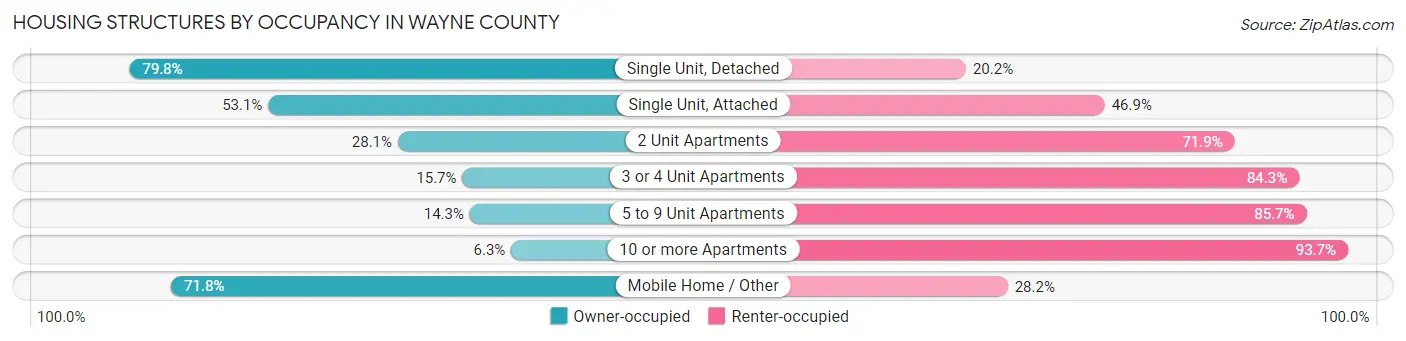
| Structure Type | Owner-occupied | Renter-occupied |
| Single Unit, Detached | 392,400 (79.8%) | 99,180 (20.2%) |
| Single Unit, Attached | 21,238 (53.1%) | 18,757 (46.9%) |
| 2 Unit Apartments | 5,821 (28.1%) | 14,869 (71.9%) |
| 3 or 4 Unit Apartments | 2,929 (15.7%) | 15,712 (84.3%) |
| 5 to 9 Unit Apartments | 4,218 (14.3%) | 25,299 (85.7%) |
| 10 or more Apartments | 4,738 (6.3%) | 70,265 (93.7%) |
| Mobile Home / Other | 9,357 (71.8%) | 3,678 (28.2%) |
| Total | 440,701 (64.0%) | 247,760 (36.0%) |
Housing Structures by Number of Rooms in Wayne County
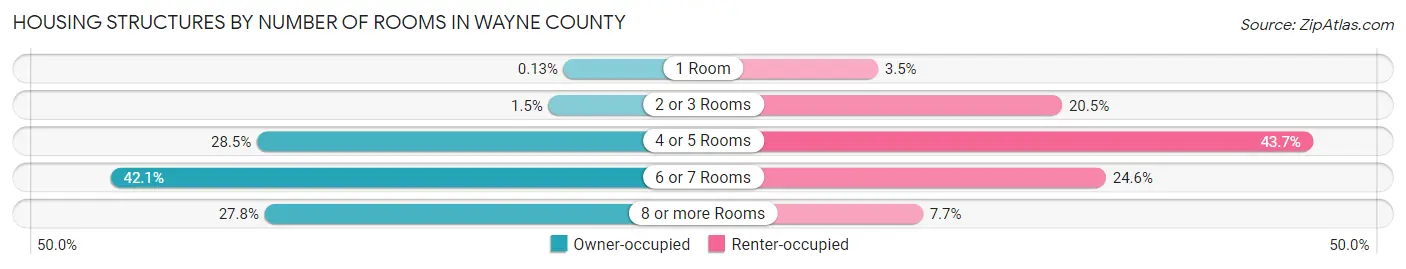
| Number of Rooms | Owner-occupied | Renter-occupied |
| 1 Room | 578 (0.1%) | 8,684 (3.5%) |
| 2 or 3 Rooms | 6,755 (1.5%) | 50,878 (20.5%) |
| 4 or 5 Rooms | 125,598 (28.5%) | 108,312 (43.7%) |
| 6 or 7 Rooms | 185,310 (42.0%) | 60,916 (24.6%) |
| 8 or more Rooms | 122,460 (27.8%) | 18,970 (7.7%) |
| Total | 440,701 (100.0%) | 247,760 (100.0%) |
Housing Structure by Heating Type in Wayne County
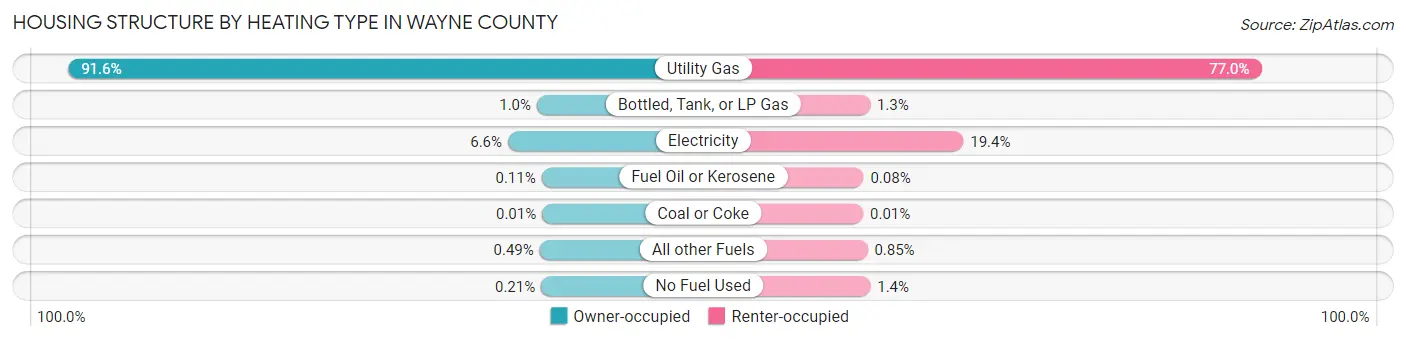
| Heating Type | Owner-occupied | Renter-occupied |
| Utility Gas | 403,512 (91.6%) | 190,649 (76.9%) |
| Bottled, Tank, or LP Gas | 4,458 (1.0%) | 3,309 (1.3%) |
| Electricity | 29,139 (6.6%) | 47,985 (19.4%) |
| Fuel Oil or Kerosene | 472 (0.1%) | 204 (0.1%) |
| Coal or Coke | 34 (0.0%) | 27 (0.0%) |
| All other Fuels | 2,154 (0.5%) | 2,106 (0.9%) |
| No Fuel Used | 932 (0.2%) | 3,480 (1.4%) |
| Total | 440,701 (100.0%) | 247,760 (100.0%) |
Household Vehicle Usage in Wayne County
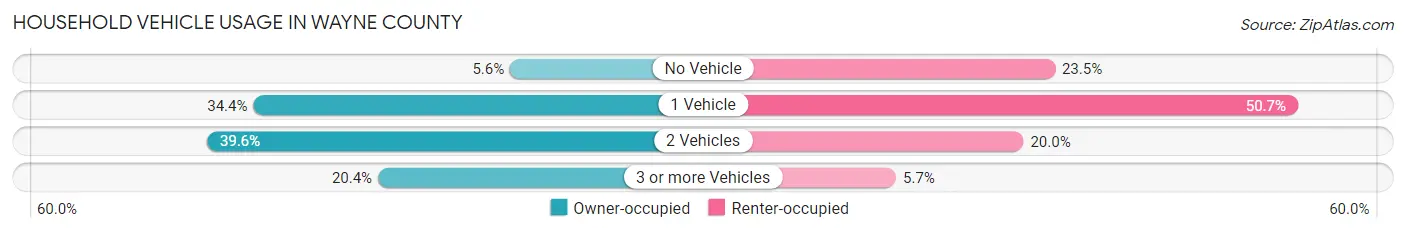
| Vehicles per Household | Owner-occupied | Renter-occupied |
| No Vehicle | 24,775 (5.6%) | 58,302 (23.5%) |
| 1 Vehicle | 151,531 (34.4%) | 125,696 (50.7%) |
| 2 Vehicles | 174,421 (39.6%) | 49,563 (20.0%) |
| 3 or more Vehicles | 89,974 (20.4%) | 14,199 (5.7%) |
| Total | 440,701 (100.0%) | 247,760 (100.0%) |
Real Estate & Mortgages in Wayne County
Real Estate and Mortgage Overview in Wayne County
| Characteristic | Without Mortgage | With Mortgage |
| Housing Units | 212,147 | 228,554 |
| Median Property Value | $117,000 | $189,300 |
| Median Household Income | $54,807 | $57,521 |
| Monthly Housing Costs | $575 | $17,128 |
| Real Estate Taxes | $2,237 | $9,286 |
Property Value by Mortgage Status in Wayne County
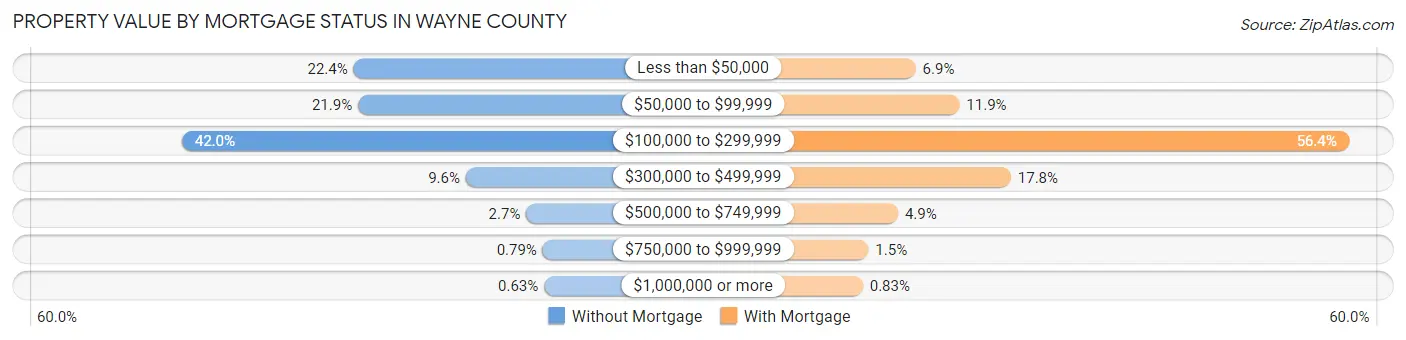
| Property Value | Without Mortgage | With Mortgage |
| Less than $50,000 | 47,546 (22.4%) | 15,709 (6.9%) |
| $50,000 to $99,999 | 46,459 (21.9%) | 27,120 (11.9%) |
| $100,000 to $299,999 | 89,156 (42.0%) | 128,822 (56.4%) |
| $300,000 to $499,999 | 20,323 (9.6%) | 40,572 (17.7%) |
| $500,000 to $749,999 | 5,657 (2.7%) | 11,080 (4.9%) |
| $750,000 to $999,999 | 1,673 (0.8%) | 3,352 (1.5%) |
| $1,000,000 or more | 1,333 (0.6%) | 1,899 (0.8%) |
| Total | 212,147 (100.0%) | 228,554 (100.0%) |
Household Income by Mortgage Status in Wayne County
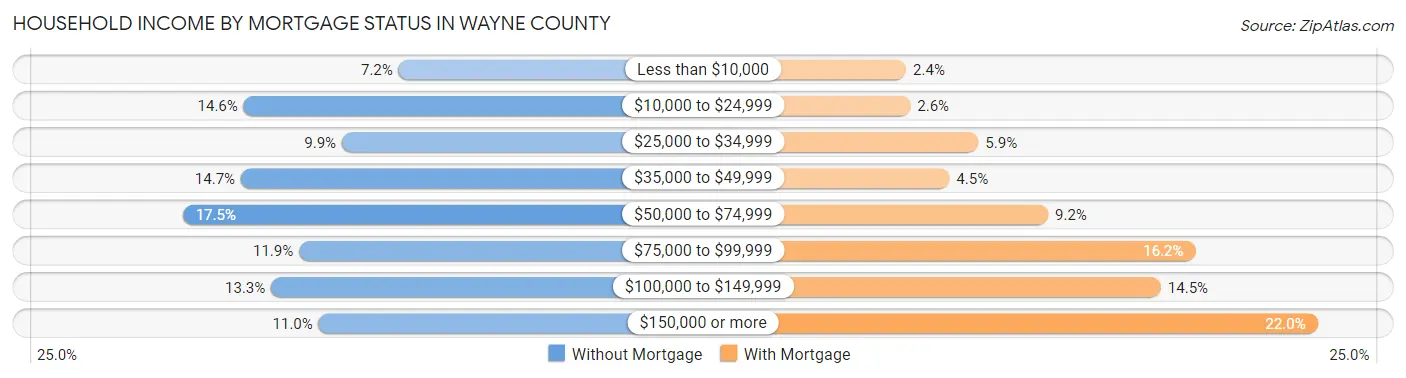
| Household Income | Without Mortgage | With Mortgage |
| Less than $10,000 | 15,249 (7.2%) | 5,500 (2.4%) |
| $10,000 to $24,999 | 30,907 (14.6%) | 5,960 (2.6%) |
| $25,000 to $34,999 | 20,977 (9.9%) | 13,378 (5.9%) |
| $35,000 to $49,999 | 31,179 (14.7%) | 10,218 (4.5%) |
| $50,000 to $74,999 | 37,054 (17.5%) | 20,965 (9.2%) |
| $75,000 to $99,999 | 25,310 (11.9%) | 36,991 (16.2%) |
| $100,000 to $149,999 | 28,128 (13.3%) | 33,241 (14.5%) |
| $150,000 or more | 23,343 (11.0%) | 50,280 (22.0%) |
| Total | 212,147 (100.0%) | 228,554 (100.0%) |
Property Value to Household Income Ratio in Wayne County
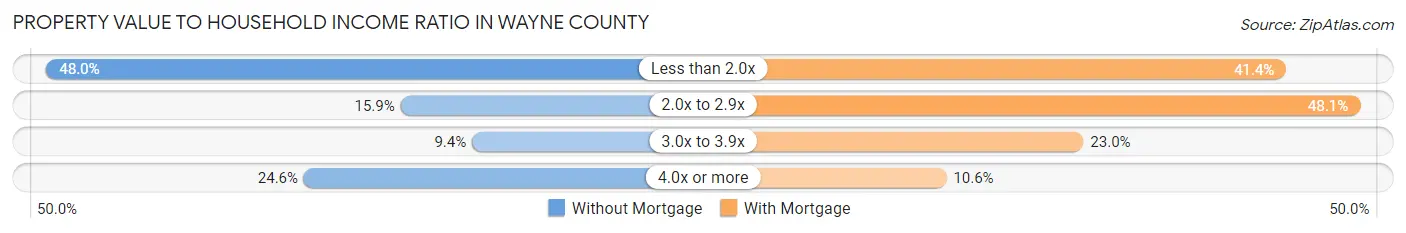
| Value-to-Income Ratio | Without Mortgage | With Mortgage |
| Less than 2.0x | 101,871 (48.0%) | 94,685 (41.4%) |
| 2.0x to 2.9x | 33,641 (15.9%) | 110,032 (48.1%) |
| 3.0x to 3.9x | 19,881 (9.4%) | 52,606 (23.0%) |
| 4.0x or more | 52,274 (24.6%) | 24,186 (10.6%) |
| Total | 212,147 (100.0%) | 228,554 (100.0%) |
Real Estate Taxes by Mortgage Status in Wayne County
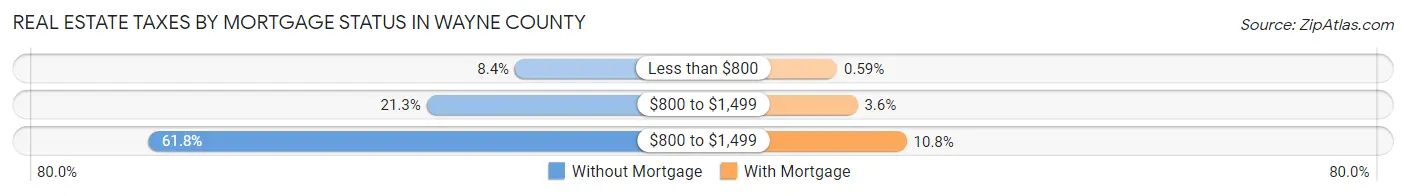
| Property Taxes | Without Mortgage | With Mortgage |
| Less than $800 | 17,705 (8.4%) | 1,344 (0.6%) |
| $800 to $1,499 | 45,118 (21.3%) | 8,154 (3.6%) |
| $800 to $1,499 | 131,163 (61.8%) | 24,560 (10.7%) |
| Total | 212,147 (100.0%) | 228,554 (100.0%) |
Health & Disability in Wayne County
Health Insurance Coverage by Age in Wayne County
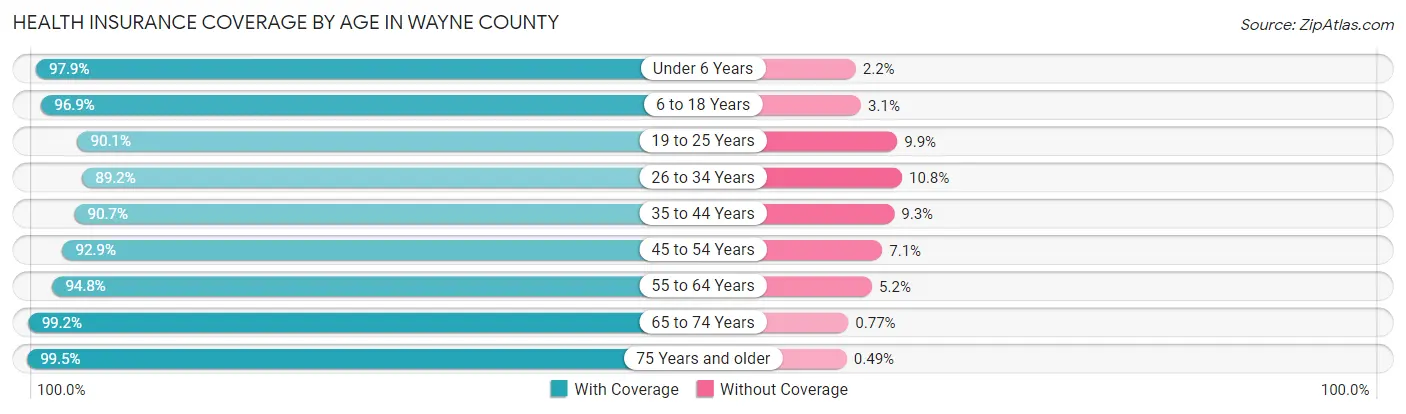
| Age Bracket | With Coverage | Without Coverage |
| Under 6 Years | 134,816 (97.9%) | 2,957 (2.1%) |
| 6 to 18 Years | 293,790 (96.9%) | 9,509 (3.1%) |
| 19 to 25 Years | 145,237 (90.1%) | 15,943 (9.9%) |
| 26 to 34 Years | 202,814 (89.2%) | 24,506 (10.8%) |
| 35 to 44 Years | 190,548 (90.7%) | 19,596 (9.3%) |
| 45 to 54 Years | 207,580 (92.9%) | 15,836 (7.1%) |
| 55 to 64 Years | 219,442 (94.8%) | 12,045 (5.2%) |
| 65 to 74 Years | 166,130 (99.2%) | 1,292 (0.8%) |
| 75 Years and older | 107,678 (99.5%) | 532 (0.5%) |
| Total | 1,668,035 (94.2%) | 102,216 (5.8%) |
Health Insurance Coverage by Citizenship Status in Wayne County
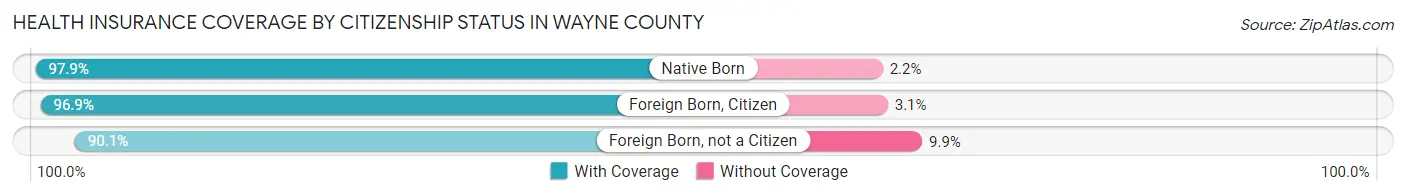
| Citizenship Status | With Coverage | Without Coverage |
| Native Born | 134,816 (97.9%) | 2,957 (2.1%) |
| Foreign Born, Citizen | 293,790 (96.9%) | 9,509 (3.1%) |
| Foreign Born, not a Citizen | 145,237 (90.1%) | 15,943 (9.9%) |
Health Insurance Coverage by Household Income in Wayne County
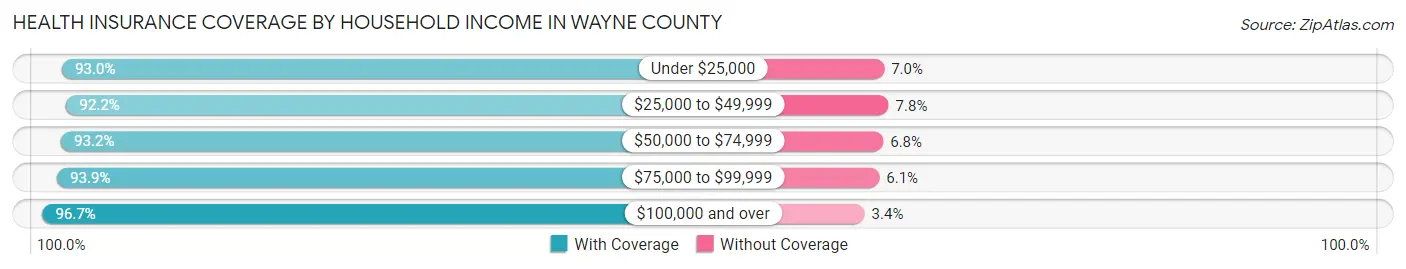
| Household Income | With Coverage | Without Coverage |
| Under $25,000 | 289,732 (93.0%) | 21,842 (7.0%) |
| $25,000 to $49,999 | 310,979 (92.2%) | 26,439 (7.8%) |
| $50,000 to $74,999 | 268,270 (93.2%) | 19,693 (6.8%) |
| $75,000 to $99,999 | 211,304 (93.9%) | 13,721 (6.1%) |
| $100,000 and over | 578,548 (96.7%) | 20,073 (3.4%) |
Public vs Private Health Insurance Coverage by Age in Wayne County
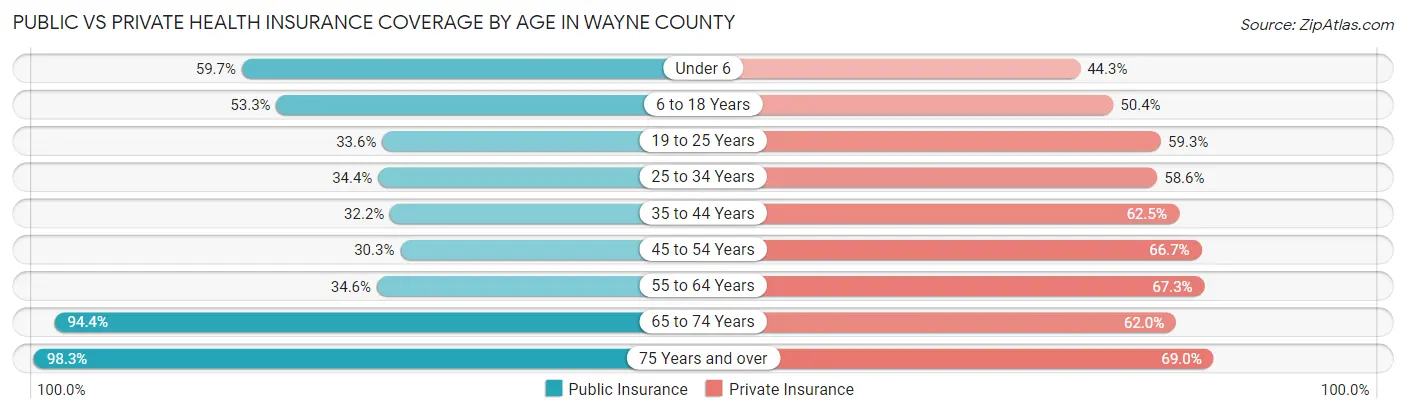
| Age Bracket | Public Insurance | Private Insurance |
| Under 6 | 82,230 (59.7%) | 60,977 (44.3%) |
| 6 to 18 Years | 161,545 (53.3%) | 152,897 (50.4%) |
| 19 to 25 Years | 54,194 (33.6%) | 95,544 (59.3%) |
| 25 to 34 Years | 78,141 (34.4%) | 133,123 (58.6%) |
| 35 to 44 Years | 67,566 (32.2%) | 131,399 (62.5%) |
| 45 to 54 Years | 67,656 (30.3%) | 149,118 (66.7%) |
| 55 to 64 Years | 80,131 (34.6%) | 155,803 (67.3%) |
| 65 to 74 Years | 158,084 (94.4%) | 103,845 (62.0%) |
| 75 Years and over | 106,334 (98.3%) | 74,663 (69.0%) |
| Total | 855,881 (48.3%) | 1,057,369 (59.7%) |
Disability Status by Sex by Age in Wayne County
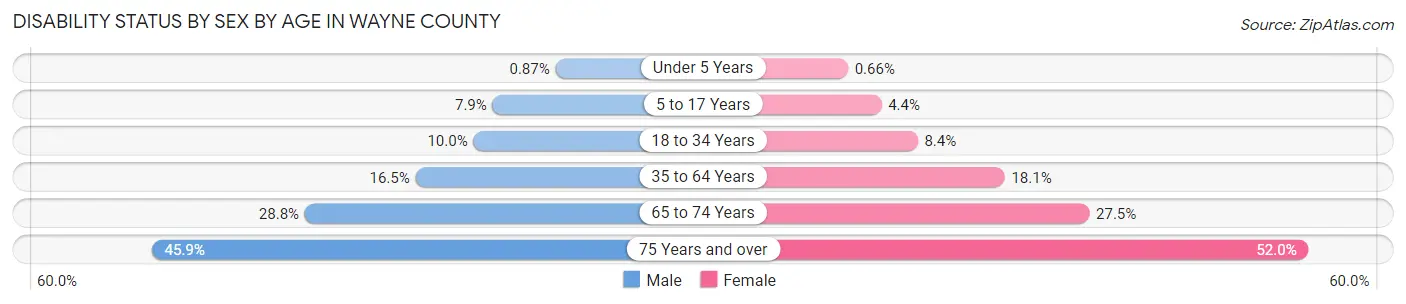
| Age Bracket | Male | Female |
| Under 5 Years | 510 (0.9%) | 366 (0.7%) |
| 5 to 17 Years | 12,331 (7.9%) | 6,564 (4.4%) |
| 18 to 34 Years | 20,307 (10.0%) | 17,441 (8.4%) |
| 35 to 64 Years | 53,013 (16.5%) | 62,172 (18.1%) |
| 65 to 74 Years | 21,832 (28.8%) | 25,218 (27.5%) |
| 75 Years and over | 19,565 (45.9%) | 34,066 (52.0%) |
Disability Class by Sex by Age in Wayne County
Disability Class: Hearing Difficulty
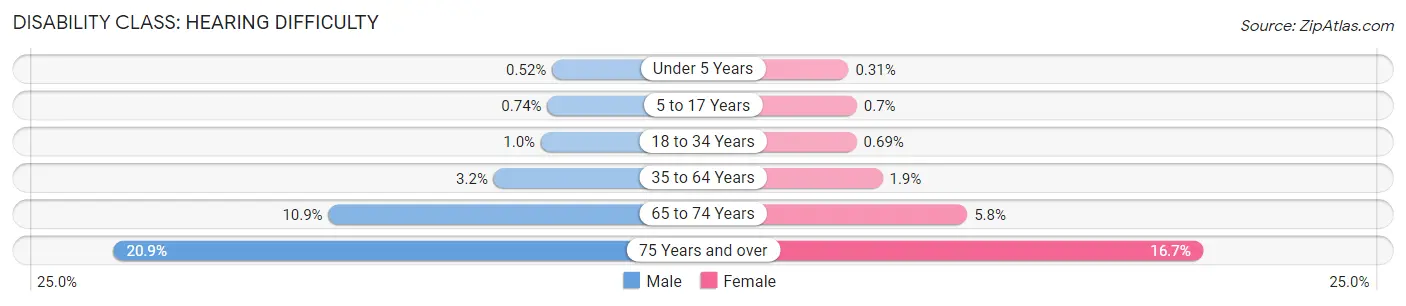
| Age Bracket | Male | Female |
| Under 5 Years | 306 (0.5%) | 173 (0.3%) |
| 5 to 17 Years | 1,160 (0.7%) | 1,050 (0.7%) |
| 18 to 34 Years | 2,118 (1.0%) | 1,436 (0.7%) |
| 35 to 64 Years | 10,401 (3.2%) | 6,486 (1.9%) |
| 65 to 74 Years | 8,268 (10.9%) | 5,333 (5.8%) |
| 75 Years and over | 8,903 (20.9%) | 10,973 (16.7%) |
Disability Class: Vision Difficulty
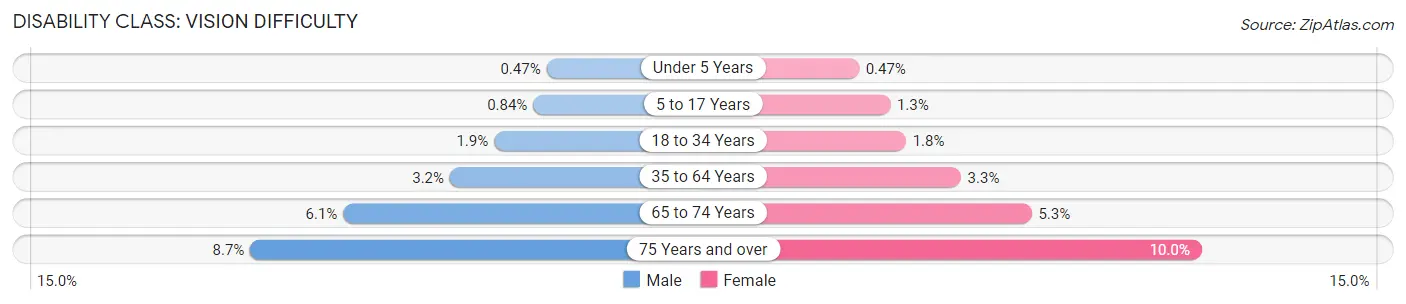
| Age Bracket | Male | Female |
| Under 5 Years | 272 (0.5%) | 259 (0.5%) |
| 5 to 17 Years | 1,313 (0.8%) | 1,996 (1.3%) |
| 18 to 34 Years | 3,909 (1.9%) | 3,676 (1.8%) |
| 35 to 64 Years | 10,188 (3.2%) | 11,356 (3.3%) |
| 65 to 74 Years | 4,649 (6.1%) | 4,839 (5.3%) |
| 75 Years and over | 3,720 (8.7%) | 6,569 (10.0%) |
Disability Class: Cognitive Difficulty
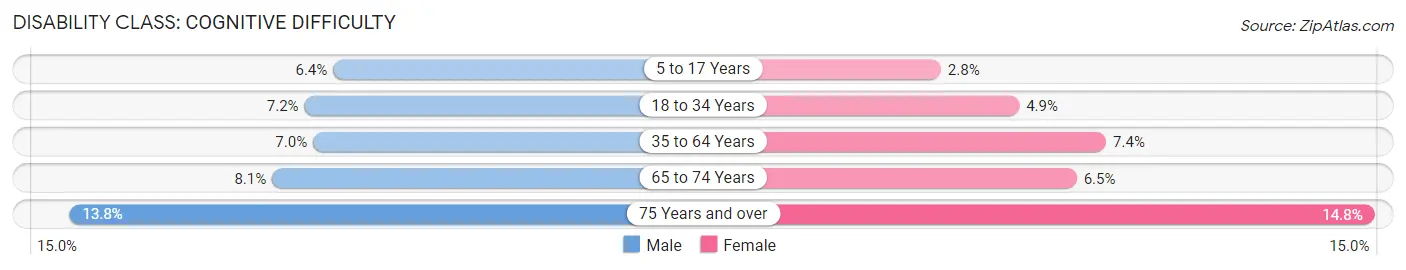
| Age Bracket | Male | Female |
| 5 to 17 Years | 10,029 (6.4%) | 4,128 (2.8%) |
| 18 to 34 Years | 14,624 (7.2%) | 10,221 (4.9%) |
| 35 to 64 Years | 22,447 (7.0%) | 25,258 (7.4%) |
| 65 to 74 Years | 6,151 (8.1%) | 5,991 (6.5%) |
| 75 Years and over | 5,864 (13.8%) | 9,720 (14.8%) |
Disability Class: Ambulatory Difficulty
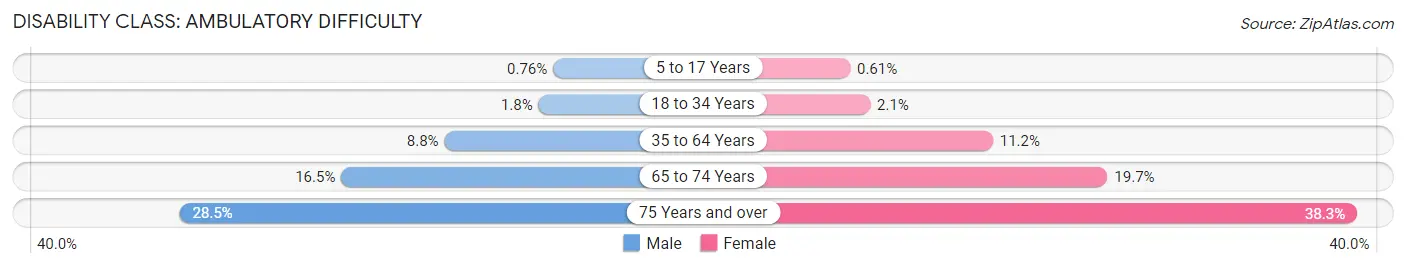
| Age Bracket | Male | Female |
| 5 to 17 Years | 1,191 (0.8%) | 914 (0.6%) |
| 18 to 34 Years | 3,726 (1.8%) | 4,349 (2.1%) |
| 35 to 64 Years | 28,431 (8.8%) | 38,467 (11.2%) |
| 65 to 74 Years | 12,507 (16.5%) | 18,060 (19.7%) |
| 75 Years and over | 12,160 (28.5%) | 25,075 (38.3%) |
Disability Class: Self-Care Difficulty
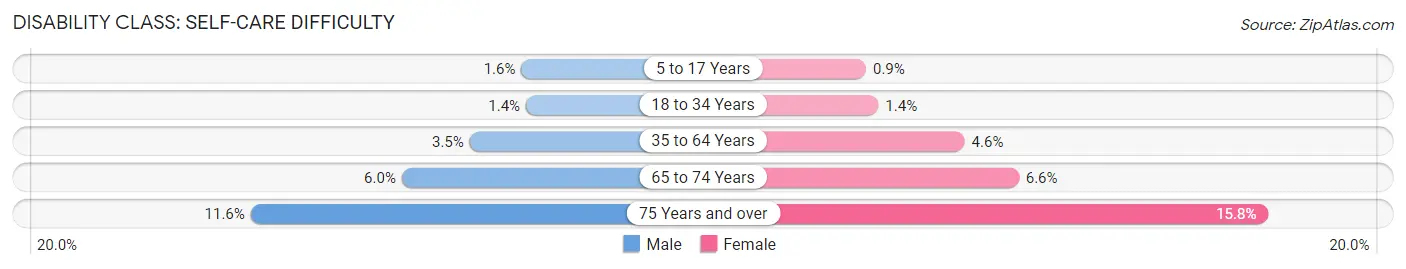
| Age Bracket | Male | Female |
| 5 to 17 Years | 2,438 (1.6%) | 1,339 (0.9%) |
| 18 to 34 Years | 2,824 (1.4%) | 2,817 (1.4%) |
| 35 to 64 Years | 11,197 (3.5%) | 15,656 (4.6%) |
| 65 to 74 Years | 4,553 (6.0%) | 6,017 (6.6%) |
| 75 Years and over | 4,955 (11.6%) | 10,375 (15.8%) |
Technology Access in Wayne County
Computing Device Access in Wayne County
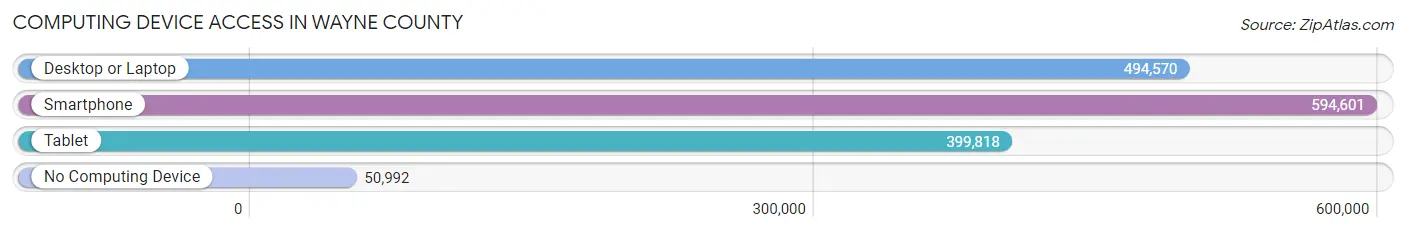
| Device Type | # Households | % Households |
| Desktop or Laptop | 494,570 | 71.8% |
| Smartphone | 594,601 | 86.4% |
| Tablet | 399,818 | 58.1% |
| No Computing Device | 50,992 | 7.4% |
| Total | 688,461 | 100.0% |
Internet Access in Wayne County
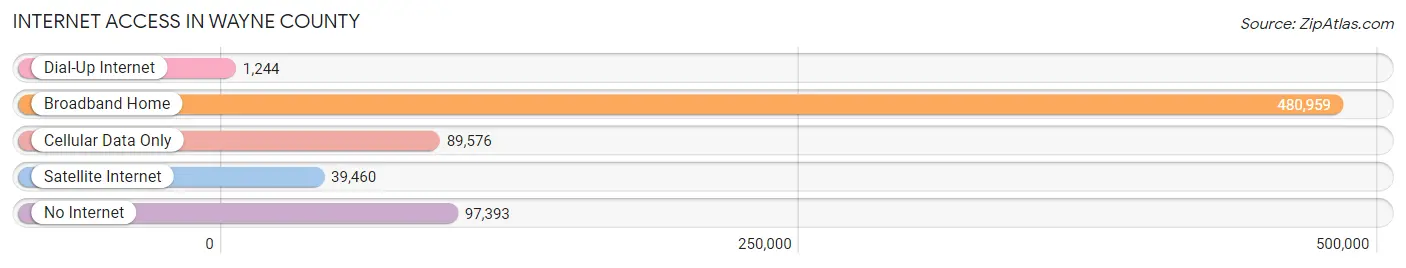
| Internet Type | # Households | % Households |
| Dial-Up Internet | 1,244 | 0.2% |
| Broadband Home | 480,959 | 69.9% |
| Cellular Data Only | 89,576 | 13.0% |
| Satellite Internet | 39,460 | 5.7% |
| No Internet | 97,393 | 14.1% |
| Total | 688,461 | 100.0% |
Wayne County Summary
Wayne County, Michigan is located in the southeastern corner of the state and is part of the Detroit metropolitan area. It is the most populous county in Michigan, with a population of 1,820,584 in 2019. The county seat is Detroit, the largest city in Michigan and the largest city in the Midwest.
History
Wayne County was established in 1815 and named after General Anthony Wayne, a Revolutionary War hero. The county was originally part of the Northwest Territory and was part of the Michigan Territory when it was created in 1805. The county was initially divided into two townships, Detroit and Hamtramck, and was later divided into several other townships.
The county was the site of several important events in Michigan's history. In 1805, the Treaty of Detroit was signed in the county, which ceded the land that is now Michigan to the United States. In 1837, the city of Detroit was incorporated as a city in the county. In 1848, the Michigan Central Railroad was completed, connecting Detroit to Chicago and other cities in the Midwest.
Geography
Wayne County is located in the southeastern corner of Michigan and is bordered by Macomb County to the north, Oakland County to the west, and Washtenaw County to the south. The county covers an area of 673 square miles and is the second-largest county in Michigan.
The county is divided into several townships, including Detroit, Hamtramck, Grosse Pointe, Dearborn, and Livonia. The county is home to several cities, including Detroit, Dearborn, Livonia, and Grosse Pointe. The county is also home to several lakes, including Lake St. Clair, Lake Erie, and Lake Huron.
Economy
Wayne County is home to a diverse economy, with a variety of industries and businesses. The county is home to several major corporations, including Ford Motor Company, General Motors, and Chrysler. The county is also home to several universities, including the University of Michigan, Wayne State University, and Marygrove College.
The county is home to several major airports, including Detroit Metropolitan Airport, Willow Run Airport, and Coleman A. Young International Airport. The county is also home to several major highways, including Interstate 94, Interstate 75, and Interstate 96.
Demographics
As of 2019, Wayne County had a population of 1,820,584, making it the most populous county in Michigan. The population is diverse, with a majority of the population being African American (53.3%), followed by White (37.2%), Hispanic (4.7%), and Asian (2.7%). The median household income in the county is $45,945, and the median home value is $133,400.
Conclusion
Wayne County, Michigan is a diverse and vibrant county located in the southeastern corner of the state. The county is home to a variety of industries and businesses, and is the most populous county in Michigan. The county is home to several major cities, universities, airports, and highways, and has a diverse population with a majority of African Americans.
Common Questions
What is Per Capita Income in Wayne County?
Per Capita income in Wayne County is $32,643.
What is the Median Family Income in Wayne County?
Median Family Income in Wayne County is $74,650.
What is the Median Household income in Wayne County?
Median Household Income in Wayne County is $57,223.
What is Income or Wage Gap in Wayne County?
Income or Wage Gap in Wayne County is 25.3%.
Women in Wayne County earn 74.7 cents for every dollar earned by a man.
What is Family Income Deficit in Wayne County?
Family Income Deficit in Wayne County is $12,336.
Families that are below poverty line in Wayne County earn $12,336 less on average than the poverty threshold level.
What is Inequality or Gini Index in Wayne County?
Inequality or Gini Index in Wayne County is 0.49.
What is the Total Population of Wayne County?
Total Population of Wayne County is 1,781,641.
What is the Total Male Population of Wayne County?
Total Male Population of Wayne County is 864,475.
What is the Total Female Population of Wayne County?
Total Female Population of Wayne County is 917,166.
What is the Ratio of Males per 100 Females in Wayne County?
There are 94.26 Males per 100 Females in Wayne County.
What is the Ratio of Females per 100 Males in Wayne County?
There are 106.10 Females per 100 Males in Wayne County.
What is the Median Population Age in Wayne County?
Median Population Age in Wayne County is 37.7 Years.
What is the Average Family Size in Wayne County
Average Family Size in Wayne County is 3.4 People.
What is the Average Household Size in Wayne County
Average Household Size in Wayne County is 2.6 People.
How Large is the Labor Force in Wayne County?
There are 836,649 People in the Labor Forcein in Wayne County.
What is the Percentage of People in the Labor Force in Wayne County?
59.4% of People are in the Labor Force in Wayne County.
What is the Unemployment Rate in Wayne County?
Unemployment Rate in Wayne County is 9.0%.