Area Code 313 Map & Demographics
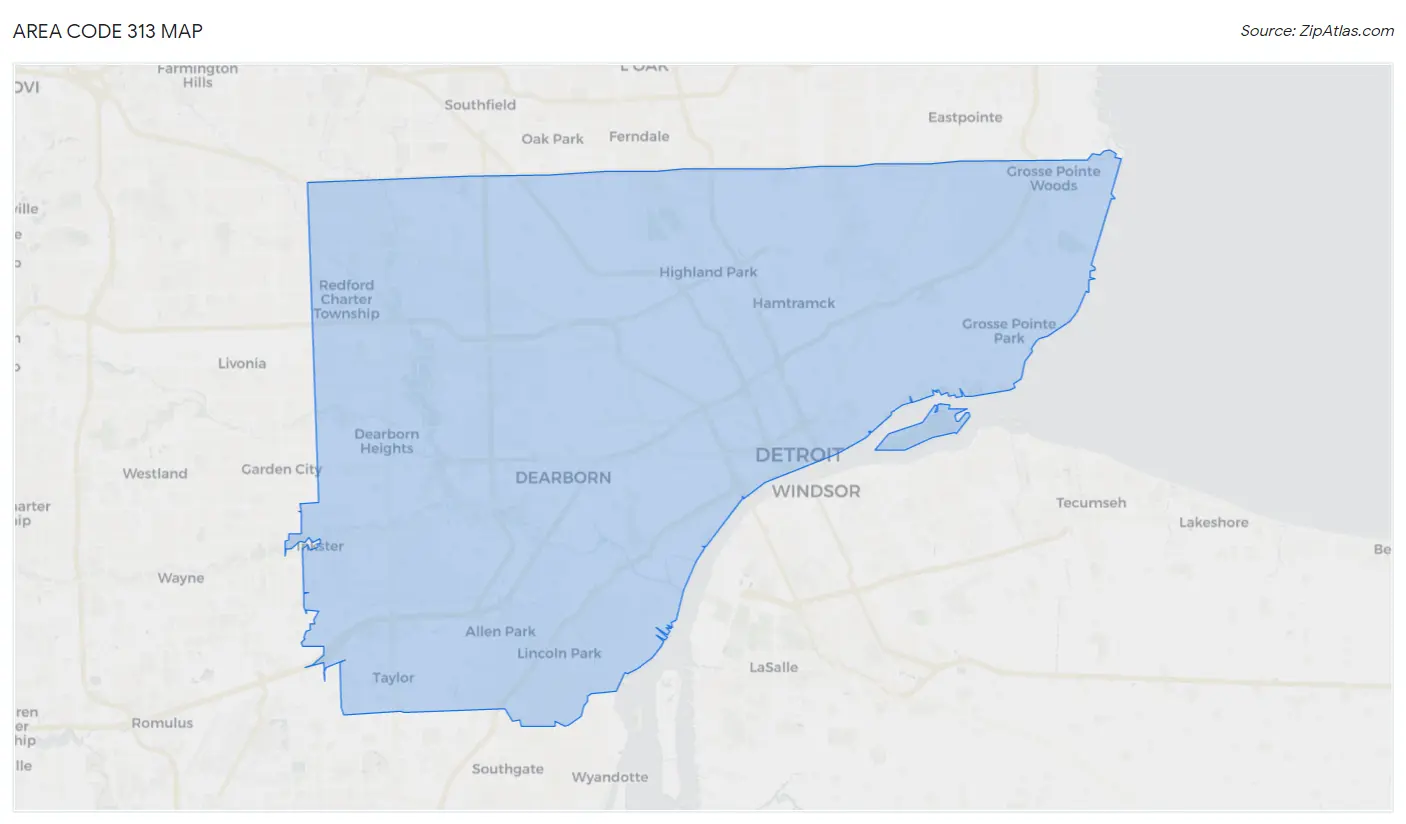
Area Code 313 Map
Area Code 313 Overview
$33,280
PER CAPITA INCOME
$73,028
AVG FAMILY INCOME
$57,199
AVG HOUSEHOLD INCOME
23.7%
WAGE / INCOME GAP [ % ]
76.3¢/ $1
WAGE / INCOME GAP [ $ ]
$11,850
FAMILY INCOME DEFICIT
26.35
INEQUALITY / GINI INDEX
1,489,185
TOTAL POPULATION
722,058
MALE POPULATION
767,127
FEMALE POPULATION
94.12
MALES / 100 FEMALES
106.24
FEMALES / 100 MALES
37.7
MEDIAN AGE
3.4
AVG FAMILY SIZE
2.5
AVG HOUSEHOLD SIZE
690,637
LABOR FORCE [ PEOPLE ]
58.5%
PERCENT IN LABOR FORCE
10.0%
UNEMPLOYMENT RATE
Income in Area Code 313
Income Overview in Area Code 313
Per Capita Income in Area Code 313 is $33,280, while median incomes of families and households are $73,028 and $57,199 respectively.
| Characteristic | Number | Measure |
| Per Capita Income | 1,489,185 | $33,280 |
| Median Family Income | 332,055 | $73,028 |
| Mean Family Income | 332,055 | $5,315,098 |
| Median Household Income | 587,638 | $57,199 |
| Mean Household Income | 587,638 | $4,326,018 |
| Income Deficit | 332,055 | $11,850 |
| Wage / Income Gap (%) | 1,489,185 | 23.66% |
| Wage / Income Gap ($) | 1,489,185 | 76.34¢ per $1 |
| Gini / Inequality Index | 1,489,185 | 26.35 |
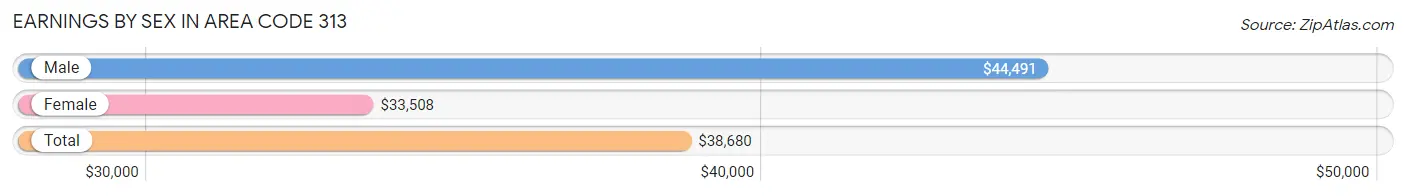
Earnings by Sex in Area Code 313
Average Earnings in Area Code 313 are $38,680, $44,491 for men and $33,508 for women, a difference of 24.7%.
| Sex | Number | Average Earnings |
| Male | 361,061 (50.7%) | $44,491 |
| Female | 350,364 (49.2%) | $33,508 |
| Total | 711,425 (100.0%) | $38,680 |
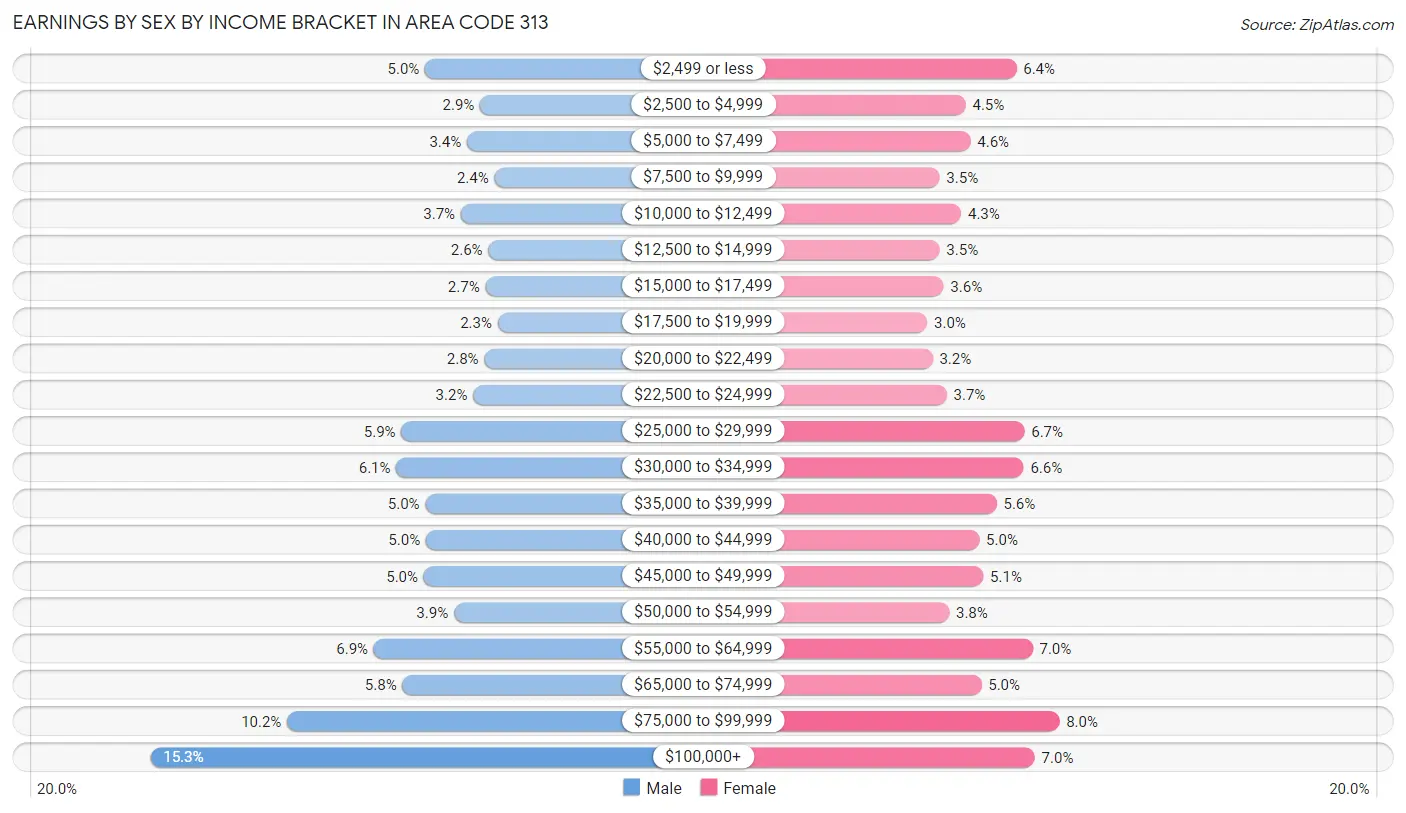
Earnings by Sex by Income Bracket in Area Code 313
The most common earnings brackets in Area Code 313 are $100,000+ for men (55,219 | 15.3%) and $75,000 to $99,999 for women (27,879 | 8.0%).
| Income | Male | Female |
| $2,499 or less | 18,020 (5.0%) | 22,254 (6.4%) |
| $2,500 to $4,999 | 10,568 (2.9%) | 15,599 (4.4%) |
| $5,000 to $7,499 | 12,343 (3.4%) | 16,221 (4.6%) |
| $7,500 to $9,999 | 8,640 (2.4%) | 12,162 (3.5%) |
| $10,000 to $12,499 | 13,183 (3.6%) | 14,995 (4.3%) |
| $12,500 to $14,999 | 9,459 (2.6%) | 12,146 (3.5%) |
| $15,000 to $17,499 | 9,865 (2.7%) | 12,670 (3.6%) |
| $17,500 to $19,999 | 8,180 (2.3%) | 10,549 (3.0%) |
| $20,000 to $22,499 | 9,988 (2.8%) | 11,246 (3.2%) |
| $22,500 to $24,999 | 11,533 (3.2%) | 13,110 (3.7%) |
| $25,000 to $29,999 | 21,242 (5.9%) | 23,295 (6.7%) |
| $30,000 to $34,999 | 21,927 (6.1%) | 23,198 (6.6%) |
| $35,000 to $39,999 | 17,978 (5.0%) | 19,670 (5.6%) |
| $40,000 to $44,999 | 17,891 (5.0%) | 17,386 (5.0%) |
| $45,000 to $49,999 | 18,199 (5.0%) | 17,893 (5.1%) |
| $50,000 to $54,999 | 14,104 (3.9%) | 13,411 (3.8%) |
| $55,000 to $64,999 | 24,937 (6.9%) | 24,372 (7.0%) |
| $65,000 to $74,999 | 21,099 (5.8%) | 17,645 (5.0%) |
| $75,000 to $99,999 | 36,686 (10.2%) | 27,879 (8.0%) |
| $100,000+ | 55,219 (15.3%) | 24,663 (7.0%) |
| Total | 361,061 (100.0%) | 350,364 (100.0%) |
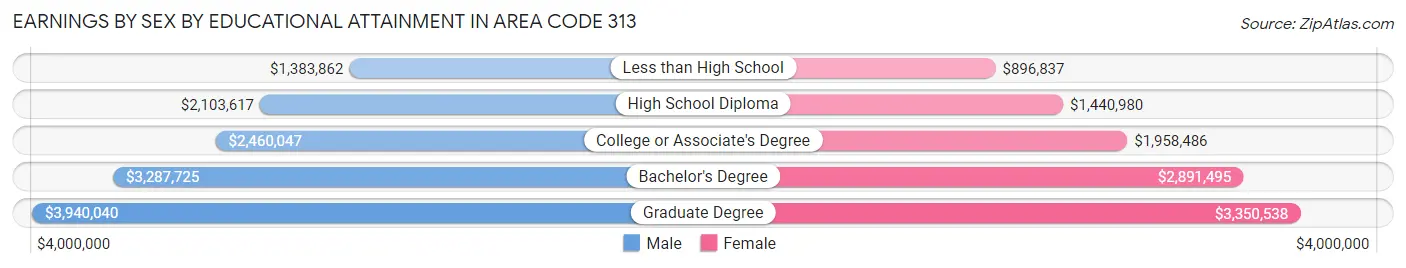
Earnings by Sex by Educational Attainment in Area Code 313
Average earnings in Area Code 313 are $2,791,459 for men and $2,148,238 for women, a difference of 23.0%. Men with an educational attainment of graduate degree enjoy the highest average annual earnings of $3,940,040, while those with less than high school education earn the least with $1,383,862. Women with an educational attainment of graduate degree earn the most with the average annual earnings of $3,350,538, while those with less than high school education have the smallest earnings of $896,837.
| Educational Attainment | Male Income | Female Income |
| Less than High School | $1,383,862 | $896,837 |
| High School Diploma | $2,103,617 | $1,440,980 |
| College or Associate's Degree | $2,460,047 | $1,958,486 |
| Bachelor's Degree | $3,287,725 | $2,891,495 |
| Graduate Degree | $3,940,040 | $3,350,538 |
| Total | $2,791,459 | $2,148,238 |
Family Income in Area Code 313
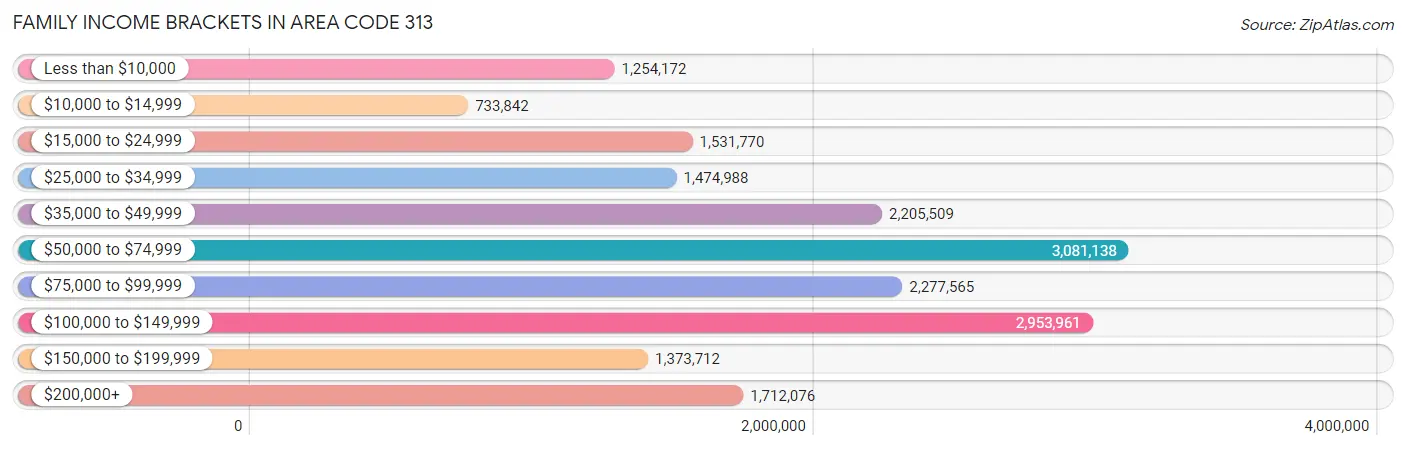
Family Income Brackets in Area Code 313
According to the Area Code 313 family income data, there are 3,081,138 families falling into the $50,000 to $74,999 income range, which is the most common income bracket and makes up 927.9% of all families. Conversely, the $10,000 to $14,999 income bracket is the least frequent group with only 733,842 families (221.0%) belonging to this category.
| Income Bracket | # Families | % Families |
| Less than $10,000 | 1,254,172 | 377.7% |
| $10,000 to $14,999 | 733,842 | 221.0% |
| $15,000 to $24,999 | 1,531,770 | 461.3% |
| $25,000 to $34,999 | 1,474,988 | 444.2% |
| $35,000 to $49,999 | 2,205,509 | 664.2% |
| $50,000 to $74,999 | 3,081,138 | 927.9% |
| $75,000 to $99,999 | 2,277,565 | 685.9% |
| $100,000 to $149,999 | 2,953,961 | 889.6% |
| $150,000 to $199,999 | 1,373,712 | 413.7% |
| $200,000+ | 1,712,076 | 515.6% |
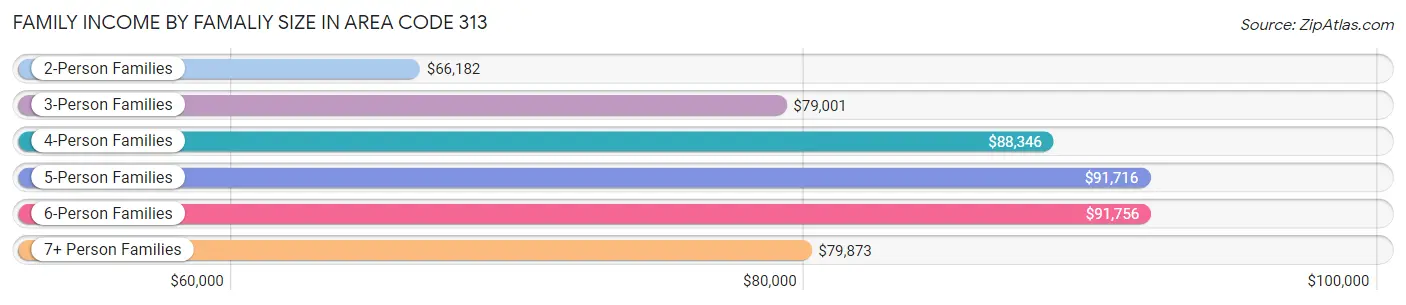
Family Income by Famaliy Size in Area Code 313
6-person families (12,959 | 3.9%) account for the highest median family income in Area Code 313 with $91,756 per family, while 2-person families (150,700 | 45.4%) have the highest median income of $33,091 per family member.
| Income Bracket | # Families | Median Income |
| 2-Person Families | 150,700 (45.4%) | $66,182 |
| 3-Person Families | 76,844 (23.1%) | $79,001 |
| 4-Person Families | 54,984 (16.6%) | $88,346 |
| 5-Person Families | 26,767 (8.1%) | $91,716 |
| 6-Person Families | 12,959 (3.9%) | $91,756 |
| 7+ Person Families | 9,801 (2.9%) | $79,873 |
| Total | 332,055 (100.0%) | $73,028 |
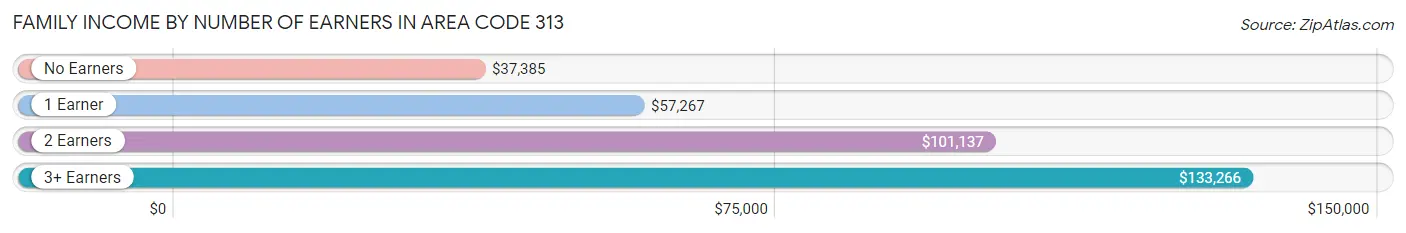
Family Income by Number of Earners in Area Code 313
The median family income in Area Code 313 is $73,028, with families comprising 3+ earners (35,743) having the highest median family income of $133,266, while families with no earners (57,018) have the lowest median family income of $37,385, accounting for 10.8% and 17.2% of families, respectively.
| Number of Earners | # Families | Median Income |
| No Earners | 57,018 (17.2%) | $37,385 |
| 1 Earner | 125,243 (37.7%) | $57,267 |
| 2 Earners | 114,051 (34.4%) | $101,137 |
| 3+ Earners | 35,743 (10.8%) | $133,266 |
| Total | 332,055 (100.0%) | $73,028 |
Household Income in Area Code 313
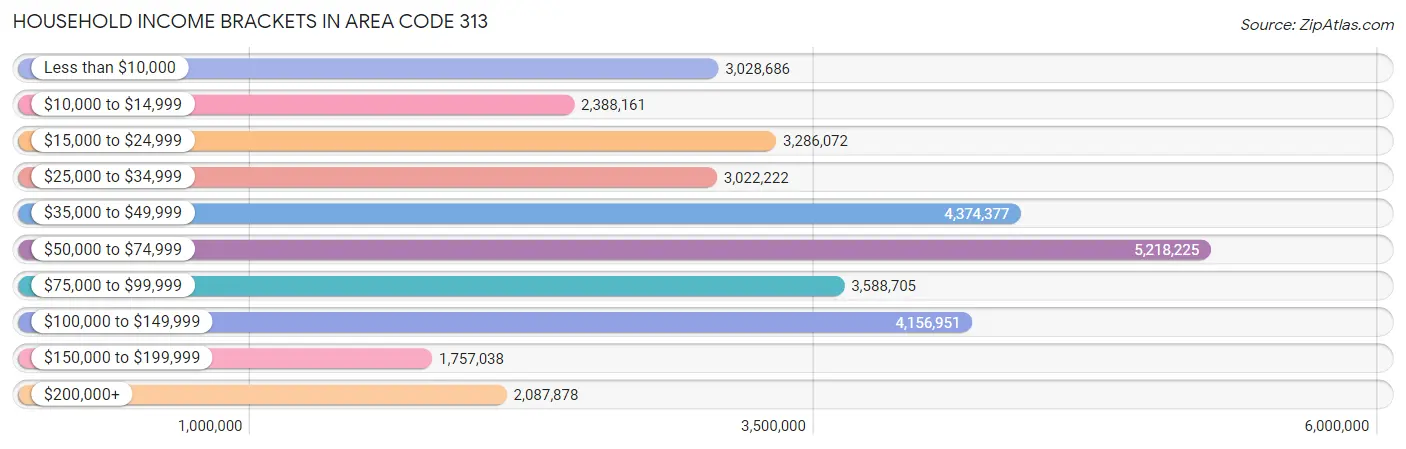
Household Income Brackets in Area Code 313
With 5,218,225 households falling in the category, the $50,000 to $74,999 income range is the most frequent in Area Code 313, accounting for 888.0% of all households. In contrast, only 1,757,038 households (299.0%) fall into the $150,000 to $199,999 income bracket, making it the least populous group.
| Income Bracket | # Households | % Households |
| Less than $10,000 | 3,028,686 | 515.4% |
| $10,000 to $14,999 | 2,388,161 | 406.4% |
| $15,000 to $24,999 | 3,286,072 | 559.2% |
| $25,000 to $34,999 | 3,022,222 | 514.3% |
| $35,000 to $49,999 | 4,374,377 | 744.4% |
| $50,000 to $74,999 | 5,218,225 | 888.0% |
| $75,000 to $99,999 | 3,588,705 | 610.7% |
| $100,000 to $149,999 | 4,156,951 | 707.4% |
| $150,000 to $199,999 | 1,757,038 | 299.0% |
| $200,000+ | 2,087,878 | 355.3% |
Household Income by Householder Age in Area Code 313
The median household income in Area Code 313 is $57,199, with the highest median household income of $65,125 found in the 45 to 64 years age bracket for the primary householder. A total of 220,569 households (37.5%) fall into this category. Meanwhile, the 15 to 24 years age bracket for the primary householder has the lowest median household income of $38,598, with 18,202 households (3.1%) in this group.
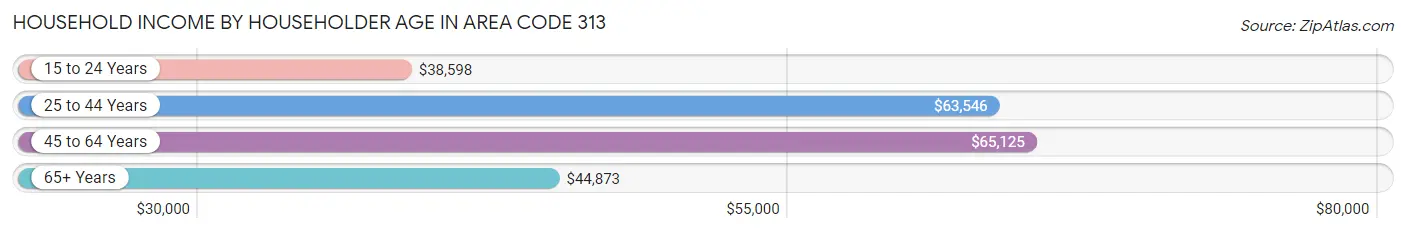
| Income Bracket | # Households | Median Income |
| 15 to 24 Years | 18,202 (3.1%) | $38,598 |
| 25 to 44 Years | 191,756 (32.6%) | $63,546 |
| 45 to 64 Years | 220,569 (37.5%) | $65,125 |
| 65+ Years | 157,111 (26.7%) | $44,873 |
| Total | 587,638 (100.0%) | $57,199 |
Poverty in Area Code 313
Income Below Poverty by Sex and Age in Area Code 313
With 20.6% poverty level for males and 23.0% for females among the residents of Area Code 313, under 5 year old males and 5 year old females are the most vulnerable to poverty, with 16,607 males (34.2%) and 3,328 females (34.4%) in their respective age groups living below the poverty level.
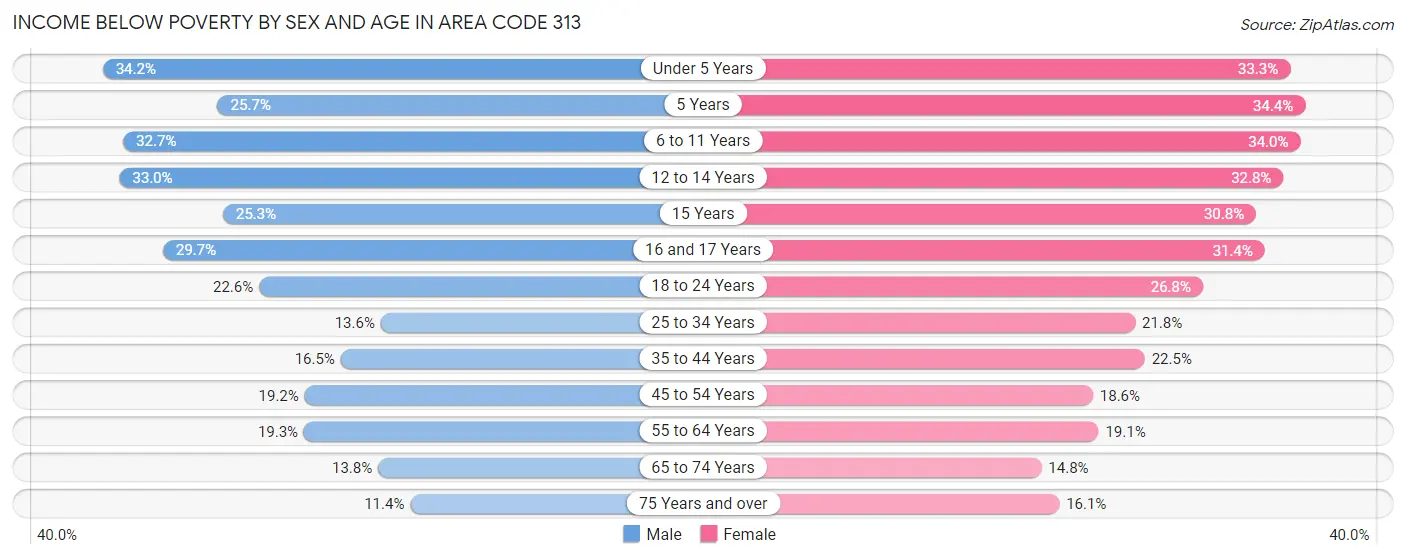
| Age Bracket | Male | Female |
| Under 5 Years | 16,607 (34.2%) | 15,326 (33.3%) |
| 5 Years | 2,635 (25.7%) | 3,328 (34.4%) |
| 6 to 11 Years | 18,444 (32.7%) | 18,273 (34.0%) |
| 12 to 14 Years | 10,020 (33.0%) | 9,332 (32.8%) |
| 15 Years | 2,647 (25.3%) | 3,002 (30.7%) |
| 16 and 17 Years | 5,786 (29.7%) | 6,092 (31.4%) |
| 18 to 24 Years | 14,898 (22.6%) | 17,677 (26.8%) |
| 25 to 34 Years | 14,930 (13.6%) | 24,574 (21.8%) |
| 35 to 44 Years | 13,980 (16.5%) | 20,476 (22.5%) |
| 45 to 54 Years | 16,842 (19.2%) | 17,226 (18.6%) |
| 55 to 64 Years | 17,638 (19.3%) | 18,752 (19.1%) |
| 65 to 74 Years | 8,546 (13.8%) | 11,245 (14.8%) |
| 75 Years and over | 3,964 (11.4%) | 8,870 (16.1%) |
| Total | 146,937 (20.6%) | 174,173 (23.0%) |
Income Above Poverty by Sex and Age in Area Code 313
According to the poverty statistics in Area Code 313, males aged 75 years and over and females aged 65 to 74 years are the age groups that are most secure financially, with 88.6% of males and 85.2% of females in these age groups living above the poverty line.
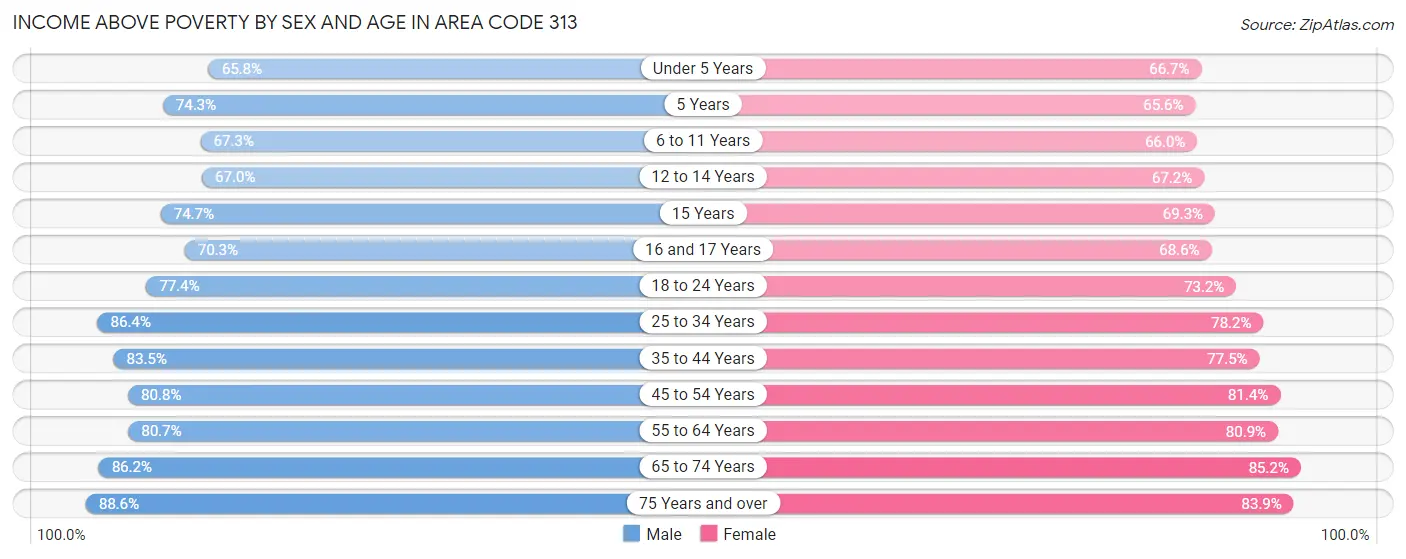
| Age Bracket | Male | Female |
| Under 5 Years | 31,954 (65.8%) | 30,726 (66.7%) |
| 5 Years | 7,628 (74.3%) | 6,347 (65.6%) |
| 6 to 11 Years | 37,993 (67.3%) | 35,413 (66.0%) |
| 12 to 14 Years | 20,376 (67.0%) | 19,142 (67.2%) |
| 15 Years | 7,824 (74.7%) | 6,760 (69.3%) |
| 16 and 17 Years | 13,668 (70.3%) | 13,310 (68.6%) |
| 18 to 24 Years | 51,059 (77.4%) | 48,280 (73.2%) |
| 25 to 34 Years | 95,148 (86.4%) | 88,284 (78.2%) |
| 35 to 44 Years | 70,599 (83.5%) | 70,567 (77.5%) |
| 45 to 54 Years | 70,827 (80.8%) | 75,196 (81.4%) |
| 55 to 64 Years | 73,926 (80.7%) | 79,613 (80.9%) |
| 65 to 74 Years | 53,561 (86.2%) | 64,638 (85.2%) |
| 75 Years and over | 30,914 (88.6%) | 46,081 (83.9%) |
| Total | 565,477 (79.4%) | 584,357 (77.0%) |
Income Below Poverty Among Married-Couple Families in Area Code 313
The poverty statistics for married-couple families in Area Code 313 show that 8.9% or 17,131 of the total 192,254 families live below the poverty line. Families with 5 or more children have the highest poverty rate of 45.2%, comprising of 1,210 families. On the other hand, families with no children have the lowest poverty rate of 4.8%, which includes 5,381 families.
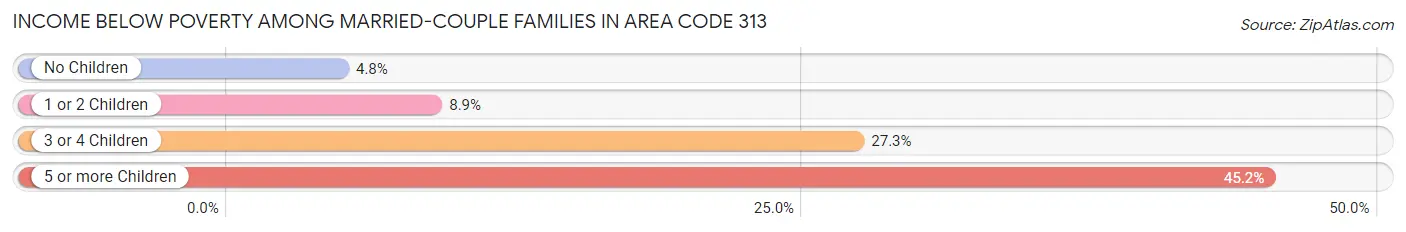
| Children | Above Poverty | Below Poverty |
| No Children | 106,088 (95.2%) | 5,381 (4.8%) |
| 1 or 2 Children | 53,323 (91.1%) | 5,202 (8.9%) |
| 3 or 4 Children | 14,244 (72.7%) | 5,338 (27.3%) |
| 5 or more Children | 1,468 (54.8%) | 1,210 (45.2%) |
| Total | 175,123 (91.1%) | 17,131 (8.9%) |
Income Below Poverty Among Single-Parent Households in Area Code 313
According to the poverty data in Area Code 313, 19.0% or 6,200 single-father households and 30.3% or 32,474 single-mother households are living below the poverty line. Among single-father households, those with 3 or 4 children have the highest poverty rate, with 1,108 households (51.3%) experiencing poverty. Likewise, among single-mother households, those with 5 or more children have the highest poverty rate, with 1,597 households (74.4%) falling below the poverty line.
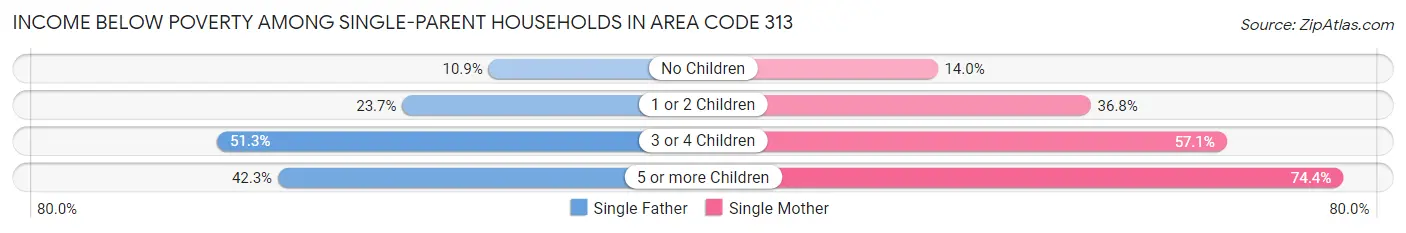
| Children | Single Father | Single Mother |
| No Children | 1,861 (10.9%) | 6,215 (14.0%) |
| 1 or 2 Children | 3,073 (23.7%) | 18,012 (36.8%) |
| 3 or 4 Children | 1,108 (51.3%) | 6,650 (57.1%) |
| 5 or more Children | 158 (42.2%) | 1,597 (74.4%) |
| Total | 6,200 (19.0%) | 32,474 (30.3%) |
Income Below Poverty Among Married-Couple vs Single-Parent Households in Area Code 313
The poverty data for Area Code 313 shows that 17,131 of the married-couple family households (8.9%) and 38,674 of the single-parent households (27.7%) are living below the poverty level. Within the married-couple family households, those with 5 or more children have the highest poverty rate, with 1,210 households (45.2%) falling below the poverty line. Among the single-parent households, those with 5 or more children have the highest poverty rate, with 1,755 household (69.6%) living below poverty.
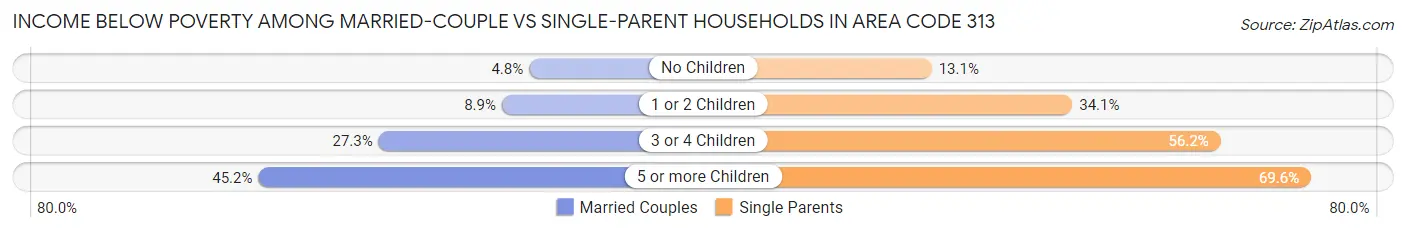
| Children | Married-Couple Families | Single-Parent Households |
| No Children | 5,381 (4.8%) | 8,076 (13.1%) |
| 1 or 2 Children | 5,202 (8.9%) | 21,085 (34.1%) |
| 3 or 4 Children | 5,338 (27.3%) | 7,758 (56.2%) |
| 5 or more Children | 1,210 (45.2%) | 1,755 (69.6%) |
| Total | 17,131 (8.9%) | 38,674 (27.7%) |
Race in Area Code 313
The most populous races in Area Code 313 are White / Caucasian (669,240 | 44.9%), Black / African American (662,711 | 44.5%), and Hispanic or Latino (92,129 | 6.2%).
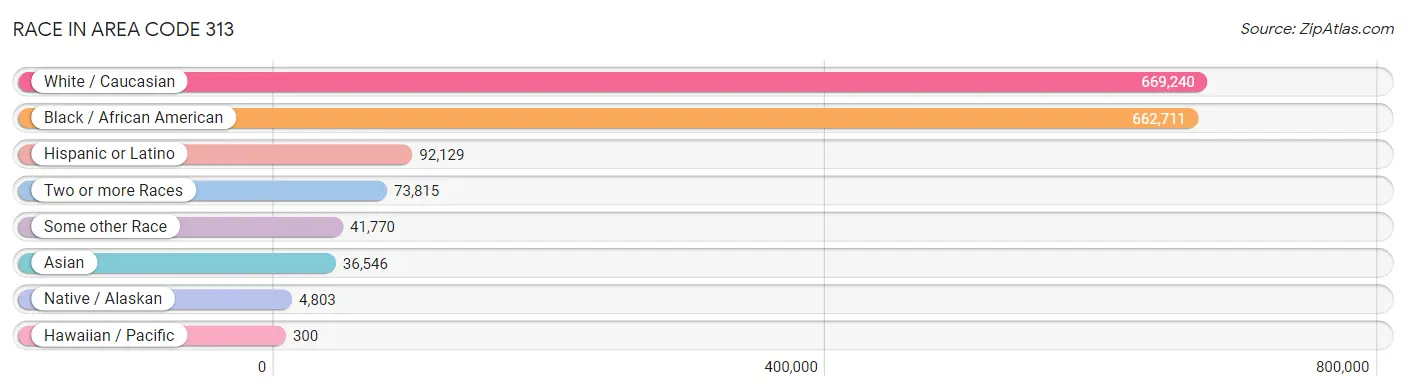
| Race | # Population | % Population |
| Asian | 36,546 | 2.5% |
| Black / African American | 662,711 | 44.5% |
| Hawaiian / Pacific | 300 | 0.0% |
| Hispanic or Latino | 92,129 | 6.2% |
| Native / Alaskan | 4,803 | 0.3% |
| White / Caucasian | 669,240 | 44.9% |
| Two or more Races | 73,815 | 5.0% |
| Some other Race | 41,770 | 2.8% |
| Total | 1,489,185 | 100.0% |
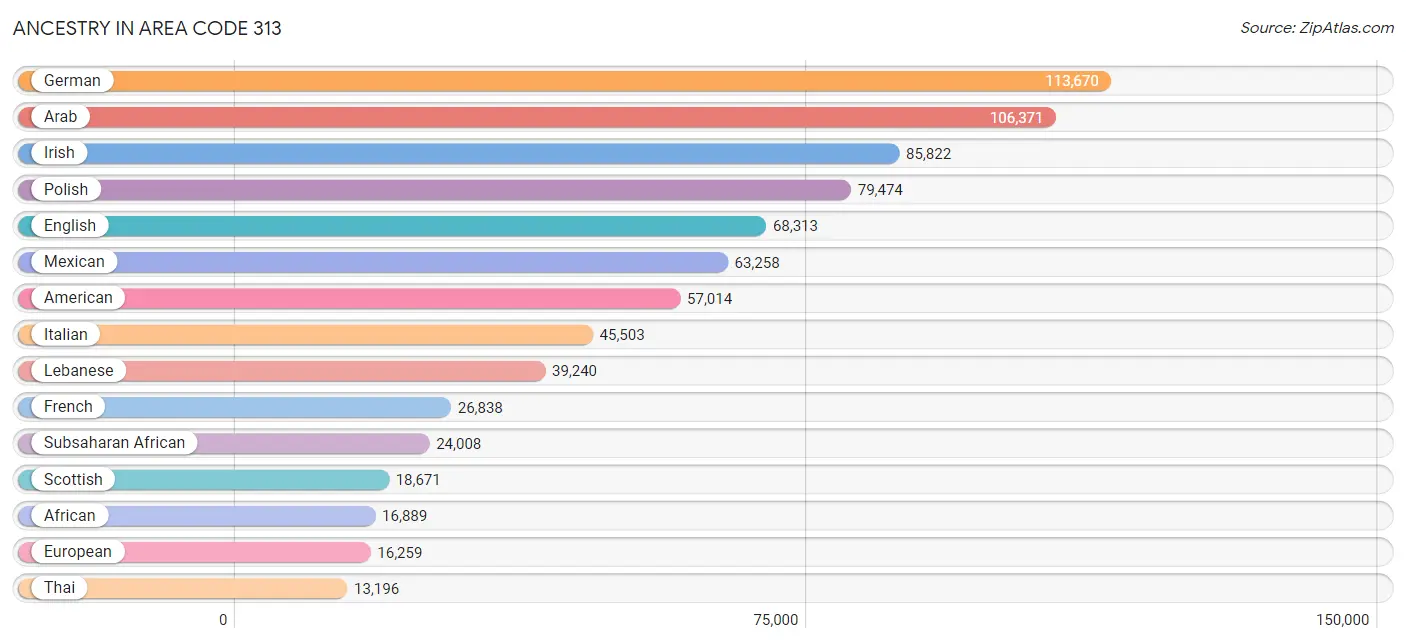
Ancestry in Area Code 313
The most populous ancestries reported in Area Code 313 are German (113,670 | 7.6%), Arab (106,371 | 7.1%), Irish (85,822 | 5.8%), Polish (79,474 | 5.3%), and English (68,313 | 4.6%), together accounting for 30.5% of all Area Code 313 residents.
| Ancestry | # Population | % Population |
| Afghan | 292 | 0.0% |
| African | 16,889 | 1.1% |
| Alaska Native | 6 | 0.0% |
| Alaskan Athabascan | 31 | 0.0% |
| Albanian | 4,164 | 0.3% |
| Alsatian | 14 | 0.0% |
| American | 57,014 | 3.8% |
| Apache | 159 | 0.0% |
| Arab | 106,371 | 7.1% |
| Arapaho | 27 | 0.0% |
| Argentinean | 389 | 0.0% |
| Armenian | 2,462 | 0.2% |
| Assyrian / Chaldean / Syriac | 1,413 | 0.1% |
| Australian | 440 | 0.0% |
| Austrian | 1,895 | 0.1% |
| Bahamian | 315 | 0.0% |
| Bangladeshi | 455 | 0.0% |
| Barbadian | 77 | 0.0% |
| Basque | 21 | 0.0% |
| Belgian | 2,682 | 0.2% |
| Belizean | 57 | 0.0% |
| Bermudan | 72 | 0.0% |
| Bhutanese | 2,155 | 0.1% |
| Blackfeet | 1,300 | 0.1% |
| Brazilian | 891 | 0.1% |
| British | 4,391 | 0.3% |
| British West Indian | 162 | 0.0% |
| Bulgarian | 394 | 0.0% |
| Burmese | 3,448 | 0.2% |
| Cajun | 9 | 0.0% |
| Cambodian | 35 | 0.0% |
| Canadian | 4,028 | 0.3% |
| Cape Verdean | 42 | 0.0% |
| Carpatho Rusyn | 157 | 0.0% |
| Celtic | 106 | 0.0% |
| Central American | 4,953 | 0.3% |
| Central American Indian | 425 | 0.0% |
| Cherokee | 3,462 | 0.2% |
| Chickasaw | 4 | 0.0% |
| Chilean | 134 | 0.0% |
| Chinese | 13 | 0.0% |
| Chippewa | 1,816 | 0.1% |
| Choctaw | 487 | 0.0% |
| Colombian | 791 | 0.1% |
| Colville | 25 | 0.0% |
| Costa Rican | 71 | 0.0% |
| Cree | 23 | 0.0% |
| Creek | 256 | 0.0% |
| Croatian | 1,732 | 0.1% |
| Crow | 54 | 0.0% |
| Cuban | 2,352 | 0.2% |
| Cypriot | 37 | 0.0% |
| Czech | 2,071 | 0.1% |
| Czechoslovakian | 1,062 | 0.1% |
| Danish | 1,695 | 0.1% |
| Delaware | 46 | 0.0% |
| Dominican | 2,210 | 0.2% |
| Dutch | 9,700 | 0.6% |
| Dutch West Indian | 48 | 0.0% |
| Eastern European | 3,044 | 0.2% |
| Ecuadorian | 374 | 0.0% |
| Egyptian | 885 | 0.1% |
| English | 68,313 | 4.6% |
| Estonian | 164 | 0.0% |
| Ethiopian | 651 | 0.0% |
| European | 16,259 | 1.1% |
| Filipino | 202 | 0.0% |
| Finnish | 5,586 | 0.4% |
| French | 26,838 | 1.8% |
| French American Indian | 308 | 0.0% |
| French Canadian | 9,547 | 0.6% |
| German | 113,670 | 7.6% |
| German Russian | 16 | 0.0% |
| Ghanaian | 287 | 0.0% |
| Greek | 6,029 | 0.4% |
| Guamanian / Chamorro | 235 | 0.0% |
| Guatemalan | 1,387 | 0.1% |
| Guyanese | 157 | 0.0% |
| Haitian | 749 | 0.1% |
| Honduran | 2,068 | 0.1% |
| Houma | 15 | 0.0% |
| Hungarian | 10,550 | 0.7% |
| Icelander | 90 | 0.0% |
| Indian (Asian) | 4,976 | 0.3% |
| Indonesian | 53 | 0.0% |
| Inupiat | 9 | 0.0% |
| Iranian | 612 | 0.0% |
| Iraqi | 11,757 | 0.8% |
| Irish | 85,822 | 5.8% |
| Iroquois | 585 | 0.0% |
| Israeli | 1,016 | 0.1% |
| Italian | 45,503 | 3.1% |
| Jamaican | 2,696 | 0.2% |
| Japanese | 146 | 0.0% |
| Jordanian | 1,927 | 0.1% |
| Kenyan | 47 | 0.0% |
| Kiowa | 17 | 0.0% |
| Korean | 5,593 | 0.4% |
| Laotian | 121 | 0.0% |
| Latvian | 235 | 0.0% |
| Lebanese | 39,240 | 2.6% |
| Liberian | 242 | 0.0% |
| Lithuanian | 3,644 | 0.2% |
| Lumbee | 145 | 0.0% |
| Luxembourger | 39 | 0.0% |
| Macedonian | 2,179 | 0.2% |
| Malaysian | 215 | 0.0% |
| Maltese | 3,094 | 0.2% |
| Menominee | 150 | 0.0% |
| Mexican | 63,258 | 4.3% |
| Mexican American Indian | 1,285 | 0.1% |
| Mongolian | 52 | 0.0% |
| Moroccan | 1,485 | 0.1% |
| Native Hawaiian | 713 | 0.1% |
| Navajo | 162 | 0.0% |
| New Zealander | 39 | 0.0% |
| Nicaraguan | 125 | 0.0% |
| Nigerian | 3,903 | 0.3% |
| Northern European | 731 | 0.1% |
| Norwegian | 4,445 | 0.3% |
| Osage | 7 | 0.0% |
| Ottawa | 220 | 0.0% |
| Pakistani | 224 | 0.0% |
| Palestinian | 2,439 | 0.2% |
| Panamanian | 167 | 0.0% |
| Paraguayan | 15 | 0.0% |
| Pennsylvania German | 83 | 0.0% |
| Peruvian | 373 | 0.0% |
| Polish | 79,474 | 5.3% |
| Portuguese | 883 | 0.1% |
| Potawatomi | 327 | 0.0% |
| Pueblo | 20 | 0.0% |
| Puerto Rican | 10,865 | 0.7% |
| Romanian | 3,104 | 0.2% |
| Russian | 7,306 | 0.5% |
| Salvadoran | 1,126 | 0.1% |
| Samoan | 99 | 0.0% |
| Scandinavian | 1,503 | 0.1% |
| Scotch-Irish | 6,512 | 0.4% |
| Scottish | 18,671 | 1.3% |
| Seminole | 34 | 0.0% |
| Senegalese | 247 | 0.0% |
| Serbian | 964 | 0.1% |
| Sierra Leonean | 49 | 0.0% |
| Sioux | 176 | 0.0% |
| Slavic | 436 | 0.0% |
| Slovak | 2,543 | 0.2% |
| Slovene | 383 | 0.0% |
| Somali | 83 | 0.0% |
| South African | 210 | 0.0% |
| South American | 2,880 | 0.2% |
| South American Indian | 116 | 0.0% |
| Spaniard | 917 | 0.1% |
| Spanish | 2,083 | 0.1% |
| Spanish American | 12 | 0.0% |
| Spanish American Indian | 12 | 0.0% |
| Sri Lankan | 2,458 | 0.2% |
| Subsaharan African | 24,008 | 1.6% |
| Sudanese | 383 | 0.0% |
| Swedish | 6,509 | 0.4% |
| Swiss | 1,133 | 0.1% |
| Syrian | 2,967 | 0.2% |
| Thai | 13,196 | 0.9% |
| Tongan | 23 | 0.0% |
| Trinidadian and Tobagonian | 146 | 0.0% |
| Turkish | 303 | 0.0% |
| U.S. Virgin Islander | 60 | 0.0% |
| Ukrainian | 5,385 | 0.4% |
| Uruguayan | 84 | 0.0% |
| Venezuelan | 668 | 0.0% |
| Vietnamese | 8,098 | 0.5% |
| Welsh | 3,763 | 0.3% |
| West Indian | 174 | 0.0% |
| Yaqui | 26 | 0.0% |
| Yugoslavian | 1,262 | 0.1% |
| Zimbabwean | 16 | 0.0% | View All 176 Rows |
Immigrants in Area Code 313
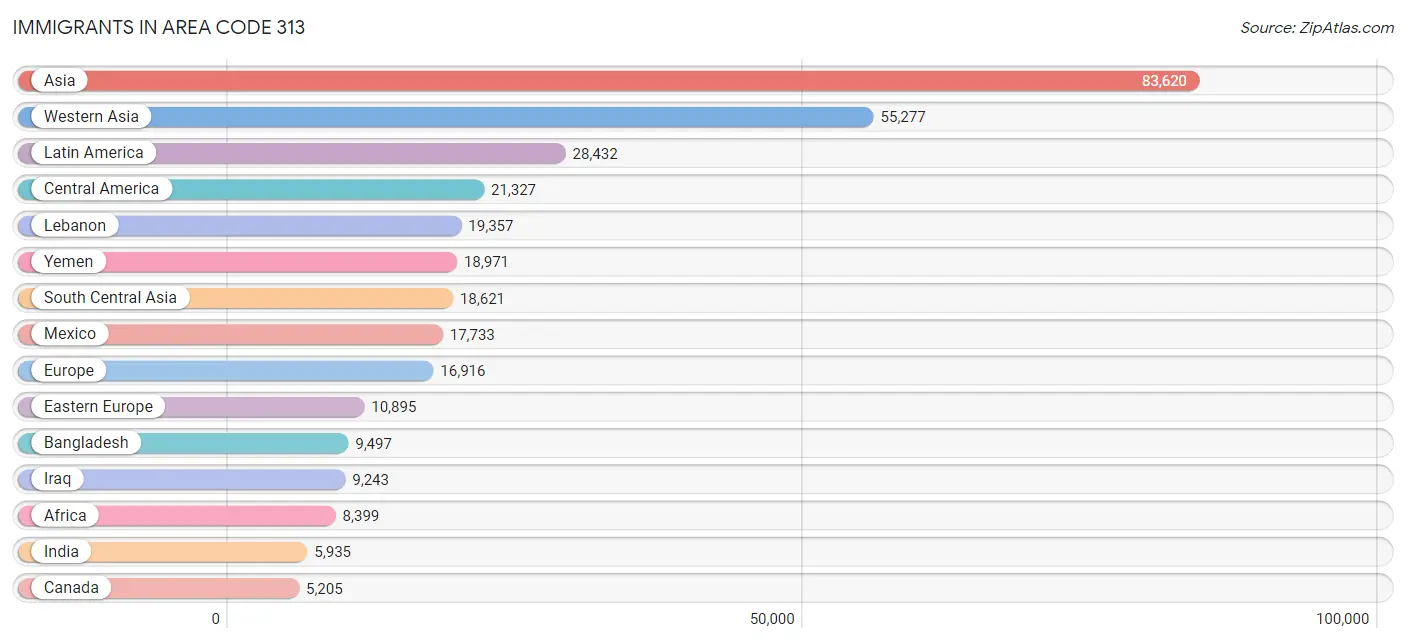
The most numerous immigrant groups reported in Area Code 313 came from Asia (83,620 | 5.6%), Western Asia (55,277 | 3.7%), Latin America (28,432 | 1.9%), Central America (21,327 | 1.4%), and Lebanon (19,357 | 1.3%), together accounting for 14.0% of all Area Code 313 residents.
| Immigration Origin | # Population | % Population |
| Afghanistan | 406 | 0.0% |
| Africa | 8,399 | 0.6% |
| Albania | 1,707 | 0.1% |
| Argentina | 151 | 0.0% |
| Armenia | 143 | 0.0% |
| Asia | 83,620 | 5.6% |
| Australia | 399 | 0.0% |
| Austria | 100 | 0.0% |
| Bahamas | 242 | 0.0% |
| Bangladesh | 9,497 | 0.6% |
| Barbados | 8 | 0.0% |
| Belarus | 63 | 0.0% |
| Belgium | 50 | 0.0% |
| Belize | 22 | 0.0% |
| Bosnia and Herzegovina | 510 | 0.0% |
| Brazil | 1,545 | 0.1% |
| Bulgaria | 276 | 0.0% |
| Cambodia | 57 | 0.0% |
| Cameroon | 206 | 0.0% |
| Canada | 5,205 | 0.4% |
| Caribbean | 4,026 | 0.3% |
| Central America | 21,327 | 1.4% |
| Chile | 126 | 0.0% |
| China | 2,469 | 0.2% |
| Colombia | 499 | 0.0% |
| Congo | 15 | 0.0% |
| Costa Rica | 62 | 0.0% |
| Croatia | 124 | 0.0% |
| Cuba | 764 | 0.1% |
| Czechoslovakia | 230 | 0.0% |
| Denmark | 71 | 0.0% |
| Dominica | 23 | 0.0% |
| Dominican Republic | 1,130 | 0.1% |
| Eastern Africa | 1,013 | 0.1% |
| Eastern Asia | 4,881 | 0.3% |
| Eastern Europe | 10,895 | 0.7% |
| Ecuador | 174 | 0.0% |
| Egypt | 393 | 0.0% |
| El Salvador | 1,067 | 0.1% |
| England | 633 | 0.0% |
| Eritrea | 166 | 0.0% |
| Ethiopia | 439 | 0.0% |
| Europe | 16,916 | 1.1% |
| Fiji | 15 | 0.0% |
| France | 446 | 0.0% |
| Germany | 1,440 | 0.1% |
| Ghana | 359 | 0.0% |
| Greece | 495 | 0.0% |
| Grenada | 6 | 0.0% |
| Guatemala | 851 | 0.1% |
| Guyana | 15 | 0.0% |
| Haiti | 140 | 0.0% |
| Honduras | 1,335 | 0.1% |
| Hong Kong | 157 | 0.0% |
| Hungary | 133 | 0.0% |
| India | 5,935 | 0.4% |
| Indonesia | 70 | 0.0% |
| Iran | 676 | 0.1% |
| Iraq | 9,243 | 0.6% |
| Ireland | 137 | 0.0% |
| Israel | 447 | 0.0% |
| Italy | 965 | 0.1% |
| Jamaica | 1,433 | 0.1% |
| Japan | 731 | 0.1% |
| Jordan | 2,483 | 0.2% |
| Kazakhstan | 156 | 0.0% |
| Kenya | 75 | 0.0% |
| Korea | 1,681 | 0.1% |
| Kuwait | 591 | 0.0% |
| Laos | 95 | 0.0% |
| Latin America | 28,432 | 1.9% |
| Latvia | 44 | 0.0% |
| Lebanon | 19,357 | 1.3% |
| Liberia | 350 | 0.0% |
| Lithuania | 110 | 0.0% |
| Malaysia | 51 | 0.0% |
| Mexico | 17,733 | 1.2% |
| Middle Africa | 374 | 0.0% |
| Moldova | 129 | 0.0% |
| Morocco | 425 | 0.0% |
| Nepal | 168 | 0.0% |
| Netherlands | 65 | 0.0% |
| Nicaragua | 130 | 0.0% |
| Nigeria | 2,577 | 0.2% |
| North Macedonia | 803 | 0.1% |
| Northern Africa | 2,209 | 0.2% |
| Northern Europe | 1,664 | 0.1% |
| Norway | 22 | 0.0% |
| Oceania | 508 | 0.0% |
| Pakistan | 1,419 | 0.1% |
| Panama | 102 | 0.0% |
| Peru | 252 | 0.0% |
| Philippines | 2,447 | 0.2% |
| Poland | 2,034 | 0.1% |
| Portugal | 31 | 0.0% |
| Romania | 1,408 | 0.1% |
| Russia | 1,067 | 0.1% |
| Saudi Arabia | 807 | 0.1% |
| Scotland | 153 | 0.0% |
| Senegal | 301 | 0.0% |
| Serbia | 12 | 0.0% |
| Sierra Leone | 354 | 0.0% |
| Somalia | 39 | 0.0% |
| South Africa | 91 | 0.0% |
| South America | 3,079 | 0.2% |
| South Central Asia | 18,621 | 1.3% |
| South Eastern Asia | 3,985 | 0.3% |
| Southern Europe | 2,081 | 0.1% |
| Spain | 307 | 0.0% |
| Sri Lanka | 129 | 0.0% |
| St. Vincent and the Grenadines | 22 | 0.0% |
| Sudan | 351 | 0.0% |
| Sweden | 16 | 0.0% |
| Switzerland | 47 | 0.0% |
| Syria | 2,008 | 0.1% |
| Taiwan | 600 | 0.0% |
| Thailand | 96 | 0.0% |
| Trinidad and Tobago | 258 | 0.0% |
| Turkey | 162 | 0.0% |
| Uganda | 109 | 0.0% |
| Ukraine | 1,303 | 0.1% |
| Uruguay | 54 | 0.0% |
| Uzbekistan | 210 | 0.0% |
| Venezuela | 231 | 0.0% |
| Vietnam | 1,128 | 0.1% |
| Western Africa | 4,348 | 0.3% |
| Western Asia | 55,277 | 3.7% |
| Western Europe | 2,148 | 0.1% |
| Yemen | 18,971 | 1.3% |
| Zaire | 11 | 0.0% |
| Zimbabwe | 20 | 0.0% | View All 131 Rows |
Sex and Age in Area Code 313
Sex and Age in Area Code 313
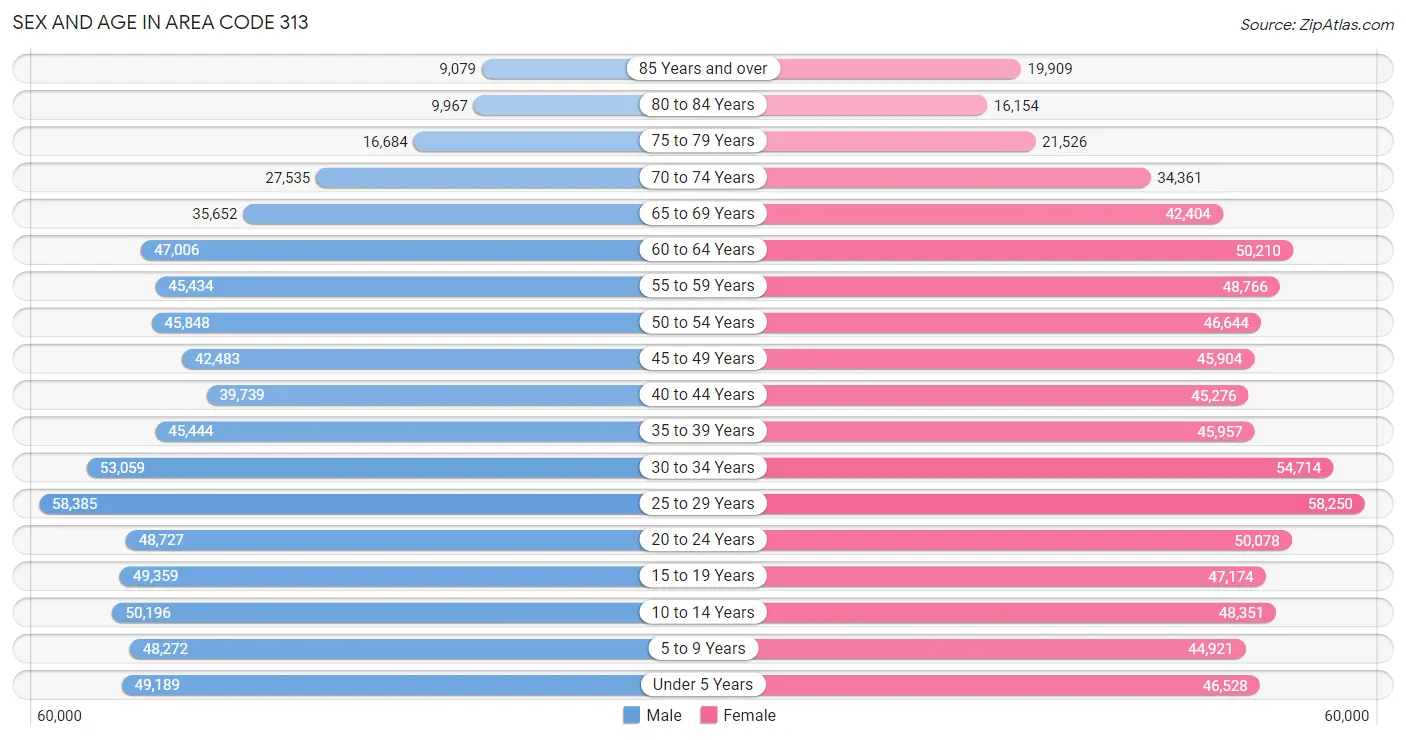
The most populous age groups in Area Code 313 are 25 to 29 Years (58,385 | 8.1%) for men and 25 to 29 Years (58,250 | 7.6%) for women.
| Age Bracket | Male | Female |
| Under 5 Years | 49,189 (6.8%) | 46,528 (6.1%) |
| 5 to 9 Years | 48,272 (6.7%) | 44,921 (5.9%) |
| 10 to 14 Years | 50,196 (7.0%) | 48,351 (6.3%) |
| 15 to 19 Years | 49,359 (6.8%) | 47,174 (6.1%) |
| 20 to 24 Years | 48,727 (6.8%) | 50,078 (6.5%) |
| 25 to 29 Years | 58,385 (8.1%) | 58,250 (7.6%) |
| 30 to 34 Years | 53,059 (7.3%) | 54,714 (7.1%) |
| 35 to 39 Years | 45,444 (6.3%) | 45,957 (6.0%) |
| 40 to 44 Years | 39,739 (5.5%) | 45,276 (5.9%) |
| 45 to 49 Years | 42,483 (5.9%) | 45,904 (6.0%) |
| 50 to 54 Years | 45,848 (6.4%) | 46,644 (6.1%) |
| 55 to 59 Years | 45,434 (6.3%) | 48,766 (6.4%) |
| 60 to 64 Years | 47,006 (6.5%) | 50,210 (6.6%) |
| 65 to 69 Years | 35,652 (4.9%) | 42,404 (5.5%) |
| 70 to 74 Years | 27,535 (3.8%) | 34,361 (4.5%) |
| 75 to 79 Years | 16,684 (2.3%) | 21,526 (2.8%) |
| 80 to 84 Years | 9,967 (1.4%) | 16,154 (2.1%) |
| 85 Years and over | 9,079 (1.3%) | 19,909 (2.6%) |
| Total | 722,058 (100.0%) | 767,127 (100.0%) |
Families and Households in Area Code 313
Median Family Size in Area Code 313
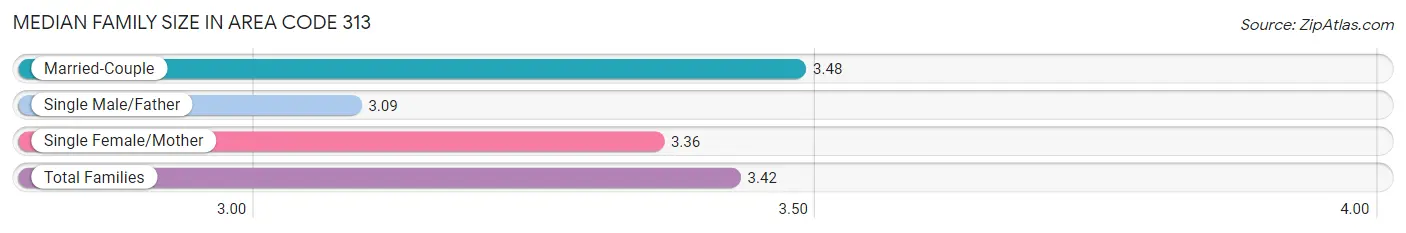
The median family size in Area Code 313 is 3.42 persons per family, with married-couple families (192,254 | 57.9%) accounting for the largest median family size of 3.48214 persons per family. On the other hand, single male/father families (32,609 | 9.8%) represent the smallest median family size with 3.09 persons per family.
| Family Type | # Families | Family Size |
| Married-Couple | 192,254 (57.9%) | 3.48 |
| Single Male/Father | 32,609 (9.8%) | 3.09 |
| Single Female/Mother | 107,192 (32.3%) | 3.36 |
| Total Families | 332,055 (100.0%) | 3.42 |
Median Household Size in Area Code 313
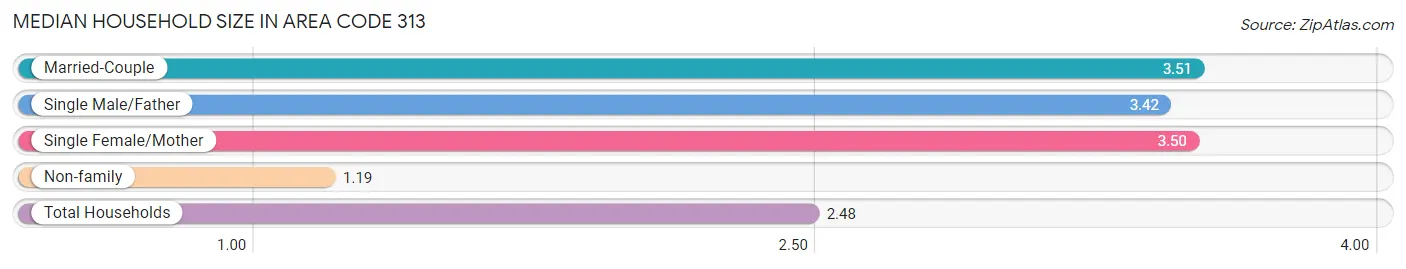
The median household size in Area Code 313 is 2.48 persons per household, with married-couple households (192,254 | 32.7%) accounting for the largest median household size of 3.51017 persons per household. non-family households (255,583 | 43.5%) represent the smallest median household size with 1.19 persons per household.
| Household Type | # Households | Household Size |
| Married-Couple | 192,254 (32.7%) | 3.51 |
| Single Male/Father | 32,609 (5.6%) | 3.42 |
| Single Female/Mother | 107,192 (18.2%) | 3.50 |
| Non-family | 255,583 (43.5%) | 1.19 |
| Total Households | 587,638 (100.0%) | 2.48 |
Household Size by Marriage Status in Area Code 313
Out of a total of 587,638 households in Area Code 313, 332,055 (56.5%) are family households, while 255,583 (43.5%) are nonfamily households. The most numerous type of family households are 2-person households, comprising 140,311, and the most common type of nonfamily households are 1-person households, comprising 220,446.
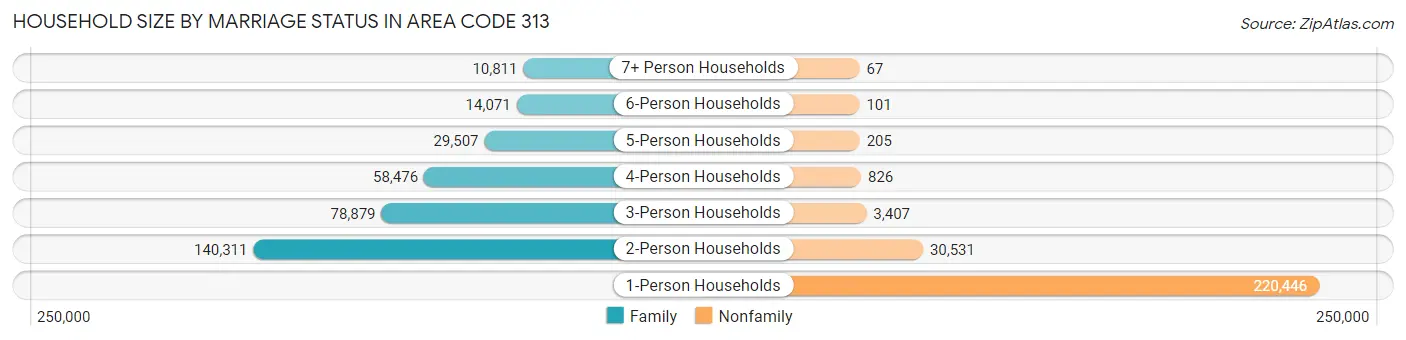
| Household Size | Family Households | Nonfamily Households |
| 1-Person Households | - | 220,446 (37.5%) |
| 2-Person Households | 140,311 (23.9%) | 30,531 (5.2%) |
| 3-Person Households | 78,879 (13.4%) | 3,407 (0.6%) |
| 4-Person Households | 58,476 (10.0%) | 826 (0.1%) |
| 5-Person Households | 29,507 (5.0%) | 205 (0.0%) |
| 6-Person Households | 14,071 (2.4%) | 101 (0.0%) |
| 7+ Person Households | 10,811 (1.8%) | 67 (0.0%) |
| Total | 332,055 (56.5%) | 255,583 (43.5%) |
Female Fertility in Area Code 313
Fertility by Age in Area Code 313
Average fertility rate in Area Code 313 is 53.8 births per 1,000 women. Women in the age bracket of 20 to 34 years have the highest fertility rate with 86.9 births per 1,000 women. Women in the age bracket of 20 to 34 years acount for 70.9% of all women with births.
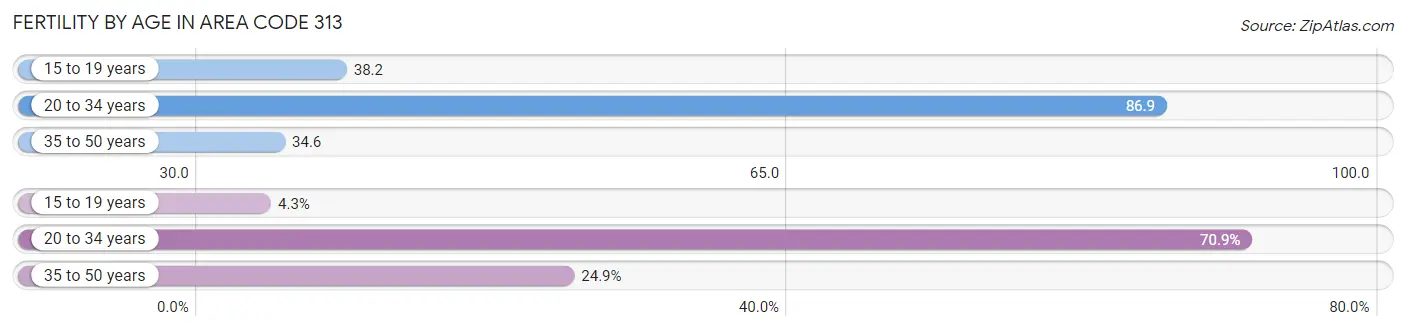
| Age Bracket | Women with Births | Births / 1,000 Women |
| 15 to 19 years | 855 (4.3%) | 38.2 |
| 20 to 34 years | 14,166 (70.9%) | 86.9 |
| 35 to 50 years | 4,970 (24.9%) | 34.6 |
| Total | 19,991 (100.0%) | 53.8 |
Fertility by Age by Marriage Status in Area Code 313
51.1% of women with births (19,991) in Area Code 313 are married. The highest percentage of unmarried women with births falls into 15 to 19 years age bracket with 91.5% of them unmarried at the time of birth, while the lowest percentage of unmarried women with births belong to 35 to 50 years age bracket with 44.1% of them unmarried.
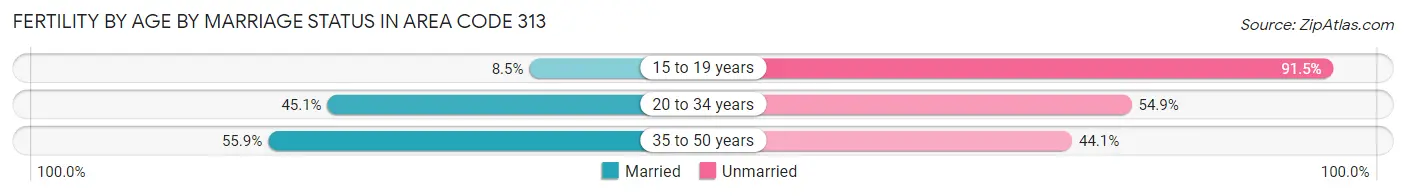
| Age Bracket | Married | Unmarried |
| 15 to 19 years | 73 (8.5%) | 782 (91.5%) |
| 20 to 34 years | 6,391 (45.1%) | 7,775 (54.9%) |
| 35 to 50 years | 2,778 (55.9%) | 2,192 (44.1%) |
| Total | 10,206 (51.0%) | 9,785 (48.9%) |
Fertility by Education in Area Code 313
Average fertility rate in Area Code 313 is 53.8 births per 1,000 women. Women with the education attainment of graduate degree have the highest fertility rate of 87.9 births per 1,000 women, while women with the education attainment of college or associate's degree have the lowest fertility at 51.9 births per 1,000 women. Women with the education attainment of college or associate's degree represent 31.1% of all women with births.
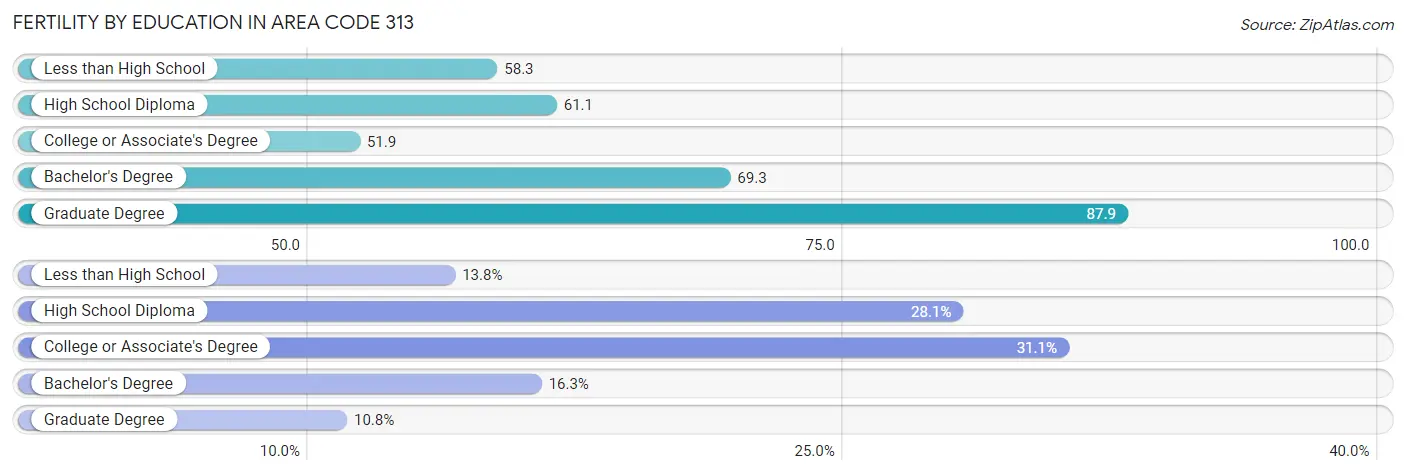
| Educational Attainment | Women with Births | Births / 1,000 Women |
| Less than High School | 2,763 (13.8%) | 58.3 |
| High School Diploma | 5,615 (28.1%) | 61.1 |
| College or Associate's Degree | 6,209 (31.1%) | 51.9 |
| Bachelor's Degree | 3,249 (16.3%) | 69.3 |
| Graduate Degree | 2,155 (10.8%) | 87.9 |
| Total | 19,991 (100.0%) | 53.8 |
Fertility by Education by Marriage Status in Area Code 313
48.9% of women with births in Area Code 313 are unmarried. Women with the educational attainment of bachelor's degree are most likely to be married with 49.6% of them married at childbirth, while women with the educational attainment of less than high school are least likely to be married with 76.9% of them unmarried at childbirth.
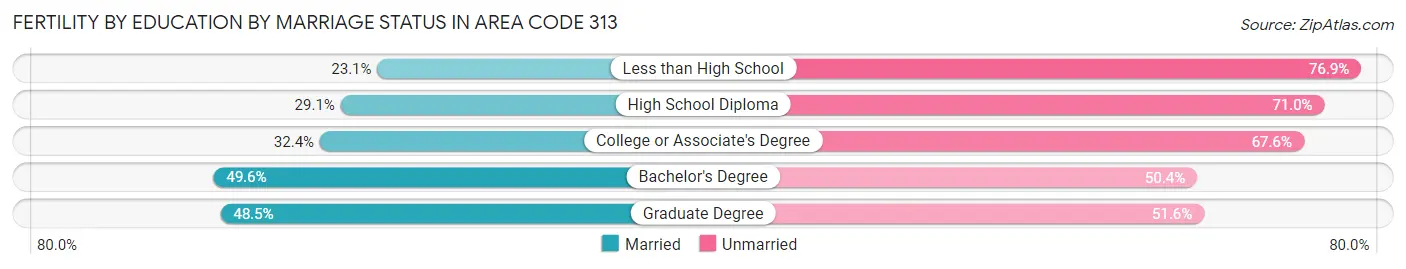
| Educational Attainment | Married | Unmarried |
| Less than High School | 639 (23.1%) | 2,124 (76.9%) |
| High School Diploma | 1,631 (29.0%) | 3,984 (71.0%) |
| College or Associate's Degree | 2,011 (32.4%) | 4,198 (67.6%) |
| Bachelor's Degree | 1,611 (49.6%) | 1,638 (50.4%) |
| Graduate Degree | 1,044 (48.4%) | 1,111 (51.5%) |
| Total | 10,206 (51.0%) | 9,785 (48.9%) |
Employment Characteristics in Area Code 313
Employment by Class of Employer in Area Code 313
Among the 614,881 employed individuals in Area Code 313, private company employees (447,257 | 72.7%), not-for-profit organizations (58,301 | 9.5%), and local government employees (32,460 | 5.3%) make up the most common classes of employment.
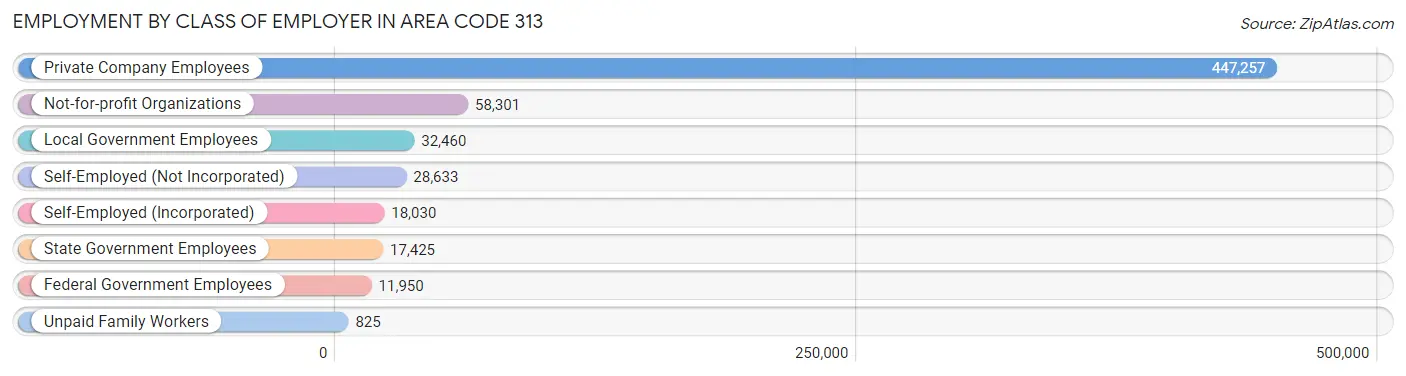
| Employer Class | # Employees | % Employees |
| Private Company Employees | 447,257 | 72.7% |
| Self-Employed (Incorporated) | 18,030 | 2.9% |
| Self-Employed (Not Incorporated) | 28,633 | 4.7% |
| Not-for-profit Organizations | 58,301 | 9.5% |
| Local Government Employees | 32,460 | 5.3% |
| State Government Employees | 17,425 | 2.8% |
| Federal Government Employees | 11,950 | 1.9% |
| Unpaid Family Workers | 825 | 0.1% |
| Total | 614,881 | 100.0% |
Employment Status by Age in Area Code 313
According to the labor force statistics for Area Code 313, out of the total population over 16 years of age (1,181,441), 58.5% or 690,670 individuals are in the labor force, with 10.0% or 69,274 of them unemployed. The age group with the highest labor force participation rate is 25 to 29 years, with 79.5% or 92,678 individuals in the labor force. Within the labor force, the 16 to 19 years age range has the highest percentage of unemployed individuals, with 1,250.8% or 348,948 of them being unemployed.
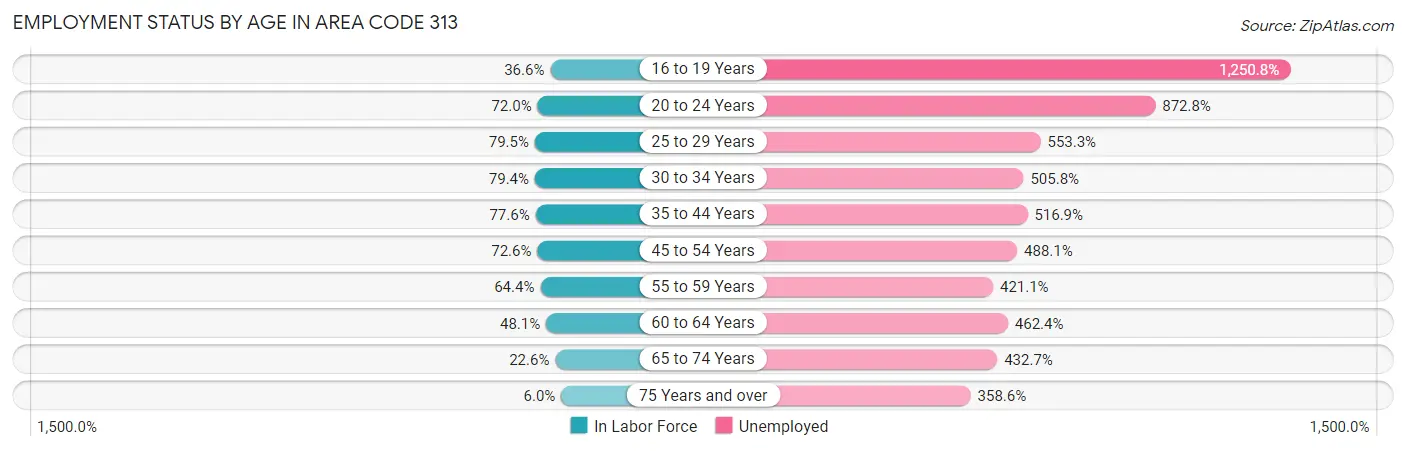
| Age Bracket | In Labor Force | Unemployed |
| 16 to 19 Years | 27,897 (36.6%) | 348,948 (1,250.8%) |
| 20 to 24 Years | 71,097 (72.0%) | 620,561 (872.8%) |
| 25 to 29 Years | 92,681 (79.5%) | 512,787 (553.3%) |
| 30 to 34 Years | 85,566 (79.4%) | 432,768 (505.8%) |
| 35 to 44 Years | 136,908 (77.6%) | 707,719 (516.9%) |
| 45 to 54 Years | 131,357 (72.6%) | 641,139 (488.1%) |
| 55 to 59 Years | 60,656 (64.4%) | 255,418 (421.1%) |
| 60 to 64 Years | 46,749 (48.1%) | 216,177 (462.4%) |
| 65 to 74 Years | 31,657 (22.6%) | 136,980 (432.7%) |
| 75 Years and over | 5,597 (6.0%) | 20,078 (358.6%) |
| Total | 690,637 (58.5%) | 69,277 (10.0%) |
Employment Status by Educational Attainment in Area Code 313
According to labor force statistics for Area Code 313, 71.7% of individuals (553,940) out of the total population between 25 and 64 years of age (773,119) are in the labor force, with 497.9% or 2,758,067 of them being unemployed. The group with the highest labor force participation rate are those with the educational attainment of bachelor's degree or higher, with 84.2% or 187,587 individuals in the labor force. Within the labor force, individuals with less than high school education have the highest percentage of unemployment, with 939.6% or 417,004 of them being unemployed.
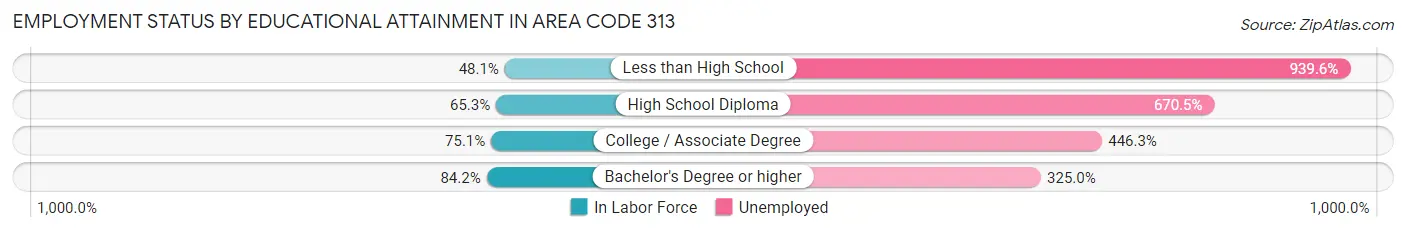
| Educational Attainment | In Labor Force | Unemployed |
| Less than High School | 44,378 (48.1%) | 866,950 (939.6%) |
| High School Diploma | 139,000 (65.3%) | 1,426,355 (670.5%) |
| College / Associate Degree | 184,171 (75.1%) | 1,094,926 (446.3%) |
| Bachelor's Degree or higher | 187,579 (84.2%) | 724,058 (325.0%) |
| Total | 553,926 (71.7%) | 3,849,360 (497.9%) |
Employment Occupations by Sex in Area Code 313
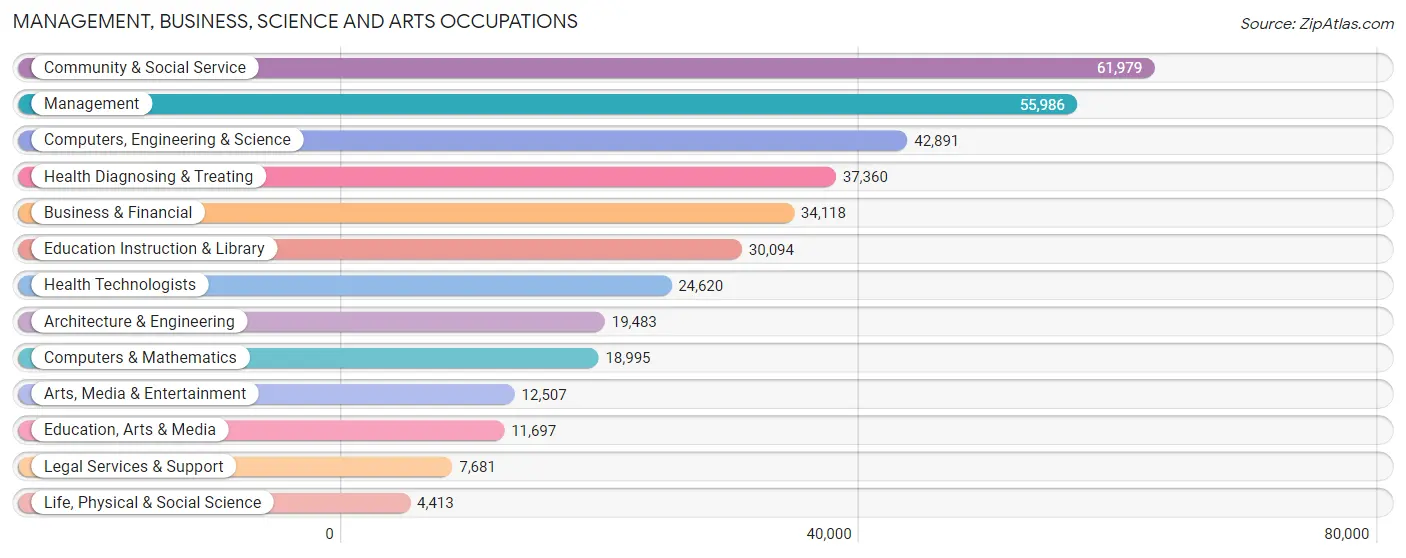
Management, Business, Science and Arts Occupations
The most common Management, Business, Science and Arts occupations in Area Code 313 are Community & Social Service (61,979 | 9.8%), Management (55,986 | 8.9%), Computers, Engineering & Science (42,891 | 6.8%), Health Diagnosing & Treating (37,360 | 5.9%), and Business & Financial (34,118 | 5.4%).
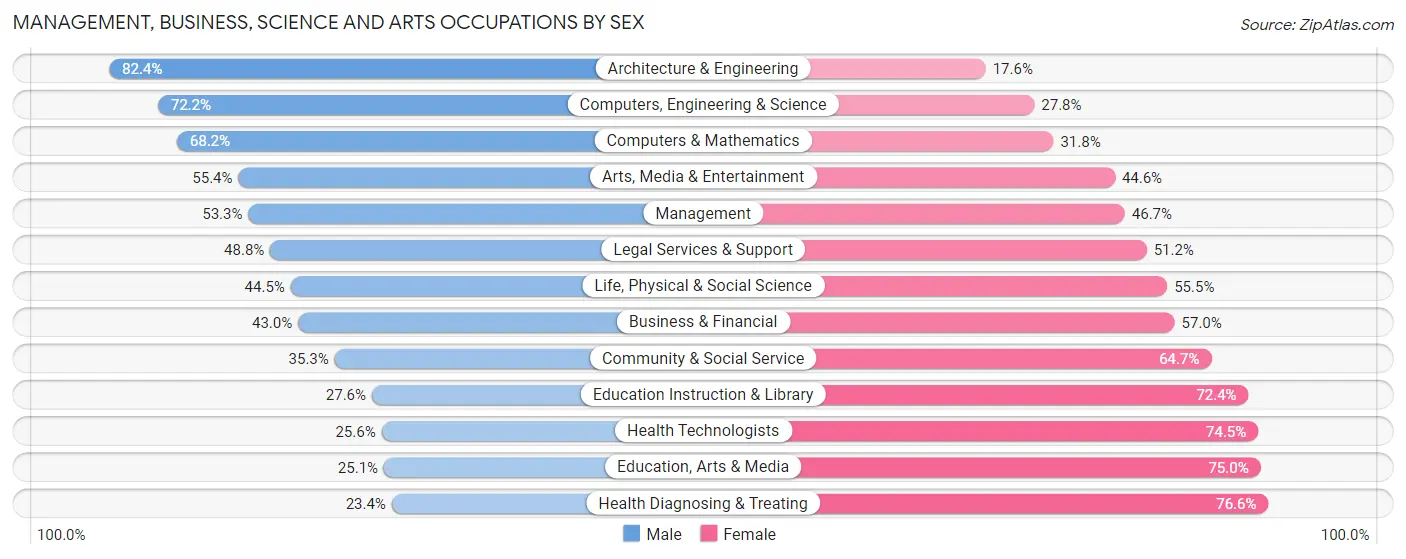
Management, Business, Science and Arts Occupations by Sex
Within the Management, Business, Science and Arts occupations in Area Code 313, the most male-oriented occupations are Architecture & Engineering (82.4%), Computers, Engineering & Science (72.2%), and Computers & Mathematics (68.2%), while the most female-oriented occupations are Health Diagnosing & Treating (76.6%), Education, Arts & Media (75.0%), and Health Technologists (74.5%).
| Occupation | Male | Female |
| Management | 29,864 (53.3%) | 26,122 (46.7%) |
| Business & Financial | 14,657 (43.0%) | 19,461 (57.0%) |
| Computers, Engineering & Science | 30,971 (72.2%) | 11,920 (27.8%) |
| Computers & Mathematics | 12,961 (68.2%) | 6,034 (31.8%) |
| Architecture & Engineering | 16,046 (82.4%) | 3,437 (17.6%) |
| Life, Physical & Social Science | 1,964 (44.5%) | 2,449 (55.5%) |
| Community & Social Service | 21,900 (35.3%) | 40,079 (64.7%) |
| Education, Arts & Media | 2,930 (25.1%) | 8,767 (75.0%) |
| Legal Services & Support | 3,747 (48.8%) | 3,934 (51.2%) |
| Education Instruction & Library | 8,293 (27.6%) | 21,801 (72.4%) |
| Arts, Media & Entertainment | 6,930 (55.4%) | 5,577 (44.6%) |
| Health Diagnosing & Treating | 8,748 (23.4%) | 28,612 (76.6%) |
| Health Technologists | 6,290 (25.6%) | 18,330 (74.5%) |
| Total (Category) | 106,140 (45.7%) | 126,194 (54.3%) |
| Total (Overall) | 320,307 (50.7%) | 311,127 (49.3%) |
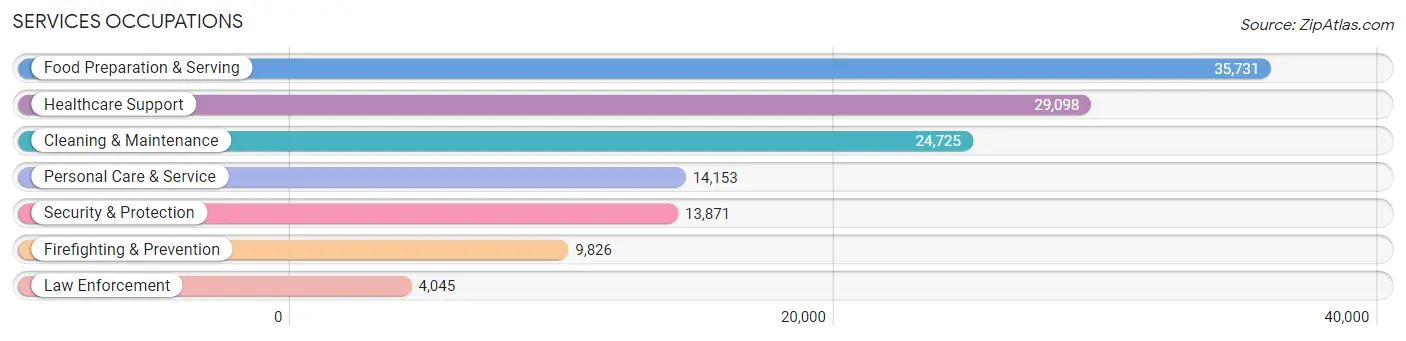
Services Occupations
The most common Services occupations in Area Code 313 are Food Preparation & Serving (35,731 | 5.7%), Healthcare Support (29,098 | 4.6%), Cleaning & Maintenance (24,725 | 3.9%), Personal Care & Service (14,153 | 2.2%), and Security & Protection (13,871 | 2.2%).
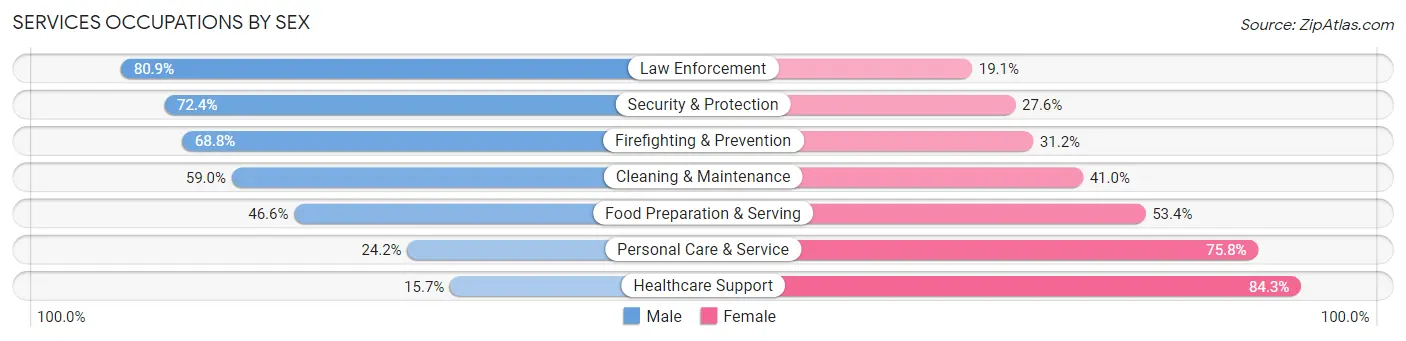
Services Occupations by Sex
Within the Services occupations in Area Code 313, the most male-oriented occupations are Law Enforcement (80.9%), Security & Protection (72.4%), and Firefighting & Prevention (68.8%), while the most female-oriented occupations are Healthcare Support (84.3%), Personal Care & Service (75.8%), and Food Preparation & Serving (53.4%).
| Occupation | Male | Female |
| Healthcare Support | 4,577 (15.7%) | 24,521 (84.3%) |
| Security & Protection | 10,038 (72.4%) | 3,833 (27.6%) |
| Firefighting & Prevention | 6,764 (68.8%) | 3,062 (31.2%) |
| Law Enforcement | 3,274 (80.9%) | 771 (19.1%) |
| Food Preparation & Serving | 16,652 (46.6%) | 19,079 (53.4%) |
| Cleaning & Maintenance | 14,581 (59.0%) | 10,144 (41.0%) |
| Personal Care & Service | 3,423 (24.2%) | 10,730 (75.8%) |
| Total (Category) | 49,271 (41.9%) | 68,307 (58.1%) |
| Total (Overall) | 320,307 (50.7%) | 311,127 (49.3%) |
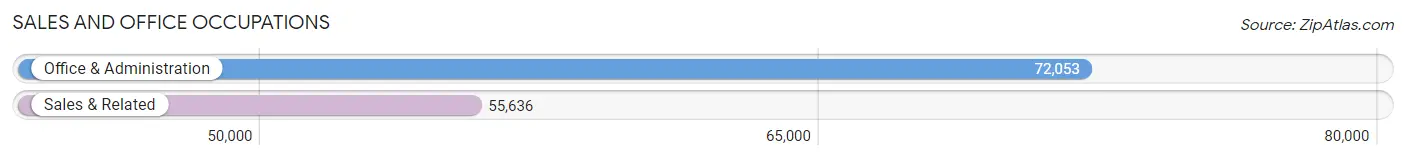
Sales and Office Occupations
The most common Sales and Office occupations in Area Code 313 are Office & Administration (72,053 | 11.4%), and Sales & Related (55,636 | 8.8%).
Sales and Office Occupations by Sex
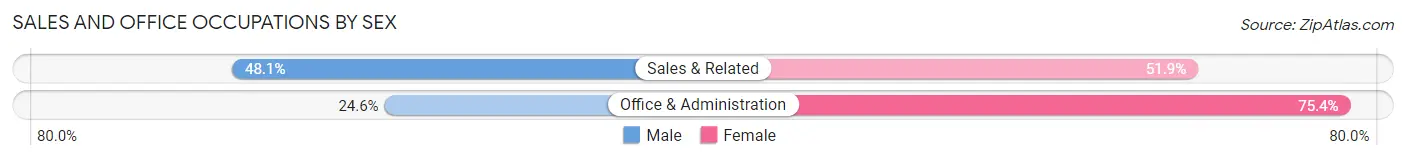
| Occupation | Male | Female |
| Sales & Related | 26,750 (48.1%) | 28,886 (51.9%) |
| Office & Administration | 17,756 (24.6%) | 54,297 (75.4%) |
| Total (Category) | 44,506 (34.8%) | 83,183 (65.1%) |
| Total (Overall) | 320,307 (50.7%) | 311,127 (49.3%) |
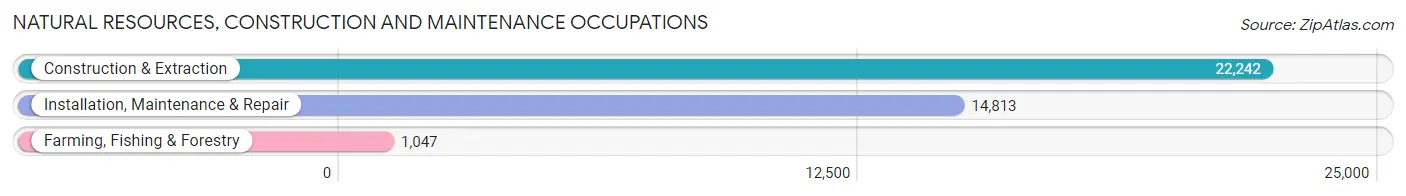
Natural Resources, Construction and Maintenance Occupations
The most common Natural Resources, Construction and Maintenance occupations in Area Code 313 are Construction & Extraction (22,242 | 3.5%), Installation, Maintenance & Repair (14,813 | 2.4%), and Farming, Fishing & Forestry (1,047 | 0.2%).
Natural Resources, Construction and Maintenance Occupations by Sex
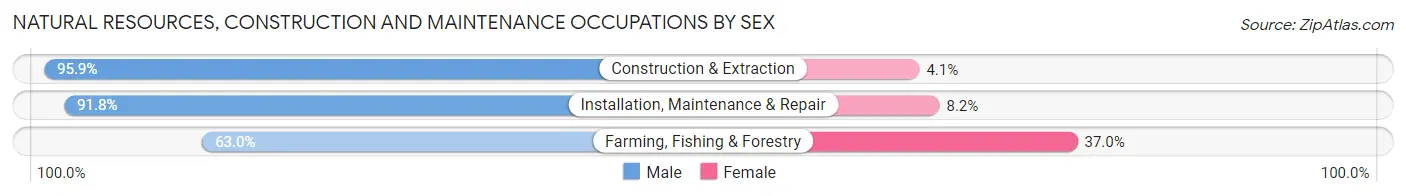
| Occupation | Male | Female |
| Farming, Fishing & Forestry | 660 (63.0%) | 387 (37.0%) |
| Construction & Extraction | 21,337 (95.9%) | 905 (4.1%) |
| Installation, Maintenance & Repair | 13,593 (91.8%) | 1,220 (8.2%) |
| Total (Category) | 35,590 (93.4%) | 2,512 (6.6%) |
| Total (Overall) | 320,307 (50.7%) | 311,127 (49.3%) |
Production, Transportation and Moving Occupations
The most common Production, Transportation and Moving occupations in Area Code 313 are Production (53,908 | 8.5%), Material Moving (33,792 | 5.3%), and Transportation (28,031 | 4.4%).
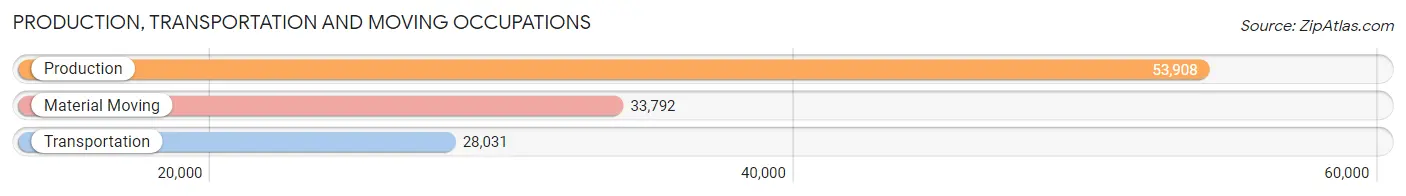
Production, Transportation and Moving Occupations by Sex
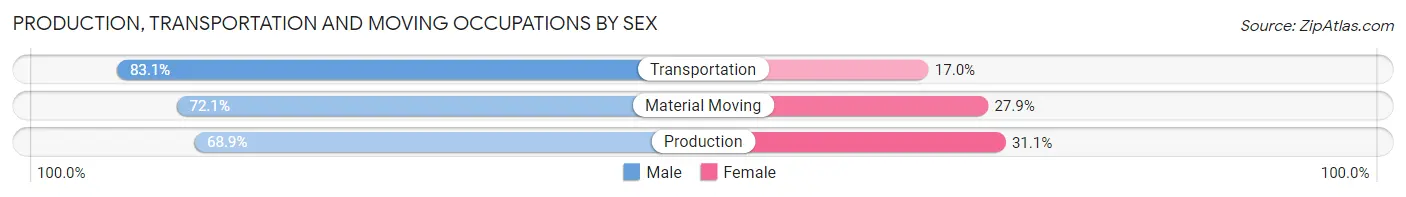
| Occupation | Male | Female |
| Production | 37,148 (68.9%) | 16,760 (31.1%) |
| Transportation | 23,281 (83.1%) | 4,750 (17.0%) |
| Material Moving | 24,371 (72.1%) | 9,421 (27.9%) |
| Total (Category) | 84,800 (73.3%) | 30,931 (26.7%) |
| Total (Overall) | 320,307 (50.7%) | 311,127 (49.3%) |
Employment Industries by Sex in Area Code 313
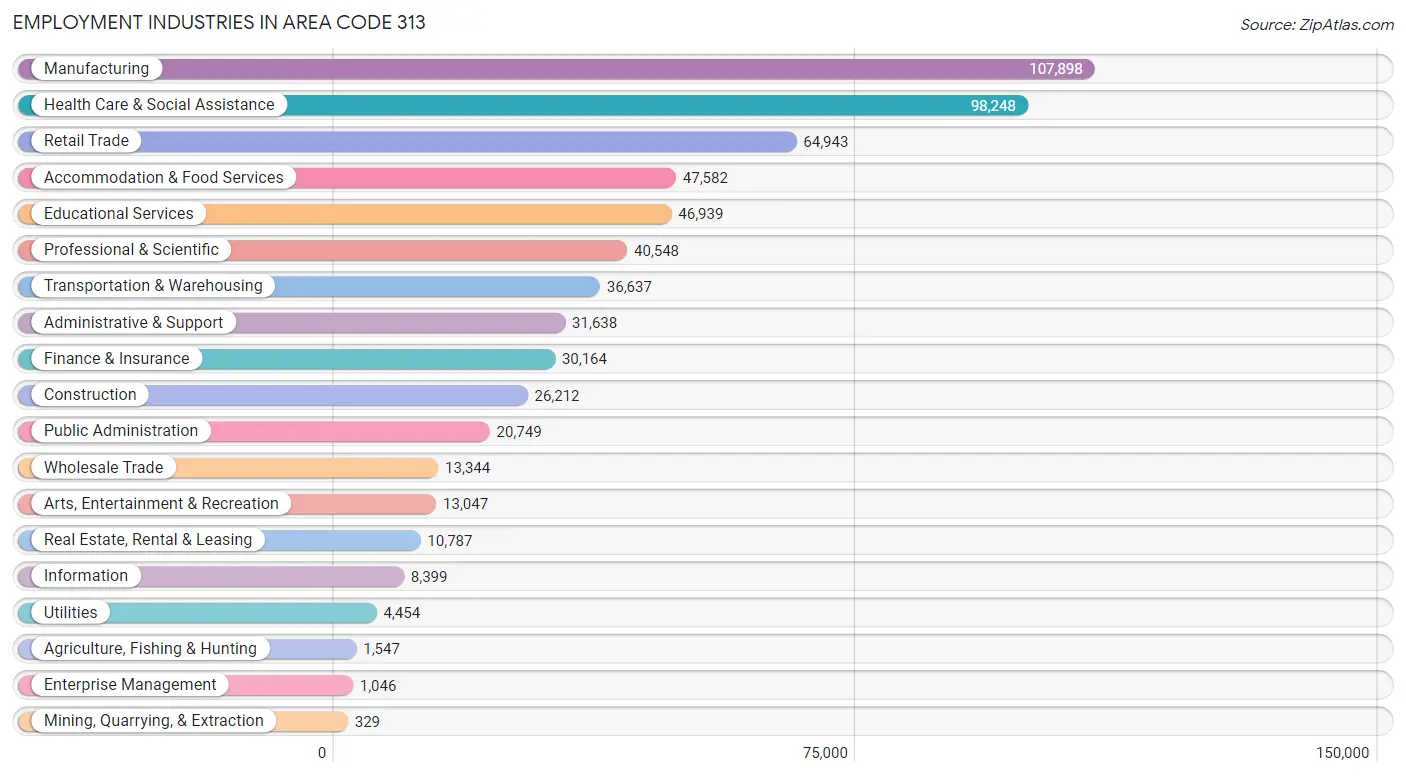
Employment Industries in Area Code 313
The major employment industries in Area Code 313 include Manufacturing (107,898 | 17.1%), Health Care & Social Assistance (98,248 | 15.6%), Retail Trade (64,943 | 10.3%), Accommodation & Food Services (47,582 | 7.5%), and Educational Services (46,939 | 7.4%).
Employment Industries by Sex in Area Code 313
The Area Code 313 industries that see more men than women are Construction (89.8%), Mining, Quarrying, & Extraction (81.8%), and Agriculture, Fishing & Hunting (76.6%), whereas the industries that tend to have a higher number of women are Health Care & Social Assistance (78.8%), Educational Services (69.3%), and Finance & Insurance (61.6%).
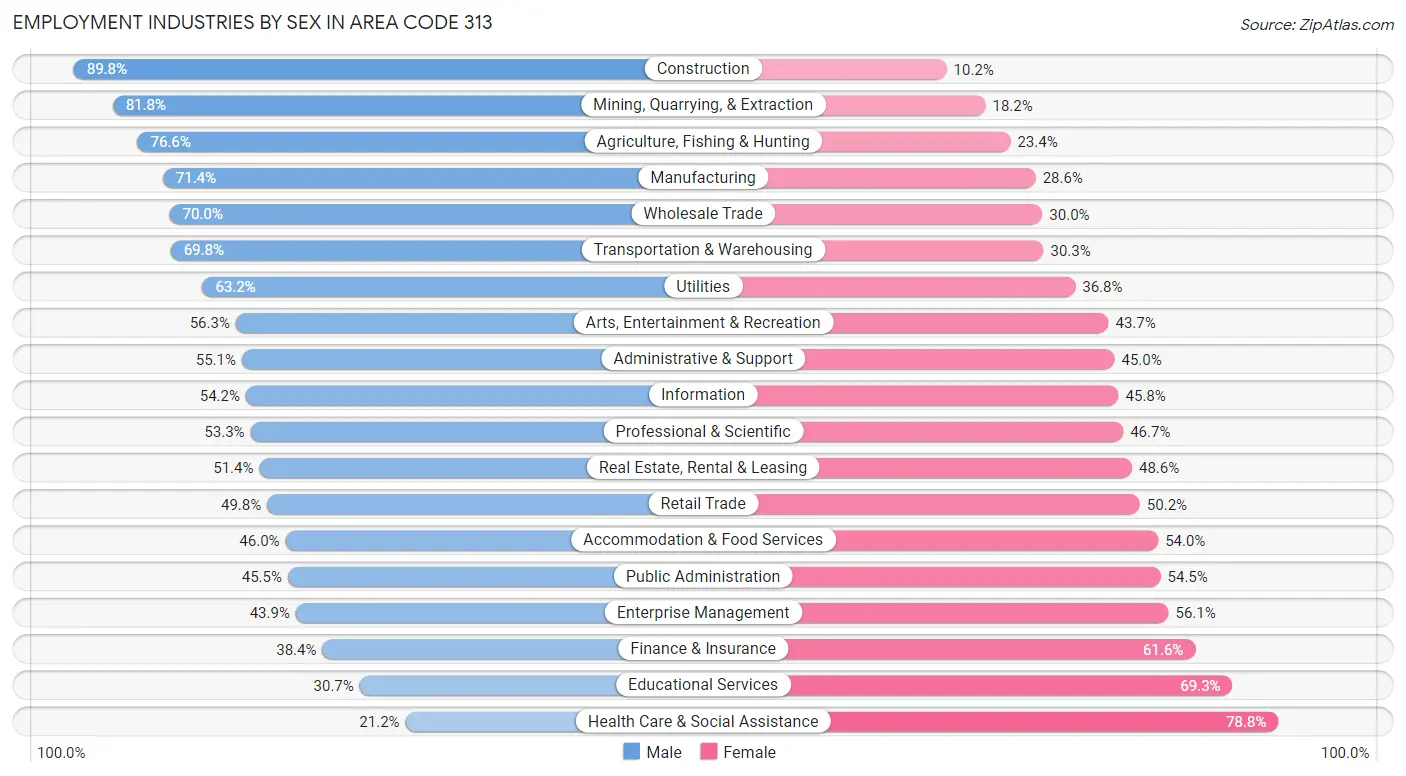
| Industry | Male | Female |
| Agriculture, Fishing & Hunting | 1,185 (76.6%) | 362 (23.4%) |
| Mining, Quarrying, & Extraction | 269 (81.8%) | 60 (18.2%) |
| Construction | 23,542 (89.8%) | 2,670 (10.2%) |
| Manufacturing | 77,015 (71.4%) | 30,883 (28.6%) |
| Wholesale Trade | 9,340 (70.0%) | 4,004 (30.0%) |
| Retail Trade | 32,345 (49.8%) | 32,598 (50.2%) |
| Transportation & Warehousing | 25,554 (69.8%) | 11,083 (30.2%) |
| Utilities | 2,814 (63.2%) | 1,640 (36.8%) |
| Information | 4,554 (54.2%) | 3,845 (45.8%) |
| Finance & Insurance | 11,576 (38.4%) | 18,588 (61.6%) |
| Real Estate, Rental & Leasing | 5,548 (51.4%) | 5,239 (48.6%) |
| Professional & Scientific | 21,594 (53.3%) | 18,954 (46.7%) |
| Enterprise Management | 459 (43.9%) | 587 (56.1%) |
| Administrative & Support | 17,417 (55.0%) | 14,221 (45.0%) |
| Educational Services | 14,390 (30.7%) | 32,549 (69.3%) |
| Health Care & Social Assistance | 20,806 (21.2%) | 77,442 (78.8%) |
| Arts, Entertainment & Recreation | 7,345 (56.3%) | 5,702 (43.7%) |
| Accommodation & Food Services | 21,895 (46.0%) | 25,687 (54.0%) |
| Public Administration | 9,444 (45.5%) | 11,305 (54.5%) |
| Total | 320,307 (50.7%) | 311,127 (49.3%) |
Education in Area Code 313
School Enrollment in Area Code 313
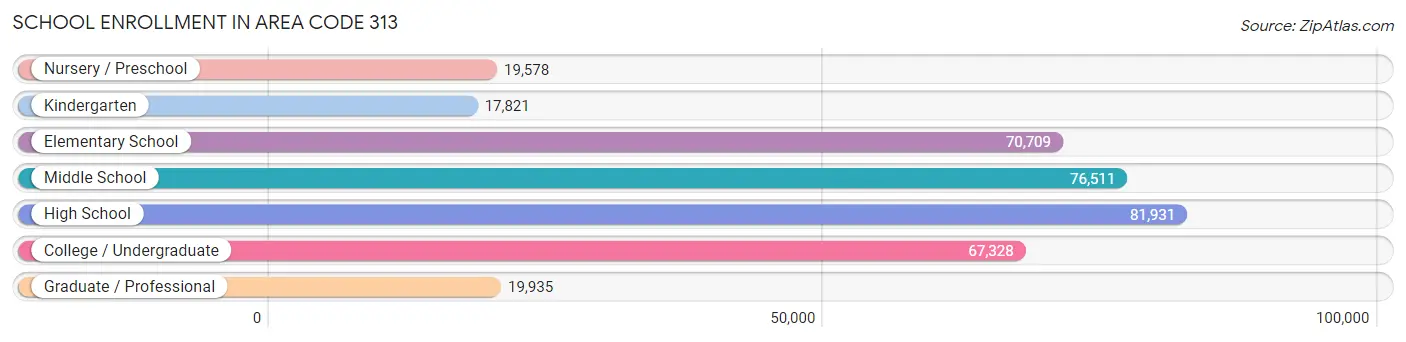
The most common levels of schooling among the 353,813 students in Area Code 313 are high school (81,931 | 23.2%), middle school (76,511 | 21.6%), and elementary school (70,709 | 20.0%).
| School Level | # Students | % Students |
| Nursery / Preschool | 19,578 | 5.5% |
| Kindergarten | 17,821 | 5.0% |
| Elementary School | 70,709 | 20.0% |
| Middle School | 76,511 | 21.6% |
| High School | 81,931 | 23.2% |
| College / Undergraduate | 67,328 | 19.0% |
| Graduate / Professional | 19,935 | 5.6% |
| Total | 353,813 | 100.0% |
School Enrollment by Age by Funding Source in Area Code 313
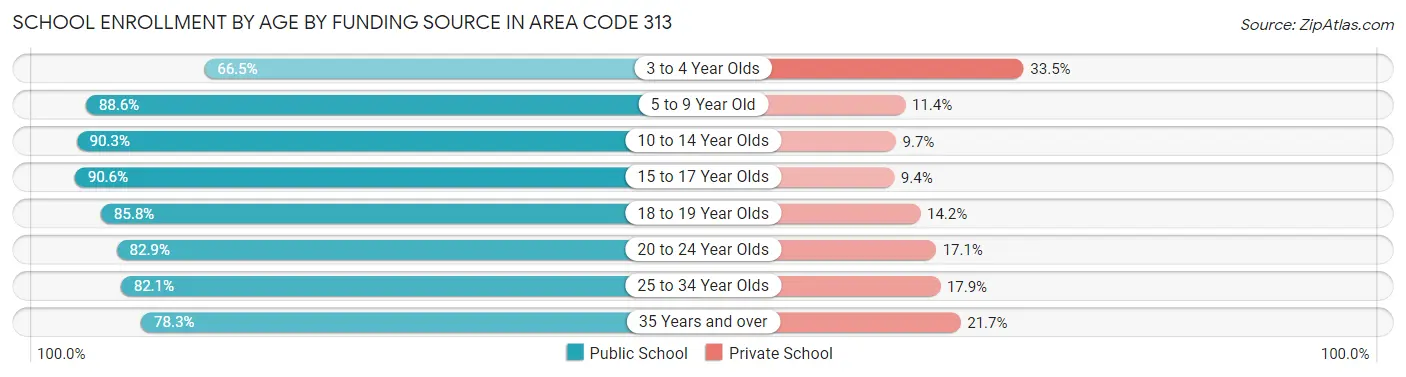
Out of a total of 353,813 students who are enrolled in schools in Area Code 313, 47,232 (13.4%) attend a private institution, while the remaining 306,581 (86.7%) are enrolled in public schools. The age group of 3 to 4 year olds has the highest likelihood of being enrolled in private schools, with 5,344 (33.5% in the age bracket) enrolled. Conversely, the age group of 15 to 17 year olds has the lowest likelihood of being enrolled in a private school, with 51,418 (90.6% in the age bracket) attending a public institution.
| Age Bracket | Public School | Private School |
| 3 to 4 Year Olds | 10,616 (66.5%) | 5,344 (33.5%) |
| 5 to 9 Year Old | 76,141 (88.6%) | 9,828 (11.4%) |
| 10 to 14 Year Olds | 85,229 (90.3%) | 9,133 (9.7%) |
| 15 to 17 Year Olds | 51,418 (90.6%) | 5,310 (9.4%) |
| 18 to 19 Year Olds | 20,654 (85.8%) | 3,423 (14.2%) |
| 20 to 24 Year Olds | 28,969 (82.9%) | 5,991 (17.1%) |
| 25 to 34 Year Olds | 19,077 (82.1%) | 4,168 (17.9%) |
| 35 Years and over | 14,492 (78.3%) | 4,020 (21.7%) |
| Total | 306,581 (86.7%) | 47,232 (13.4%) |
Educational Attainment by Field of Study in Area Code 313
Business (59,931 | 19.7%), education (30,921 | 10.2%), science & technology (30,013 | 9.9%), engineering (28,620 | 9.4%), and social sciences (21,764 | 7.2%) are the most common fields of study among 303,578 individuals in Area Code 313 who have obtained a bachelor's degree or higher.
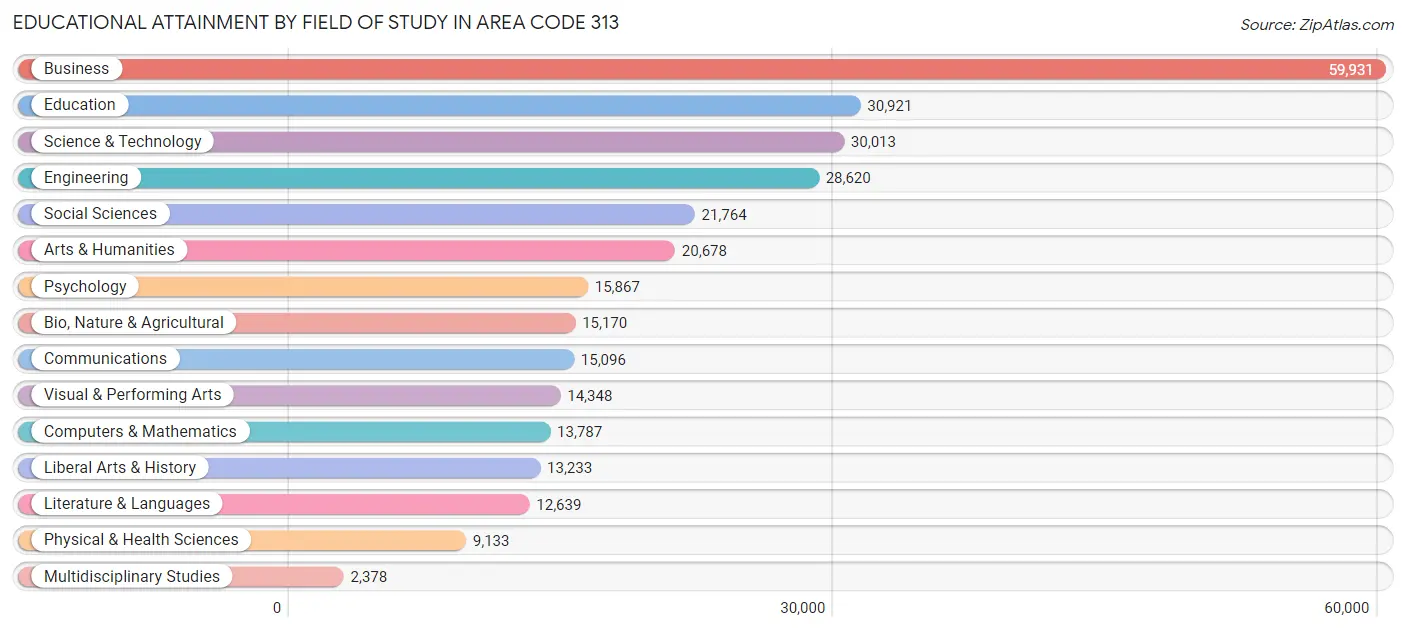
| Field of Study | # Graduates | % Graduates |
| Computers & Mathematics | 13,787 | 4.5% |
| Bio, Nature & Agricultural | 15,170 | 5.0% |
| Physical & Health Sciences | 9,133 | 3.0% |
| Psychology | 15,867 | 5.2% |
| Social Sciences | 21,764 | 7.2% |
| Engineering | 28,620 | 9.4% |
| Multidisciplinary Studies | 2,378 | 0.8% |
| Science & Technology | 30,013 | 9.9% |
| Business | 59,931 | 19.7% |
| Education | 30,921 | 10.2% |
| Literature & Languages | 12,639 | 4.2% |
| Liberal Arts & History | 13,233 | 4.4% |
| Visual & Performing Arts | 14,348 | 4.7% |
| Communications | 15,096 | 5.0% |
| Arts & Humanities | 20,678 | 6.8% |
| Total | 303,578 | 100.0% |
Transportation & Commute in Area Code 313
Vehicle Availability by Sex in Area Code 313
The most prevalent vehicle ownership categories in Area Code 313 are males with 2 vehicles (129,615, accounting for 41.5%) and females with 2 vehicles (114,938, making up 43.2%).
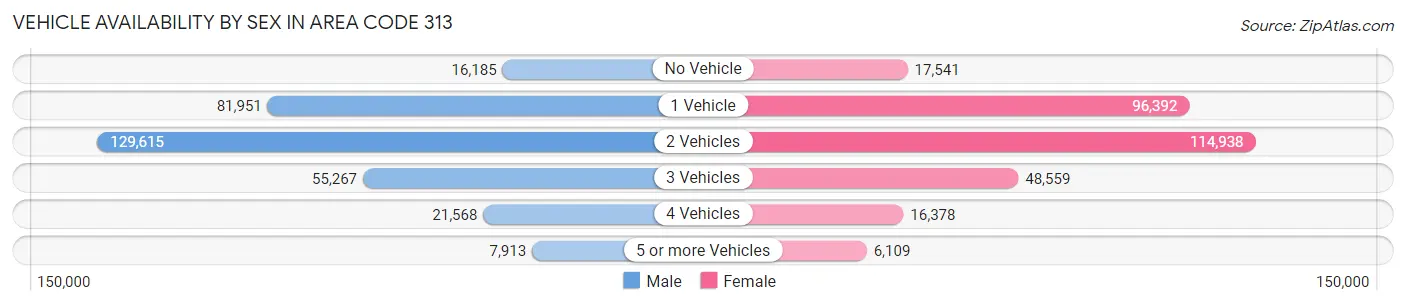
| Vehicles Available | Male | Female |
| No Vehicle | 16,185 (5.2%) | 17,541 (5.9%) |
| 1 Vehicle | 81,951 (26.2%) | 96,392 (32.1%) |
| 2 Vehicles | 129,615 (41.5%) | 114,938 (38.3%) |
| 3 Vehicles | 55,267 (17.7%) | 48,559 (16.2%) |
| 4 Vehicles | 21,568 (6.9%) | 16,378 (5.5%) |
| 5 or more Vehicles | 7,913 (2.5%) | 6,109 (2.0%) |
| Total | 312,499 (100.0%) | 299,917 (100.0%) |
Commute Time in Area Code 313
The most frequently occuring commute durations in Area Code 313 are 20 to 24 minutes (99,745 commuters, 18.2%), 15 to 19 minutes (92,037 commuters, 16.8%), and 30 to 34 minutes (90,348 commuters, 16.5%).
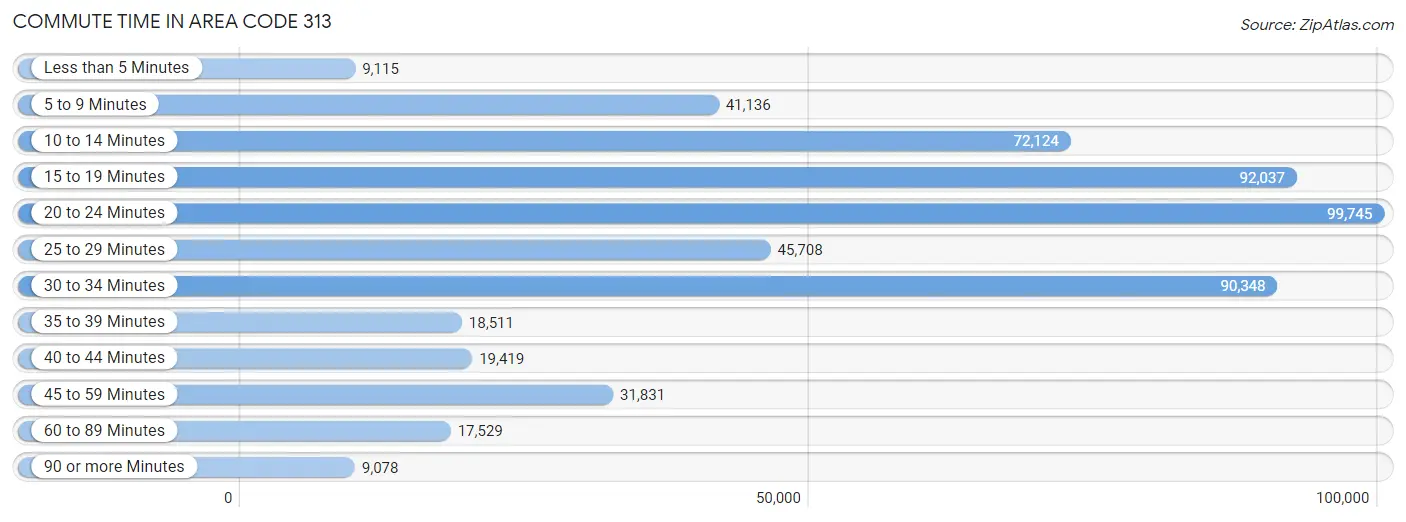
| Commute Time | # Commuters | % Commuters |
| Less than 5 Minutes | 9,115 | 1.7% |
| 5 to 9 Minutes | 41,136 | 7.5% |
| 10 to 14 Minutes | 72,124 | 13.2% |
| 15 to 19 Minutes | 92,037 | 16.8% |
| 20 to 24 Minutes | 99,745 | 18.2% |
| 25 to 29 Minutes | 45,708 | 8.4% |
| 30 to 34 Minutes | 90,348 | 16.5% |
| 35 to 39 Minutes | 18,511 | 3.4% |
| 40 to 44 Minutes | 19,419 | 3.5% |
| 45 to 59 Minutes | 31,831 | 5.8% |
| 60 to 89 Minutes | 17,529 | 3.2% |
| 90 or more Minutes | 9,078 | 1.7% |
Commute Time by Sex in Area Code 313
The most common commute times in Area Code 313 are 20 to 24 minutes (52,461 commuters, 18.6%) for males and 20 to 24 minutes (47,284 commuters, 17.9%) for females.
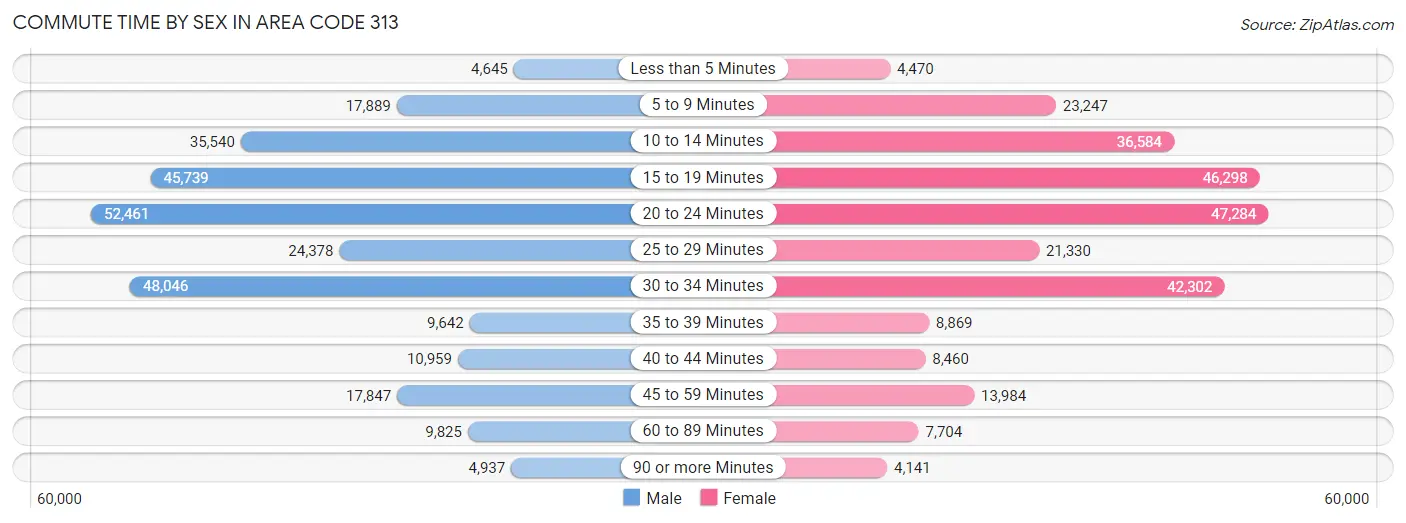
| Commute Time | Male | Female |
| Less than 5 Minutes | 4,645 (1.7%) | 4,470 (1.7%) |
| 5 to 9 Minutes | 17,889 (6.4%) | 23,247 (8.8%) |
| 10 to 14 Minutes | 35,540 (12.6%) | 36,584 (13.8%) |
| 15 to 19 Minutes | 45,739 (16.2%) | 46,298 (17.5%) |
| 20 to 24 Minutes | 52,461 (18.6%) | 47,284 (17.9%) |
| 25 to 29 Minutes | 24,378 (8.6%) | 21,330 (8.1%) |
| 30 to 34 Minutes | 48,046 (17.0%) | 42,302 (16.0%) |
| 35 to 39 Minutes | 9,642 (3.4%) | 8,869 (3.4%) |
| 40 to 44 Minutes | 10,959 (3.9%) | 8,460 (3.2%) |
| 45 to 59 Minutes | 17,847 (6.3%) | 13,984 (5.3%) |
| 60 to 89 Minutes | 9,825 (3.5%) | 7,704 (2.9%) |
| 90 or more Minutes | 4,937 (1.8%) | 4,141 (1.6%) |
Time of Departure to Work by Sex in Area Code 313
The most frequent times of departure to work in Area Code 313 are 7:00 AM to 7:29 AM (31,242, 11.1%) for males and 8:00 AM to 8:29 AM (35,648, 13.5%) for females.
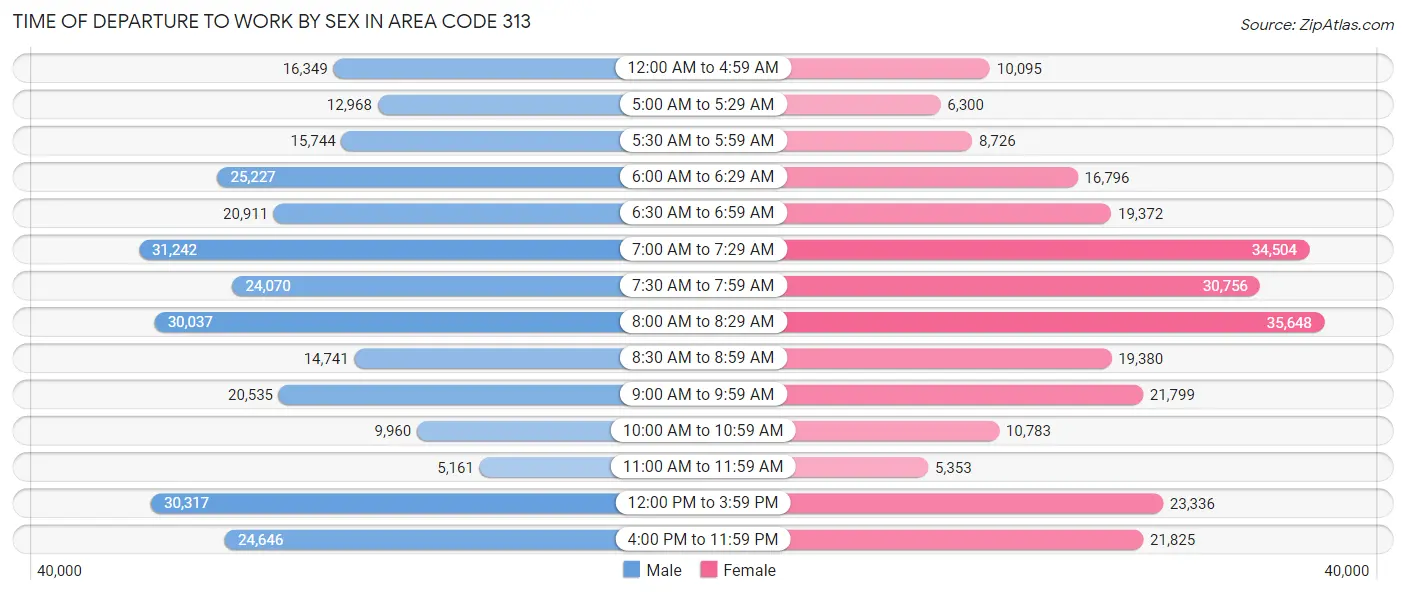
| Time of Departure | Male | Female |
| 12:00 AM to 4:59 AM | 16,349 (5.8%) | 10,095 (3.8%) |
| 5:00 AM to 5:29 AM | 12,968 (4.6%) | 6,300 (2.4%) |
| 5:30 AM to 5:59 AM | 15,744 (5.6%) | 8,726 (3.3%) |
| 6:00 AM to 6:29 AM | 25,227 (8.9%) | 16,796 (6.4%) |
| 6:30 AM to 6:59 AM | 20,911 (7.4%) | 19,372 (7.3%) |
| 7:00 AM to 7:29 AM | 31,242 (11.1%) | 34,504 (13.0%) |
| 7:30 AM to 7:59 AM | 24,070 (8.5%) | 30,756 (11.6%) |
| 8:00 AM to 8:29 AM | 30,037 (10.6%) | 35,648 (13.5%) |
| 8:30 AM to 8:59 AM | 14,741 (5.2%) | 19,380 (7.3%) |
| 9:00 AM to 9:59 AM | 20,535 (7.3%) | 21,799 (8.2%) |
| 10:00 AM to 10:59 AM | 9,960 (3.5%) | 10,783 (4.1%) |
| 11:00 AM to 11:59 AM | 5,161 (1.8%) | 5,353 (2.0%) |
| 12:00 PM to 3:59 PM | 30,317 (10.7%) | 23,336 (8.8%) |
| 4:00 PM to 11:59 PM | 24,646 (8.7%) | 21,825 (8.3%) |
| Total | 281,908 (100.0%) | 264,673 (100.0%) |
Housing Occupancy in Area Code 313
Occupancy by Ownership in Area Code 313
Of the total 587,638 dwellings in Area Code 313, owner-occupied units account for 354,291 (60.3%), while renter-occupied units make up 233,347 (39.7%).
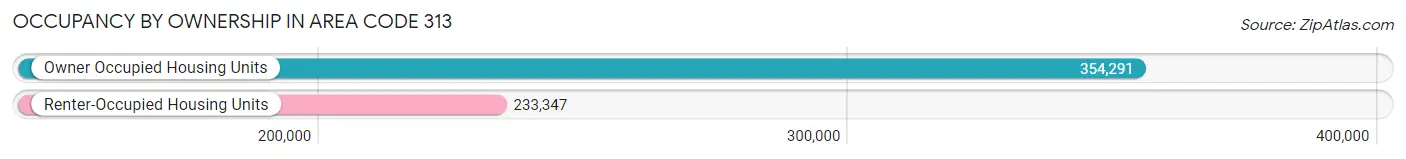
| Occupancy | # Housing Units | % Housing Units |
| Owner Occupied Housing Units | 354,291 | 60.3% |
| Renter-Occupied Housing Units | 233,347 | 39.7% |
| Total Occupied Housing Units | 587,638 | 100.0% |
Occupancy by Household Size in Area Code 313
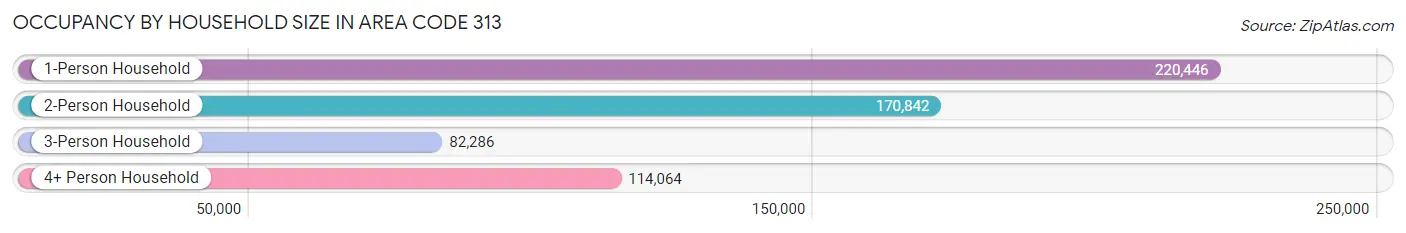
| Household Size | # Housing Units | % Housing Units |
| 1-Person Household | 220,446 | 37.5% |
| 2-Person Household | 170,842 | 29.1% |
| 3-Person Household | 82,286 | 14.0% |
| 4+ Person Household | 114,064 | 19.4% |
| Total Housing Units | 587,638 | 100.0% |
Occupancy by Ownership by Household Size in Area Code 313
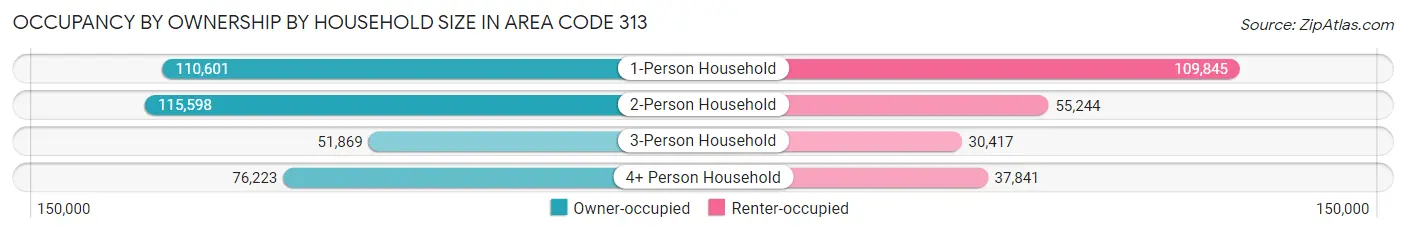
| Household Size | Owner-occupied | Renter-occupied |
| 1-Person Household | 110,601 (50.2%) | 109,845 (49.8%) |
| 2-Person Household | 115,598 (67.7%) | 55,244 (32.3%) |
| 3-Person Household | 51,869 (63.0%) | 30,417 (37.0%) |
| 4+ Person Household | 76,223 (66.8%) | 37,841 (33.2%) |
| Total Housing Units | 354,291 (60.3%) | 233,347 (39.7%) |
Occupancy by Educational Attainment in Area Code 313
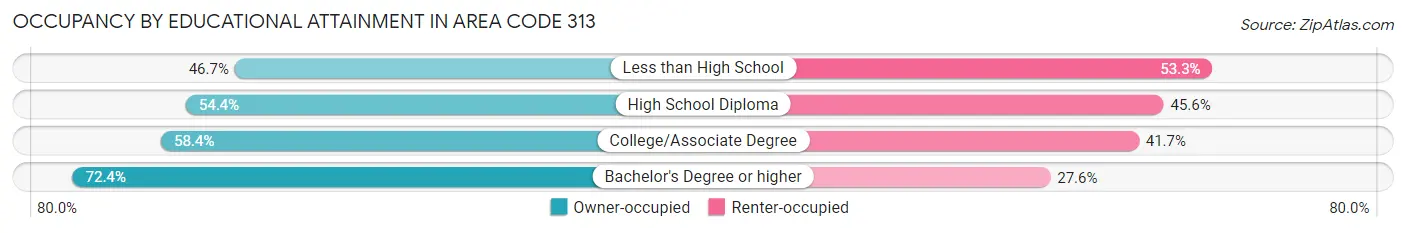
| Household Size | Owner-occupied | Renter-occupied |
| Less than High School | 29,465 (46.7%) | 33,664 (53.3%) |
| High School Diploma | 82,485 (54.4%) | 69,073 (45.6%) |
| College/Associate Degree | 114,767 (58.4%) | 81,931 (41.6%) |
| Bachelor's Degree or higher | 127,574 (72.4%) | 48,679 (27.6%) |
Occupancy by Age of Householder in Area Code 313
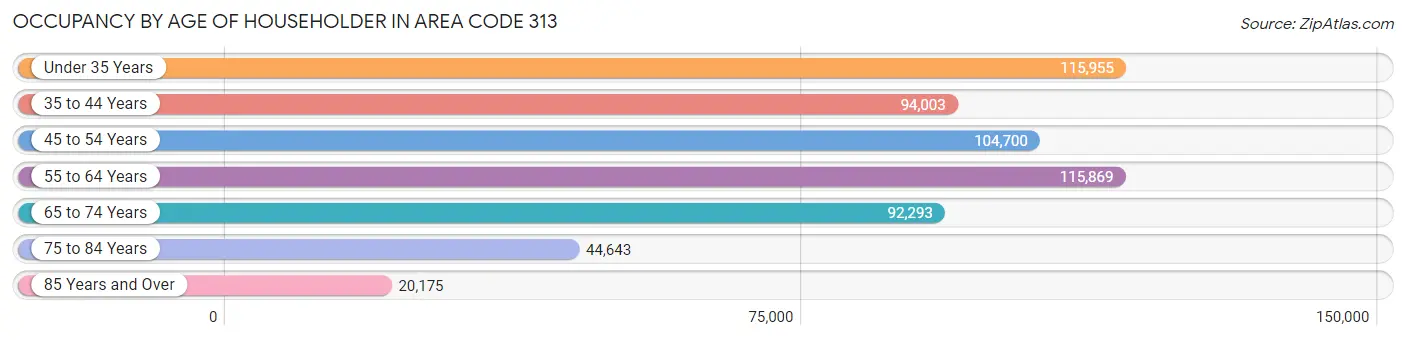
| Age Bracket | # Households | % Households |
| Under 35 Years | 115,955 | 19.7% |
| 35 to 44 Years | 94,003 | 16.0% |
| 45 to 54 Years | 104,700 | 17.8% |
| 55 to 64 Years | 115,869 | 19.7% |
| 65 to 74 Years | 92,293 | 15.7% |
| 75 to 84 Years | 44,643 | 7.6% |
| 85 Years and Over | 20,175 | 3.4% |
| Total | 587,638 | 100.0% |
Housing Finances in Area Code 313
Median Income by Occupancy in Area Code 313
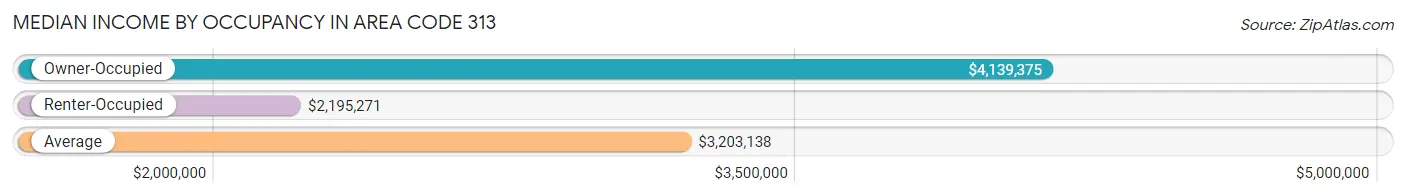
| Occupancy Type | # Households | Median Income |
| Owner-Occupied | 354,291 (60.3%) | $4,139,375 |
| Renter-Occupied | 233,347 (39.7%) | $2,195,271 |
| Average | 587,638 (100.0%) | $3,203,138 |
Occupancy by Householder Income Bracket in Area Code 313
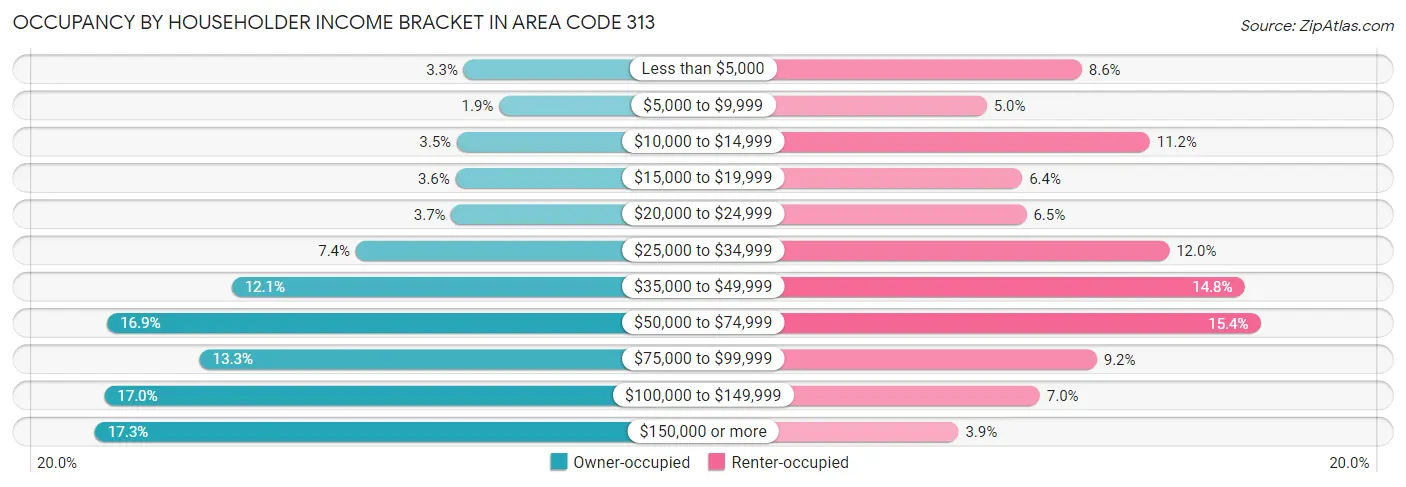
| Income Bracket | Owner-occupied | Renter-occupied |
| Less than $5,000 | 11,589 (3.3%) | 20,107 (8.6%) |
| $5,000 to $9,999 | 6,795 (1.9%) | 11,665 (5.0%) |
| $10,000 to $14,999 | 12,512 (3.5%) | 26,162 (11.2%) |
| $15,000 to $19,999 | 12,696 (3.6%) | 14,819 (6.4%) |
| $20,000 to $24,999 | 13,246 (3.7%) | 15,180 (6.5%) |
| $25,000 to $34,999 | 26,155 (7.4%) | 27,896 (11.9%) |
| $35,000 to $49,999 | 42,899 (12.1%) | 34,556 (14.8%) |
| $50,000 to $74,999 | 59,714 (16.9%) | 35,974 (15.4%) |
| $75,000 to $99,999 | 47,234 (13.3%) | 21,455 (9.2%) |
| $100,000 to $149,999 | 60,074 (17.0%) | 16,390 (7.0%) |
| $150,000 or more | 61,377 (17.3%) | 9,143 (3.9%) |
| Total | 354,291 (100.0%) | 233,347 (100.0%) |
Monthly Housing Cost Tiers in Area Code 313
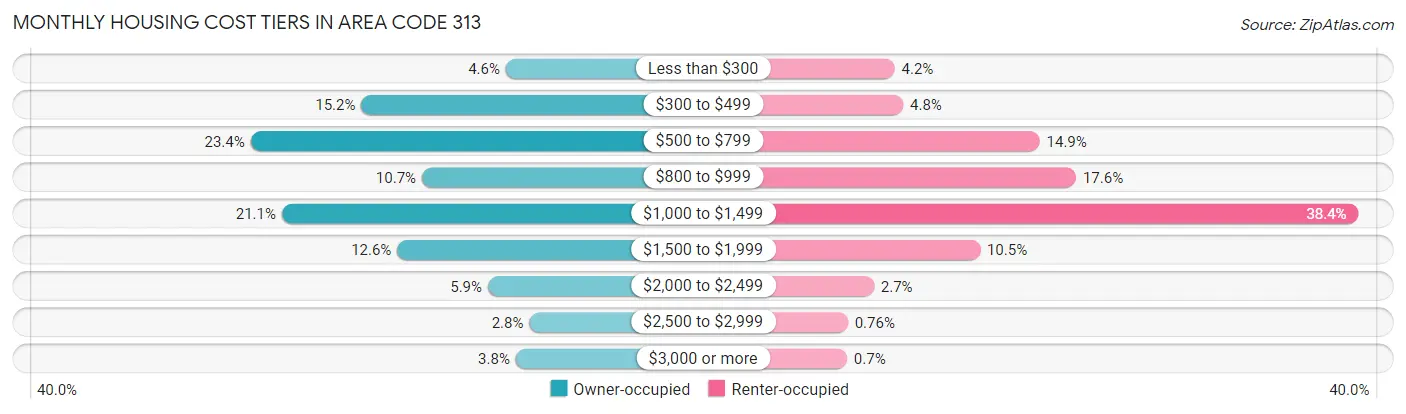
| Monthly Cost | Owner-occupied | Renter-occupied |
| Less than $300 | 16,170 (4.6%) | 9,826 (4.2%) |
| $300 to $499 | 53,841 (15.2%) | 11,302 (4.8%) |
| $500 to $799 | 82,748 (23.4%) | 34,737 (14.9%) |
| $800 to $999 | 38,034 (10.7%) | 41,005 (17.6%) |
| $1,000 to $1,499 | 74,605 (21.1%) | 89,528 (38.4%) |
| $1,500 to $1,999 | 44,489 (12.6%) | 24,493 (10.5%) |
| $2,000 to $2,499 | 20,830 (5.9%) | 6,257 (2.7%) |
| $2,500 to $2,999 | 10,015 (2.8%) | 1,779 (0.8%) |
| $3,000 or more | 13,559 (3.8%) | 1,635 (0.7%) |
| Total | 354,291 (100.0%) | 233,347 (100.0%) |
Physical Housing Characteristics in Area Code 313
Housing Structures in Area Code 313
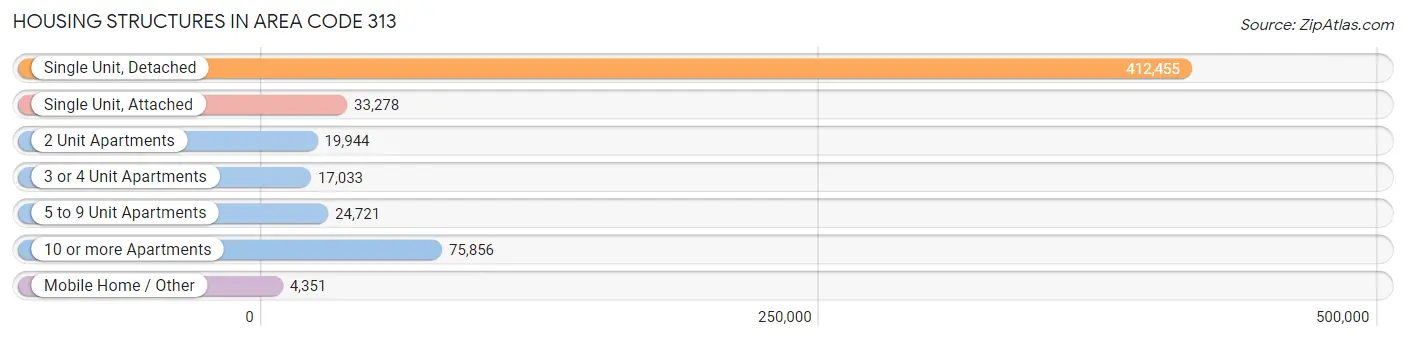
| Structure Type | # Housing Units | % Housing Units |
| Single Unit, Detached | 412,455 | 70.2% |
| Single Unit, Attached | 33,278 | 5.7% |
| 2 Unit Apartments | 19,944 | 3.4% |
| 3 or 4 Unit Apartments | 17,033 | 2.9% |
| 5 to 9 Unit Apartments | 24,721 | 4.2% |
| 10 or more Apartments | 75,856 | 12.9% |
| Mobile Home / Other | 4,351 | 0.7% |
| Total | 587,638 | 100.0% |
Housing Structures by Occupancy in Area Code 313
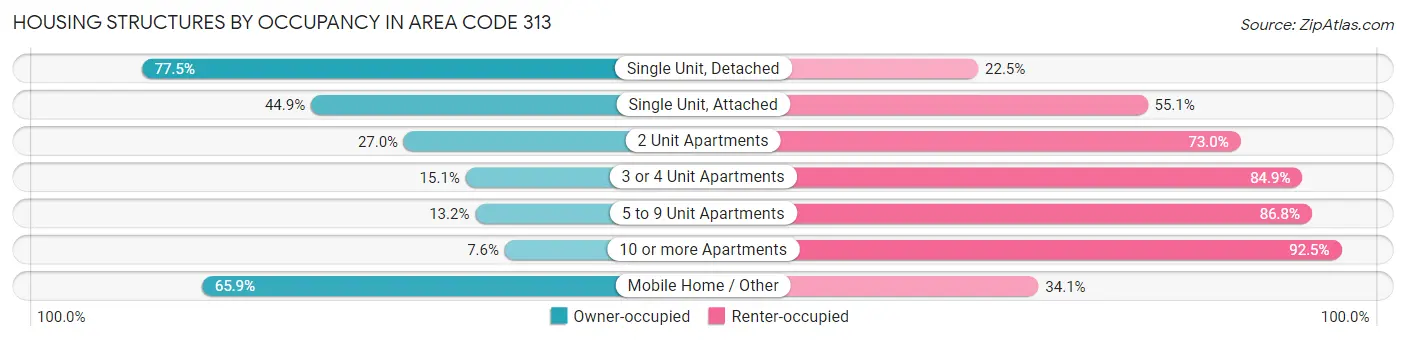
| Structure Type | Owner-occupied | Renter-occupied |
| Single Unit, Detached | 319,553 (77.5%) | 92,902 (22.5%) |
| Single Unit, Attached | 14,928 (44.9%) | 18,350 (55.1%) |
| 2 Unit Apartments | 5,377 (27.0%) | 14,567 (73.0%) |
| 3 or 4 Unit Apartments | 2,569 (15.1%) | 14,464 (84.9%) |
| 5 to 9 Unit Apartments | 3,273 (13.2%) | 21,448 (86.8%) |
| 10 or more Apartments | 5,725 (7.5%) | 70,131 (92.4%) |
| Mobile Home / Other | 2,866 (65.9%) | 1,485 (34.1%) |
| Total | 354,291 (60.3%) | 233,347 (39.7%) |
Housing Structures by Number of Rooms in Area Code 313
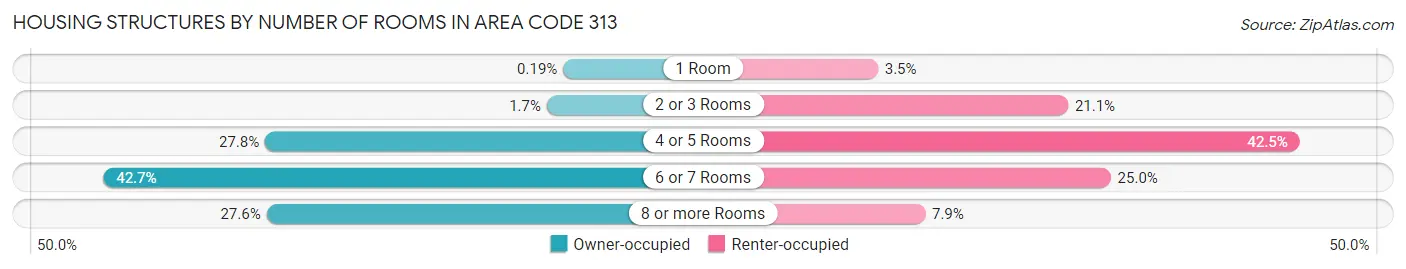
| Number of Rooms | Owner-occupied | Renter-occupied |
| 1 Room | 657 (0.2%) | 8,159 (3.5%) |
| 2 or 3 Rooms | 6,019 (1.7%) | 49,204 (21.1%) |
| 4 or 5 Rooms | 98,349 (27.8%) | 99,189 (42.5%) |
| 6 or 7 Rooms | 151,369 (42.7%) | 58,421 (25.0%) |
| 8 or more Rooms | 97,897 (27.6%) | 18,374 (7.9%) |
| Total | 354,291 (100.0%) | 233,347 (100.0%) |
Housing Structure by Heating Type in Area Code 313
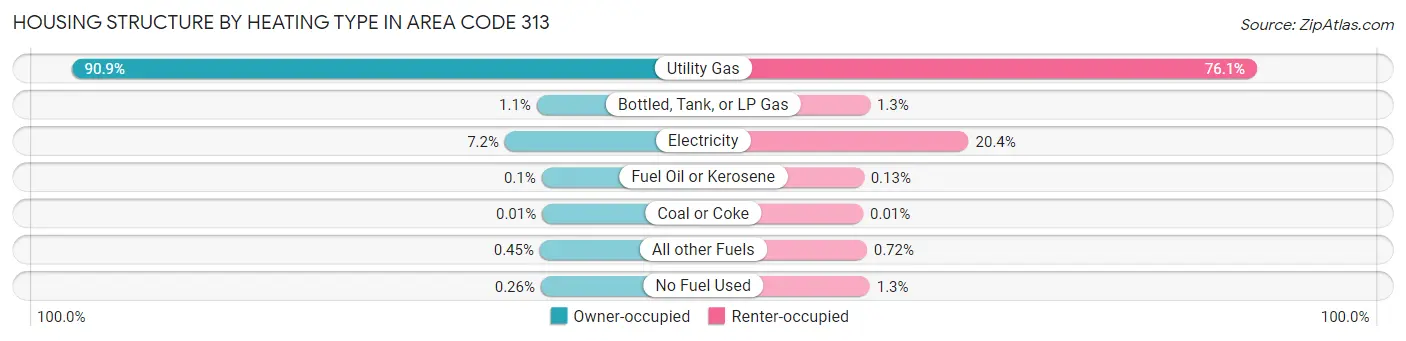
| Heating Type | Owner-occupied | Renter-occupied |
| Utility Gas | 322,102 (90.9%) | 177,596 (76.1%) |
| Bottled, Tank, or LP Gas | 3,733 (1.1%) | 3,124 (1.3%) |
| Electricity | 25,556 (7.2%) | 47,606 (20.4%) |
| Fuel Oil or Kerosene | 342 (0.1%) | 294 (0.1%) |
| Coal or Coke | 24 (0.0%) | 19 (0.0%) |
| All other Fuels | 1,598 (0.4%) | 1,678 (0.7%) |
| No Fuel Used | 936 (0.3%) | 3,030 (1.3%) |
| Total | 354,291 (100.0%) | 233,347 (100.0%) |
Household Vehicle Usage in Area Code 313
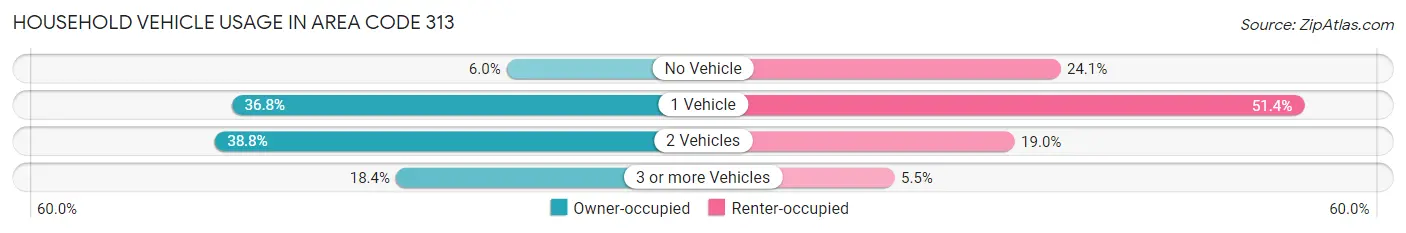
| Vehicles per Household | Owner-occupied | Renter-occupied |
| No Vehicle | 21,346 (6.0%) | 56,244 (24.1%) |
| 1 Vehicle | 130,379 (36.8%) | 120,003 (51.4%) |
| 2 Vehicles | 137,301 (38.8%) | 44,254 (19.0%) |
| 3 or more Vehicles | 65,265 (18.4%) | 12,846 (5.5%) |
| Total | 354,291 (100.0%) | 233,347 (100.0%) |
Real Estate & Mortgages in Area Code 313
Real Estate and Mortgage Overview in Area Code 313
| Characteristic | Without Mortgage | With Mortgage |
| Housing Units | 175,164 | 179,127 |
| Median Property Value | $8,199,900 | $10,689,000 |
| Median Household Income | $3,359,307 | $43,060 |
| Monthly Housing Costs | $33,531 | $12,899 |
| Real Estate Taxes | $136,888 | $6,040 |
Property Value by Mortgage Status in Area Code 313
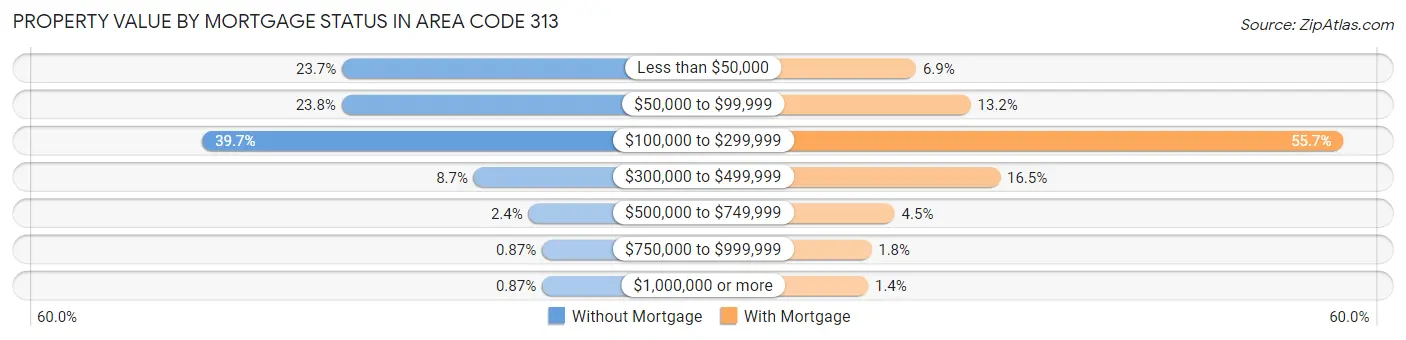
| Property Value | Without Mortgage | With Mortgage |
| Less than $50,000 | 41,540 (23.7%) | 12,377 (6.9%) |
| $50,000 to $99,999 | 41,614 (23.8%) | 23,548 (13.2%) |
| $100,000 to $299,999 | 69,572 (39.7%) | 99,835 (55.7%) |
| $300,000 to $499,999 | 15,172 (8.7%) | 29,568 (16.5%) |
| $500,000 to $749,999 | 4,225 (2.4%) | 8,015 (4.5%) |
| $750,000 to $999,999 | 1,525 (0.9%) | 3,231 (1.8%) |
| $1,000,000 or more | 1,516 (0.9%) | 2,553 (1.4%) |
| Total | 175,164 (100.0%) | 179,127 (100.0%) |
Household Income by Mortgage Status in Area Code 313
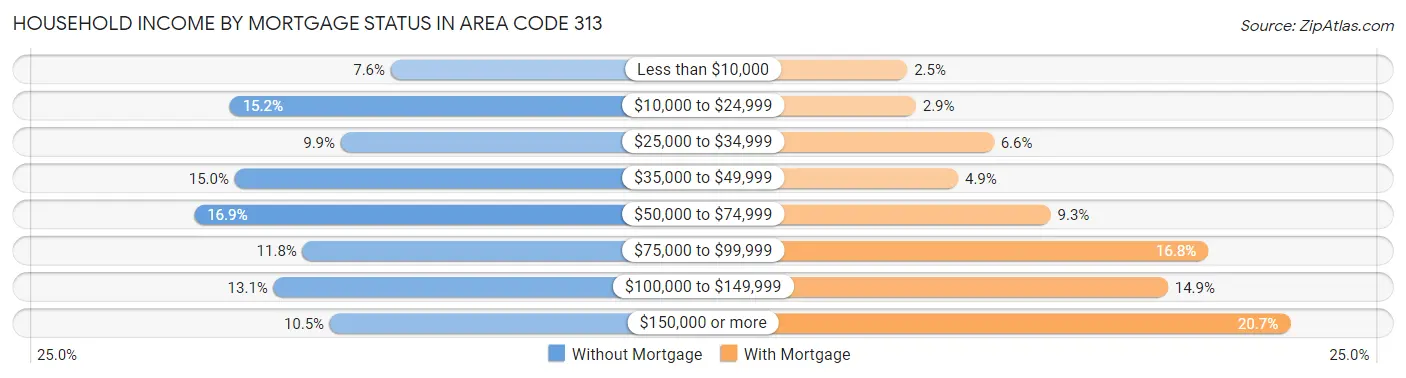
| Household Income | Without Mortgage | With Mortgage |
| Less than $10,000 | 13,245 (7.6%) | 4,407 (2.5%) |
| $10,000 to $24,999 | 26,675 (15.2%) | 5,139 (2.9%) |
| $25,000 to $34,999 | 17,406 (9.9%) | 11,779 (6.6%) |
| $35,000 to $49,999 | 26,259 (15.0%) | 8,749 (4.9%) |
| $50,000 to $74,999 | 29,638 (16.9%) | 16,640 (9.3%) |
| $75,000 to $99,999 | 20,605 (11.8%) | 30,076 (16.8%) |
| $100,000 to $149,999 | 23,019 (13.1%) | 26,629 (14.9%) |
| $150,000 or more | 18,317 (10.5%) | 37,055 (20.7%) |
| Total | 175,164 (100.0%) | 179,127 (100.0%) |
Property Value to Household Income Ratio in Area Code 313
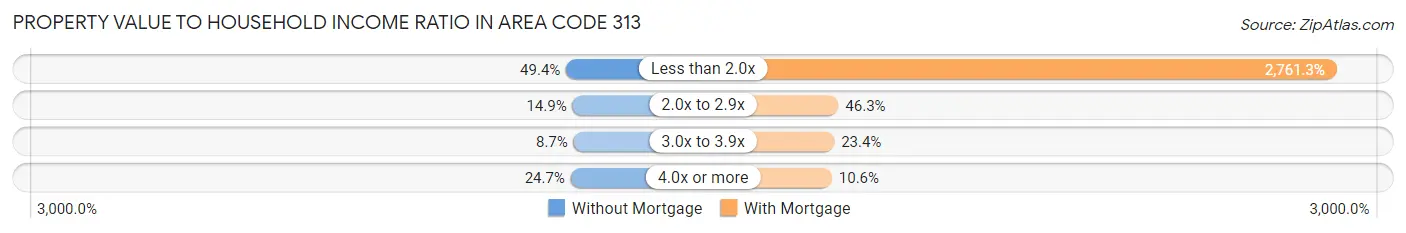
| Value-to-Income Ratio | Without Mortgage | With Mortgage |
| Less than 2.0x | 86,561 (49.4%) | 4,946,219 (2,761.3%) |
| 2.0x to 2.9x | 26,063 (14.9%) | 82,938 (46.3%) |
| 3.0x to 3.9x | 15,318 (8.7%) | 41,835 (23.4%) |
| 4.0x or more | 43,278 (24.7%) | 18,960 (10.6%) |
| Total | 175,164 (100.0%) | 179,127 (100.0%) |
Real Estate Taxes by Mortgage Status in Area Code 313
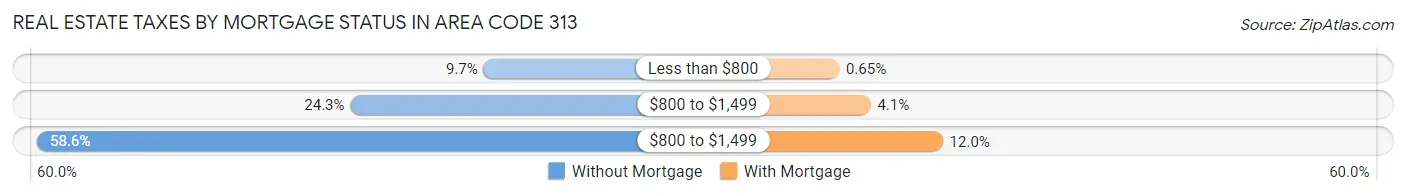
| Property Taxes | Without Mortgage | With Mortgage |
| Less than $800 | 16,986 (9.7%) | 1,158 (0.6%) |
| $800 to $1,499 | 42,569 (24.3%) | 7,338 (4.1%) |
| $800 to $1,499 | 102,706 (58.6%) | 21,509 (12.0%) |
| Total | 175,164 (100.0%) | 179,127 (100.0%) |
Health & Disability in Area Code 313
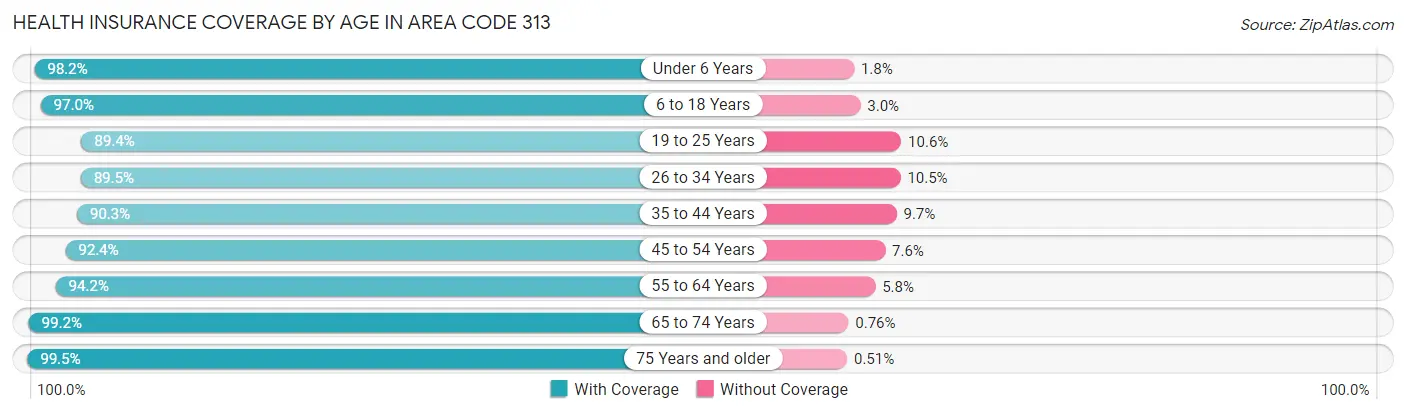
Health Insurance Coverage by Age in Area Code 313
| Age Bracket | With Coverage | Without Coverage |
| Under 6 Years | 113,878 (98.2%) | 2,102 (1.8%) |
| 6 to 18 Years | 241,368 (97.0%) | 7,475 (3.0%) |
| 19 to 25 Years | 125,401 (89.4%) | 14,861 (10.6%) |
| 26 to 34 Years | 179,045 (89.5%) | 20,941 (10.5%) |
| 35 to 44 Years | 158,467 (90.3%) | 17,095 (9.7%) |
| 45 to 54 Years | 166,328 (92.4%) | 13,703 (7.6%) |
| 55 to 64 Years | 178,970 (94.2%) | 10,959 (5.8%) |
| 65 to 74 Years | 136,948 (99.2%) | 1,042 (0.8%) |
| 75 Years and older | 89,372 (99.5%) | 457 (0.5%) |
| Total | 1,389,777 (94.0%) | 88,635 (6.0%) |
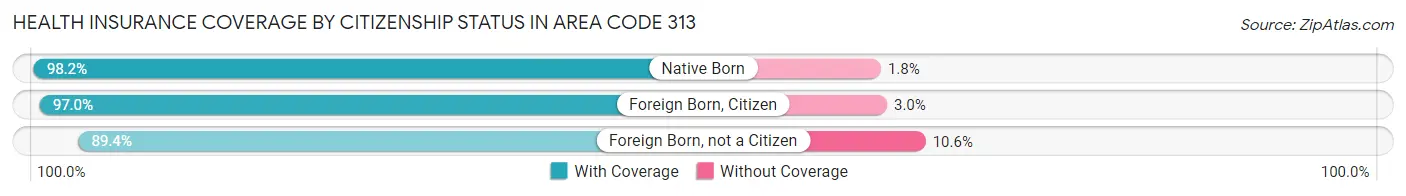
Health Insurance Coverage by Citizenship Status in Area Code 313
| Citizenship Status | With Coverage | Without Coverage |
| Native Born | 113,878 (98.2%) | 2,102 (1.8%) |
| Foreign Born, Citizen | 241,368 (97.0%) | 7,475 (3.0%) |
| Foreign Born, not a Citizen | 125,401 (89.4%) | 14,861 (10.6%) |
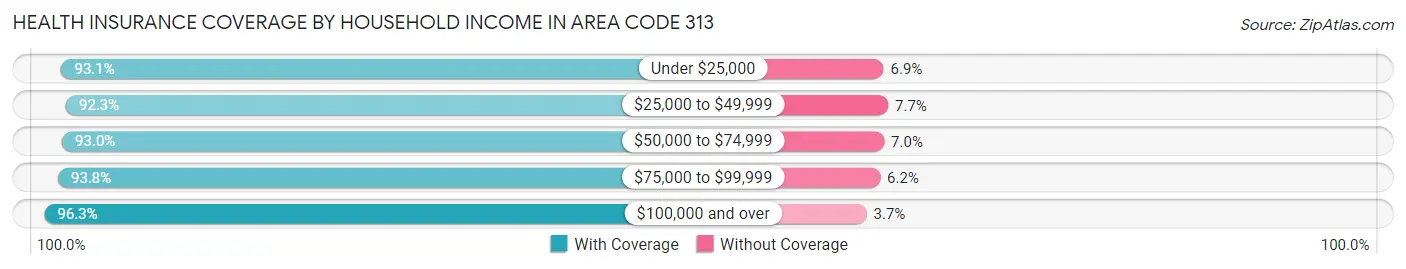
Health Insurance Coverage by Household Income in Area Code 313
| Household Income | With Coverage | Without Coverage |
| Under $25,000 | 262,582 (93.1%) | 19,445 (6.9%) |
| $25,000 to $49,999 | 273,688 (92.3%) | 22,964 (7.7%) |
| $50,000 to $74,999 | 225,290 (93.0%) | 16,959 (7.0%) |
| $75,000 to $99,999 | 176,615 (93.8%) | 11,763 (6.2%) |
| $100,000 and over | 442,462 (96.3%) | 17,024 (3.7%) |
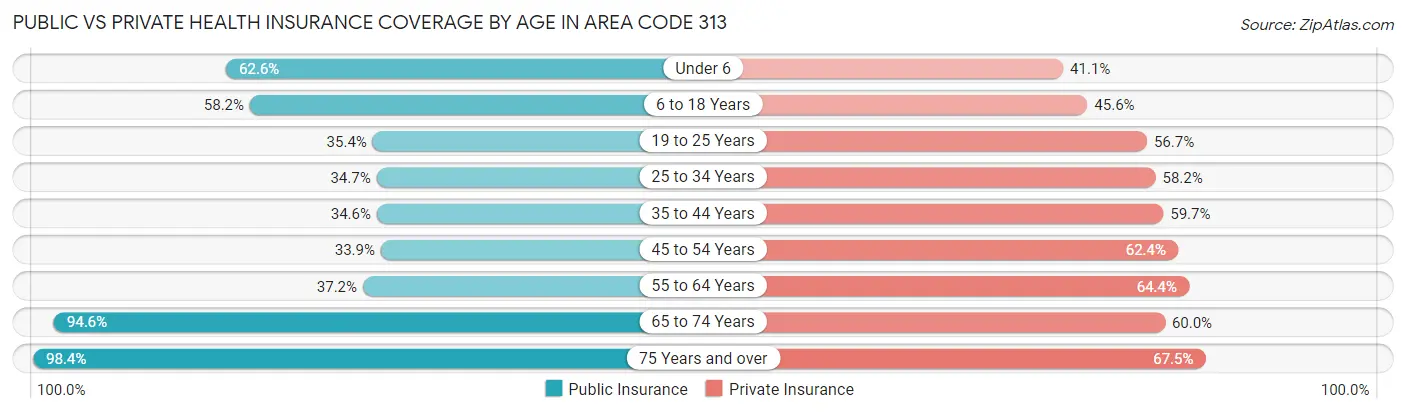
Public vs Private Health Insurance Coverage by Age in Area Code 313
| Age Bracket | Public Insurance | Private Insurance |
| Under 6 | 72,630 (62.6%) | 47,659 (41.1%) |
| 6 to 18 Years | 144,791 (58.2%) | 113,443 (45.6%) |
| 19 to 25 Years | 49,647 (35.4%) | 79,464 (56.7%) |
| 25 to 34 Years | 69,369 (34.7%) | 116,459 (58.2%) |
| 35 to 44 Years | 60,801 (34.6%) | 104,777 (59.7%) |
| 45 to 54 Years | 60,989 (33.9%) | 112,268 (62.4%) |
| 55 to 64 Years | 70,670 (37.2%) | 122,312 (64.4%) |
| 65 to 74 Years | 130,484 (94.6%) | 82,760 (60.0%) |
| 75 Years and over | 88,412 (98.4%) | 60,600 (67.5%) |
| Total | 747,793 (50.6%) | 839,742 (56.8%) |
Disability Status by Sex by Age in Area Code 313
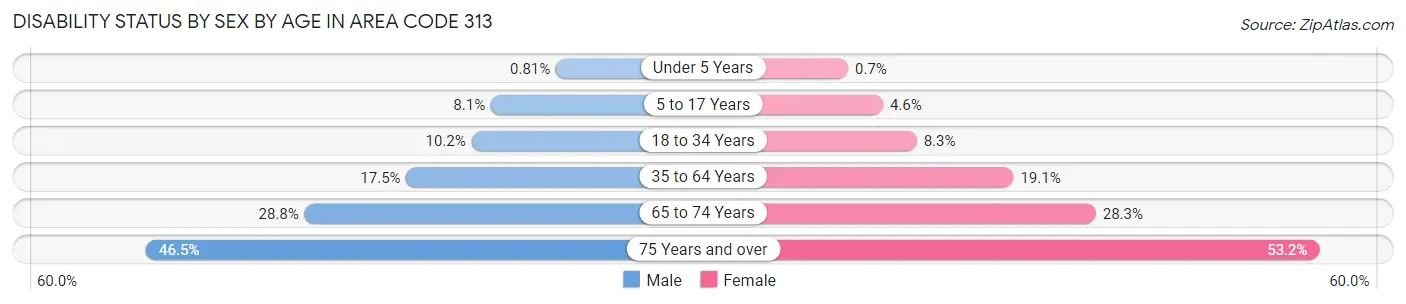
| Age Bracket | Male | Female |
| Under 5 Years | 400 (0.8%) | 328 (0.7%) |
| 5 to 17 Years | 10,344 (8.1%) | 5,626 (4.6%) |
| 18 to 34 Years | 18,153 (10.2%) | 15,081 (8.3%) |
| 35 to 64 Years | 46,107 (17.5%) | 53,879 (19.1%) |
| 65 to 74 Years | 17,901 (28.8%) | 21,466 (28.3%) |
| 75 Years and over | 16,203 (46.5%) | 29,219 (53.2%) |
Disability Class by Sex by Age in Area Code 313
Disability Class: Hearing Difficulty
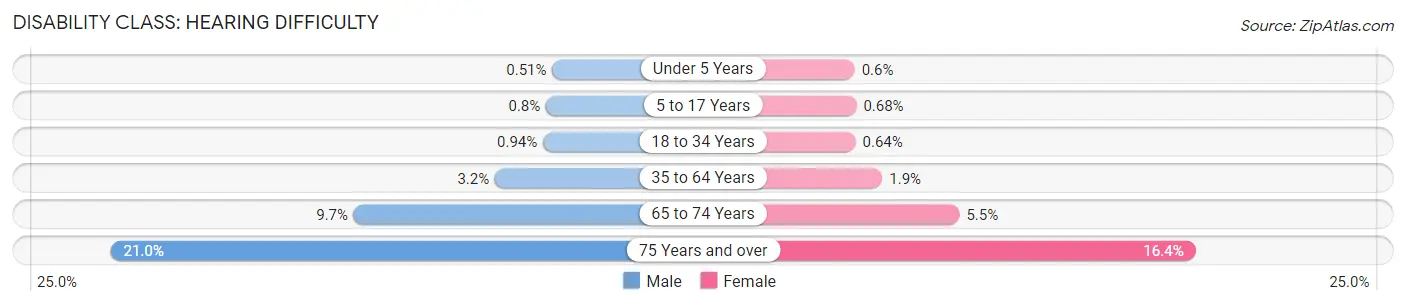
| Age Bracket | Male | Female |
| Under 5 Years | 249 (0.5%) | 280 (0.6%) |
| 5 to 17 Years | 1,031 (0.8%) | 837 (0.7%) |
| 18 to 34 Years | 1,668 (0.9%) | 1,153 (0.6%) |
| 35 to 64 Years | 8,351 (3.2%) | 5,308 (1.9%) |
| 65 to 74 Years | 6,039 (9.7%) | 4,147 (5.5%) |
| 75 Years and over | 7,328 (21.0%) | 9,019 (16.4%) |
Disability Class: Vision Difficulty
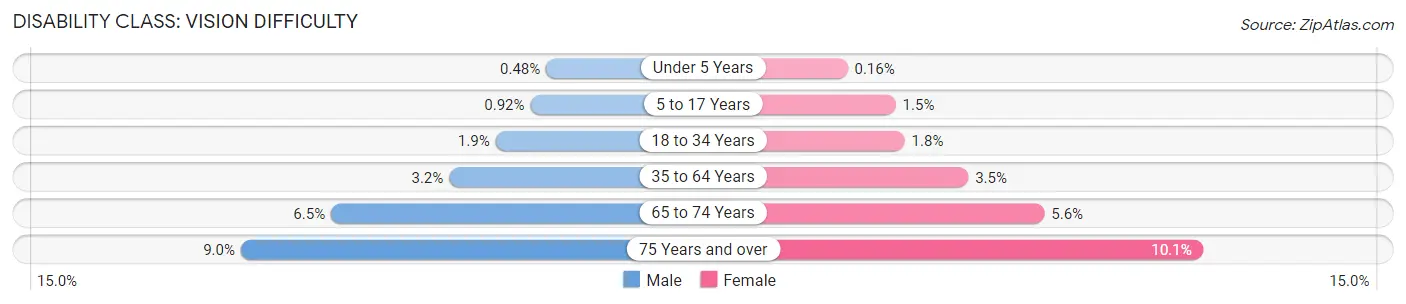
| Age Bracket | Male | Female |
| Under 5 Years | 234 (0.5%) | 74 (0.2%) |
| 5 to 17 Years | 1,184 (0.9%) | 1,843 (1.5%) |
| 18 to 34 Years | 3,367 (1.9%) | 3,169 (1.8%) |
| 35 to 64 Years | 8,381 (3.2%) | 9,930 (3.5%) |
| 65 to 74 Years | 4,021 (6.5%) | 4,279 (5.6%) |
| 75 Years and over | 3,133 (9.0%) | 5,535 (10.1%) |
Disability Class: Cognitive Difficulty
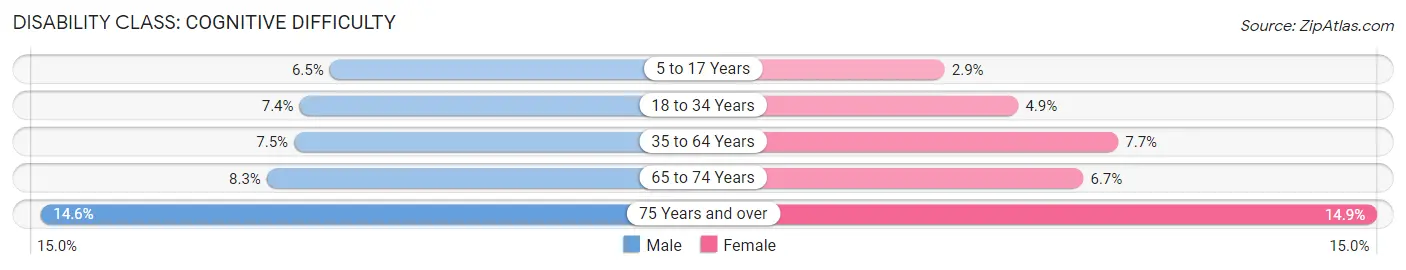
| Age Bracket | Male | Female |
| 5 to 17 Years | 8,357 (6.5%) | 3,517 (2.9%) |
| 18 to 34 Years | 13,058 (7.3%) | 8,899 (4.9%) |
| 35 to 64 Years | 19,787 (7.5%) | 21,707 (7.7%) |
| 65 to 74 Years | 5,133 (8.3%) | 5,107 (6.7%) |
| 75 Years and over | 5,079 (14.6%) | 8,185 (14.9%) |
Disability Class: Ambulatory Difficulty
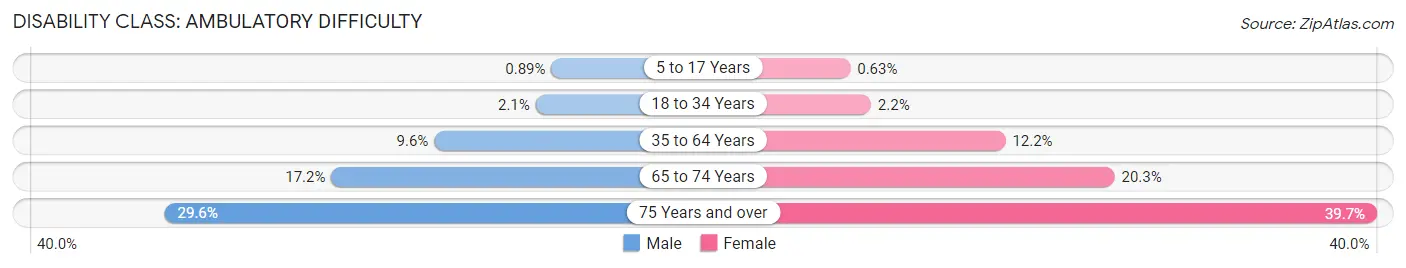
| Age Bracket | Male | Female |
| 5 to 17 Years | 1,148 (0.9%) | 775 (0.6%) |
| 18 to 34 Years | 3,652 (2.1%) | 3,915 (2.2%) |
| 35 to 64 Years | 25,301 (9.6%) | 34,238 (12.1%) |
| 65 to 74 Years | 10,702 (17.2%) | 15,369 (20.3%) |
| 75 Years and over | 10,323 (29.6%) | 21,834 (39.7%) |
Disability Class: Self-Care Difficulty
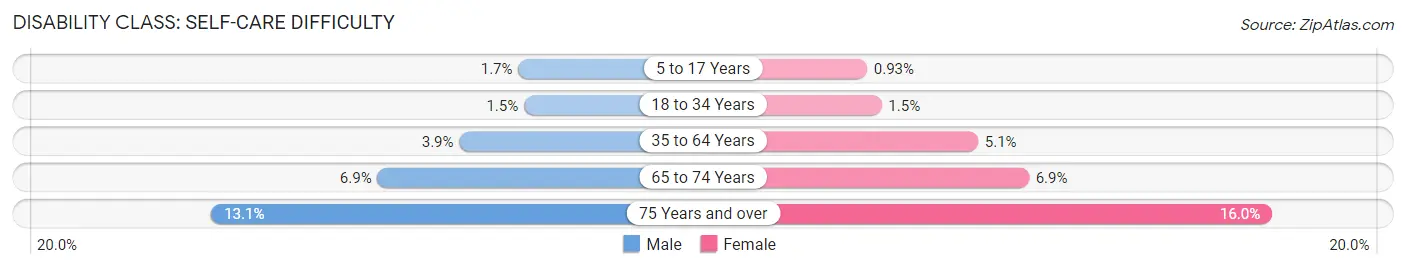
| Age Bracket | Male | Female |
| 5 to 17 Years | 2,138 (1.7%) | 1,134 (0.9%) |
| 18 to 34 Years | 2,603 (1.5%) | 2,653 (1.5%) |
| 35 to 64 Years | 10,174 (3.9%) | 14,240 (5.1%) |
| 65 to 74 Years | 4,287 (6.9%) | 5,268 (6.9%) |
| 75 Years and over | 4,558 (13.1%) | 8,777 (16.0%) |
Technology Access in Area Code 313
Computing Device Access in Area Code 313
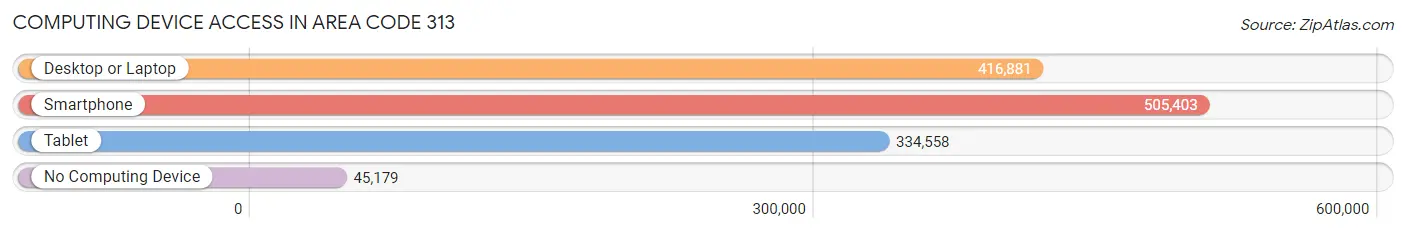
| Device Type | # Households | % Households |
| Desktop or Laptop | 416,881 | 70.9% |
| Smartphone | 505,403 | 86.0% |
| Tablet | 334,558 | 56.9% |
| No Computing Device | 45,179 | 7.7% |
| Total | 587,638 | 100.0% |
Internet Access in Area Code 313
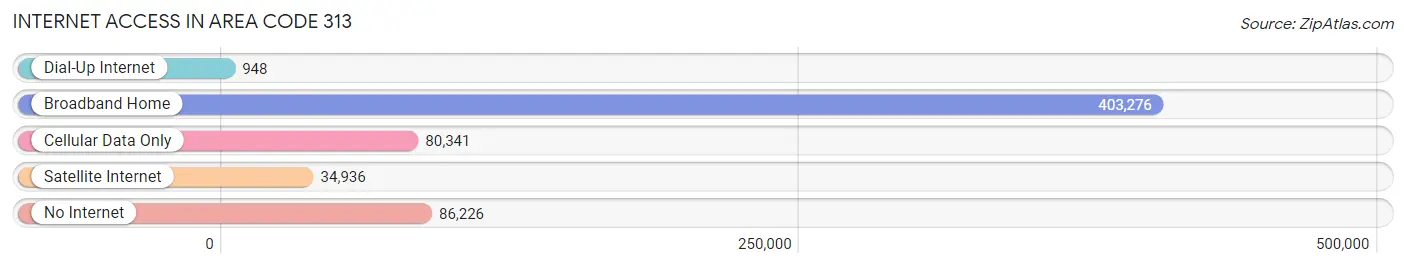
| Internet Type | # Households | % Households |
| Dial-Up Internet | 948 | 0.2% |
| Broadband Home | 403,276 | 68.6% |
| Cellular Data Only | 80,341 | 13.7% |
| Satellite Internet | 34,936 | 5.9% |
| No Internet | 86,226 | 14.7% |
| Total | 587,638 | 100.0% |
Area Code 313 Summary
Geography
Area code 313 is an area code in the North American Numbering Plan (NANP) for the city of Detroit, Michigan and its surrounding suburbs. It is one of the original area codes established in 1947. The area code covers the entire city of Detroit, as well as the cities of Dearborn, Hamtramck, and Highland Park.
Social
Area code 313 is a source of pride for many Detroiters. It is often used as a symbol of the city and its people, and is often seen on clothing, jewelry, and other items. It is also used as a hashtag on social media to show support for the city and its people.
Economics
Area code 313 is an important part of the Detroit economy. It is home to many businesses, including automotive companies, technology companies, and financial institutions. It is also home to many universities and colleges, as well as a number of hospitals and medical centers.
Demographics
Area code 313 is home to a diverse population. According to the 2010 census, the population of the area code is approximately 1.3 million people. The population is made up of a variety of ethnicities, including African American, White, Hispanic, and Asian. The median household income is approximately $35,000, and the median age is 33.
Common Questions
What is Per Capita Income in Area Code 313?
Per Capita income in Area Code 313 is $33,280.
What is the Median Family Income in Area Code 313?
Median Family Income in Area Code 313 is $73,028.
What is the Median Household income in Area Code 313?
Median Household Income in Area Code 313 is $57,199.
What is Income or Wage Gap in Area Code 313?
Income or Wage Gap in Area Code 313 is 23.7%.
Women in Area Code 313 earn 76.3 cents for every dollar earned by a man.
What is Family Income Deficit in Area Code 313?
Family Income Deficit in Area Code 313 is $11,850.
Families that are below poverty line in Area Code 313 earn $11,850 less on average than the poverty threshold level.
What is Inequality or Gini Index in Area Code 313?
Inequality or Gini Index in Area Code 313 is 26.35.
What is the Total Population of Area Code 313?
Total Population of Area Code 313 is 1,489,185.
What is the Total Male Population of Area Code 313?
Total Male Population of Area Code 313 is 722,058.
What is the Total Female Population of Area Code 313?
Total Female Population of Area Code 313 is 767,127.
What is the Ratio of Males per 100 Females in Area Code 313?
There are 94.12 Males per 100 Females in Area Code 313.
What is the Ratio of Females per 100 Males in Area Code 313?
There are 106.24 Females per 100 Males in Area Code 313.
What is the Median Population Age in Area Code 313?
Median Population Age in Area Code 313 is 37.7 Years.
What is the Average Family Size in Area Code 313
Average Family Size in Area Code 313 is 3.4 People.
What is the Average Household Size in Area Code 313
Average Household Size in Area Code 313 is 2.5 People.
How Large is the Labor Force in Area Code 313?
There are 690,637 People in the Labor Forcein in Area Code 313.
What is the Percentage of People in the Labor Force in Area Code 313?
58.5% of People are in the Labor Force in Area Code 313.
What is the Unemployment Rate in Area Code 313?
Unemployment Rate in Area Code 313 is 10.0%.