Van Buren County, MI Map & Demographics
Van Buren County Map
Van Buren County Overview
$32,361
PER CAPITA INCOME
$80,321
AVG FAMILY INCOME
$65,531
AVG HOUSEHOLD INCOME
35.7%
WAGE / INCOME GAP [ % ]
64.3¢/ $1
WAGE / INCOME GAP [ $ ]
$11,004
FAMILY INCOME DEFICIT
0.43
INEQUALITY / GINI INDEX
75,636
TOTAL POPULATION
37,837
MALE POPULATION
37,799
FEMALE POPULATION
100.10
MALES / 100 FEMALES
99.90
FEMALES / 100 MALES
40.8
MEDIAN AGE
3.0
AVG FAMILY SIZE
2.5
AVG HOUSEHOLD SIZE
36,148
LABOR FORCE [ PEOPLE ]
60.0%
PERCENT IN LABOR FORCE
4.7%
UNEMPLOYMENT RATE
Van Buren County Area Codes
Income in Van Buren County
Income Overview in Van Buren County
Per Capita Income in Van Buren County is $32,361, while median incomes of families and households are $80,321 and $65,531 respectively.
| Characteristic | Number | Measure |
| Per Capita Income | 75,636 | $32,361 |
| Median Family Income | 20,989 | $80,321 |
| Mean Family Income | 20,989 | $95,147 |
| Median Household Income | 29,609 | $65,531 |
| Mean Household Income | 29,609 | $81,574 |
| Income Deficit | 20,989 | $11,004 |
| Wage / Income Gap (%) | 75,636 | 35.66% |
| Wage / Income Gap ($) | 75,636 | 64.34¢ per $1 |
| Gini / Inequality Index | 75,636 | 0.43 |
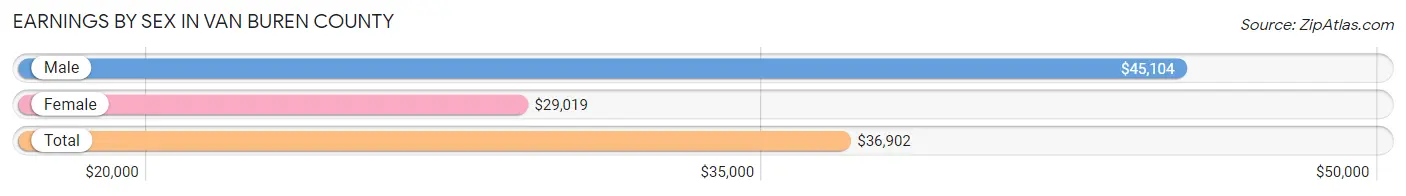
Earnings by Sex in Van Buren County
Average Earnings in Van Buren County are $36,902, $45,104 for men and $29,019 for women, a difference of 35.7%.
| Sex | Number | Average Earnings |
| Male | 20,271 (52.7%) | $45,104 |
| Female | 18,179 (47.3%) | $29,019 |
| Total | 38,450 (100.0%) | $36,902 |
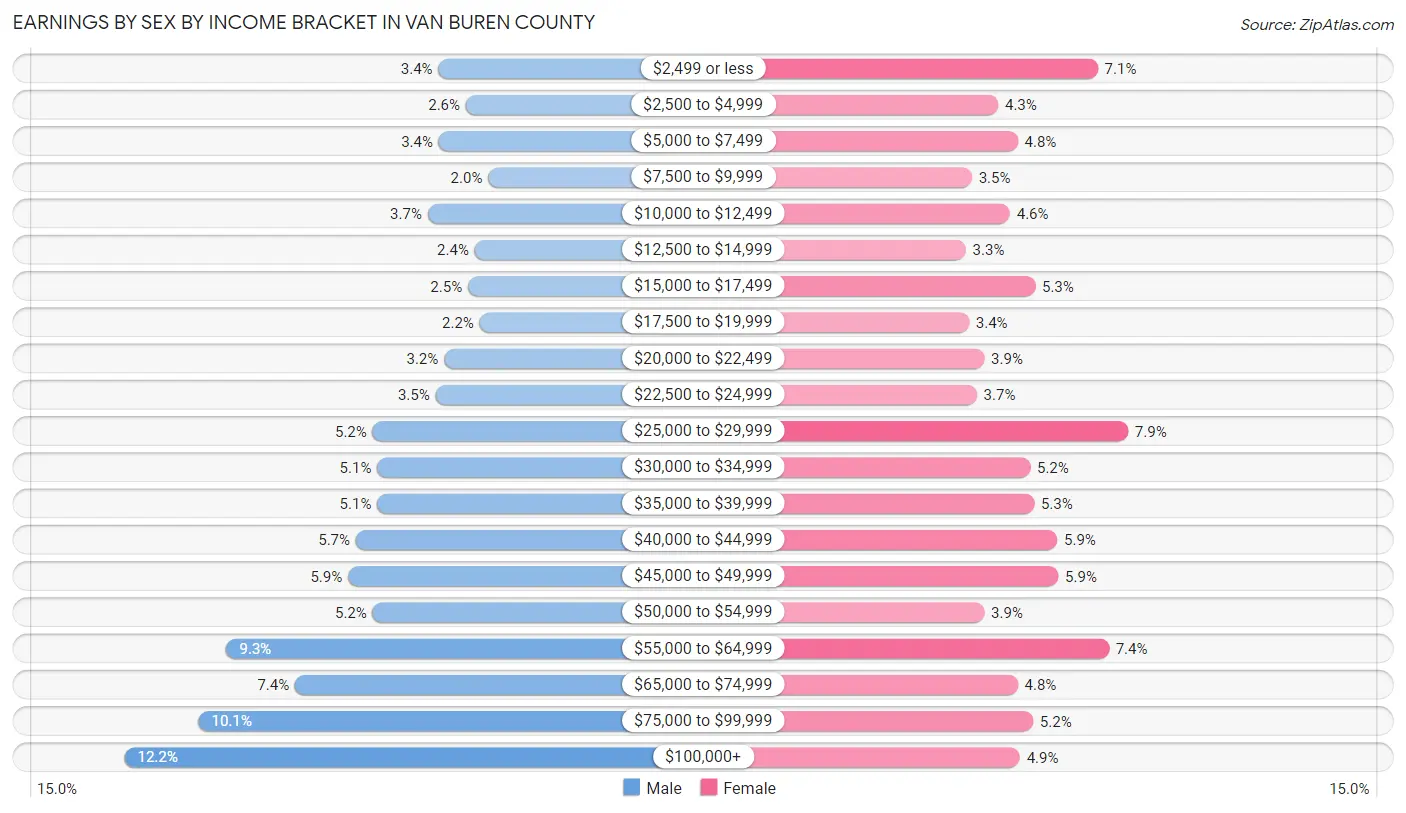
Earnings by Sex by Income Bracket in Van Buren County
The most common earnings brackets in Van Buren County are $100,000+ for men (2,471 | 12.2%) and $25,000 to $29,999 for women (1,436 | 7.9%).
| Income | Male | Female |
| $2,499 or less | 683 (3.4%) | 1,281 (7.0%) |
| $2,500 to $4,999 | 528 (2.6%) | 772 (4.3%) |
| $5,000 to $7,499 | 682 (3.4%) | 872 (4.8%) |
| $7,500 to $9,999 | 400 (2.0%) | 638 (3.5%) |
| $10,000 to $12,499 | 744 (3.7%) | 833 (4.6%) |
| $12,500 to $14,999 | 477 (2.4%) | 608 (3.3%) |
| $15,000 to $17,499 | 514 (2.5%) | 961 (5.3%) |
| $17,500 to $19,999 | 449 (2.2%) | 623 (3.4%) |
| $20,000 to $22,499 | 650 (3.2%) | 701 (3.9%) |
| $22,500 to $24,999 | 700 (3.5%) | 663 (3.6%) |
| $25,000 to $29,999 | 1,058 (5.2%) | 1,436 (7.9%) |
| $30,000 to $34,999 | 1,031 (5.1%) | 936 (5.1%) |
| $35,000 to $39,999 | 1,031 (5.1%) | 957 (5.3%) |
| $40,000 to $44,999 | 1,153 (5.7%) | 1,075 (5.9%) |
| $45,000 to $49,999 | 1,199 (5.9%) | 1,079 (5.9%) |
| $50,000 to $54,999 | 1,059 (5.2%) | 701 (3.9%) |
| $55,000 to $64,999 | 1,892 (9.3%) | 1,338 (7.4%) |
| $65,000 to $74,999 | 1,501 (7.4%) | 872 (4.8%) |
| $75,000 to $99,999 | 2,049 (10.1%) | 950 (5.2%) |
| $100,000+ | 2,471 (12.2%) | 883 (4.9%) |
| Total | 20,271 (100.0%) | 18,179 (100.0%) |
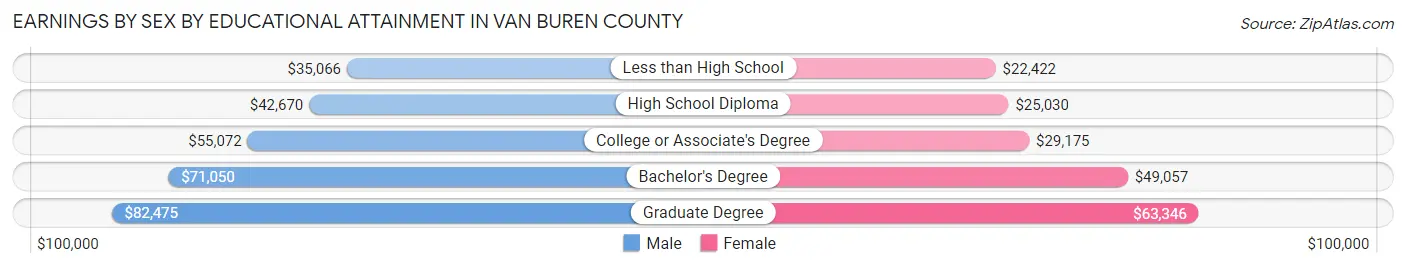
Earnings by Sex by Educational Attainment in Van Buren County
Average earnings in Van Buren County are $50,060 for men and $33,728 for women, a difference of 32.6%. Men with an educational attainment of graduate degree enjoy the highest average annual earnings of $82,475, while those with less than high school education earn the least with $35,066. Women with an educational attainment of graduate degree earn the most with the average annual earnings of $63,346, while those with less than high school education have the smallest earnings of $22,422.
| Educational Attainment | Male Income | Female Income |
| Less than High School | $35,066 | $22,422 |
| High School Diploma | $42,670 | $25,030 |
| College or Associate's Degree | $55,072 | $29,175 |
| Bachelor's Degree | $71,050 | $49,057 |
| Graduate Degree | $82,475 | $63,346 |
| Total | $50,060 | $33,728 |
Family Income in Van Buren County
Family Income Brackets in Van Buren County
According to the Van Buren County family income data, there are 4,492 families falling into the $100,000 to $149,999 income range, which is the most common income bracket and makes up 21.4% of all families. Conversely, the $10,000 to $14,999 income bracket is the least frequent group with only 378 families (1.8%) belonging to this category.
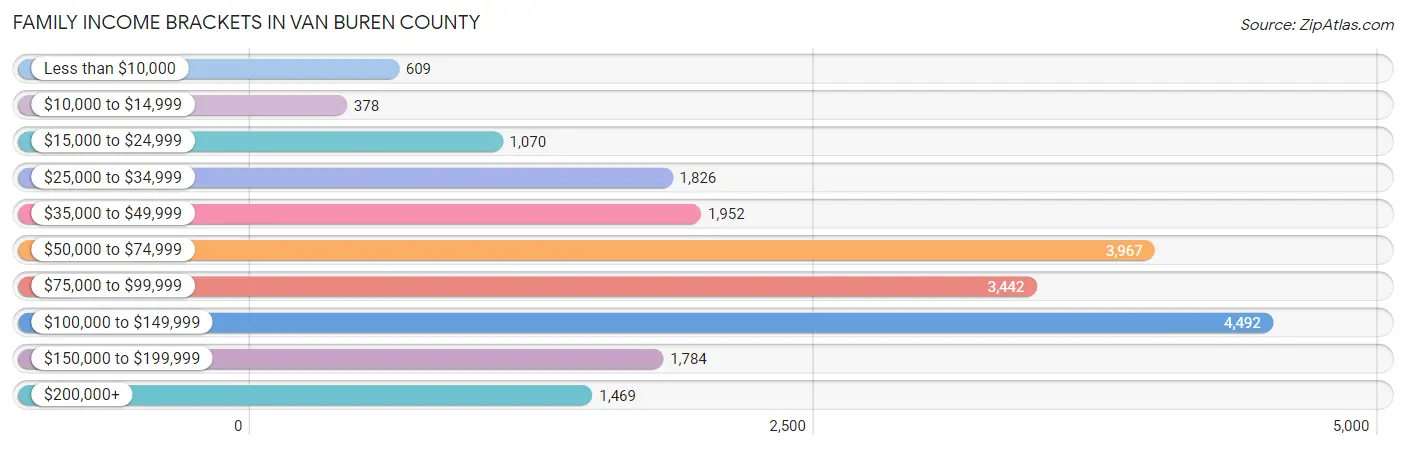
| Income Bracket | # Families | % Families |
| Less than $10,000 | 609 | 2.9% |
| $10,000 to $14,999 | 378 | 1.8% |
| $15,000 to $24,999 | 1,070 | 5.1% |
| $25,000 to $34,999 | 1,826 | 8.7% |
| $35,000 to $49,999 | 1,952 | 9.3% |
| $50,000 to $74,999 | 3,967 | 18.9% |
| $75,000 to $99,999 | 3,442 | 16.4% |
| $100,000 to $149,999 | 4,492 | 21.4% |
| $150,000 to $199,999 | 1,784 | 8.5% |
| $200,000+ | 1,469 | 7.0% |
Family Income by Famaliy Size in Van Buren County
7+ person families (282 | 1.3%) account for the highest median family income in Van Buren County with $127,708 per family, while 2-person families (10,719 | 51.1%) have the highest median income of $36,464 per family member.
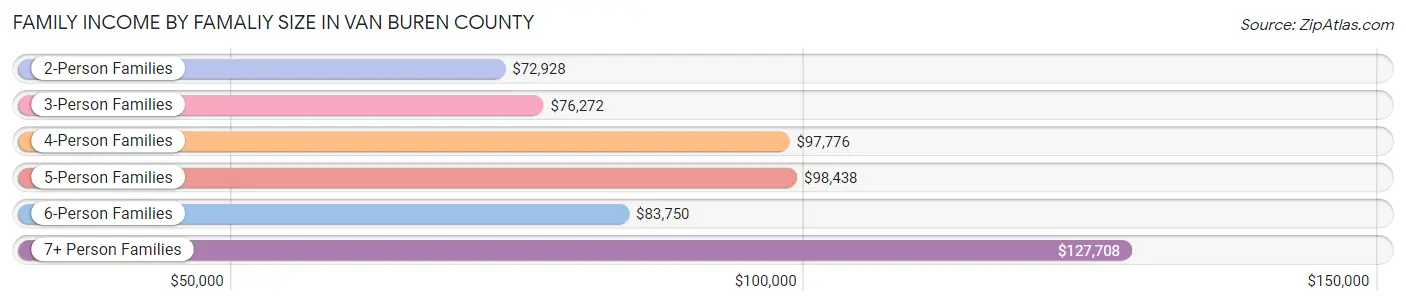
| Income Bracket | # Families | Median Income |
| 2-Person Families | 10,719 (51.1%) | $72,928 |
| 3-Person Families | 4,305 (20.5%) | $76,272 |
| 4-Person Families | 3,437 (16.4%) | $97,776 |
| 5-Person Families | 1,726 (8.2%) | $98,438 |
| 6-Person Families | 520 (2.5%) | $83,750 |
| 7+ Person Families | 282 (1.3%) | $127,708 |
| Total | 20,989 (100.0%) | $80,321 |
Family Income by Number of Earners in Van Buren County
The median family income in Van Buren County is $80,321, with families comprising 3+ earners (2,157) having the highest median family income of $128,108, while families with no earners (3,793) have the lowest median family income of $44,617, accounting for 10.3% and 18.1% of families, respectively.
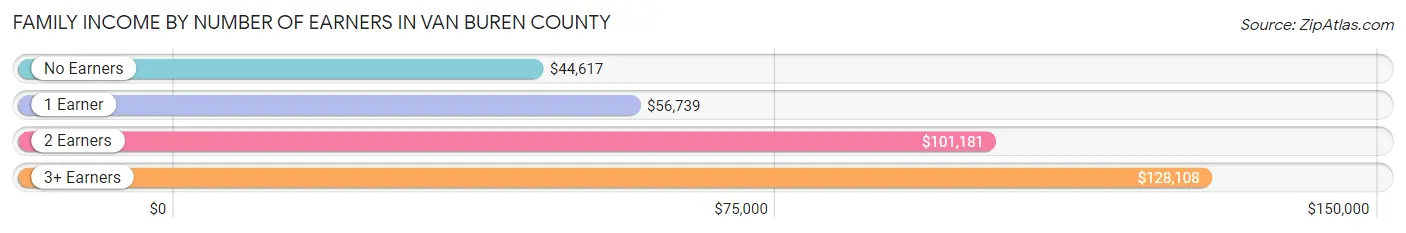
| Number of Earners | # Families | Median Income |
| No Earners | 3,793 (18.1%) | $44,617 |
| 1 Earner | 6,633 (31.6%) | $56,739 |
| 2 Earners | 8,406 (40.1%) | $101,181 |
| 3+ Earners | 2,157 (10.3%) | $128,108 |
| Total | 20,989 (100.0%) | $80,321 |
Household Income in Van Buren County
Household Income Brackets in Van Buren County
With 5,300 households falling in the category, the $50,000 to $74,999 income range is the most frequent in Van Buren County, accounting for 17.9% of all households. In contrast, only 1,273 households (4.3%) fall into the $10,000 to $14,999 income bracket, making it the least populous group.
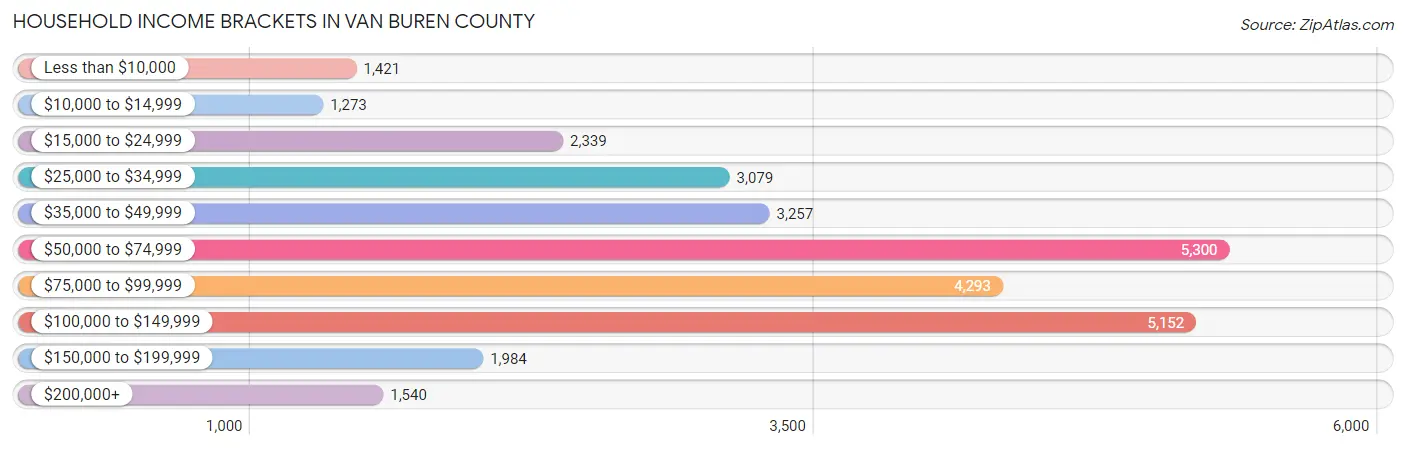
| Income Bracket | # Households | % Households |
| Less than $10,000 | 1,421 | 4.8% |
| $10,000 to $14,999 | 1,273 | 4.3% |
| $15,000 to $24,999 | 2,339 | 7.9% |
| $25,000 to $34,999 | 3,079 | 10.4% |
| $35,000 to $49,999 | 3,257 | 11.0% |
| $50,000 to $74,999 | 5,300 | 17.9% |
| $75,000 to $99,999 | 4,293 | 14.5% |
| $100,000 to $149,999 | 5,152 | 17.4% |
| $150,000 to $199,999 | 1,984 | 6.7% |
| $200,000+ | 1,540 | 5.2% |
Household Income by Householder Age in Van Buren County
The median household income in Van Buren County is $65,531, with the highest median household income of $82,656 found in the 45 to 64 years age bracket for the primary householder. A total of 11,585 households (39.1%) fall into this category. Meanwhile, the 15 to 24 years age bracket for the primary householder has the lowest median household income of $35,417, with 941 households (3.2%) in this group.
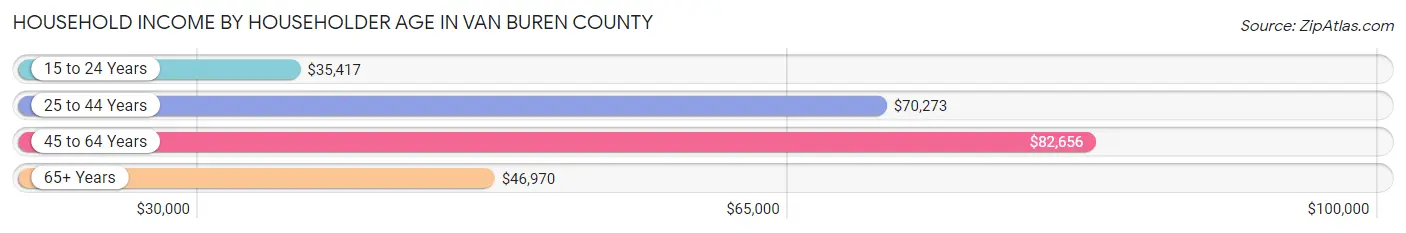
| Income Bracket | # Households | Median Income |
| 15 to 24 Years | 941 (3.2%) | $35,417 |
| 25 to 44 Years | 8,007 (27.0%) | $70,273 |
| 45 to 64 Years | 11,585 (39.1%) | $82,656 |
| 65+ Years | 9,076 (30.6%) | $46,970 |
| Total | 29,609 (100.0%) | $65,531 |
Poverty in Van Buren County
Income Below Poverty by Sex and Age in Van Buren County
With 12.8% poverty level for males and 15.5% for females among the residents of Van Buren County, under 5 year old males and 18 to 24 year old females are the most vulnerable to poverty, with 686 males (30.6%) and 635 females (22.6%) in their respective age groups living below the poverty level.
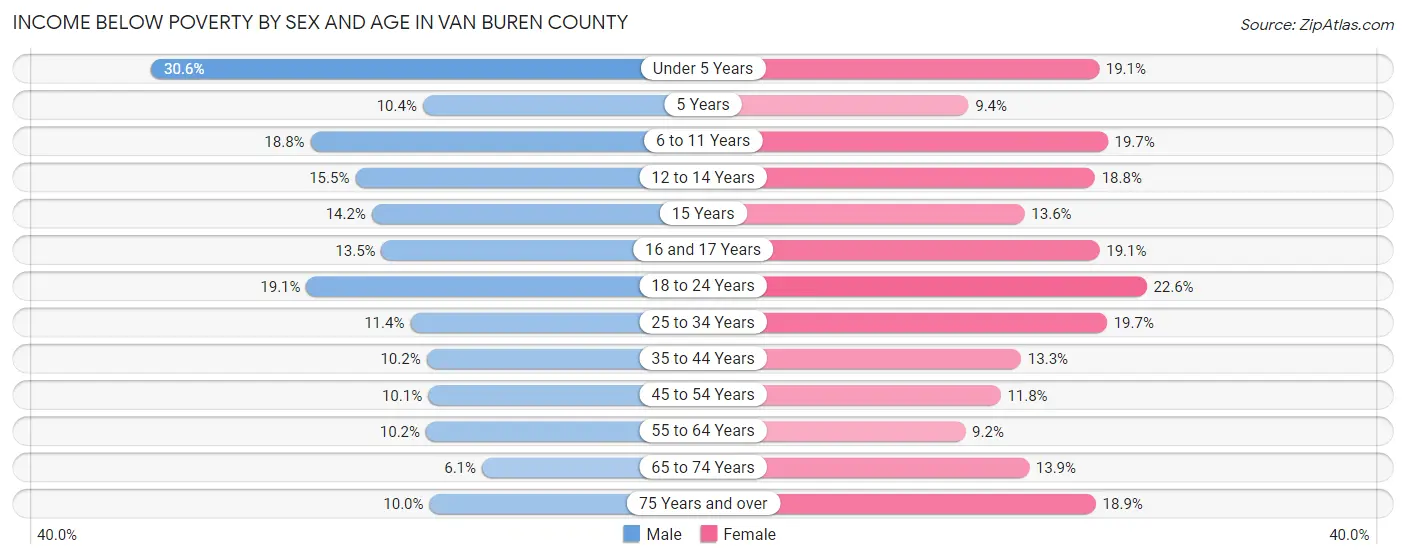
| Age Bracket | Male | Female |
| Under 5 Years | 686 (30.6%) | 389 (19.1%) |
| 5 Years | 54 (10.4%) | 49 (9.4%) |
| 6 to 11 Years | 572 (18.8%) | 567 (19.7%) |
| 12 to 14 Years | 216 (15.4%) | 267 (18.8%) |
| 15 Years | 80 (14.2%) | 67 (13.6%) |
| 16 and 17 Years | 140 (13.5%) | 192 (19.1%) |
| 18 to 24 Years | 590 (19.1%) | 635 (22.6%) |
| 25 to 34 Years | 499 (11.4%) | 805 (19.7%) |
| 35 to 44 Years | 448 (10.2%) | 600 (13.3%) |
| 45 to 54 Years | 456 (10.1%) | 545 (11.8%) |
| 55 to 64 Years | 568 (10.2%) | 522 (9.2%) |
| 65 to 74 Years | 265 (6.0%) | 622 (13.9%) |
| 75 Years and over | 227 (10.0%) | 530 (18.9%) |
| Total | 4,801 (12.8%) | 5,790 (15.5%) |
Income Above Poverty by Sex and Age in Van Buren County
According to the poverty statistics in Van Buren County, males aged 65 to 74 years and females aged 55 to 64 years are the age groups that are most secure financially, with 94.0% of males and 90.8% of females in these age groups living above the poverty line.
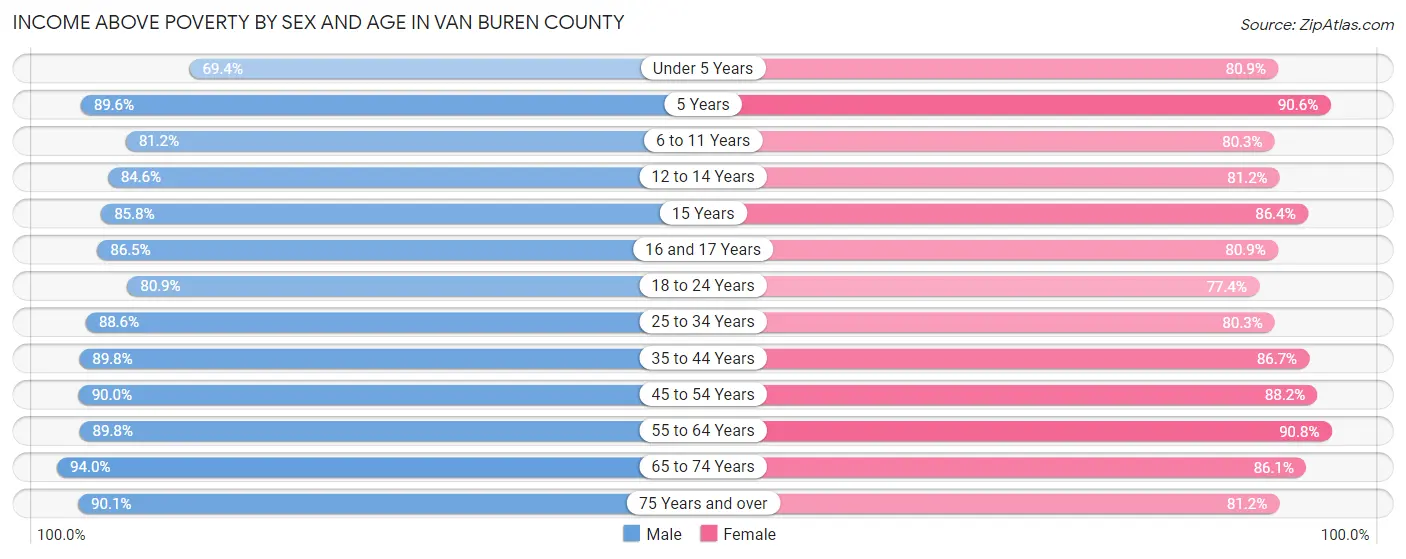
| Age Bracket | Male | Female |
| Under 5 Years | 1,555 (69.4%) | 1,650 (80.9%) |
| 5 Years | 463 (89.6%) | 473 (90.6%) |
| 6 to 11 Years | 2,473 (81.2%) | 2,307 (80.3%) |
| 12 to 14 Years | 1,182 (84.6%) | 1,155 (81.2%) |
| 15 Years | 482 (85.8%) | 427 (86.4%) |
| 16 and 17 Years | 896 (86.5%) | 812 (80.9%) |
| 18 to 24 Years | 2,503 (80.9%) | 2,172 (77.4%) |
| 25 to 34 Years | 3,890 (88.6%) | 3,287 (80.3%) |
| 35 to 44 Years | 3,960 (89.8%) | 3,911 (86.7%) |
| 45 to 54 Years | 4,081 (89.9%) | 4,080 (88.2%) |
| 55 to 64 Years | 4,993 (89.8%) | 5,176 (90.8%) |
| 65 to 74 Years | 4,116 (94.0%) | 3,856 (86.1%) |
| 75 Years and over | 2,055 (90.0%) | 2,282 (81.1%) |
| Total | 32,649 (87.2%) | 31,588 (84.5%) |
Income Below Poverty Among Married-Couple Families in Van Buren County
The poverty statistics for married-couple families in Van Buren County show that 5.1% or 790 of the total 15,649 families live below the poverty line. Families with 3 or 4 children have the highest poverty rate of 14.3%, comprising of 206 families. On the other hand, families with no children have the lowest poverty rate of 3.7%, which includes 362 families.
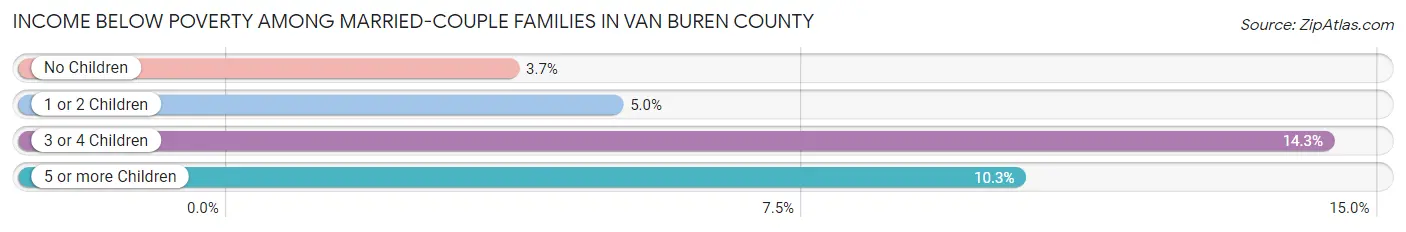
| Children | Above Poverty | Below Poverty |
| No Children | 9,502 (96.3%) | 362 (3.7%) |
| 1 or 2 Children | 4,063 (95.0%) | 215 (5.0%) |
| 3 or 4 Children | 1,233 (85.7%) | 206 (14.3%) |
| 5 or more Children | 61 (89.7%) | 7 (10.3%) |
| Total | 14,859 (95.0%) | 790 (5.1%) |
Income Below Poverty Among Single-Parent Households in Van Buren County
According to the poverty data in Van Buren County, 8.9% or 151 single-father households and 29.1% or 1,060 single-mother households are living below the poverty line. Among single-father households, those with 3 or 4 children have the highest poverty rate, with 32 households (43.2%) experiencing poverty. Likewise, among single-mother households, those with 3 or 4 children have the highest poverty rate, with 291 households (60.9%) falling below the poverty line.
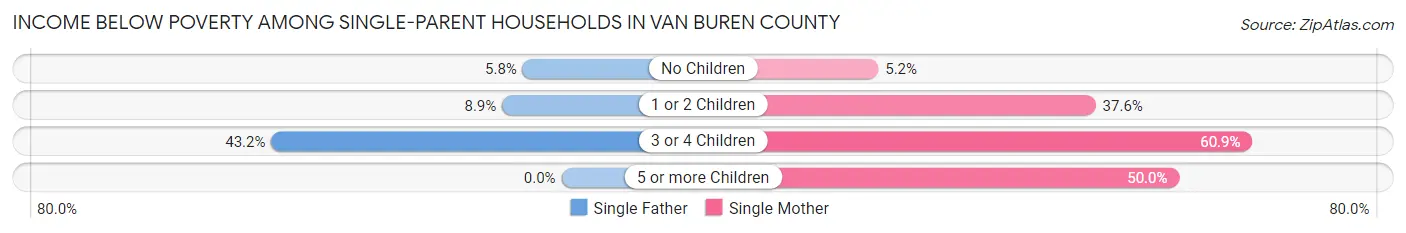
| Children | Single Father | Single Mother |
| No Children | 45 (5.8%) | 67 (5.2%) |
| 1 or 2 Children | 74 (8.8%) | 689 (37.6%) |
| 3 or 4 Children | 32 (43.2%) | 291 (60.9%) |
| 5 or more Children | 0 (0.0%) | 13 (50.0%) |
| Total | 151 (8.9%) | 1,060 (29.1%) |
Income Below Poverty Among Married-Couple vs Single-Parent Households in Van Buren County
The poverty data for Van Buren County shows that 790 of the married-couple family households (5.1%) and 1,211 of the single-parent households (22.7%) are living below the poverty level. Within the married-couple family households, those with 3 or 4 children have the highest poverty rate, with 206 households (14.3%) falling below the poverty line. Among the single-parent households, those with 3 or 4 children have the highest poverty rate, with 323 household (58.5%) living below poverty.
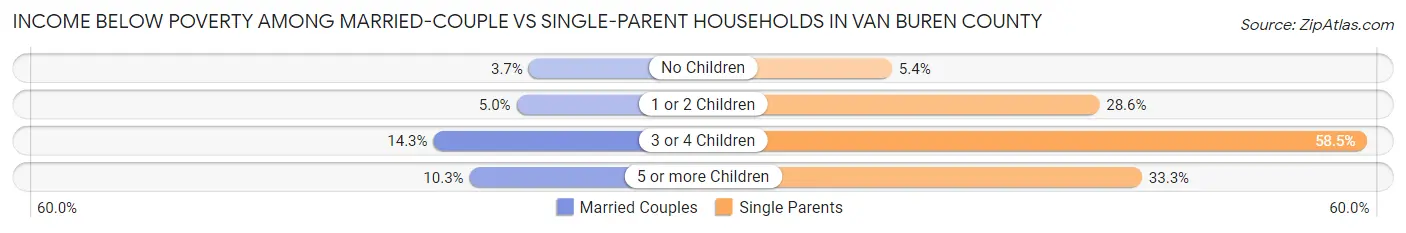
| Children | Married-Couple Families | Single-Parent Households |
| No Children | 362 (3.7%) | 112 (5.4%) |
| 1 or 2 Children | 215 (5.0%) | 763 (28.6%) |
| 3 or 4 Children | 206 (14.3%) | 323 (58.5%) |
| 5 or more Children | 7 (10.3%) | 13 (33.3%) |
| Total | 790 (5.1%) | 1,211 (22.7%) |
Race in Van Buren County
The most populous races in Van Buren County are White / Caucasian (63,162 | 83.5%), Hispanic or Latino (8,974 | 11.9%), and Two or more Races (5,888 | 7.8%).
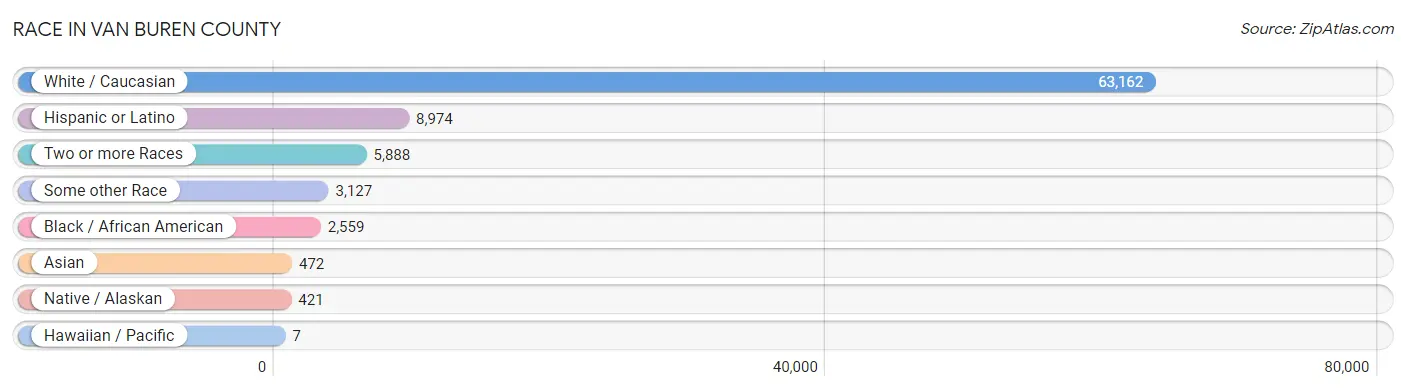
| Race | # Population | % Population |
| Asian | 472 | 0.6% |
| Black / African American | 2,559 | 3.4% |
| Hawaiian / Pacific | 7 | 0.0% |
| Hispanic or Latino | 8,974 | 11.9% |
| Native / Alaskan | 421 | 0.6% |
| White / Caucasian | 63,162 | 83.5% |
| Two or more Races | 5,888 | 7.8% |
| Some other Race | 3,127 | 4.1% |
| Total | 75,636 | 100.0% |
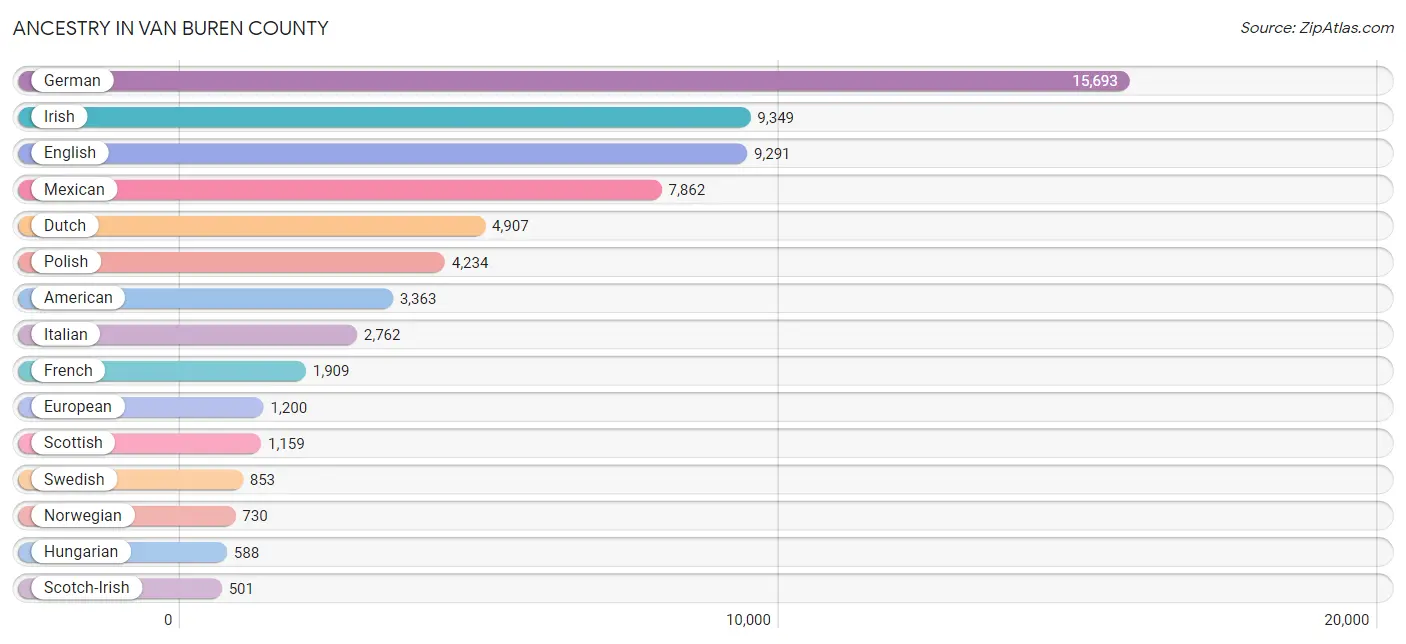
Ancestry in Van Buren County
The most populous ancestries reported in Van Buren County are German (15,693 | 20.7%), Irish (9,349 | 12.4%), English (9,291 | 12.3%), Mexican (7,862 | 10.4%), and Dutch (4,907 | 6.5%), together accounting for 62.3% of all Van Buren County residents.
| Ancestry | # Population | % Population |
| African | 139 | 0.2% |
| Albanian | 10 | 0.0% |
| American | 3,363 | 4.4% |
| Apache | 5 | 0.0% |
| Arab | 65 | 0.1% |
| Australian | 51 | 0.1% |
| Austrian | 203 | 0.3% |
| Belgian | 252 | 0.3% |
| Bhutanese | 60 | 0.1% |
| Blackfeet | 144 | 0.2% |
| Brazilian | 18 | 0.0% |
| British | 249 | 0.3% |
| Bulgarian | 31 | 0.0% |
| Burmese | 146 | 0.2% |
| Canadian | 48 | 0.1% |
| Celtic | 78 | 0.1% |
| Central American | 230 | 0.3% |
| Central American Indian | 5 | 0.0% |
| Cherokee | 366 | 0.5% |
| Chippewa | 105 | 0.1% |
| Choctaw | 36 | 0.1% |
| Colombian | 43 | 0.1% |
| Comanche | 5 | 0.0% |
| Creek | 3 | 0.0% |
| Croatian | 206 | 0.3% |
| Cuban | 122 | 0.2% |
| Czech | 332 | 0.4% |
| Czechoslovakian | 104 | 0.1% |
| Danish | 175 | 0.2% |
| Dutch | 4,907 | 6.5% |
| Eastern European | 78 | 0.1% |
| English | 9,291 | 12.3% |
| European | 1,200 | 1.6% |
| Finnish | 216 | 0.3% |
| French | 1,909 | 2.5% |
| French American Indian | 6 | 0.0% |
| French Canadian | 438 | 0.6% |
| German | 15,693 | 20.7% |
| German Russian | 11 | 0.0% |
| Greek | 154 | 0.2% |
| Guatemalan | 206 | 0.3% |
| Honduran | 12 | 0.0% |
| Hungarian | 588 | 0.8% |
| Icelander | 6 | 0.0% |
| Indian (Asian) | 37 | 0.1% |
| Irish | 9,349 | 12.4% |
| Iroquois | 11 | 0.0% |
| Italian | 2,762 | 3.6% |
| Jamaican | 191 | 0.3% |
| Japanese | 32 | 0.0% |
| Kenyan | 21 | 0.0% |
| Korean | 273 | 0.4% |
| Latvian | 7 | 0.0% |
| Lebanese | 22 | 0.0% |
| Lithuanian | 182 | 0.2% |
| Luxembourger | 4 | 0.0% |
| Malaysian | 4 | 0.0% |
| Mexican | 7,862 | 10.4% |
| Mexican American Indian | 60 | 0.1% |
| Moroccan | 7 | 0.0% |
| Navajo | 14 | 0.0% |
| Nigerian | 41 | 0.1% |
| Northern European | 48 | 0.1% |
| Norwegian | 730 | 1.0% |
| Ottawa | 25 | 0.0% |
| Pakistani | 4 | 0.0% |
| Palestinian | 16 | 0.0% |
| Panamanian | 7 | 0.0% |
| Paraguayan | 10 | 0.0% |
| Pennsylvania German | 236 | 0.3% |
| Peruvian | 7 | 0.0% |
| Polish | 4,234 | 5.6% |
| Portuguese | 29 | 0.0% |
| Potawatomi | 295 | 0.4% |
| Puerto Rican | 226 | 0.3% |
| Romanian | 13 | 0.0% |
| Russian | 250 | 0.3% |
| Salvadoran | 5 | 0.0% |
| Samoan | 7 | 0.0% |
| Scandinavian | 270 | 0.4% |
| Scotch-Irish | 501 | 0.7% |
| Scottish | 1,159 | 1.5% |
| Serbian | 19 | 0.0% |
| Sioux | 6 | 0.0% |
| Slavic | 42 | 0.1% |
| Slovak | 210 | 0.3% |
| Slovene | 13 | 0.0% |
| South American | 60 | 0.1% |
| South American Indian | 10 | 0.0% |
| Spaniard | 34 | 0.0% |
| Spanish | 45 | 0.1% |
| Sri Lankan | 5 | 0.0% |
| Subsaharan African | 201 | 0.3% |
| Swedish | 853 | 1.1% |
| Swiss | 132 | 0.2% |
| Syrian | 10 | 0.0% |
| Thai | 185 | 0.2% |
| Turkish | 14 | 0.0% |
| Ukrainian | 89 | 0.1% |
| Welsh | 328 | 0.4% |
| Yugoslavian | 22 | 0.0% | View All 101 Rows |
Immigrants in Van Buren County
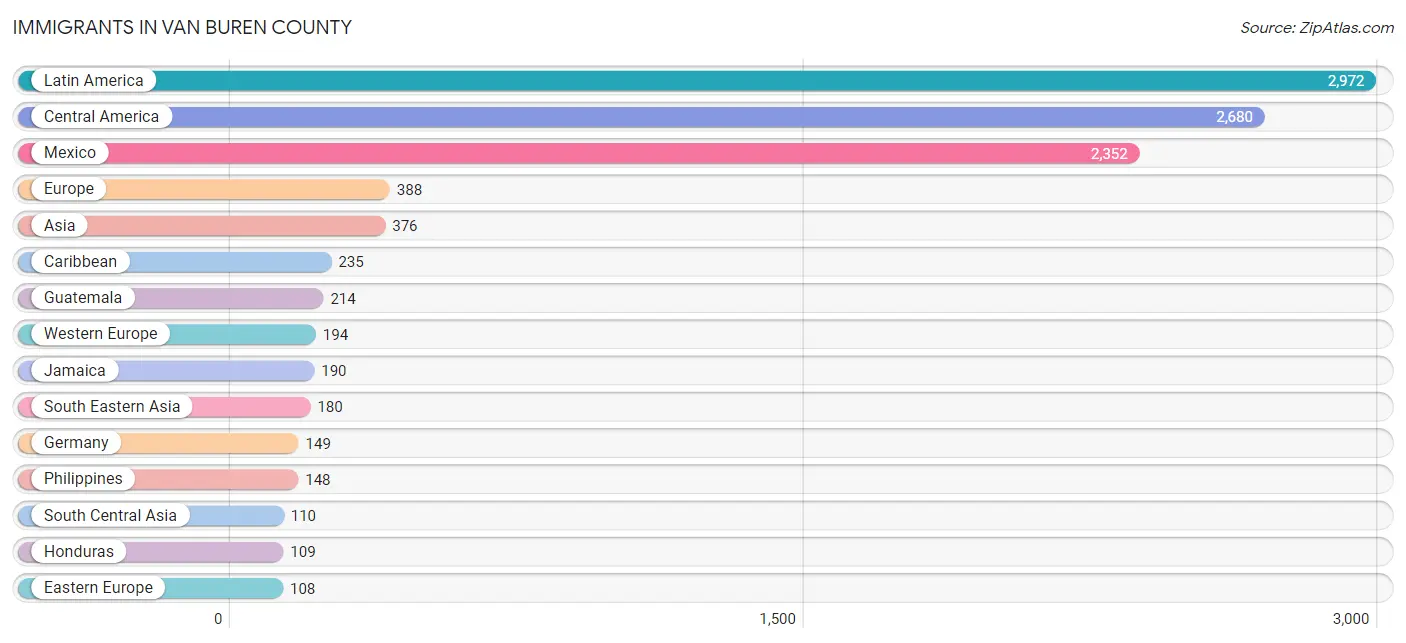
The most numerous immigrant groups reported in Van Buren County came from Latin America (2,972 | 3.9%), Central America (2,680 | 3.5%), Mexico (2,352 | 3.1%), Europe (388 | 0.5%), and Asia (376 | 0.5%), together accounting for 11.6% of all Van Buren County residents.
| Immigration Origin | # Population | % Population |
| Africa | 101 | 0.1% |
| Asia | 376 | 0.5% |
| Australia | 43 | 0.1% |
| Brazil | 15 | 0.0% |
| Cambodia | 32 | 0.0% |
| Canada | 92 | 0.1% |
| Caribbean | 235 | 0.3% |
| Central America | 2,680 | 3.5% |
| Chile | 10 | 0.0% |
| Colombia | 25 | 0.0% |
| Cuba | 45 | 0.1% |
| Czechoslovakia | 17 | 0.0% |
| Denmark | 15 | 0.0% |
| Eastern Africa | 24 | 0.0% |
| Eastern Asia | 42 | 0.1% |
| Eastern Europe | 108 | 0.1% |
| El Salvador | 5 | 0.0% |
| England | 22 | 0.0% |
| Europe | 388 | 0.5% |
| France | 7 | 0.0% |
| Germany | 149 | 0.2% |
| Guatemala | 214 | 0.3% |
| Honduras | 109 | 0.1% |
| Hungary | 8 | 0.0% |
| India | 77 | 0.1% |
| Iraq | 44 | 0.1% |
| Ireland | 7 | 0.0% |
| Italy | 10 | 0.0% |
| Jamaica | 190 | 0.3% |
| Japan | 6 | 0.0% |
| Kenya | 21 | 0.0% |
| Korea | 36 | 0.1% |
| Latin America | 2,972 | 3.9% |
| Lithuania | 2 | 0.0% |
| Mexico | 2,352 | 3.1% |
| Netherlands | 38 | 0.1% |
| Northern Europe | 76 | 0.1% |
| Norway | 11 | 0.0% |
| Oceania | 54 | 0.1% |
| Peru | 4 | 0.0% |
| Philippines | 148 | 0.2% |
| Poland | 57 | 0.1% |
| Romania | 4 | 0.0% |
| Sierra Leone | 68 | 0.1% |
| South America | 57 | 0.1% |
| South Central Asia | 110 | 0.2% |
| South Eastern Asia | 180 | 0.2% |
| Southern Europe | 10 | 0.0% |
| Sri Lanka | 33 | 0.0% |
| Western Africa | 68 | 0.1% |
| Western Asia | 44 | 0.1% |
| Western Europe | 194 | 0.3% | View All 52 Rows |
Sex and Age in Van Buren County
Sex and Age in Van Buren County
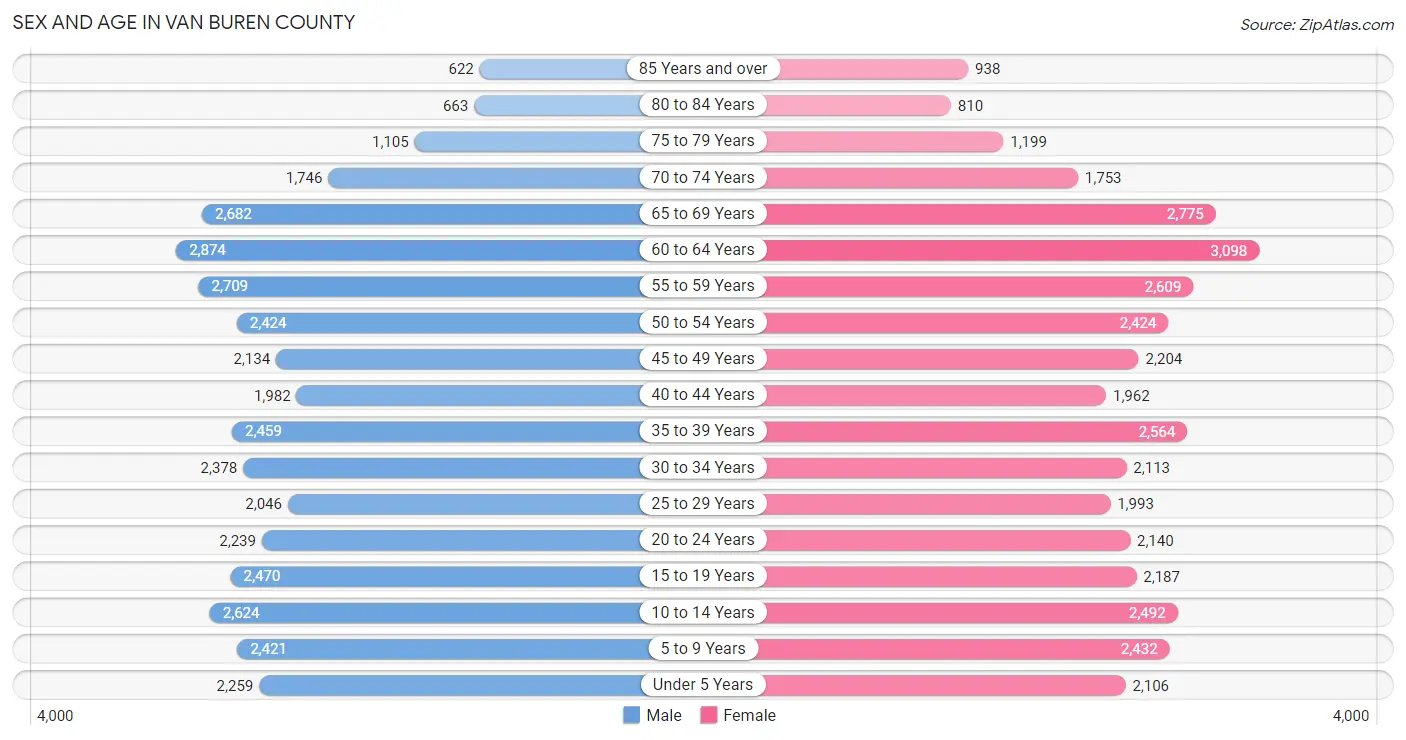
The most populous age groups in Van Buren County are 60 to 64 Years (2,874 | 7.6%) for men and 60 to 64 Years (3,098 | 8.2%) for women.
| Age Bracket | Male | Female |
| Under 5 Years | 2,259 (6.0%) | 2,106 (5.6%) |
| 5 to 9 Years | 2,421 (6.4%) | 2,432 (6.4%) |
| 10 to 14 Years | 2,624 (6.9%) | 2,492 (6.6%) |
| 15 to 19 Years | 2,470 (6.5%) | 2,187 (5.8%) |
| 20 to 24 Years | 2,239 (5.9%) | 2,140 (5.7%) |
| 25 to 29 Years | 2,046 (5.4%) | 1,993 (5.3%) |
| 30 to 34 Years | 2,378 (6.3%) | 2,113 (5.6%) |
| 35 to 39 Years | 2,459 (6.5%) | 2,564 (6.8%) |
| 40 to 44 Years | 1,982 (5.2%) | 1,962 (5.2%) |
| 45 to 49 Years | 2,134 (5.6%) | 2,204 (5.8%) |
| 50 to 54 Years | 2,424 (6.4%) | 2,424 (6.4%) |
| 55 to 59 Years | 2,709 (7.2%) | 2,609 (6.9%) |
| 60 to 64 Years | 2,874 (7.6%) | 3,098 (8.2%) |
| 65 to 69 Years | 2,682 (7.1%) | 2,775 (7.3%) |
| 70 to 74 Years | 1,746 (4.6%) | 1,753 (4.6%) |
| 75 to 79 Years | 1,105 (2.9%) | 1,199 (3.2%) |
| 80 to 84 Years | 663 (1.8%) | 810 (2.1%) |
| 85 Years and over | 622 (1.6%) | 938 (2.5%) |
| Total | 37,837 (100.0%) | 37,799 (100.0%) |
Families and Households in Van Buren County
Median Family Size in Van Buren County
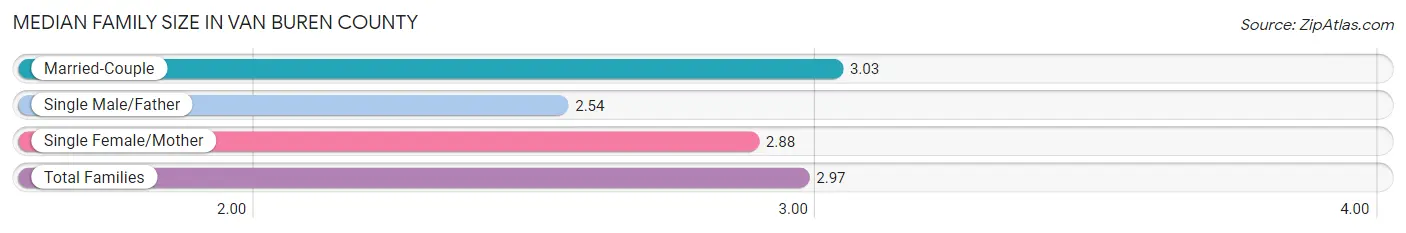
The median family size in Van Buren County is 2.97 persons per family, with married-couple families (15,649 | 74.6%) accounting for the largest median family size of 3.03 persons per family. On the other hand, single male/father families (1,702 | 8.1%) represent the smallest median family size with 2.54 persons per family.
| Family Type | # Families | Family Size |
| Married-Couple | 15,649 (74.6%) | 3.03 |
| Single Male/Father | 1,702 (8.1%) | 2.54 |
| Single Female/Mother | 3,638 (17.3%) | 2.88 |
| Total Families | 20,989 (100.0%) | 2.97 |
Median Household Size in Van Buren County
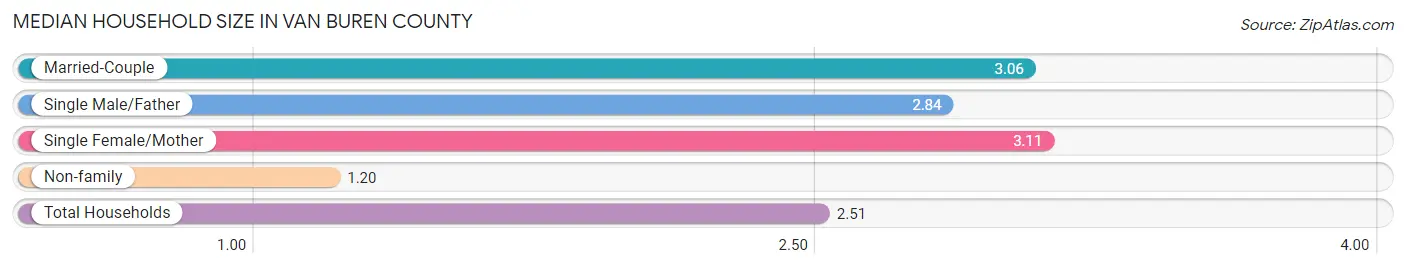
The median household size in Van Buren County is 2.51 persons per household, with single female/mother households (3,638 | 12.3%) accounting for the largest median household size of 3.11 persons per household. non-family households (8,620 | 29.1%) represent the smallest median household size with 1.20 persons per household.
| Household Type | # Households | Household Size |
| Married-Couple | 15,649 (52.8%) | 3.06 |
| Single Male/Father | 1,702 (5.8%) | 2.84 |
| Single Female/Mother | 3,638 (12.3%) | 3.11 |
| Non-family | 8,620 (29.1%) | 1.20 |
| Total Households | 29,609 (100.0%) | 2.51 |
Household Size by Marriage Status in Van Buren County
Out of a total of 29,609 households in Van Buren County, 20,989 (70.9%) are family households, while 8,620 (29.1%) are nonfamily households. The most numerous type of family households are 2-person households, comprising 10,257, and the most common type of nonfamily households are 1-person households, comprising 7,292.
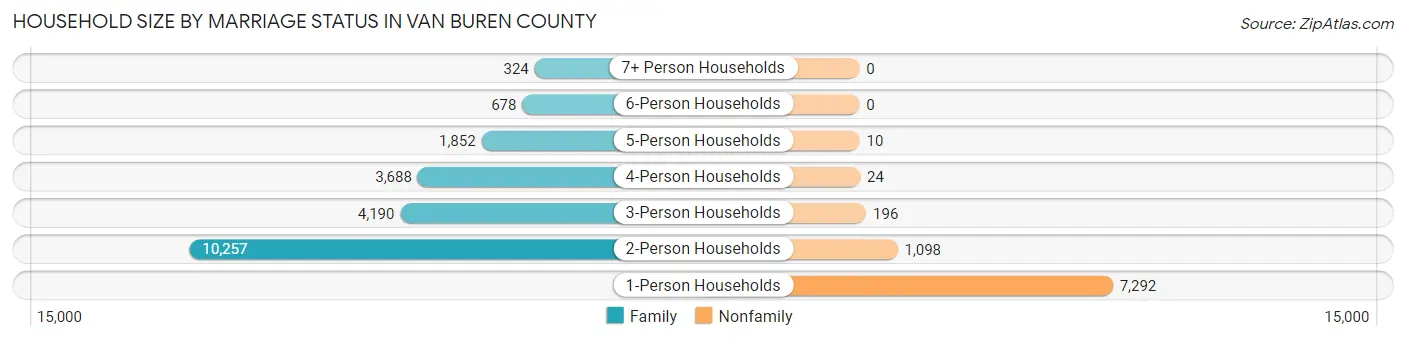
| Household Size | Family Households | Nonfamily Households |
| 1-Person Households | - | 7,292 (24.6%) |
| 2-Person Households | 10,257 (34.6%) | 1,098 (3.7%) |
| 3-Person Households | 4,190 (14.1%) | 196 (0.7%) |
| 4-Person Households | 3,688 (12.5%) | 24 (0.1%) |
| 5-Person Households | 1,852 (6.2%) | 10 (0.0%) |
| 6-Person Households | 678 (2.3%) | 0 (0.0%) |
| 7+ Person Households | 324 (1.1%) | 0 (0.0%) |
| Total | 20,989 (70.9%) | 8,620 (29.1%) |
Female Fertility in Van Buren County
Fertility by Age in Van Buren County
Average fertility rate in Van Buren County is 52.0 births per 1,000 women. Women in the age bracket of 20 to 34 years have the highest fertility rate with 93.0 births per 1,000 women. Women in the age bracket of 20 to 34 years acount for 72.1% of all women with births.
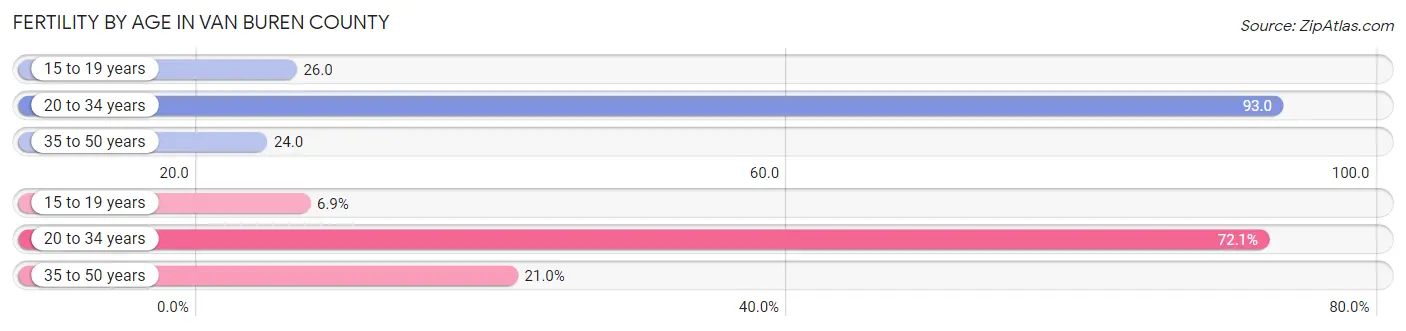
| Age Bracket | Women with Births | Births / 1,000 Women |
| 15 to 19 years | 56 (6.9%) | 26.0 |
| 20 to 34 years | 583 (72.1%) | 93.0 |
| 35 to 50 years | 170 (21.0%) | 24.0 |
| Total | 809 (100.0%) | 52.0 |
Fertility by Age by Marriage Status in Van Buren County
55.0% of women with births (809) in Van Buren County are married. The highest percentage of unmarried women with births falls into 20 to 34 years age bracket with 55.9% of them unmarried at the time of birth, while the lowest percentage of unmarried women with births belong to 35 to 50 years age bracket with 11.8% of them unmarried.
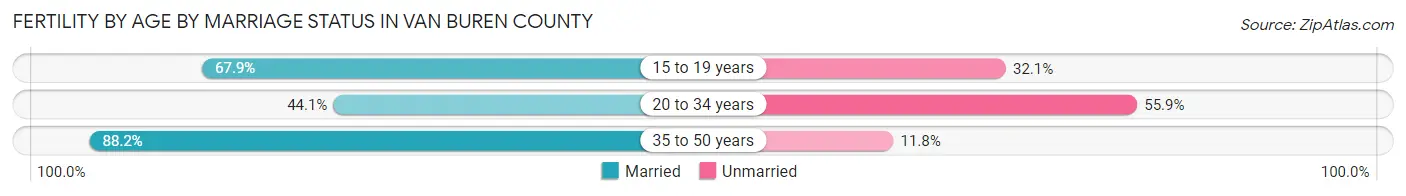
| Age Bracket | Married | Unmarried |
| 15 to 19 years | 38 (67.9%) | 18 (32.1%) |
| 20 to 34 years | 257 (44.1%) | 326 (55.9%) |
| 35 to 50 years | 150 (88.2%) | 20 (11.8%) |
| Total | 445 (55.0%) | 364 (45.0%) |
Fertility by Education in Van Buren County
Average fertility rate in Van Buren County is 52.0 births per 1,000 women. Women with the education attainment of graduate degree have the highest fertility rate of 87.0 births per 1,000 women, while women with the education attainment of college or associate's degree have the lowest fertility at 30.0 births per 1,000 women. Women with the education attainment of high school diploma represent 36.6% of all women with births.
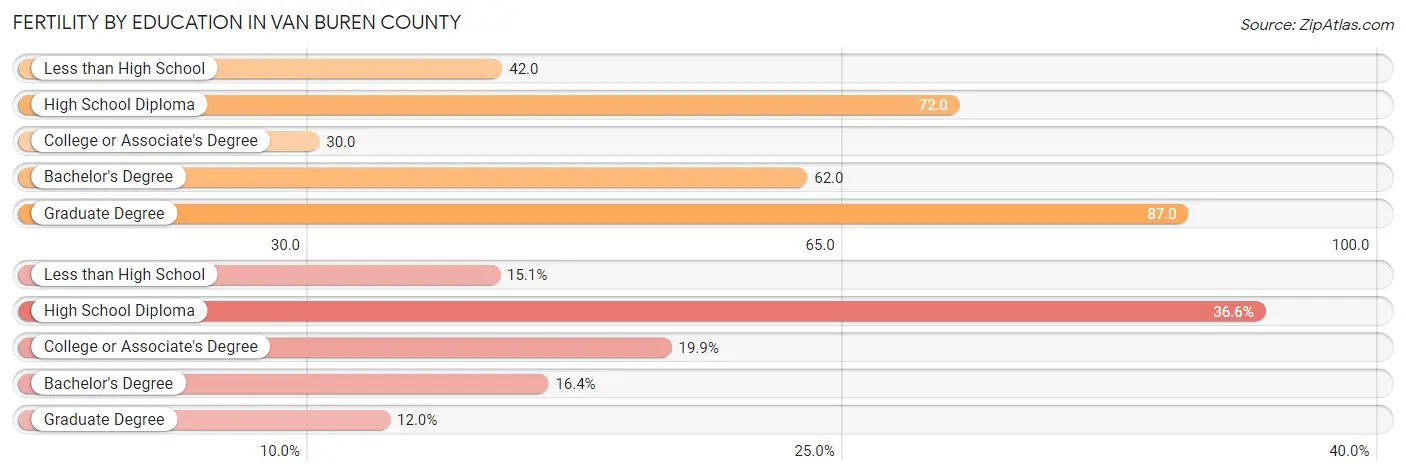
| Educational Attainment | Women with Births | Births / 1,000 Women |
| Less than High School | 122 (15.1%) | 42.0 |
| High School Diploma | 296 (36.6%) | 72.0 |
| College or Associate's Degree | 161 (19.9%) | 30.0 |
| Bachelor's Degree | 133 (16.4%) | 62.0 |
| Graduate Degree | 97 (12.0%) | 87.0 |
| Total | 809 (100.0%) | 52.0 |
Fertility by Education by Marriage Status in Van Buren County
45.0% of women with births in Van Buren County are unmarried. Women with the educational attainment of graduate degree are most likely to be married with 100.0% of them married at childbirth, while women with the educational attainment of college or associate's degree are least likely to be married with 53.4% of them unmarried at childbirth.
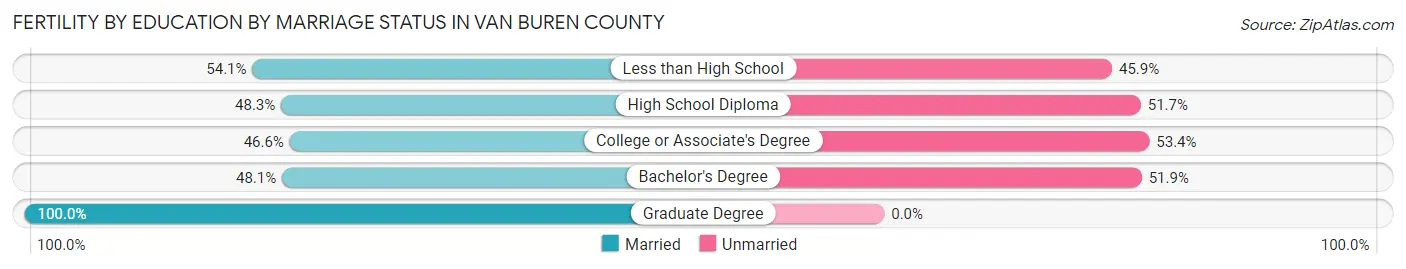
| Educational Attainment | Married | Unmarried |
| Less than High School | 66 (54.1%) | 56 (45.9%) |
| High School Diploma | 143 (48.3%) | 153 (51.7%) |
| College or Associate's Degree | 75 (46.6%) | 86 (53.4%) |
| Bachelor's Degree | 64 (48.1%) | 69 (51.9%) |
| Graduate Degree | 97 (100.0%) | 0 (0.0%) |
| Total | 445 (55.0%) | 364 (45.0%) |
Employment Characteristics in Van Buren County
Employment by Class of Employer in Van Buren County
Among the 33,874 employed individuals in Van Buren County, private company employees (23,743 | 70.1%), not-for-profit organizations (2,726 | 8.1%), and local government employees (2,361 | 7.0%) make up the most common classes of employment.
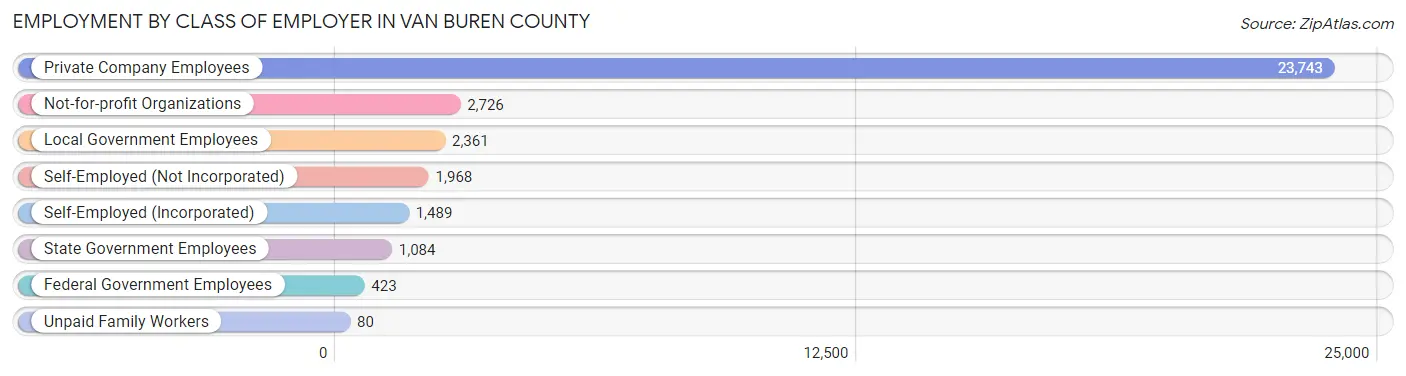
| Employer Class | # Employees | % Employees |
| Private Company Employees | 23,743 | 70.1% |
| Self-Employed (Incorporated) | 1,489 | 4.4% |
| Self-Employed (Not Incorporated) | 1,968 | 5.8% |
| Not-for-profit Organizations | 2,726 | 8.1% |
| Local Government Employees | 2,361 | 7.0% |
| State Government Employees | 1,084 | 3.2% |
| Federal Government Employees | 423 | 1.3% |
| Unpaid Family Workers | 80 | 0.2% |
| Total | 33,874 | 100.0% |
Employment Status by Age in Van Buren County
According to the labor force statistics for Van Buren County, out of the total population over 16 years of age (60,246), 60.0% or 36,148 individuals are in the labor force, with 4.7% or 1,699 of them unemployed. The age group with the highest labor force participation rate is 35 to 44 years, with 83.0% or 7,443 individuals in the labor force. Within the labor force, the 16 to 19 years age range has the highest percentage of unemployed individuals, with 13.6% or 237 of them being unemployed.
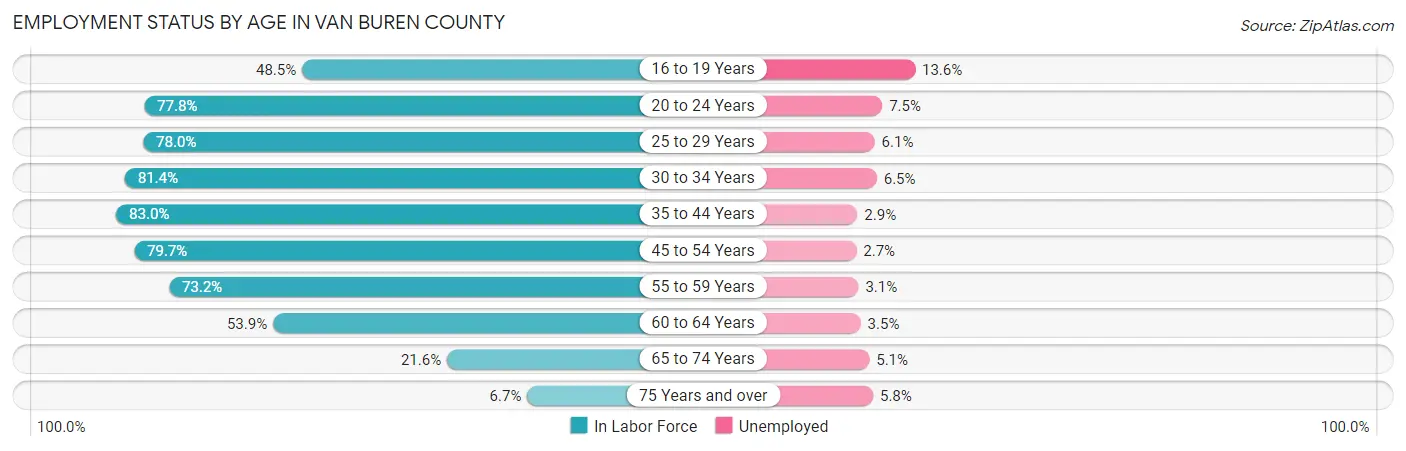
| Age Bracket | In Labor Force | Unemployed |
| 16 to 19 Years | 1,746 (48.5%) | 237 (13.6%) |
| 20 to 24 Years | 3,407 (77.8%) | 256 (7.5%) |
| 25 to 29 Years | 3,150 (78.0%) | 192 (6.1%) |
| 30 to 34 Years | 3,656 (81.4%) | 238 (6.5%) |
| 35 to 44 Years | 7,443 (83.0%) | 216 (2.9%) |
| 45 to 54 Years | 7,321 (79.7%) | 198 (2.7%) |
| 55 to 59 Years | 3,893 (73.2%) | 121 (3.1%) |
| 60 to 64 Years | 3,219 (53.9%) | 113 (3.5%) |
| 65 to 74 Years | 1,934 (21.6%) | 99 (5.1%) |
| 75 Years and over | 358 (6.7%) | 21 (5.8%) |
| Total | 36,148 (60.0%) | 1,699 (4.7%) |
Employment Status by Educational Attainment in Van Buren County
According to labor force statistics for Van Buren County, 75.5% of individuals (28,670) out of the total population between 25 and 64 years of age (37,973) are in the labor force, with 3.8% or 1,089 of them being unemployed. The group with the highest labor force participation rate are those with the educational attainment of bachelor's degree or higher, with 85.6% or 6,994 individuals in the labor force. Within the labor force, individuals with less than high school education have the highest percentage of unemployment, with 10.2% or 258 of them being unemployed.
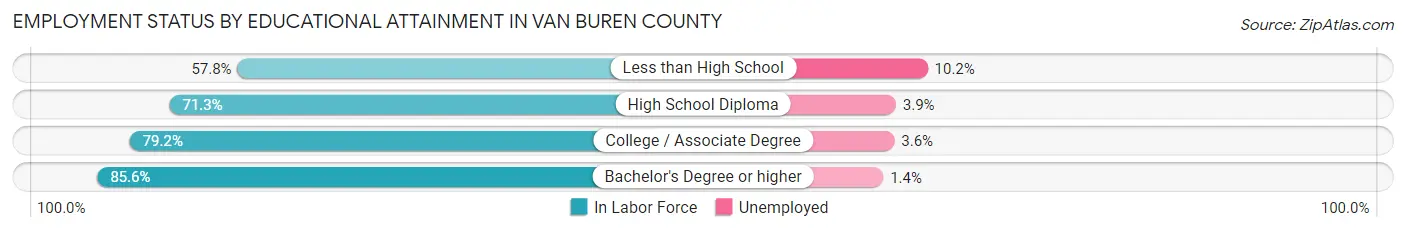
| Educational Attainment | In Labor Force | Unemployed |
| Less than High School | 2,526 (57.8%) | 446 (10.2%) |
| High School Diploma | 8,761 (71.3%) | 479 (3.9%) |
| College / Associate Degree | 10,411 (79.2%) | 473 (3.6%) |
| Bachelor's Degree or higher | 6,994 (85.6%) | 114 (1.4%) |
| Total | 28,670 (75.5%) | 1,443 (3.8%) |
Employment Occupations by Sex in Van Buren County
Management, Business, Science and Arts Occupations
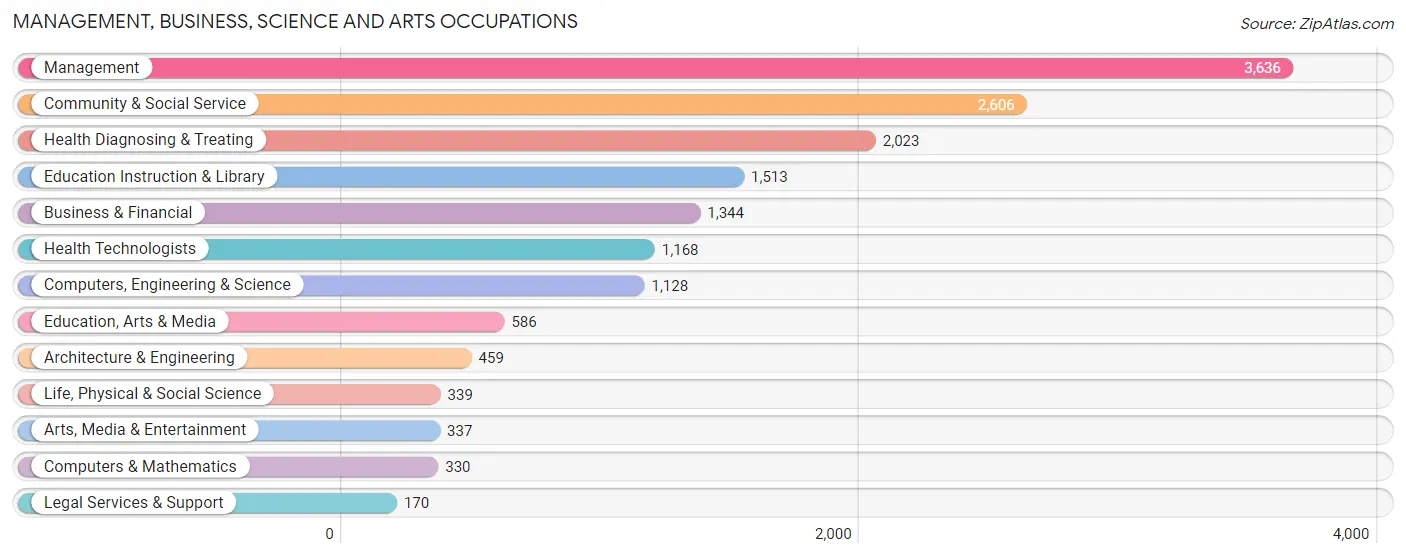
The most common Management, Business, Science and Arts occupations in Van Buren County are Management (3,636 | 10.6%), Community & Social Service (2,606 | 7.6%), Health Diagnosing & Treating (2,023 | 5.9%), Education Instruction & Library (1,513 | 4.4%), and Business & Financial (1,344 | 3.9%).
Management, Business, Science and Arts Occupations by Sex
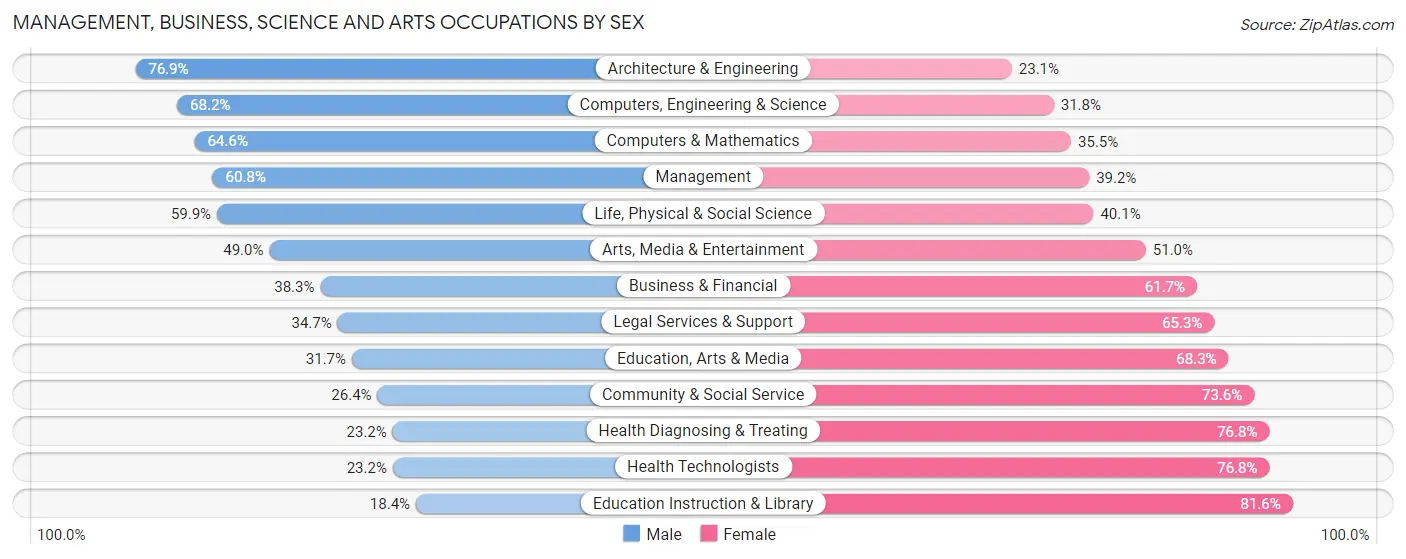
Within the Management, Business, Science and Arts occupations in Van Buren County, the most male-oriented occupations are Architecture & Engineering (76.9%), Computers, Engineering & Science (68.2%), and Computers & Mathematics (64.5%), while the most female-oriented occupations are Education Instruction & Library (81.6%), Health Technologists (76.8%), and Health Diagnosing & Treating (76.8%).
| Occupation | Male | Female |
| Management | 2,210 (60.8%) | 1,426 (39.2%) |
| Business & Financial | 515 (38.3%) | 829 (61.7%) |
| Computers, Engineering & Science | 769 (68.2%) | 359 (31.8%) |
| Computers & Mathematics | 213 (64.5%) | 117 (35.4%) |
| Architecture & Engineering | 353 (76.9%) | 106 (23.1%) |
| Life, Physical & Social Science | 203 (59.9%) | 136 (40.1%) |
| Community & Social Service | 688 (26.4%) | 1,918 (73.6%) |
| Education, Arts & Media | 186 (31.7%) | 400 (68.3%) |
| Legal Services & Support | 59 (34.7%) | 111 (65.3%) |
| Education Instruction & Library | 278 (18.4%) | 1,235 (81.6%) |
| Arts, Media & Entertainment | 165 (49.0%) | 172 (51.0%) |
| Health Diagnosing & Treating | 470 (23.2%) | 1,553 (76.8%) |
| Health Technologists | 271 (23.2%) | 897 (76.8%) |
| Total (Category) | 4,652 (43.3%) | 6,085 (56.7%) |
| Total (Overall) | 18,330 (53.3%) | 16,052 (46.7%) |
Services Occupations
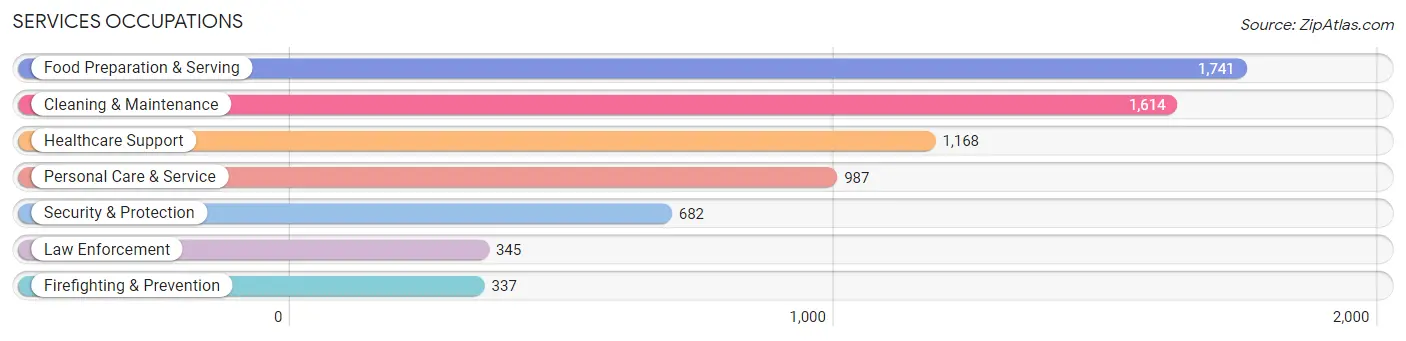
The most common Services occupations in Van Buren County are Food Preparation & Serving (1,741 | 5.1%), Cleaning & Maintenance (1,614 | 4.7%), Healthcare Support (1,168 | 3.4%), Personal Care & Service (987 | 2.9%), and Security & Protection (682 | 2.0%).
Services Occupations by Sex
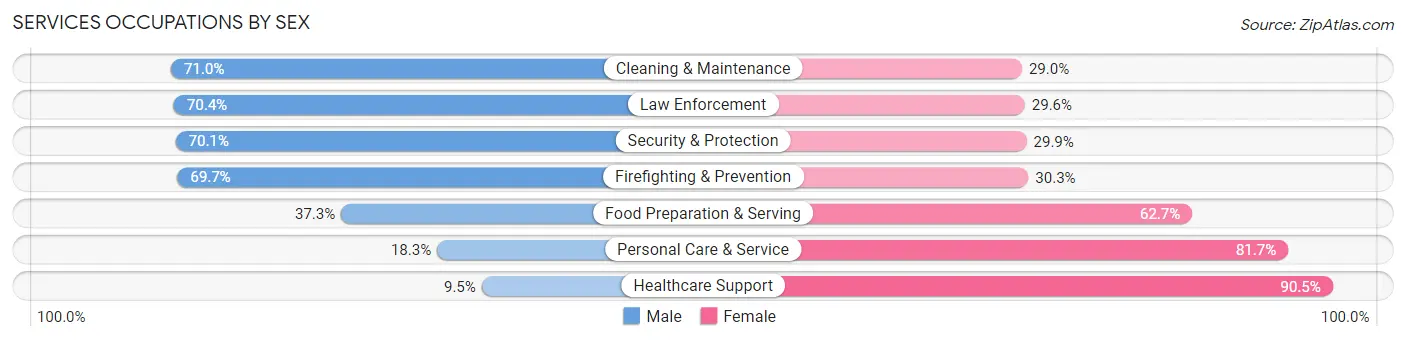
Within the Services occupations in Van Buren County, the most male-oriented occupations are Cleaning & Maintenance (71.0%), Law Enforcement (70.4%), and Security & Protection (70.1%), while the most female-oriented occupations are Healthcare Support (90.5%), Personal Care & Service (81.7%), and Food Preparation & Serving (62.7%).
| Occupation | Male | Female |
| Healthcare Support | 111 (9.5%) | 1,057 (90.5%) |
| Security & Protection | 478 (70.1%) | 204 (29.9%) |
| Firefighting & Prevention | 235 (69.7%) | 102 (30.3%) |
| Law Enforcement | 243 (70.4%) | 102 (29.6%) |
| Food Preparation & Serving | 650 (37.3%) | 1,091 (62.7%) |
| Cleaning & Maintenance | 1,146 (71.0%) | 468 (29.0%) |
| Personal Care & Service | 181 (18.3%) | 806 (81.7%) |
| Total (Category) | 2,566 (41.4%) | 3,626 (58.6%) |
| Total (Overall) | 18,330 (53.3%) | 16,052 (46.7%) |
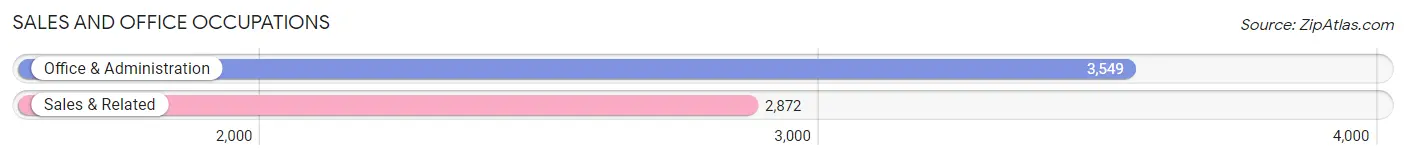
Sales and Office Occupations
The most common Sales and Office occupations in Van Buren County are Office & Administration (3,549 | 10.3%), and Sales & Related (2,872 | 8.4%).
Sales and Office Occupations by Sex
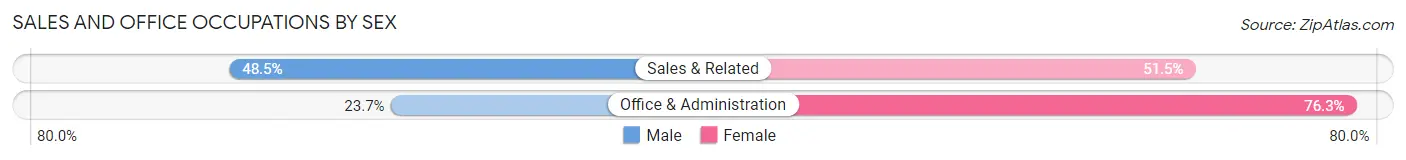
| Occupation | Male | Female |
| Sales & Related | 1,393 (48.5%) | 1,479 (51.5%) |
| Office & Administration | 842 (23.7%) | 2,707 (76.3%) |
| Total (Category) | 2,235 (34.8%) | 4,186 (65.2%) |
| Total (Overall) | 18,330 (53.3%) | 16,052 (46.7%) |
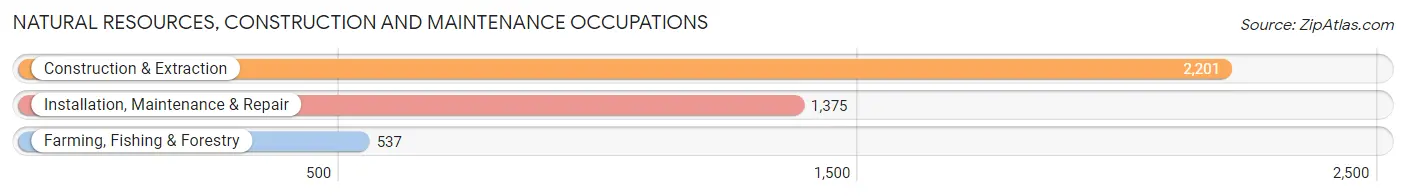
Natural Resources, Construction and Maintenance Occupations
The most common Natural Resources, Construction and Maintenance occupations in Van Buren County are Construction & Extraction (2,201 | 6.4%), Installation, Maintenance & Repair (1,375 | 4.0%), and Farming, Fishing & Forestry (537 | 1.6%).
Natural Resources, Construction and Maintenance Occupations by Sex
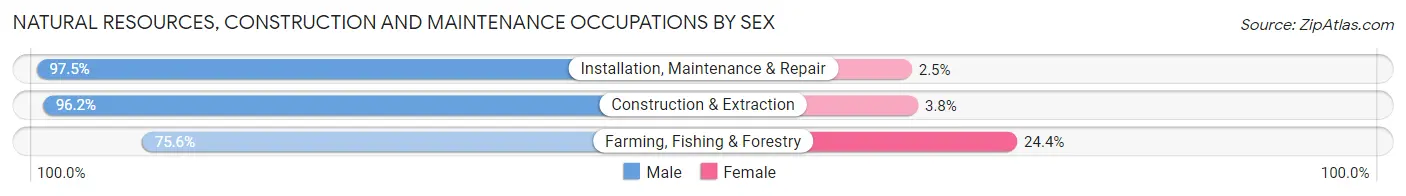
| Occupation | Male | Female |
| Farming, Fishing & Forestry | 406 (75.6%) | 131 (24.4%) |
| Construction & Extraction | 2,118 (96.2%) | 83 (3.8%) |
| Installation, Maintenance & Repair | 1,341 (97.5%) | 34 (2.5%) |
| Total (Category) | 3,865 (94.0%) | 248 (6.0%) |
| Total (Overall) | 18,330 (53.3%) | 16,052 (46.7%) |
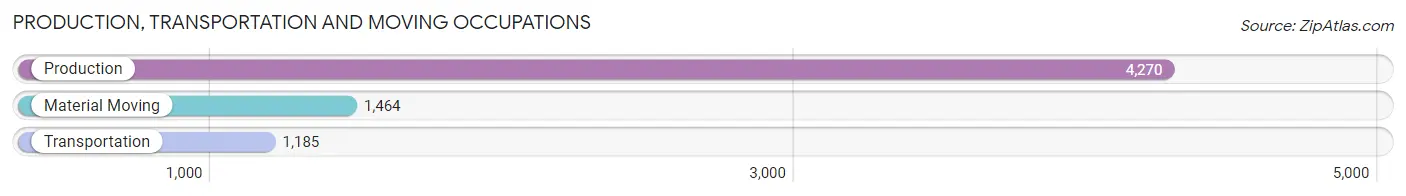
Production, Transportation and Moving Occupations
The most common Production, Transportation and Moving occupations in Van Buren County are Production (4,270 | 12.4%), Material Moving (1,464 | 4.3%), and Transportation (1,185 | 3.5%).
Production, Transportation and Moving Occupations by Sex
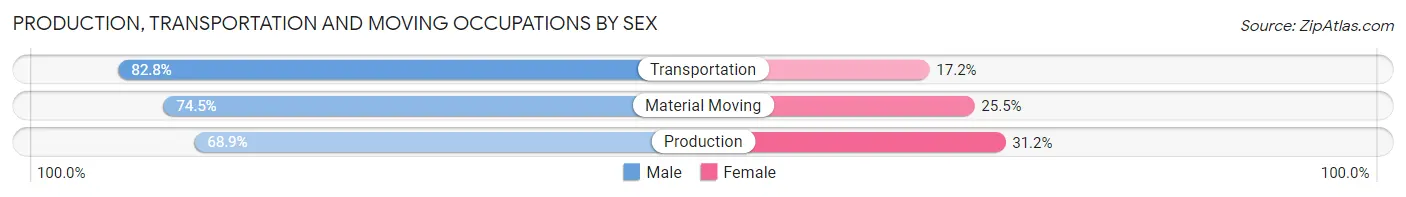
| Occupation | Male | Female |
| Production | 2,940 (68.9%) | 1,330 (31.1%) |
| Transportation | 981 (82.8%) | 204 (17.2%) |
| Material Moving | 1,091 (74.5%) | 373 (25.5%) |
| Total (Category) | 5,012 (72.4%) | 1,907 (27.6%) |
| Total (Overall) | 18,330 (53.3%) | 16,052 (46.7%) |
Employment Industries by Sex in Van Buren County
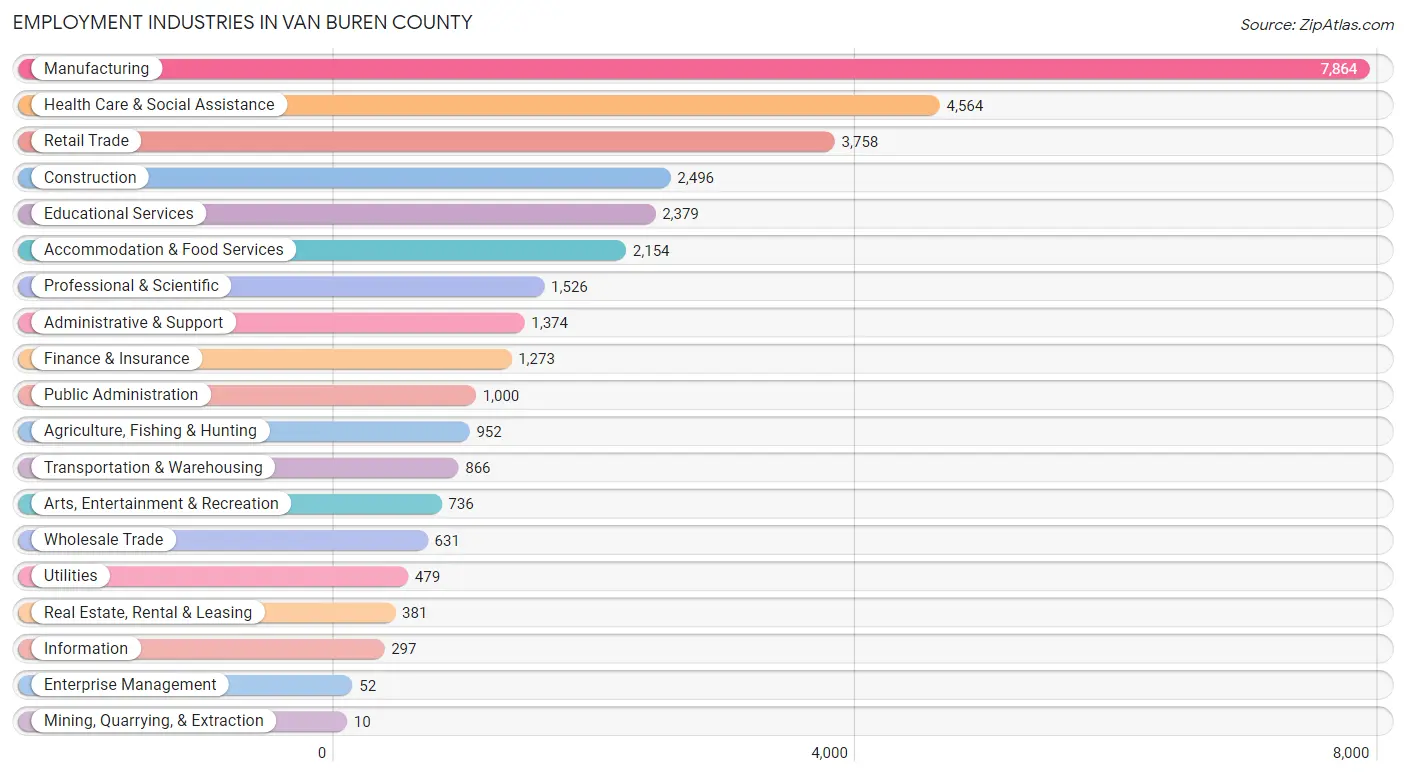
Employment Industries in Van Buren County
The major employment industries in Van Buren County include Manufacturing (7,864 | 22.9%), Health Care & Social Assistance (4,564 | 13.3%), Retail Trade (3,758 | 10.9%), Construction (2,496 | 7.3%), and Educational Services (2,379 | 6.9%).
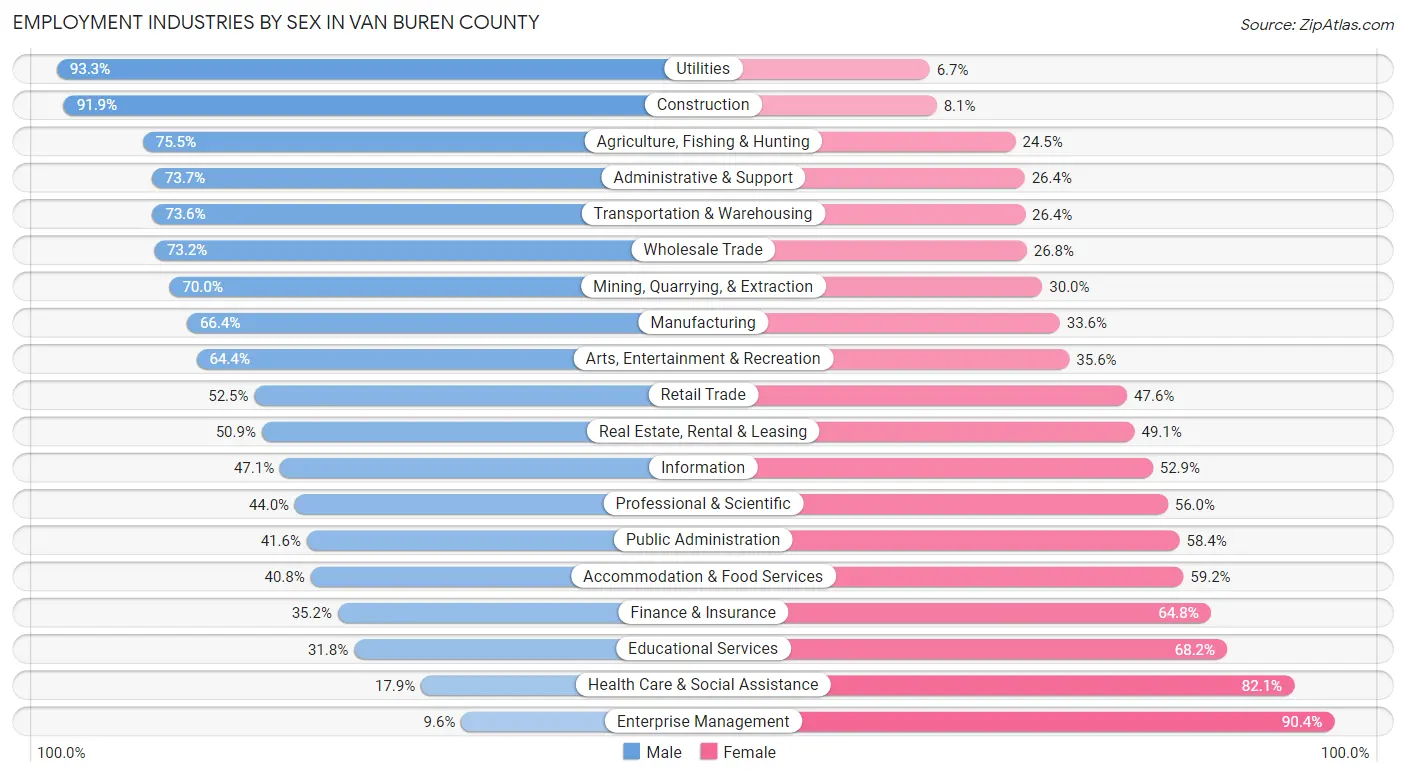
Employment Industries by Sex in Van Buren County
The Van Buren County industries that see more men than women are Utilities (93.3%), Construction (91.9%), and Agriculture, Fishing & Hunting (75.5%), whereas the industries that tend to have a higher number of women are Enterprise Management (90.4%), Health Care & Social Assistance (82.1%), and Educational Services (68.2%).
| Industry | Male | Female |
| Agriculture, Fishing & Hunting | 719 (75.5%) | 233 (24.5%) |
| Mining, Quarrying, & Extraction | 7 (70.0%) | 3 (30.0%) |
| Construction | 2,293 (91.9%) | 203 (8.1%) |
| Manufacturing | 5,220 (66.4%) | 2,644 (33.6%) |
| Wholesale Trade | 462 (73.2%) | 169 (26.8%) |
| Retail Trade | 1,971 (52.4%) | 1,787 (47.5%) |
| Transportation & Warehousing | 637 (73.6%) | 229 (26.4%) |
| Utilities | 447 (93.3%) | 32 (6.7%) |
| Information | 140 (47.1%) | 157 (52.9%) |
| Finance & Insurance | 448 (35.2%) | 825 (64.8%) |
| Real Estate, Rental & Leasing | 194 (50.9%) | 187 (49.1%) |
| Professional & Scientific | 672 (44.0%) | 854 (56.0%) |
| Enterprise Management | 5 (9.6%) | 47 (90.4%) |
| Administrative & Support | 1,012 (73.7%) | 362 (26.4%) |
| Educational Services | 757 (31.8%) | 1,622 (68.2%) |
| Health Care & Social Assistance | 819 (17.9%) | 3,745 (82.1%) |
| Arts, Entertainment & Recreation | 474 (64.4%) | 262 (35.6%) |
| Accommodation & Food Services | 879 (40.8%) | 1,275 (59.2%) |
| Public Administration | 416 (41.6%) | 584 (58.4%) |
| Total | 18,330 (53.3%) | 16,052 (46.7%) |
Education in Van Buren County
School Enrollment in Van Buren County
The most common levels of schooling among the 16,264 students in Van Buren County are middle school (4,115 | 25.3%), high school (3,959 | 24.3%), and elementary school (3,718 | 22.9%).
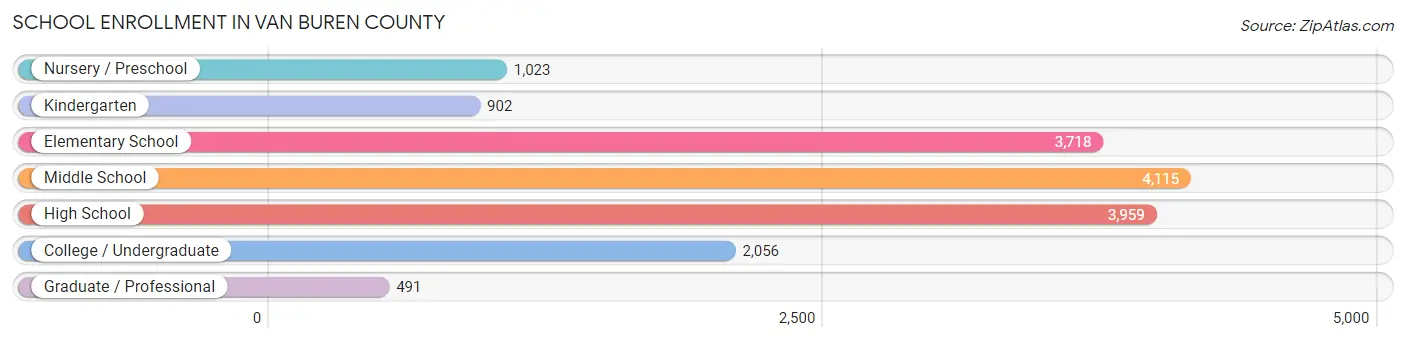
| School Level | # Students | % Students |
| Nursery / Preschool | 1,023 | 6.3% |
| Kindergarten | 902 | 5.6% |
| Elementary School | 3,718 | 22.9% |
| Middle School | 4,115 | 25.3% |
| High School | 3,959 | 24.3% |
| College / Undergraduate | 2,056 | 12.6% |
| Graduate / Professional | 491 | 3.0% |
| Total | 16,264 | 100.0% |
School Enrollment by Age by Funding Source in Van Buren County
Out of a total of 16,264 students who are enrolled in schools in Van Buren County, 1,529 (9.4%) attend a private institution, while the remaining 14,735 (90.6%) are enrolled in public schools. The age group of 3 to 4 year olds has the highest likelihood of being enrolled in private schools, with 133 (25.5% in the age bracket) enrolled. Conversely, the age group of 15 to 17 year olds has the lowest likelihood of being enrolled in a private school, with 2,871 (95.5% in the age bracket) attending a public institution.
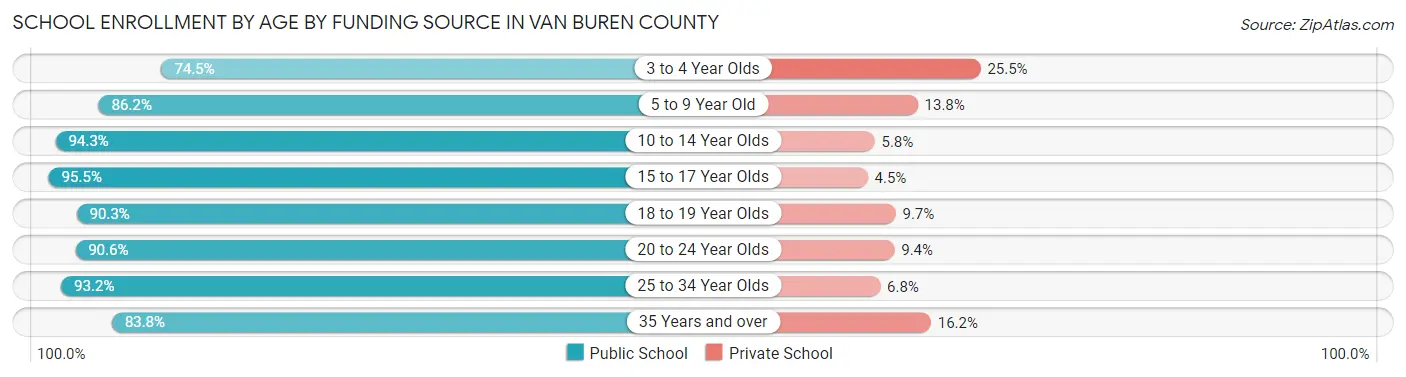
| Age Bracket | Public School | Private School |
| 3 to 4 Year Olds | 389 (74.5%) | 133 (25.5%) |
| 5 to 9 Year Old | 3,933 (86.2%) | 628 (13.8%) |
| 10 to 14 Year Olds | 4,637 (94.3%) | 283 (5.8%) |
| 15 to 17 Year Olds | 2,871 (95.5%) | 134 (4.5%) |
| 18 to 19 Year Olds | 917 (90.3%) | 98 (9.7%) |
| 20 to 24 Year Olds | 749 (90.6%) | 78 (9.4%) |
| 25 to 34 Year Olds | 577 (93.2%) | 42 (6.8%) |
| 35 Years and over | 666 (83.8%) | 129 (16.2%) |
| Total | 14,735 (90.6%) | 1,529 (9.4%) |
Educational Attainment by Field of Study in Van Buren County
Business (2,829 | 22.4%), education (2,147 | 17.0%), science & technology (1,228 | 9.7%), arts & humanities (1,129 | 8.9%), and bio, nature & agricultural (1,019 | 8.1%) are the most common fields of study among 12,638 individuals in Van Buren County who have obtained a bachelor's degree or higher.
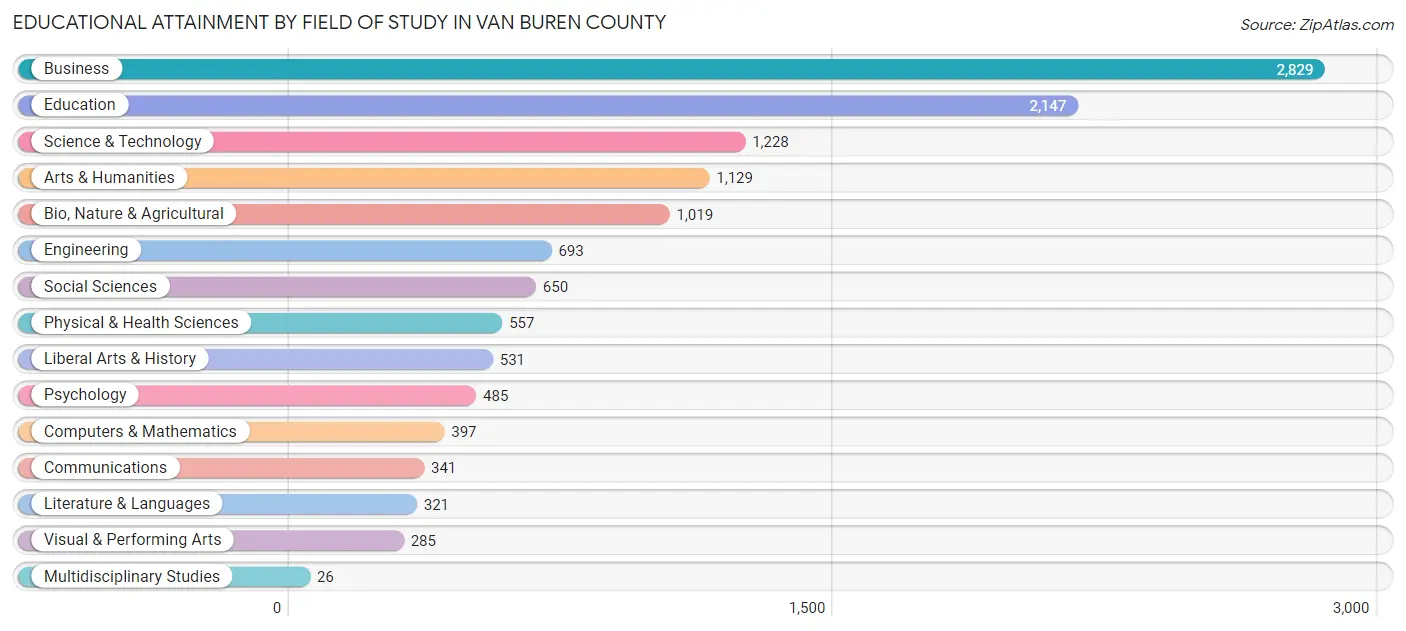
| Field of Study | # Graduates | % Graduates |
| Computers & Mathematics | 397 | 3.1% |
| Bio, Nature & Agricultural | 1,019 | 8.1% |
| Physical & Health Sciences | 557 | 4.4% |
| Psychology | 485 | 3.8% |
| Social Sciences | 650 | 5.1% |
| Engineering | 693 | 5.5% |
| Multidisciplinary Studies | 26 | 0.2% |
| Science & Technology | 1,228 | 9.7% |
| Business | 2,829 | 22.4% |
| Education | 2,147 | 17.0% |
| Literature & Languages | 321 | 2.5% |
| Liberal Arts & History | 531 | 4.2% |
| Visual & Performing Arts | 285 | 2.3% |
| Communications | 341 | 2.7% |
| Arts & Humanities | 1,129 | 8.9% |
| Total | 12,638 | 100.0% |
Transportation & Commute in Van Buren County
Vehicle Availability by Sex in Van Buren County
The most prevalent vehicle ownership categories in Van Buren County are males with 2 vehicles (7,746, accounting for 43.1%) and females with 2 vehicles (6,844, making up 49.6%).
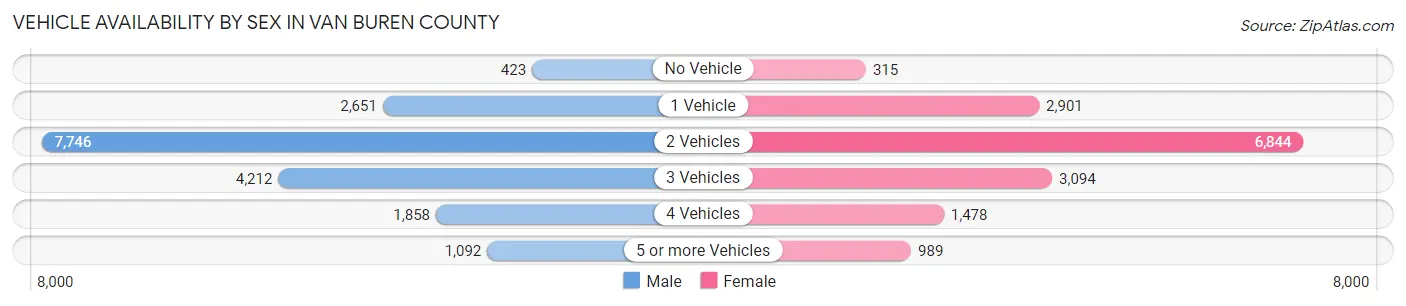
| Vehicles Available | Male | Female |
| No Vehicle | 423 (2.4%) | 315 (2.0%) |
| 1 Vehicle | 2,651 (14.7%) | 2,901 (18.6%) |
| 2 Vehicles | 7,746 (43.1%) | 6,844 (43.8%) |
| 3 Vehicles | 4,212 (23.4%) | 3,094 (19.8%) |
| 4 Vehicles | 1,858 (10.3%) | 1,478 (9.5%) |
| 5 or more Vehicles | 1,092 (6.1%) | 989 (6.3%) |
| Total | 17,982 (100.0%) | 15,621 (100.0%) |
Commute Time in Van Buren County
The most frequently occuring commute durations in Van Buren County are 30 to 34 minutes (4,433 commuters, 14.2%), 20 to 24 minutes (4,359 commuters, 14.0%), and 10 to 14 minutes (4,297 commuters, 13.8%).
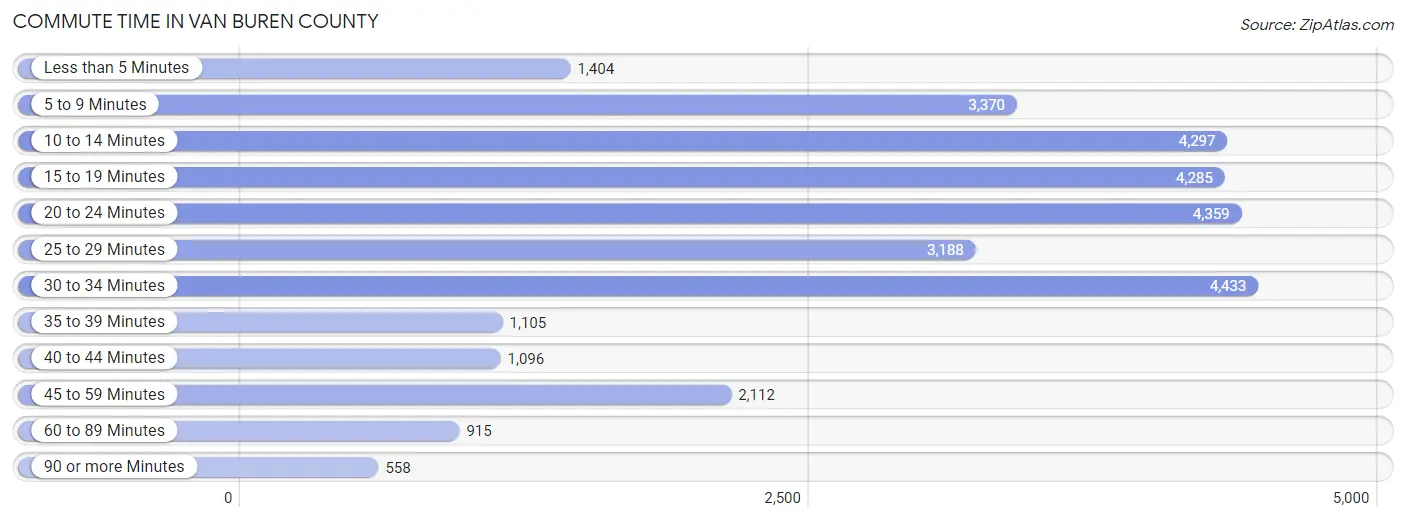
| Commute Time | # Commuters | % Commuters |
| Less than 5 Minutes | 1,404 | 4.5% |
| 5 to 9 Minutes | 3,370 | 10.8% |
| 10 to 14 Minutes | 4,297 | 13.8% |
| 15 to 19 Minutes | 4,285 | 13.8% |
| 20 to 24 Minutes | 4,359 | 14.0% |
| 25 to 29 Minutes | 3,188 | 10.2% |
| 30 to 34 Minutes | 4,433 | 14.2% |
| 35 to 39 Minutes | 1,105 | 3.5% |
| 40 to 44 Minutes | 1,096 | 3.5% |
| 45 to 59 Minutes | 2,112 | 6.8% |
| 60 to 89 Minutes | 915 | 2.9% |
| 90 or more Minutes | 558 | 1.8% |
Commute Time by Sex in Van Buren County
The most common commute times in Van Buren County are 15 to 19 minutes (2,597 commuters, 15.2%) for males and 20 to 24 minutes (2,254 commuters, 16.1%) for females.
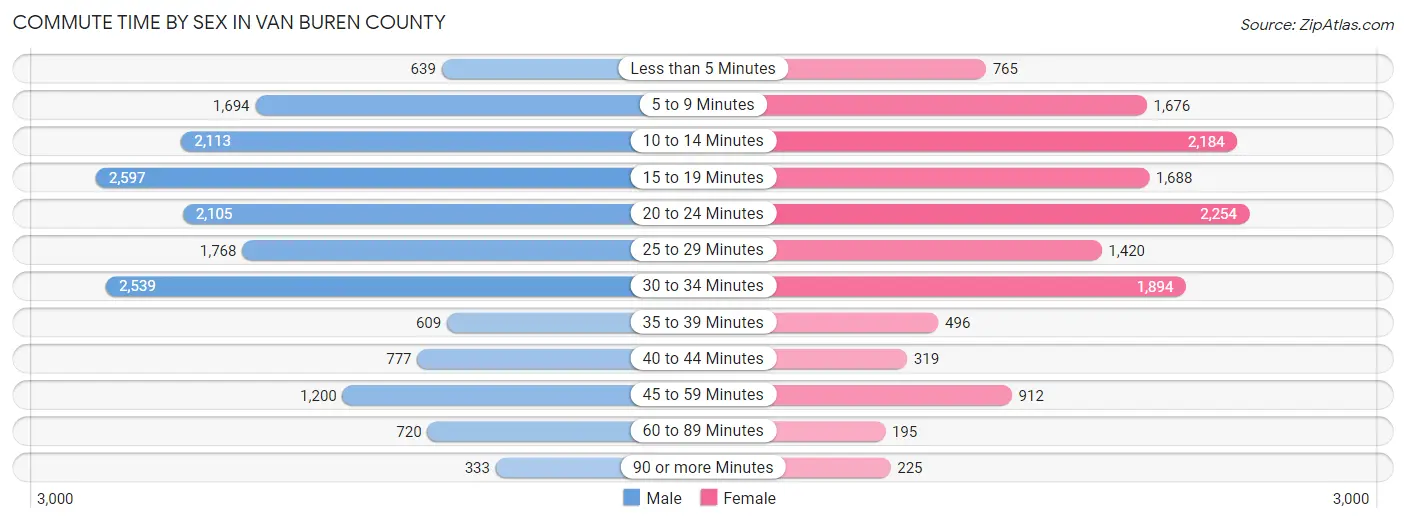
| Commute Time | Male | Female |
| Less than 5 Minutes | 639 (3.7%) | 765 (5.4%) |
| 5 to 9 Minutes | 1,694 (9.9%) | 1,676 (11.9%) |
| 10 to 14 Minutes | 2,113 (12.4%) | 2,184 (15.6%) |
| 15 to 19 Minutes | 2,597 (15.2%) | 1,688 (12.0%) |
| 20 to 24 Minutes | 2,105 (12.3%) | 2,254 (16.1%) |
| 25 to 29 Minutes | 1,768 (10.3%) | 1,420 (10.1%) |
| 30 to 34 Minutes | 2,539 (14.8%) | 1,894 (13.5%) |
| 35 to 39 Minutes | 609 (3.6%) | 496 (3.5%) |
| 40 to 44 Minutes | 777 (4.5%) | 319 (2.3%) |
| 45 to 59 Minutes | 1,200 (7.0%) | 912 (6.5%) |
| 60 to 89 Minutes | 720 (4.2%) | 195 (1.4%) |
| 90 or more Minutes | 333 (1.9%) | 225 (1.6%) |
Time of Departure to Work by Sex in Van Buren County
The most frequent times of departure to work in Van Buren County are 7:00 AM to 7:29 AM (2,463, 14.4%) for males and 7:00 AM to 7:29 AM (2,165, 15.4%) for females.
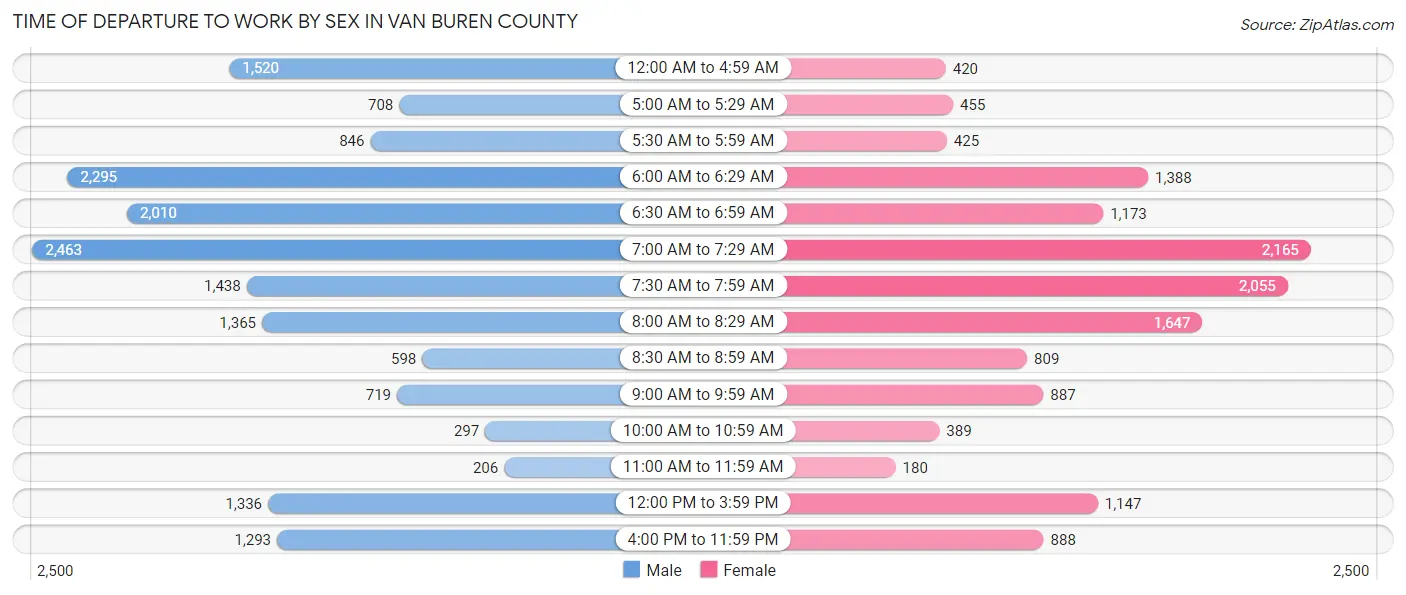
| Time of Departure | Male | Female |
| 12:00 AM to 4:59 AM | 1,520 (8.9%) | 420 (3.0%) |
| 5:00 AM to 5:29 AM | 708 (4.1%) | 455 (3.2%) |
| 5:30 AM to 5:59 AM | 846 (5.0%) | 425 (3.0%) |
| 6:00 AM to 6:29 AM | 2,295 (13.4%) | 1,388 (9.9%) |
| 6:30 AM to 6:59 AM | 2,010 (11.8%) | 1,173 (8.4%) |
| 7:00 AM to 7:29 AM | 2,463 (14.4%) | 2,165 (15.4%) |
| 7:30 AM to 7:59 AM | 1,438 (8.4%) | 2,055 (14.6%) |
| 8:00 AM to 8:29 AM | 1,365 (8.0%) | 1,647 (11.7%) |
| 8:30 AM to 8:59 AM | 598 (3.5%) | 809 (5.8%) |
| 9:00 AM to 9:59 AM | 719 (4.2%) | 887 (6.3%) |
| 10:00 AM to 10:59 AM | 297 (1.7%) | 389 (2.8%) |
| 11:00 AM to 11:59 AM | 206 (1.2%) | 180 (1.3%) |
| 12:00 PM to 3:59 PM | 1,336 (7.8%) | 1,147 (8.2%) |
| 4:00 PM to 11:59 PM | 1,293 (7.6%) | 888 (6.3%) |
| Total | 17,094 (100.0%) | 14,028 (100.0%) |
Housing Occupancy in Van Buren County
Occupancy by Ownership in Van Buren County
Of the total 29,609 dwellings in Van Buren County, owner-occupied units account for 23,731 (80.1%), while renter-occupied units make up 5,878 (19.9%).
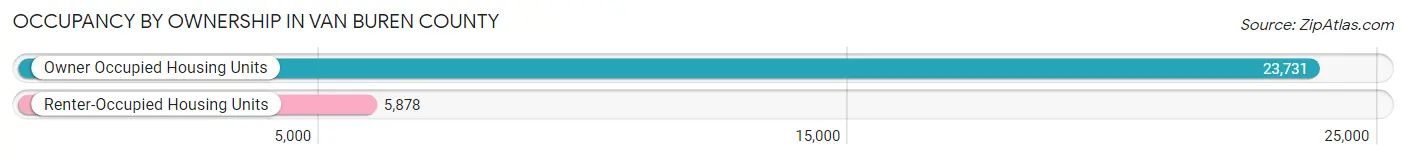
| Occupancy | # Housing Units | % Housing Units |
| Owner Occupied Housing Units | 23,731 | 80.1% |
| Renter-Occupied Housing Units | 5,878 | 19.9% |
| Total Occupied Housing Units | 29,609 | 100.0% |
Occupancy by Household Size in Van Buren County
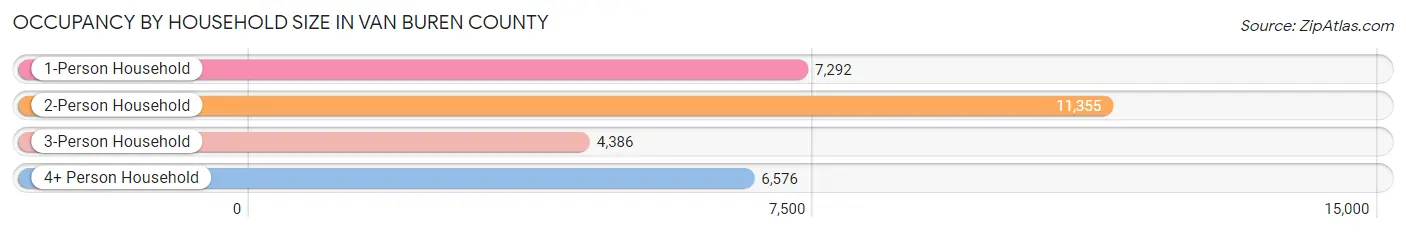
| Household Size | # Housing Units | % Housing Units |
| 1-Person Household | 7,292 | 24.6% |
| 2-Person Household | 11,355 | 38.4% |
| 3-Person Household | 4,386 | 14.8% |
| 4+ Person Household | 6,576 | 22.2% |
| Total Housing Units | 29,609 | 100.0% |
Occupancy by Ownership by Household Size in Van Buren County
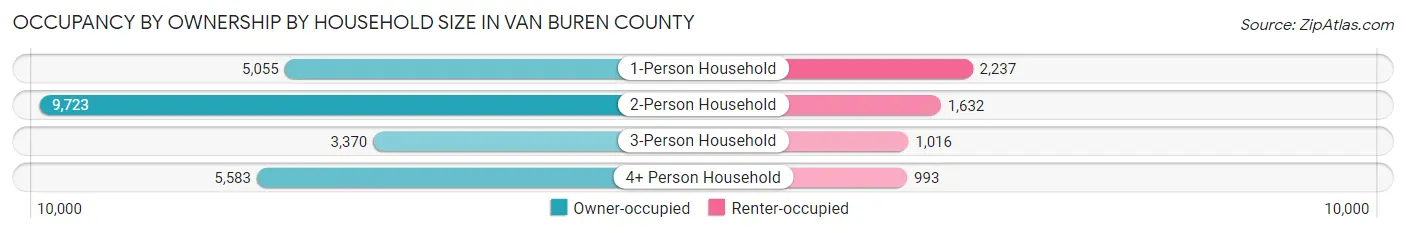
| Household Size | Owner-occupied | Renter-occupied |
| 1-Person Household | 5,055 (69.3%) | 2,237 (30.7%) |
| 2-Person Household | 9,723 (85.6%) | 1,632 (14.4%) |
| 3-Person Household | 3,370 (76.8%) | 1,016 (23.2%) |
| 4+ Person Household | 5,583 (84.9%) | 993 (15.1%) |
| Total Housing Units | 23,731 (80.1%) | 5,878 (19.9%) |
Occupancy by Educational Attainment in Van Buren County
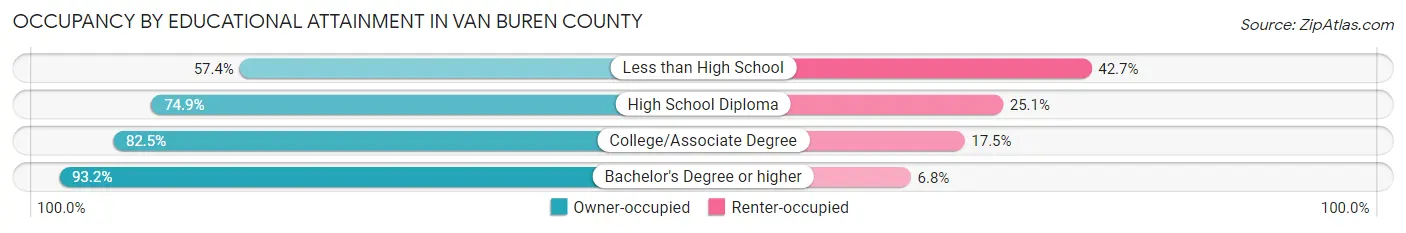
| Household Size | Owner-occupied | Renter-occupied |
| Less than High School | 1,803 (57.4%) | 1,341 (42.6%) |
| High School Diploma | 6,603 (74.9%) | 2,214 (25.1%) |
| College/Associate Degree | 8,657 (82.5%) | 1,835 (17.5%) |
| Bachelor's Degree or higher | 6,668 (93.2%) | 488 (6.8%) |
Occupancy by Age of Householder in Van Buren County
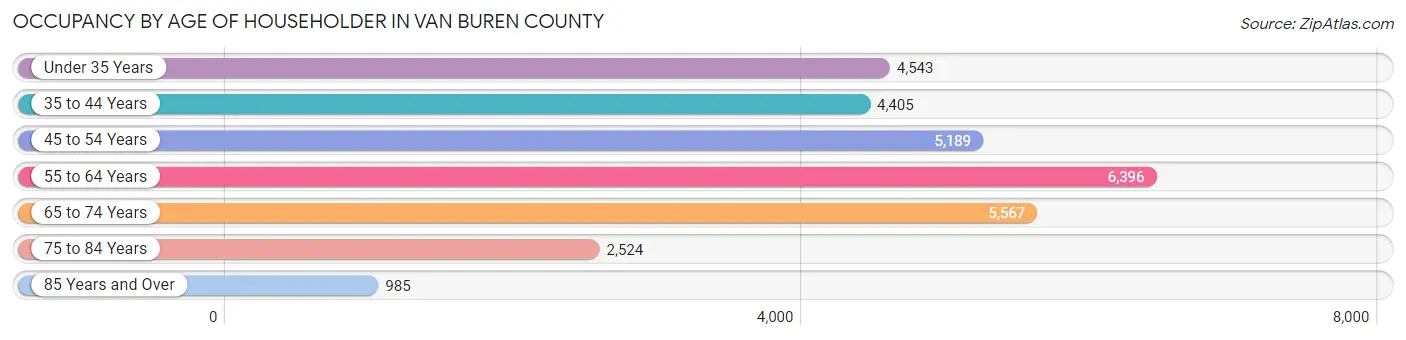
| Age Bracket | # Households | % Households |
| Under 35 Years | 4,543 | 15.3% |
| 35 to 44 Years | 4,405 | 14.9% |
| 45 to 54 Years | 5,189 | 17.5% |
| 55 to 64 Years | 6,396 | 21.6% |
| 65 to 74 Years | 5,567 | 18.8% |
| 75 to 84 Years | 2,524 | 8.5% |
| 85 Years and Over | 985 | 3.3% |
| Total | 29,609 | 100.0% |
Housing Finances in Van Buren County
Median Income by Occupancy in Van Buren County
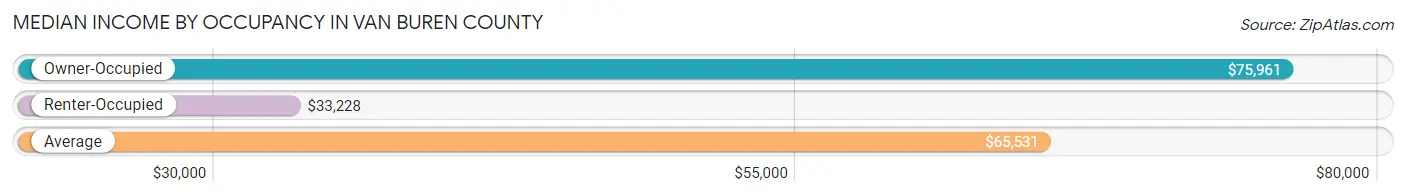
| Occupancy Type | # Households | Median Income |
| Owner-Occupied | 23,731 (80.1%) | $75,961 |
| Renter-Occupied | 5,878 (19.9%) | $33,228 |
| Average | 29,609 (100.0%) | $65,531 |
Occupancy by Householder Income Bracket in Van Buren County
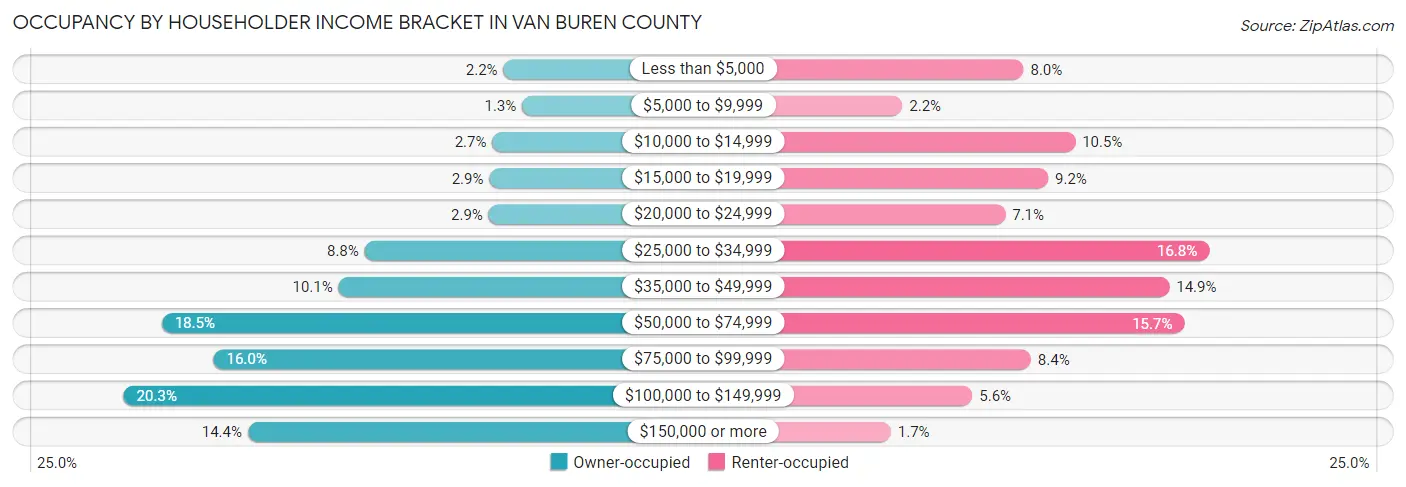
| Income Bracket | Owner-occupied | Renter-occupied |
| Less than $5,000 | 521 (2.2%) | 470 (8.0%) |
| $5,000 to $9,999 | 312 (1.3%) | 131 (2.2%) |
| $10,000 to $14,999 | 649 (2.7%) | 615 (10.5%) |
| $15,000 to $19,999 | 681 (2.9%) | 539 (9.2%) |
| $20,000 to $24,999 | 689 (2.9%) | 419 (7.1%) |
| $25,000 to $34,999 | 2,090 (8.8%) | 989 (16.8%) |
| $35,000 to $49,999 | 2,385 (10.1%) | 878 (14.9%) |
| $50,000 to $74,999 | 4,382 (18.5%) | 920 (15.7%) |
| $75,000 to $99,999 | 3,797 (16.0%) | 491 (8.4%) |
| $100,000 to $149,999 | 4,816 (20.3%) | 327 (5.6%) |
| $150,000 or more | 3,409 (14.4%) | 99 (1.7%) |
| Total | 23,731 (100.0%) | 5,878 (100.0%) |
Monthly Housing Cost Tiers in Van Buren County
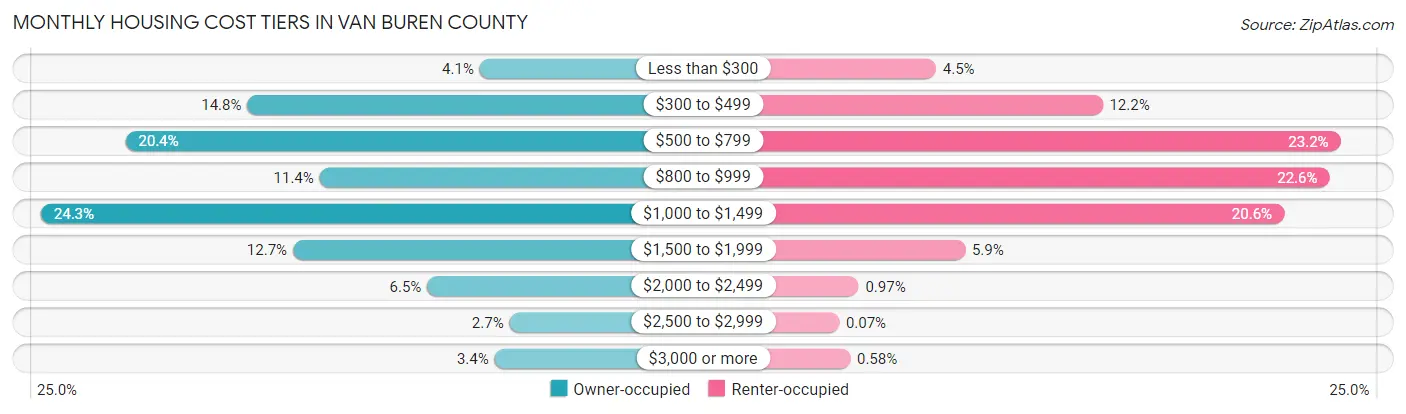
| Monthly Cost | Owner-occupied | Renter-occupied |
| Less than $300 | 961 (4.1%) | 266 (4.5%) |
| $300 to $499 | 3,500 (14.7%) | 717 (12.2%) |
| $500 to $799 | 4,832 (20.4%) | 1,361 (23.2%) |
| $800 to $999 | 2,711 (11.4%) | 1,331 (22.6%) |
| $1,000 to $1,499 | 5,755 (24.2%) | 1,208 (20.5%) |
| $1,500 to $1,999 | 3,003 (12.7%) | 345 (5.9%) |
| $2,000 to $2,499 | 1,535 (6.5%) | 57 (1.0%) |
| $2,500 to $2,999 | 635 (2.7%) | 4 (0.1%) |
| $3,000 or more | 799 (3.4%) | 34 (0.6%) |
| Total | 23,731 (100.0%) | 5,878 (100.0%) |
Physical Housing Characteristics in Van Buren County
Housing Structures in Van Buren County
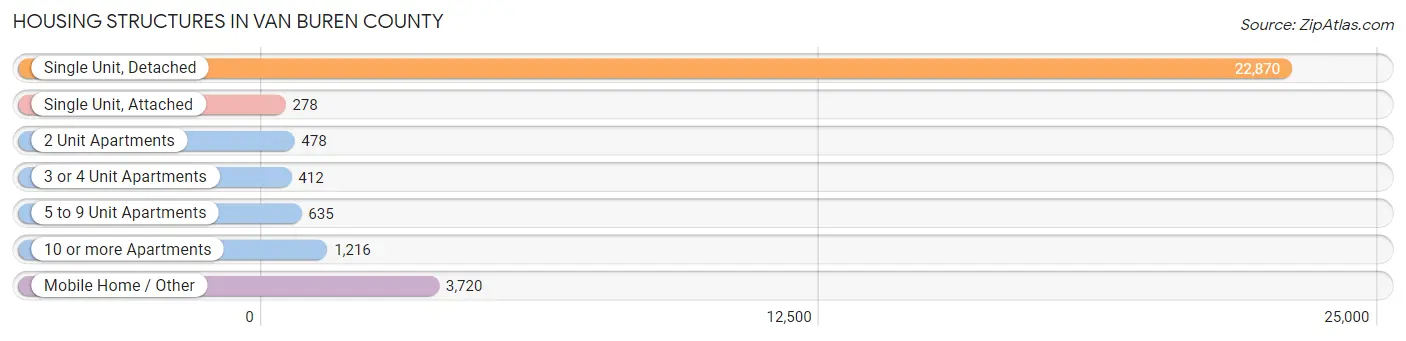
| Structure Type | # Housing Units | % Housing Units |
| Single Unit, Detached | 22,870 | 77.2% |
| Single Unit, Attached | 278 | 0.9% |
| 2 Unit Apartments | 478 | 1.6% |
| 3 or 4 Unit Apartments | 412 | 1.4% |
| 5 to 9 Unit Apartments | 635 | 2.1% |
| 10 or more Apartments | 1,216 | 4.1% |
| Mobile Home / Other | 3,720 | 12.6% |
| Total | 29,609 | 100.0% |
Housing Structures by Occupancy in Van Buren County
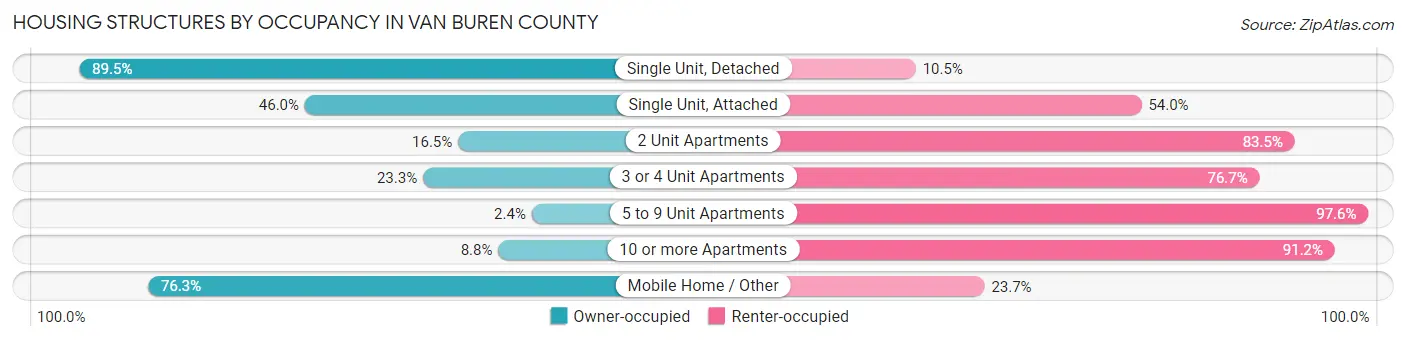
| Structure Type | Owner-occupied | Renter-occupied |
| Single Unit, Detached | 20,469 (89.5%) | 2,401 (10.5%) |
| Single Unit, Attached | 128 (46.0%) | 150 (54.0%) |
| 2 Unit Apartments | 79 (16.5%) | 399 (83.5%) |
| 3 or 4 Unit Apartments | 96 (23.3%) | 316 (76.7%) |
| 5 to 9 Unit Apartments | 15 (2.4%) | 620 (97.6%) |
| 10 or more Apartments | 107 (8.8%) | 1,109 (91.2%) |
| Mobile Home / Other | 2,837 (76.3%) | 883 (23.7%) |
| Total | 23,731 (80.1%) | 5,878 (19.9%) |
Housing Structures by Number of Rooms in Van Buren County
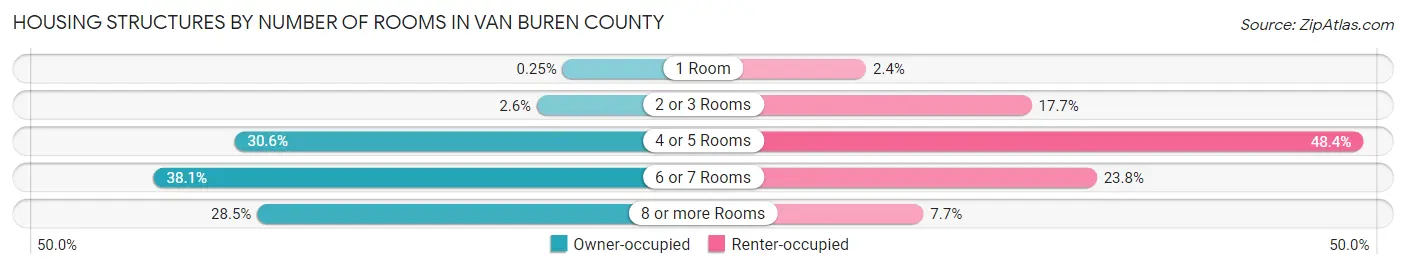
| Number of Rooms | Owner-occupied | Renter-occupied |
| 1 Room | 60 (0.3%) | 142 (2.4%) |
| 2 or 3 Rooms | 622 (2.6%) | 1,042 (17.7%) |
| 4 or 5 Rooms | 7,258 (30.6%) | 2,844 (48.4%) |
| 6 or 7 Rooms | 9,031 (38.1%) | 1,396 (23.7%) |
| 8 or more Rooms | 6,760 (28.5%) | 454 (7.7%) |
| Total | 23,731 (100.0%) | 5,878 (100.0%) |
Housing Structure by Heating Type in Van Buren County
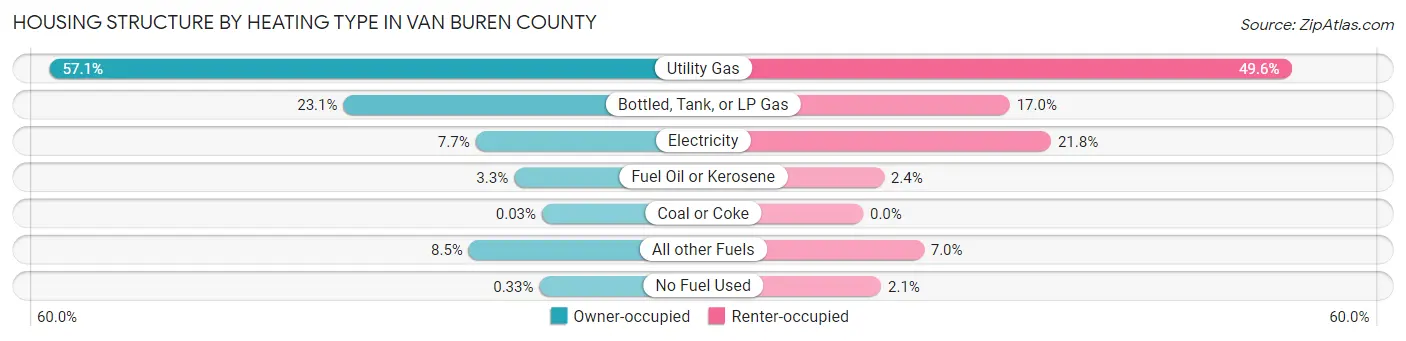
| Heating Type | Owner-occupied | Renter-occupied |
| Utility Gas | 13,548 (57.1%) | 2,918 (49.6%) |
| Bottled, Tank, or LP Gas | 5,470 (23.1%) | 1,000 (17.0%) |
| Electricity | 1,833 (7.7%) | 1,281 (21.8%) |
| Fuel Oil or Kerosene | 774 (3.3%) | 142 (2.4%) |
| Coal or Coke | 8 (0.0%) | 0 (0.0%) |
| All other Fuels | 2,020 (8.5%) | 414 (7.0%) |
| No Fuel Used | 78 (0.3%) | 123 (2.1%) |
| Total | 23,731 (100.0%) | 5,878 (100.0%) |
Household Vehicle Usage in Van Buren County
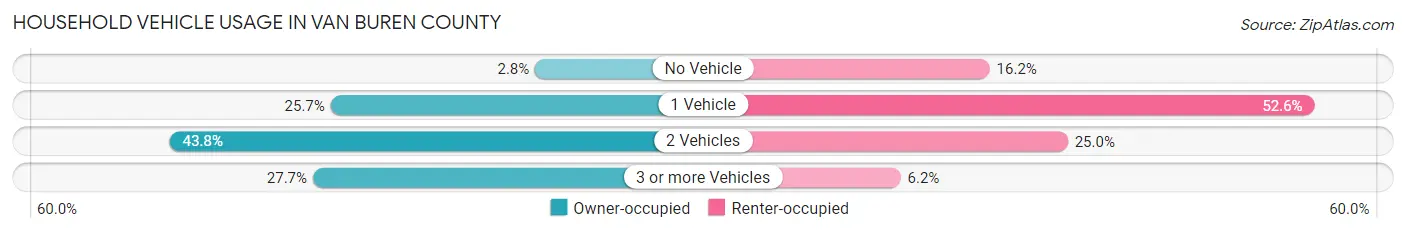
| Vehicles per Household | Owner-occupied | Renter-occupied |
| No Vehicle | 667 (2.8%) | 953 (16.2%) |
| 1 Vehicle | 6,103 (25.7%) | 3,091 (52.6%) |
| 2 Vehicles | 10,384 (43.8%) | 1,467 (25.0%) |
| 3 or more Vehicles | 6,577 (27.7%) | 367 (6.2%) |
| Total | 23,731 (100.0%) | 5,878 (100.0%) |
Real Estate & Mortgages in Van Buren County
Real Estate and Mortgage Overview in Van Buren County
| Characteristic | Without Mortgage | With Mortgage |
| Housing Units | 9,540 | 14,191 |
| Median Property Value | $156,900 | $182,400 |
| Median Household Income | $58,813 | $2,582 |
| Monthly Housing Costs | $532 | $768 |
| Real Estate Taxes | $2,212 | $583 |
Property Value by Mortgage Status in Van Buren County
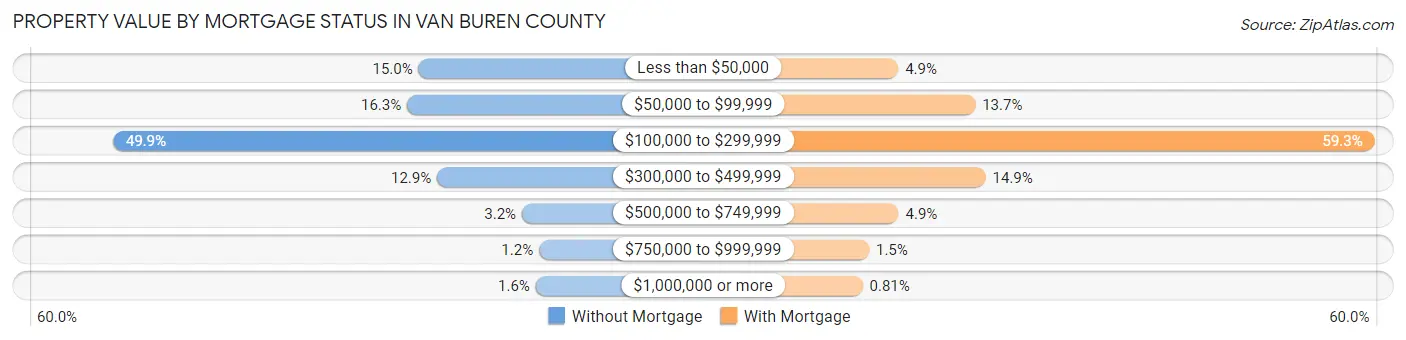
| Property Value | Without Mortgage | With Mortgage |
| Less than $50,000 | 1,429 (15.0%) | 692 (4.9%) |
| $50,000 to $99,999 | 1,554 (16.3%) | 1,941 (13.7%) |
| $100,000 to $299,999 | 4,762 (49.9%) | 8,417 (59.3%) |
| $300,000 to $499,999 | 1,227 (12.9%) | 2,109 (14.9%) |
| $500,000 to $749,999 | 301 (3.2%) | 698 (4.9%) |
| $750,000 to $999,999 | 115 (1.2%) | 219 (1.5%) |
| $1,000,000 or more | 152 (1.6%) | 115 (0.8%) |
| Total | 9,540 (100.0%) | 14,191 (100.0%) |
Household Income by Mortgage Status in Van Buren County
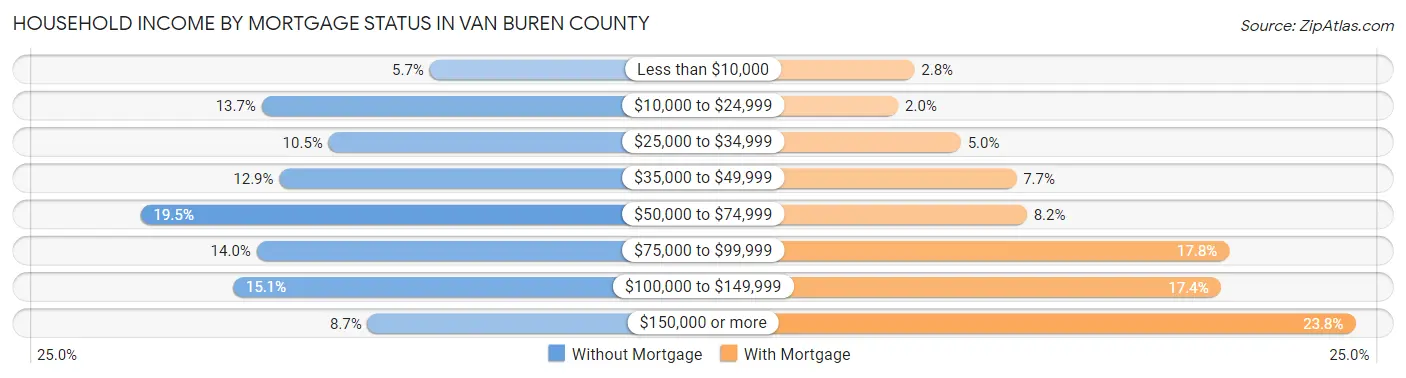
| Household Income | Without Mortgage | With Mortgage |
| Less than $10,000 | 545 (5.7%) | 398 (2.8%) |
| $10,000 to $24,999 | 1,308 (13.7%) | 288 (2.0%) |
| $25,000 to $34,999 | 1,004 (10.5%) | 711 (5.0%) |
| $35,000 to $49,999 | 1,228 (12.9%) | 1,086 (7.6%) |
| $50,000 to $74,999 | 1,858 (19.5%) | 1,157 (8.2%) |
| $75,000 to $99,999 | 1,331 (14.0%) | 2,524 (17.8%) |
| $100,000 to $149,999 | 1,439 (15.1%) | 2,466 (17.4%) |
| $150,000 or more | 827 (8.7%) | 3,377 (23.8%) |
| Total | 9,540 (100.0%) | 14,191 (100.0%) |
Property Value to Household Income Ratio in Van Buren County
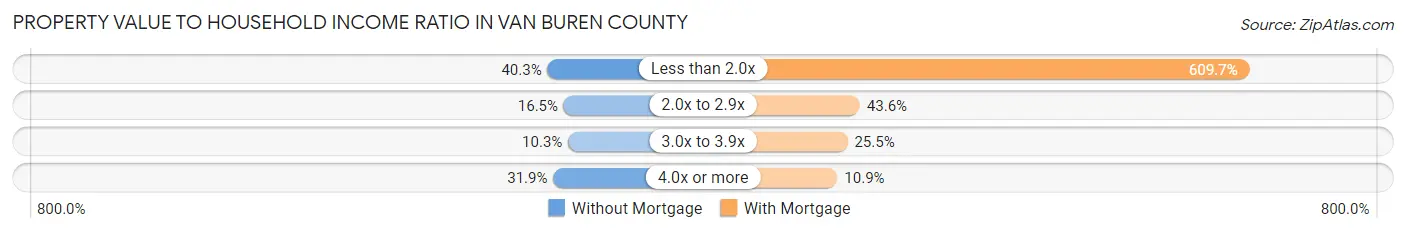
| Value-to-Income Ratio | Without Mortgage | With Mortgage |
| Less than 2.0x | 3,847 (40.3%) | 86,517 (609.7%) |
| 2.0x to 2.9x | 1,575 (16.5%) | 6,185 (43.6%) |
| 3.0x to 3.9x | 979 (10.3%) | 3,620 (25.5%) |
| 4.0x or more | 3,044 (31.9%) | 1,546 (10.9%) |
| Total | 9,540 (100.0%) | 14,191 (100.0%) |
Real Estate Taxes by Mortgage Status in Van Buren County
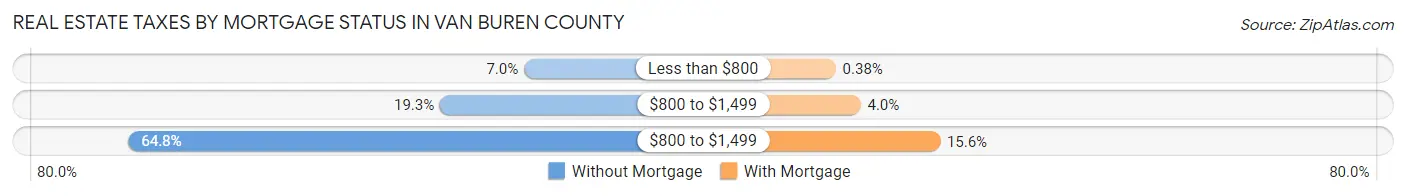
| Property Taxes | Without Mortgage | With Mortgage |
| Less than $800 | 670 (7.0%) | 54 (0.4%) |
| $800 to $1,499 | 1,840 (19.3%) | 570 (4.0%) |
| $800 to $1,499 | 6,185 (64.8%) | 2,216 (15.6%) |
| Total | 9,540 (100.0%) | 14,191 (100.0%) |
Health & Disability in Van Buren County
Health Insurance Coverage by Age in Van Buren County
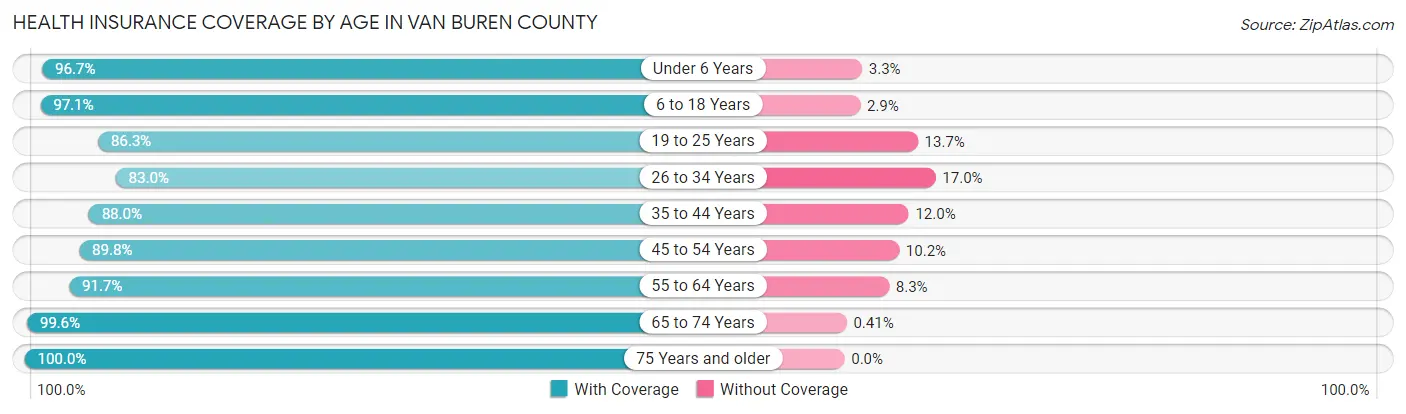
| Age Bracket | With Coverage | Without Coverage |
| Under 6 Years | 5,240 (96.7%) | 177 (3.3%) |
| 6 to 18 Years | 12,519 (97.1%) | 378 (2.9%) |
| 19 to 25 Years | 4,853 (86.3%) | 769 (13.7%) |
| 26 to 34 Years | 6,502 (83.0%) | 1,331 (17.0%) |
| 35 to 44 Years | 7,831 (88.0%) | 1,065 (12.0%) |
| 45 to 54 Years | 8,225 (89.8%) | 932 (10.2%) |
| 55 to 64 Years | 10,323 (91.7%) | 936 (8.3%) |
| 65 to 74 Years | 8,823 (99.6%) | 36 (0.4%) |
| 75 Years and older | 5,094 (100.0%) | 0 (0.0%) |
| Total | 69,410 (92.5%) | 5,624 (7.5%) |
Health Insurance Coverage by Citizenship Status in Van Buren County
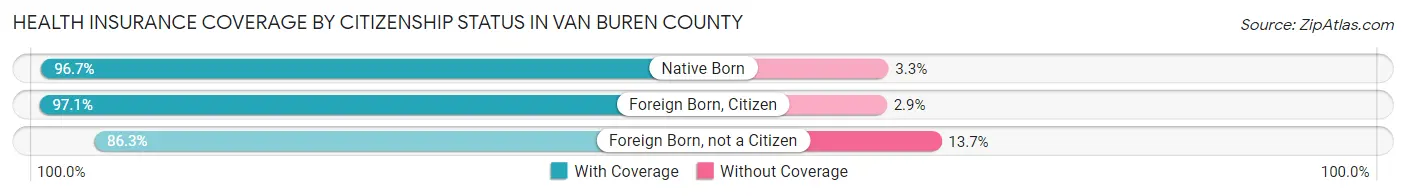
| Citizenship Status | With Coverage | Without Coverage |
| Native Born | 5,240 (96.7%) | 177 (3.3%) |
| Foreign Born, Citizen | 12,519 (97.1%) | 378 (2.9%) |
| Foreign Born, not a Citizen | 4,853 (86.3%) | 769 (13.7%) |
Health Insurance Coverage by Household Income in Van Buren County
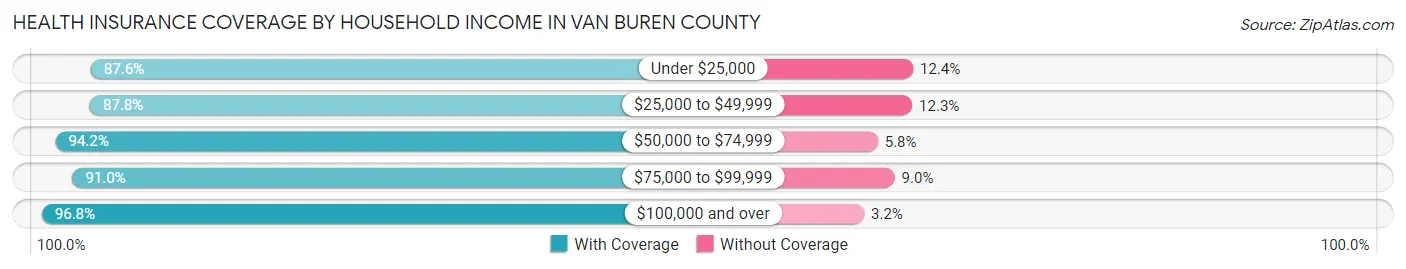
| Household Income | With Coverage | Without Coverage |
| Under $25,000 | 7,750 (87.6%) | 1,100 (12.4%) |
| $25,000 to $49,999 | 11,900 (87.7%) | 1,662 (12.2%) |
| $50,000 to $74,999 | 12,313 (94.2%) | 758 (5.8%) |
| $75,000 to $99,999 | 11,109 (91.0%) | 1,094 (9.0%) |
| $100,000 and over | 25,757 (96.8%) | 862 (3.2%) |
Public vs Private Health Insurance Coverage by Age in Van Buren County
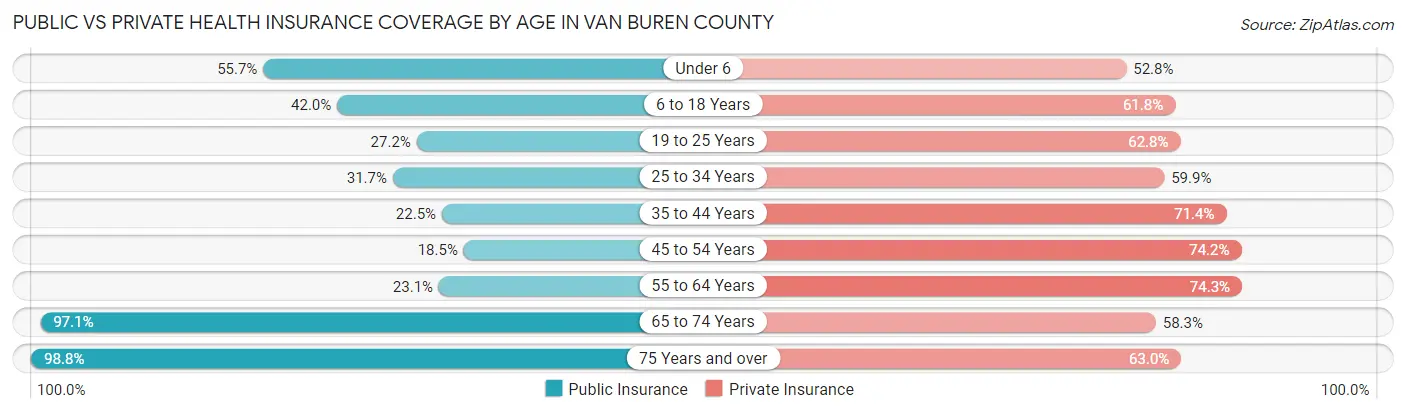
| Age Bracket | Public Insurance | Private Insurance |
| Under 6 | 3,018 (55.7%) | 2,860 (52.8%) |
| 6 to 18 Years | 5,415 (42.0%) | 7,975 (61.8%) |
| 19 to 25 Years | 1,531 (27.2%) | 3,532 (62.8%) |
| 25 to 34 Years | 2,480 (31.7%) | 4,688 (59.9%) |
| 35 to 44 Years | 2,005 (22.5%) | 6,349 (71.4%) |
| 45 to 54 Years | 1,693 (18.5%) | 6,790 (74.2%) |
| 55 to 64 Years | 2,601 (23.1%) | 8,361 (74.3%) |
| 65 to 74 Years | 8,601 (97.1%) | 5,164 (58.3%) |
| 75 Years and over | 5,033 (98.8%) | 3,208 (63.0%) |
| Total | 32,377 (43.1%) | 48,927 (65.2%) |
Disability Status by Sex by Age in Van Buren County
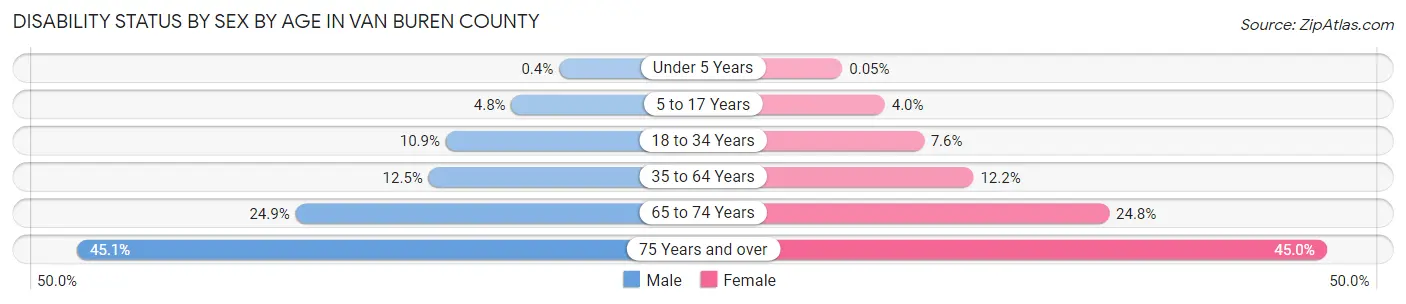
| Age Bracket | Male | Female |
| Under 5 Years | 9 (0.4%) | 1 (0.1%) |
| 5 to 17 Years | 320 (4.8%) | 256 (4.0%) |
| 18 to 34 Years | 813 (10.9%) | 523 (7.6%) |
| 35 to 64 Years | 1,810 (12.5%) | 1,813 (12.2%) |
| 65 to 74 Years | 1,089 (24.9%) | 1,111 (24.8%) |
| 75 Years and over | 1,030 (45.1%) | 1,265 (45.0%) |
Disability Class by Sex by Age in Van Buren County
Disability Class: Hearing Difficulty
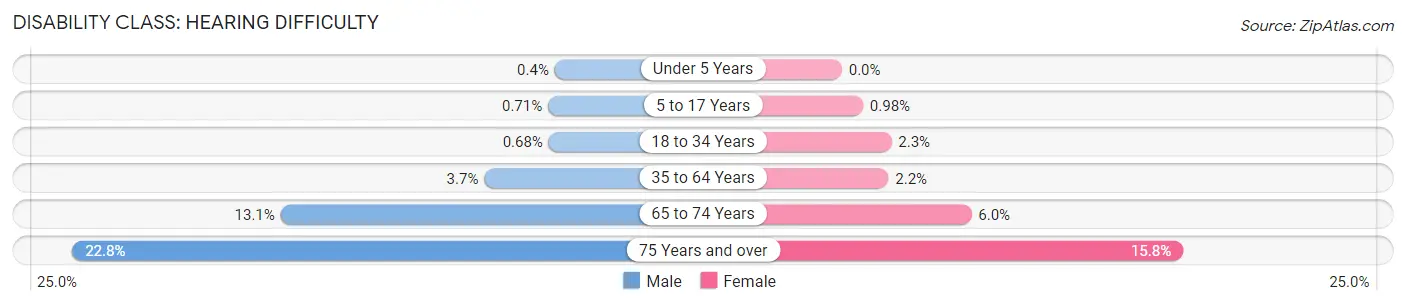
| Age Bracket | Male | Female |
| Under 5 Years | 9 (0.4%) | 0 (0.0%) |
| 5 to 17 Years | 47 (0.7%) | 63 (1.0%) |
| 18 to 34 Years | 51 (0.7%) | 158 (2.3%) |
| 35 to 64 Years | 531 (3.7%) | 320 (2.2%) |
| 65 to 74 Years | 575 (13.1%) | 269 (6.0%) |
| 75 Years and over | 520 (22.8%) | 445 (15.8%) |
Disability Class: Vision Difficulty
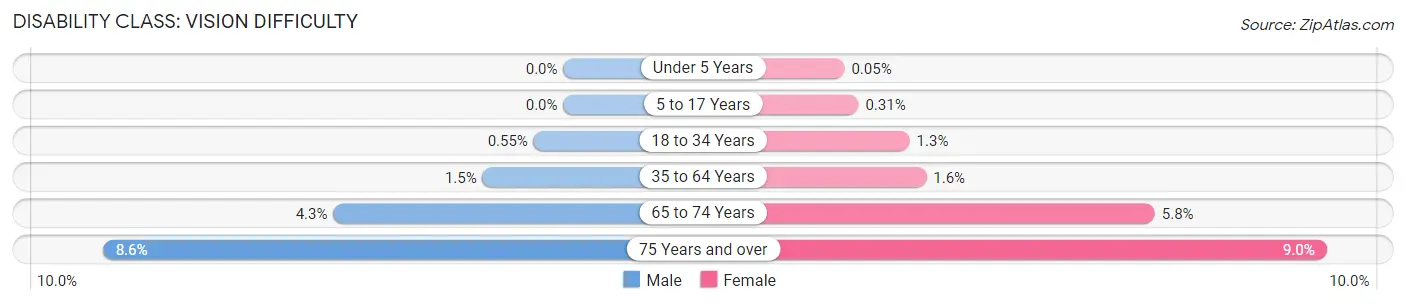
| Age Bracket | Male | Female |
| Under 5 Years | 0 (0.0%) | 1 (0.1%) |
| 5 to 17 Years | 0 (0.0%) | 20 (0.3%) |
| 18 to 34 Years | 41 (0.5%) | 87 (1.3%) |
| 35 to 64 Years | 217 (1.5%) | 233 (1.6%) |
| 65 to 74 Years | 187 (4.3%) | 260 (5.8%) |
| 75 Years and over | 195 (8.6%) | 253 (9.0%) |
Disability Class: Cognitive Difficulty
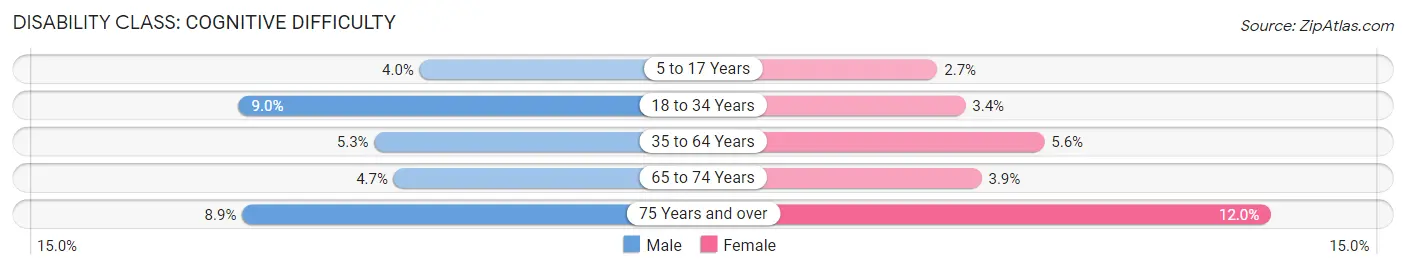
| Age Bracket | Male | Female |
| 5 to 17 Years | 266 (4.0%) | 171 (2.7%) |
| 18 to 34 Years | 674 (9.0%) | 237 (3.4%) |
| 35 to 64 Years | 762 (5.3%) | 836 (5.6%) |
| 65 to 74 Years | 207 (4.7%) | 174 (3.9%) |
| 75 Years and over | 204 (8.9%) | 336 (11.9%) |
Disability Class: Ambulatory Difficulty
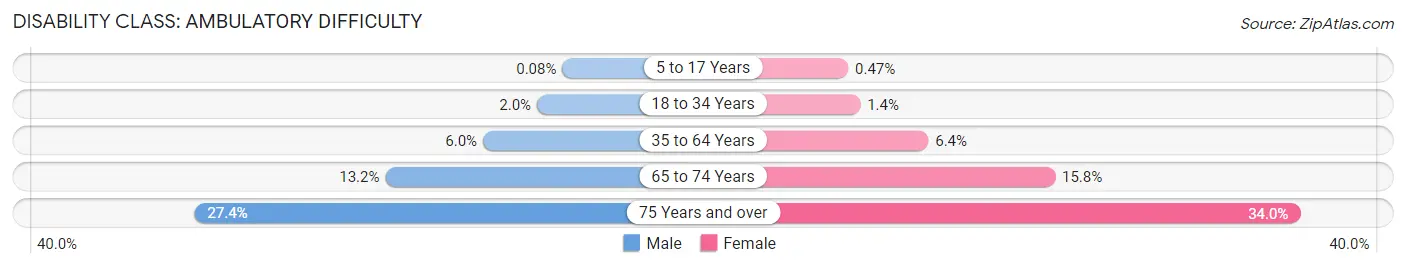
| Age Bracket | Male | Female |
| 5 to 17 Years | 5 (0.1%) | 30 (0.5%) |
| 18 to 34 Years | 146 (2.0%) | 94 (1.4%) |
| 35 to 64 Years | 864 (6.0%) | 952 (6.4%) |
| 65 to 74 Years | 579 (13.2%) | 709 (15.8%) |
| 75 Years and over | 625 (27.4%) | 957 (34.0%) |
Disability Class: Self-Care Difficulty
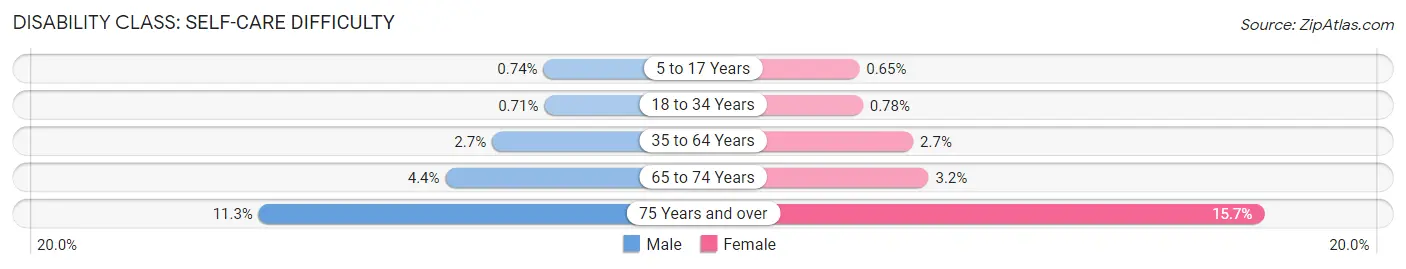
| Age Bracket | Male | Female |
| 5 to 17 Years | 49 (0.7%) | 42 (0.6%) |
| 18 to 34 Years | 53 (0.7%) | 54 (0.8%) |
| 35 to 64 Years | 383 (2.6%) | 393 (2.6%) |
| 65 to 74 Years | 192 (4.4%) | 144 (3.2%) |
| 75 Years and over | 258 (11.3%) | 441 (15.7%) |
Technology Access in Van Buren County
Computing Device Access in Van Buren County
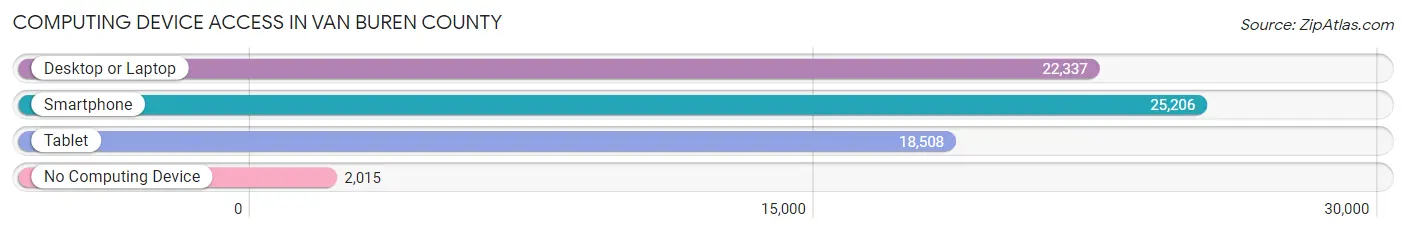
| Device Type | # Households | % Households |
| Desktop or Laptop | 22,337 | 75.4% |
| Smartphone | 25,206 | 85.1% |
| Tablet | 18,508 | 62.5% |
| No Computing Device | 2,015 | 6.8% |
| Total | 29,609 | 100.0% |
Internet Access in Van Buren County
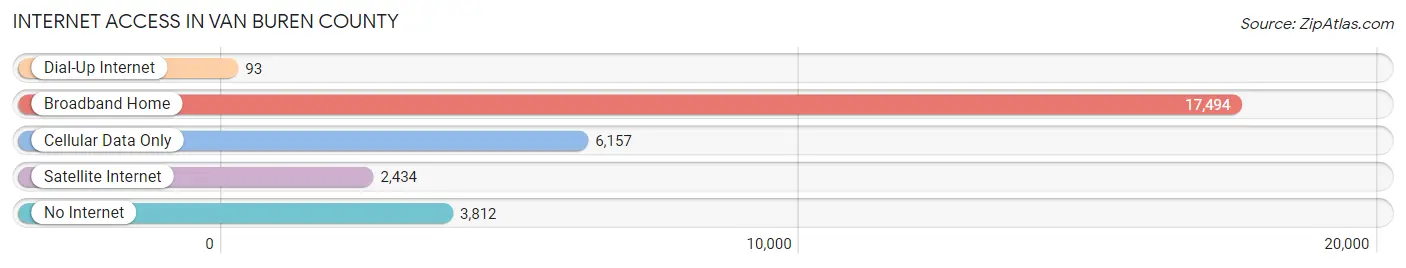
| Internet Type | # Households | % Households |
| Dial-Up Internet | 93 | 0.3% |
| Broadband Home | 17,494 | 59.1% |
| Cellular Data Only | 6,157 | 20.8% |
| Satellite Internet | 2,434 | 8.2% |
| No Internet | 3,812 | 12.9% |
| Total | 29,609 | 100.0% |
Van Buren County Summary
Van Buren County is located in the southwestern corner of Michigan, and is part of the Kalamazoo-Portage Metropolitan Statistical Area. The county is bordered by Lake Michigan to the west, Allegan County to the north, Kalamazoo County to the east, and Indiana to the south. The county seat is Paw Paw, and the largest city is South Haven.
History
Van Buren County was established in 1829 and named after Martin Van Buren, the eighth President of the United States. The county was originally part of Kalamazoo County, but was split off in 1837. The county was initially populated by Native Americans, primarily the Potawatomi tribe. The first white settlers arrived in the area in the early 1800s, and the county was officially organized in 1837.
The county was largely agricultural in the 19th century, with the main crops being wheat, corn, and potatoes. The county also had a thriving lumber industry, with several sawmills located along the Paw Paw River. The county was also home to several small manufacturing businesses, including a brickyard, a furniture factory, and a canning factory.
Geography
Van Buren County covers an area of 545 square miles, and is located in the southwestern corner of Michigan. The county is bordered by Lake Michigan to the west, Allegan County to the north, Kalamazoo County to the east, and Indiana to the south. The county is mostly flat, with some rolling hills in the northern part of the county. The highest point in the county is located in the northeast corner, at an elevation of 890 feet.
The county is home to several rivers and streams, including the Paw Paw River, the Black River, and the St. Joseph River. The county also has several lakes, including Lake Michigan, Lake Allegan, and Lake Cora.
Economy
The economy of Van Buren County is largely based on agriculture and tourism. The county is home to several large farms, which produce a variety of crops, including corn, wheat, soybeans, and potatoes. The county is also home to several wineries and breweries, which attract tourists from around the region.
The county is also home to several manufacturing businesses, including a furniture factory, a canning factory, and a brickyard. The county is also home to several retail businesses, including several antique stores and a variety of restaurants.
Demographics
As of the 2010 census, the population of Van Buren County was 76,258. The population is largely white (90.2%), with small percentages of African Americans (3.2%), Hispanics (2.7%), and Asians (1.3%). The median household income is $50,945, and the median home value is $133,400.
The county is home to several colleges and universities, including Kalamazoo Valley Community College, Western Michigan University, and Davenport University. The county is also home to several museums, including the Van Buren County Historical Museum and the South Haven Center for the Arts.
Conclusion
Van Buren County is a rural county located in the southwestern corner of Michigan. The county is largely agricultural, with a thriving tourism industry. The county is home to several colleges and universities, as well as several museums and retail businesses. The population of the county is largely white, with small percentages of African Americans, Hispanics, and Asians. The median household income is $50,945, and the median home value is $133,400.
Common Questions
What is Per Capita Income in Van Buren County?
Per Capita income in Van Buren County is $32,361.
What is the Median Family Income in Van Buren County?
Median Family Income in Van Buren County is $80,321.
What is the Median Household income in Van Buren County?
Median Household Income in Van Buren County is $65,531.
What is Income or Wage Gap in Van Buren County?
Income or Wage Gap in Van Buren County is 35.7%.
Women in Van Buren County earn 64.3 cents for every dollar earned by a man.
What is Family Income Deficit in Van Buren County?
Family Income Deficit in Van Buren County is $11,004.
Families that are below poverty line in Van Buren County earn $11,004 less on average than the poverty threshold level.
What is Inequality or Gini Index in Van Buren County?
Inequality or Gini Index in Van Buren County is 0.43.
What is the Total Population of Van Buren County?
Total Population of Van Buren County is 75,636.
What is the Total Male Population of Van Buren County?
Total Male Population of Van Buren County is 37,837.
What is the Total Female Population of Van Buren County?
Total Female Population of Van Buren County is 37,799.
What is the Ratio of Males per 100 Females in Van Buren County?
There are 100.10 Males per 100 Females in Van Buren County.
What is the Ratio of Females per 100 Males in Van Buren County?
There are 99.90 Females per 100 Males in Van Buren County.
What is the Median Population Age in Van Buren County?
Median Population Age in Van Buren County is 40.8 Years.
What is the Average Family Size in Van Buren County
Average Family Size in Van Buren County is 3.0 People.
What is the Average Household Size in Van Buren County
Average Household Size in Van Buren County is 2.5 People.
How Large is the Labor Force in Van Buren County?
There are 36,148 People in the Labor Forcein in Van Buren County.
What is the Percentage of People in the Labor Force in Van Buren County?
60.0% of People are in the Labor Force in Van Buren County.
What is the Unemployment Rate in Van Buren County?
Unemployment Rate in Van Buren County is 4.7%.