Macomb County, MI Map & Demographics
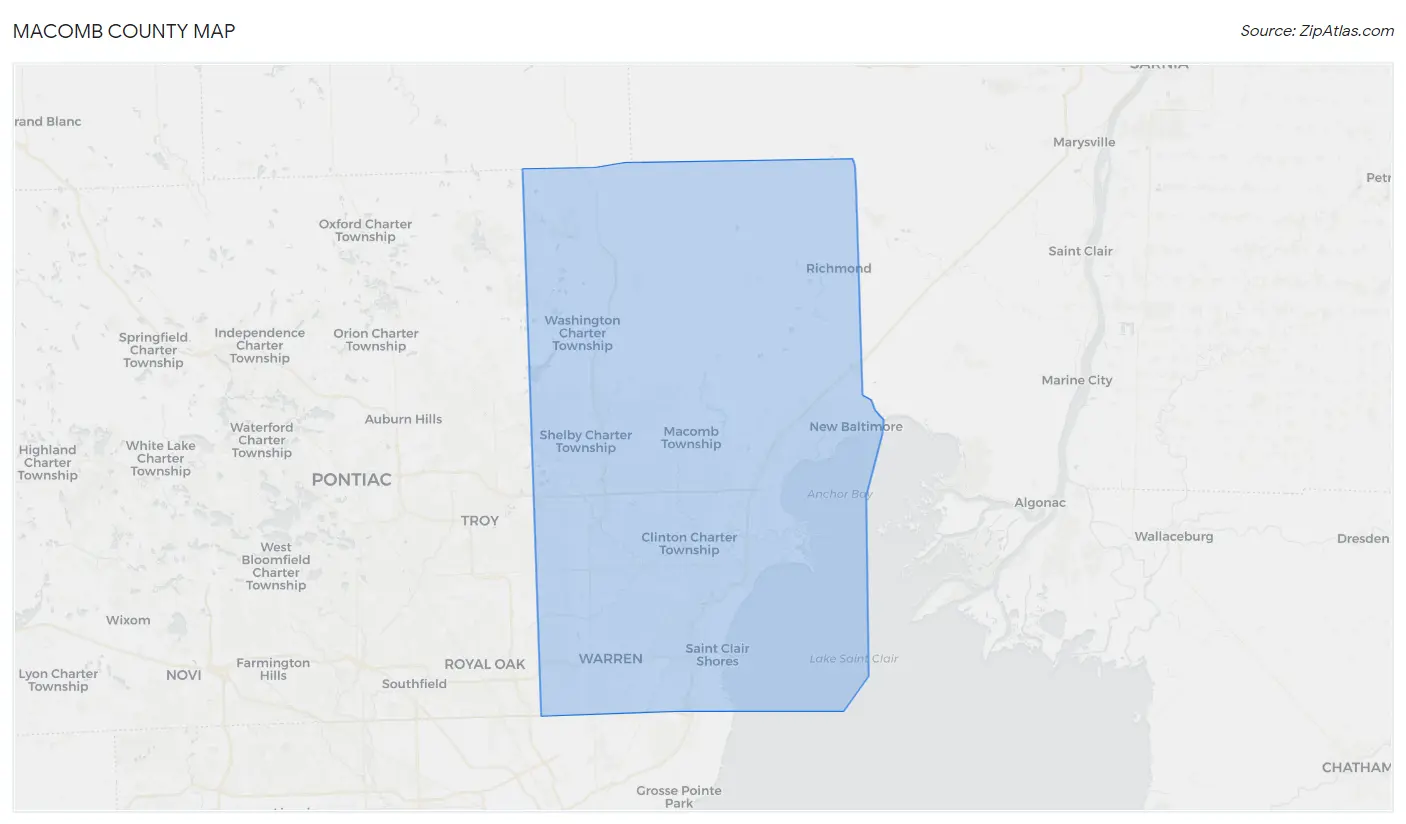
Macomb County Map
Macomb County Overview
$38,015
PER CAPITA INCOME
$92,227
AVG FAMILY INCOME
$73,876
AVG HOUSEHOLD INCOME
34.0%
WAGE / INCOME GAP [ % ]
66.0¢/ $1
WAGE / INCOME GAP [ $ ]
$9,991
FAMILY INCOME DEFICIT
0.43
INEQUALITY / GINI INDEX
878,453
TOTAL POPULATION
431,113
MALE POPULATION
447,340
FEMALE POPULATION
96.37
MALES / 100 FEMALES
103.76
FEMALES / 100 MALES
41.0
MEDIAN AGE
3.1
AVG FAMILY SIZE
2.5
AVG HOUSEHOLD SIZE
460,314
LABOR FORCE [ PEOPLE ]
64.0%
PERCENT IN LABOR FORCE
5.7%
UNEMPLOYMENT RATE
Income in Macomb County
Income Overview in Macomb County
Per Capita Income in Macomb County is $38,015, while median incomes of families and households are $92,227 and $73,876 respectively.
| Characteristic | Number | Measure |
| Per Capita Income | 878,453 | $38,015 |
| Median Family Income | 227,289 | $92,227 |
| Mean Family Income | 227,289 | $110,030 |
| Median Household Income | 354,251 | $73,876 |
| Mean Household Income | 354,251 | $93,292 |
| Income Deficit | 227,289 | $9,991 |
| Wage / Income Gap (%) | 878,453 | 34.02% |
| Wage / Income Gap ($) | 878,453 | 65.98¢ per $1 |
| Gini / Inequality Index | 878,453 | 0.43 |
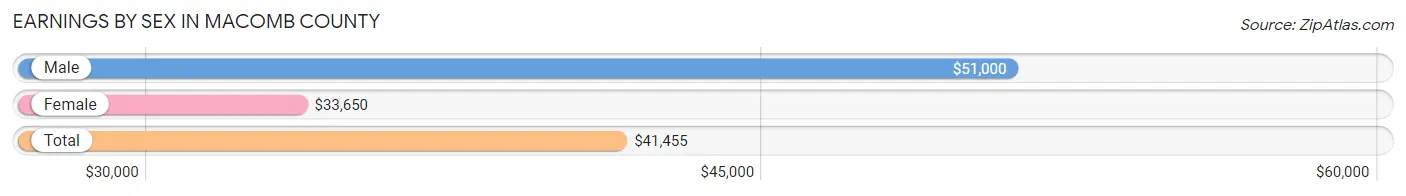
Earnings by Sex in Macomb County
Average Earnings in Macomb County are $41,455, $51,000 for men and $33,650 for women, a difference of 34.0%.
| Sex | Number | Average Earnings |
| Male | 252,138 (52.7%) | $51,000 |
| Female | 226,294 (47.3%) | $33,650 |
| Total | 478,432 (100.0%) | $41,455 |
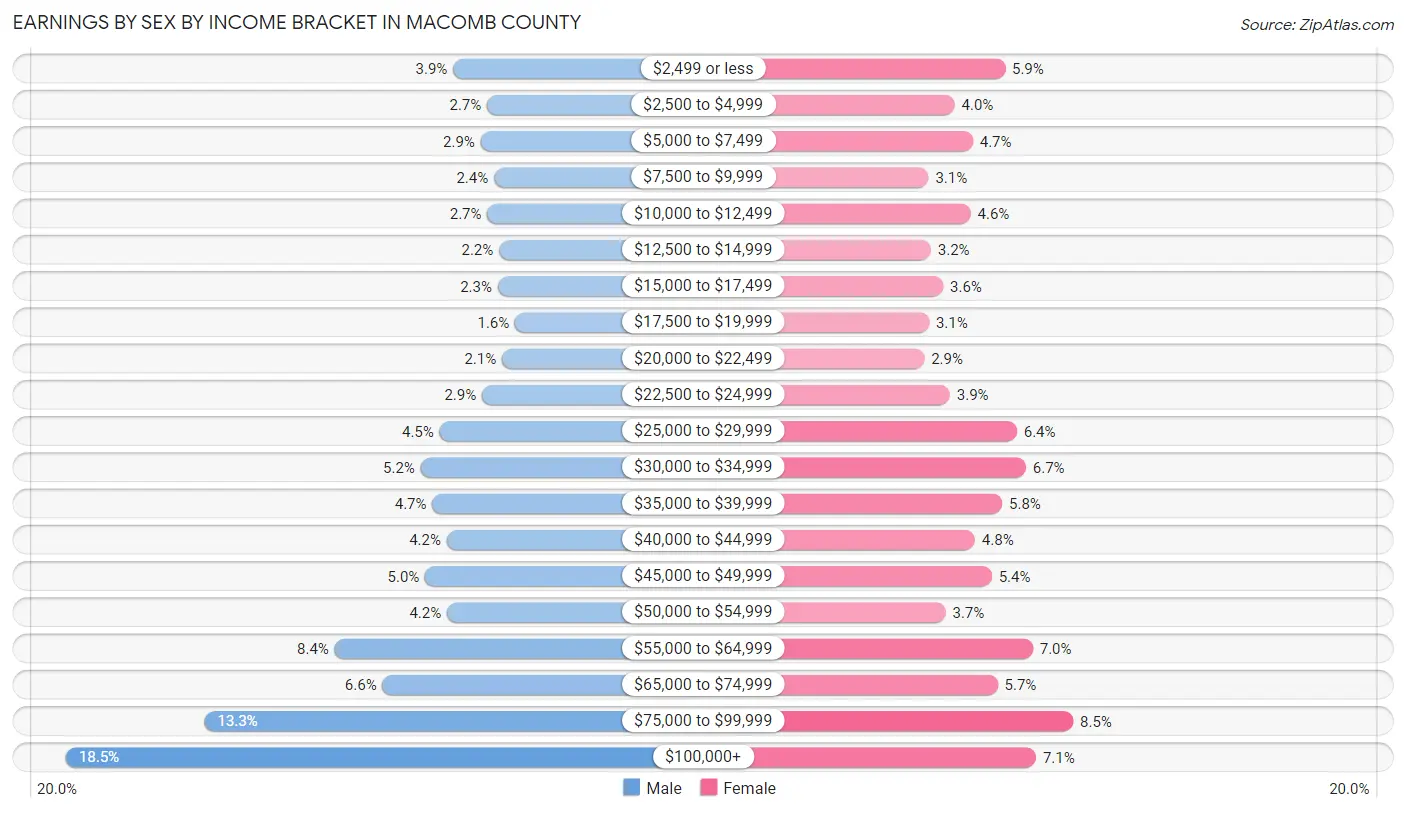
Earnings by Sex by Income Bracket in Macomb County
The most common earnings brackets in Macomb County are $100,000+ for men (46,531 | 18.4%) and $75,000 to $99,999 for women (19,179 | 8.5%).
| Income | Male | Female |
| $2,499 or less | 9,940 (3.9%) | 13,424 (5.9%) |
| $2,500 to $4,999 | 6,720 (2.7%) | 9,150 (4.0%) |
| $5,000 to $7,499 | 7,328 (2.9%) | 10,671 (4.7%) |
| $7,500 to $9,999 | 6,082 (2.4%) | 6,930 (3.1%) |
| $10,000 to $12,499 | 6,702 (2.7%) | 10,510 (4.6%) |
| $12,500 to $14,999 | 5,608 (2.2%) | 7,127 (3.2%) |
| $15,000 to $17,499 | 5,734 (2.3%) | 8,179 (3.6%) |
| $17,500 to $19,999 | 4,081 (1.6%) | 6,964 (3.1%) |
| $20,000 to $22,499 | 5,313 (2.1%) | 6,558 (2.9%) |
| $22,500 to $24,999 | 7,199 (2.9%) | 8,725 (3.9%) |
| $25,000 to $29,999 | 11,220 (4.4%) | 14,416 (6.4%) |
| $30,000 to $34,999 | 13,007 (5.2%) | 15,180 (6.7%) |
| $35,000 to $39,999 | 11,899 (4.7%) | 13,174 (5.8%) |
| $40,000 to $44,999 | 10,529 (4.2%) | 10,857 (4.8%) |
| $45,000 to $49,999 | 12,581 (5.0%) | 12,279 (5.4%) |
| $50,000 to $54,999 | 10,502 (4.2%) | 8,370 (3.7%) |
| $55,000 to $64,999 | 21,120 (8.4%) | 15,775 (7.0%) |
| $65,000 to $74,999 | 16,614 (6.6%) | 12,781 (5.7%) |
| $75,000 to $99,999 | 33,428 (13.3%) | 19,179 (8.5%) |
| $100,000+ | 46,531 (18.4%) | 16,045 (7.1%) |
| Total | 252,138 (100.0%) | 226,294 (100.0%) |
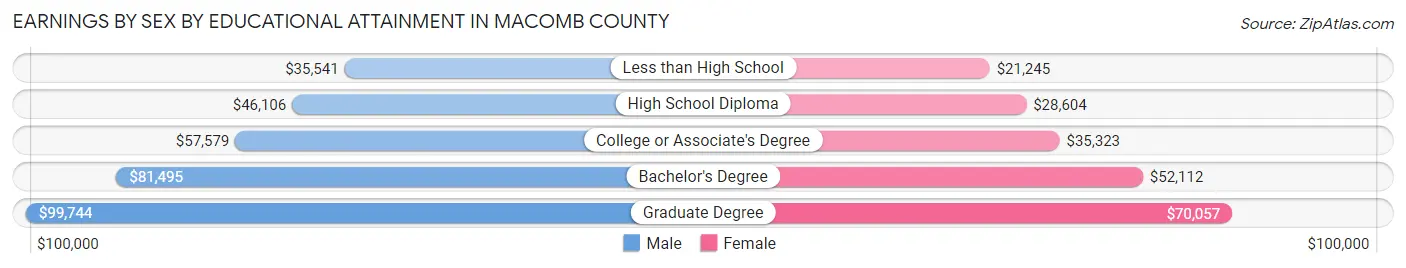
Earnings by Sex by Educational Attainment in Macomb County
Average earnings in Macomb County are $57,995 for men and $38,252 for women, a difference of 34.0%. Men with an educational attainment of graduate degree enjoy the highest average annual earnings of $99,744, while those with less than high school education earn the least with $35,541. Women with an educational attainment of graduate degree earn the most with the average annual earnings of $70,057, while those with less than high school education have the smallest earnings of $21,245.
| Educational Attainment | Male Income | Female Income |
| Less than High School | $35,541 | $21,245 |
| High School Diploma | $46,106 | $28,604 |
| College or Associate's Degree | $57,579 | $35,323 |
| Bachelor's Degree | $81,495 | $52,112 |
| Graduate Degree | $99,744 | $70,057 |
| Total | $57,995 | $38,252 |
Family Income in Macomb County
Family Income Brackets in Macomb County
According to the Macomb County family income data, there are 52,049 families falling into the $100,000 to $149,999 income range, which is the most common income bracket and makes up 22.9% of all families. Conversely, the $10,000 to $14,999 income bracket is the least frequent group with only 3,864 families (1.7%) belonging to this category.
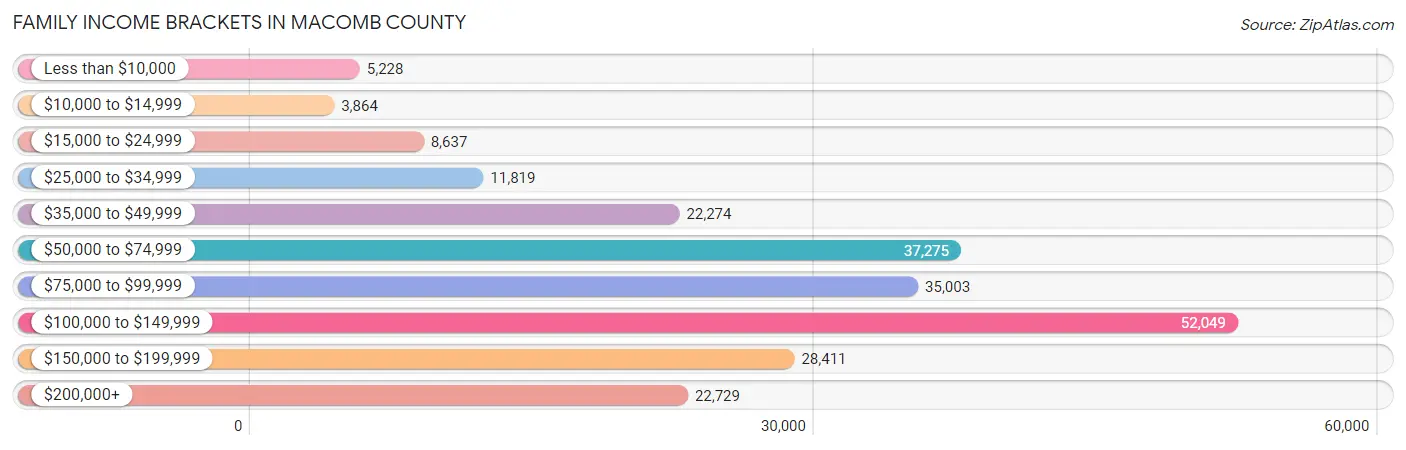
| Income Bracket | # Families | % Families |
| Less than $10,000 | 5,228 | 2.3% |
| $10,000 to $14,999 | 3,864 | 1.7% |
| $15,000 to $24,999 | 8,637 | 3.8% |
| $25,000 to $34,999 | 11,819 | 5.2% |
| $35,000 to $49,999 | 22,274 | 9.8% |
| $50,000 to $74,999 | 37,275 | 16.4% |
| $75,000 to $99,999 | 35,003 | 15.4% |
| $100,000 to $149,999 | 52,049 | 22.9% |
| $150,000 to $199,999 | 28,411 | 12.5% |
| $200,000+ | 22,729 | 10.0% |
Family Income by Famaliy Size in Macomb County
5-person families (18,603 | 8.2%) account for the highest median family income in Macomb County with $118,469 per family, while 2-person families (105,212 | 46.3%) have the highest median income of $38,564 per family member.
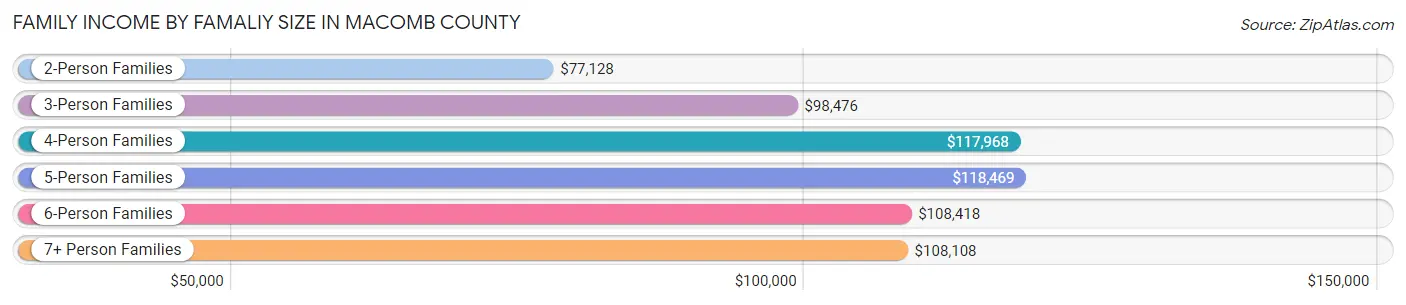
| Income Bracket | # Families | Median Income |
| 2-Person Families | 105,212 (46.3%) | $77,128 |
| 3-Person Families | 52,573 (23.1%) | $98,476 |
| 4-Person Families | 41,682 (18.3%) | $117,968 |
| 5-Person Families | 18,603 (8.2%) | $118,469 |
| 6-Person Families | 6,072 (2.7%) | $108,418 |
| 7+ Person Families | 3,147 (1.4%) | $108,108 |
| Total | 227,289 (100.0%) | $92,227 |
Family Income by Number of Earners in Macomb County
The median family income in Macomb County is $92,227, with families comprising 3+ earners (35,622) having the highest median family income of $149,388, while families with no earners (33,892) have the lowest median family income of $52,842, accounting for 15.7% and 14.9% of families, respectively.
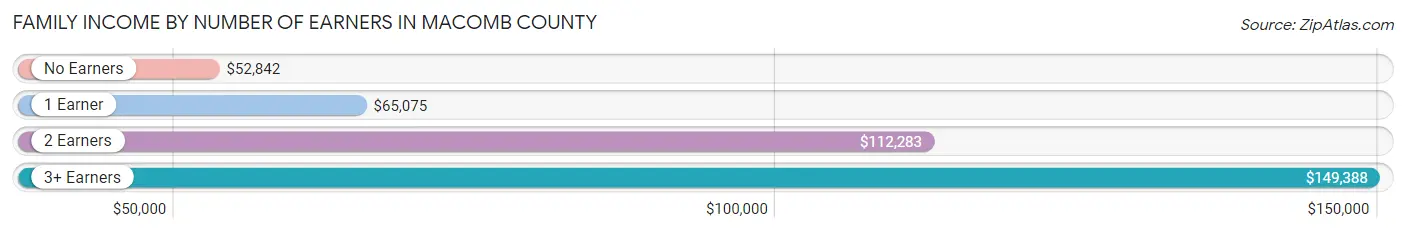
| Number of Earners | # Families | Median Income |
| No Earners | 33,892 (14.9%) | $52,842 |
| 1 Earner | 69,300 (30.5%) | $65,075 |
| 2 Earners | 88,475 (38.9%) | $112,283 |
| 3+ Earners | 35,622 (15.7%) | $149,388 |
| Total | 227,289 (100.0%) | $92,227 |
Household Income in Macomb County
Household Income Brackets in Macomb County
With 65,182 households falling in the category, the $100,000 to $149,999 income range is the most frequent in Macomb County, accounting for 18.4% of all households. In contrast, only 10,982 households (3.1%) fall into the $10,000 to $14,999 income bracket, making it the least populous group.
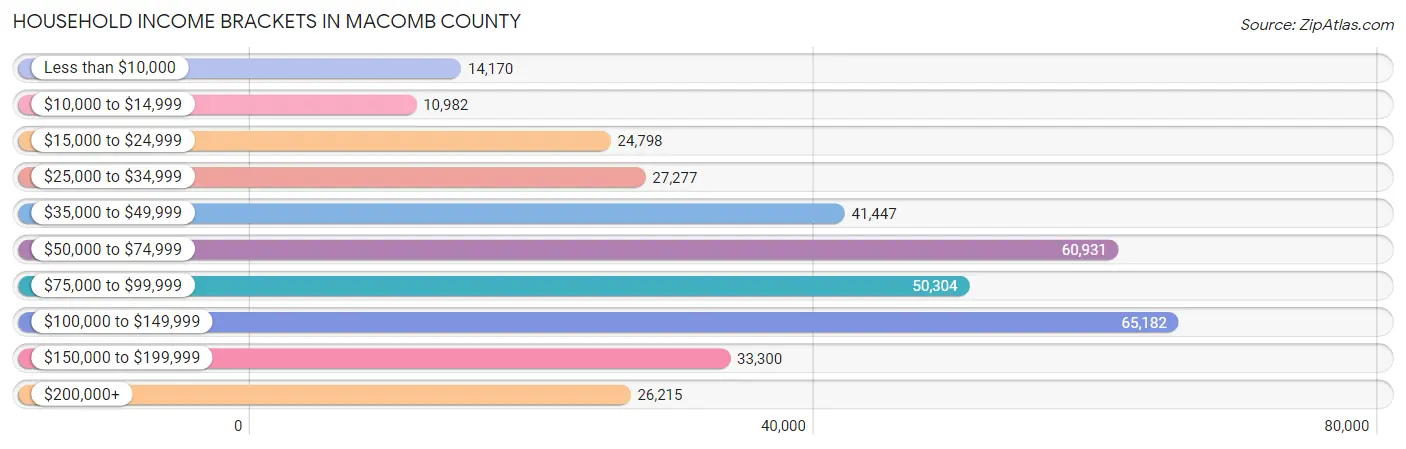
| Income Bracket | # Households | % Households |
| Less than $10,000 | 14,170 | 4.0% |
| $10,000 to $14,999 | 10,982 | 3.1% |
| $15,000 to $24,999 | 24,798 | 7.0% |
| $25,000 to $34,999 | 27,277 | 7.7% |
| $35,000 to $49,999 | 41,447 | 11.7% |
| $50,000 to $74,999 | 60,931 | 17.2% |
| $75,000 to $99,999 | 50,304 | 14.2% |
| $100,000 to $149,999 | 65,182 | 18.4% |
| $150,000 to $199,999 | 33,300 | 9.4% |
| $200,000+ | 26,215 | 7.4% |
Household Income by Householder Age in Macomb County
The median household income in Macomb County is $73,876, with the highest median household income of $90,333 found in the 45 to 64 years age bracket for the primary householder. A total of 140,854 households (39.8%) fall into this category. Meanwhile, the 15 to 24 years age bracket for the primary householder has the lowest median household income of $49,322, with 8,332 households (2.4%) in this group.
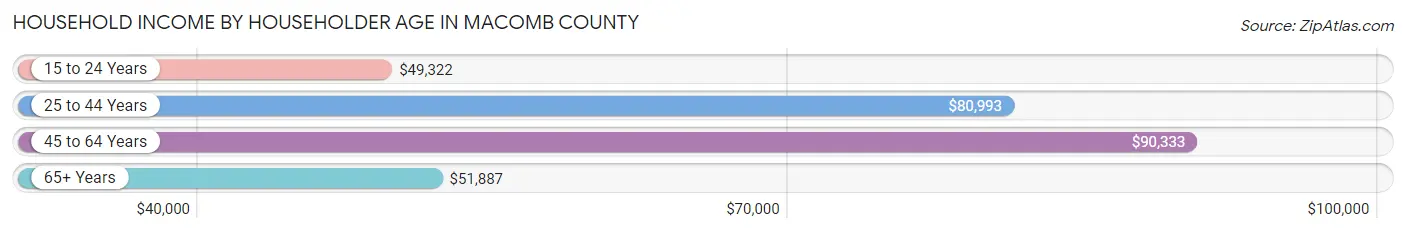
| Income Bracket | # Households | Median Income |
| 15 to 24 Years | 8,332 (2.4%) | $49,322 |
| 25 to 44 Years | 106,612 (30.1%) | $80,993 |
| 45 to 64 Years | 140,854 (39.8%) | $90,333 |
| 65+ Years | 98,453 (27.8%) | $51,887 |
| Total | 354,251 (100.0%) | $73,876 |
Poverty in Macomb County
Income Below Poverty by Sex and Age in Macomb County
With 8.6% poverty level for males and 11.0% for females among the residents of Macomb County, under 5 year old males and under 5 year old females are the most vulnerable to poverty, with 3,850 males (16.2%) and 3,765 females (16.7%) in their respective age groups living below the poverty level.
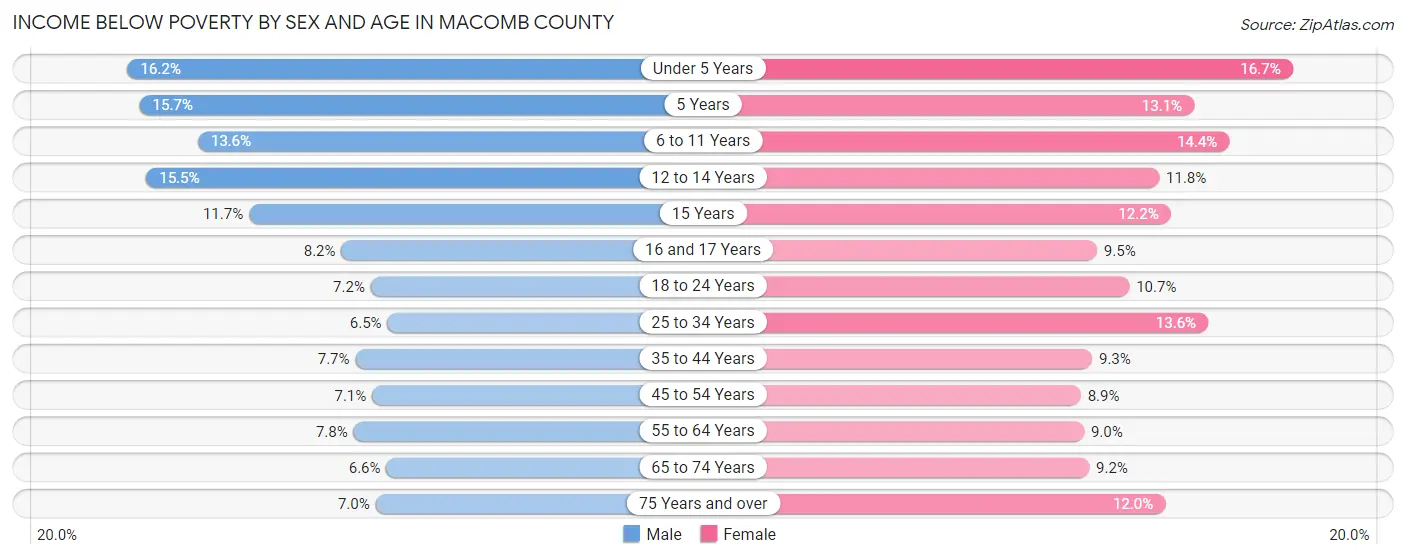
| Age Bracket | Male | Female |
| Under 5 Years | 3,850 (16.2%) | 3,765 (16.7%) |
| 5 Years | 713 (15.7%) | 583 (13.1%) |
| 6 to 11 Years | 4,009 (13.6%) | 4,291 (14.4%) |
| 12 to 14 Years | 2,705 (15.5%) | 1,716 (11.8%) |
| 15 Years | 650 (11.7%) | 599 (12.2%) |
| 16 and 17 Years | 973 (8.2%) | 1,088 (9.5%) |
| 18 to 24 Years | 2,630 (7.1%) | 3,755 (10.7%) |
| 25 to 34 Years | 3,892 (6.5%) | 8,043 (13.6%) |
| 35 to 44 Years | 4,006 (7.7%) | 4,921 (9.3%) |
| 45 to 54 Years | 4,115 (7.1%) | 5,309 (8.9%) |
| 55 to 64 Years | 4,801 (7.8%) | 5,779 (9.0%) |
| 65 to 74 Years | 2,741 (6.6%) | 4,347 (9.2%) |
| 75 Years and over | 1,692 (7.0%) | 4,445 (12.0%) |
| Total | 36,777 (8.6%) | 48,641 (11.0%) |
Income Above Poverty by Sex and Age in Macomb County
According to the poverty statistics in Macomb County, males aged 25 to 34 years and females aged 45 to 54 years are the age groups that are most secure financially, with 93.5% of males and 91.1% of females in these age groups living above the poverty line.
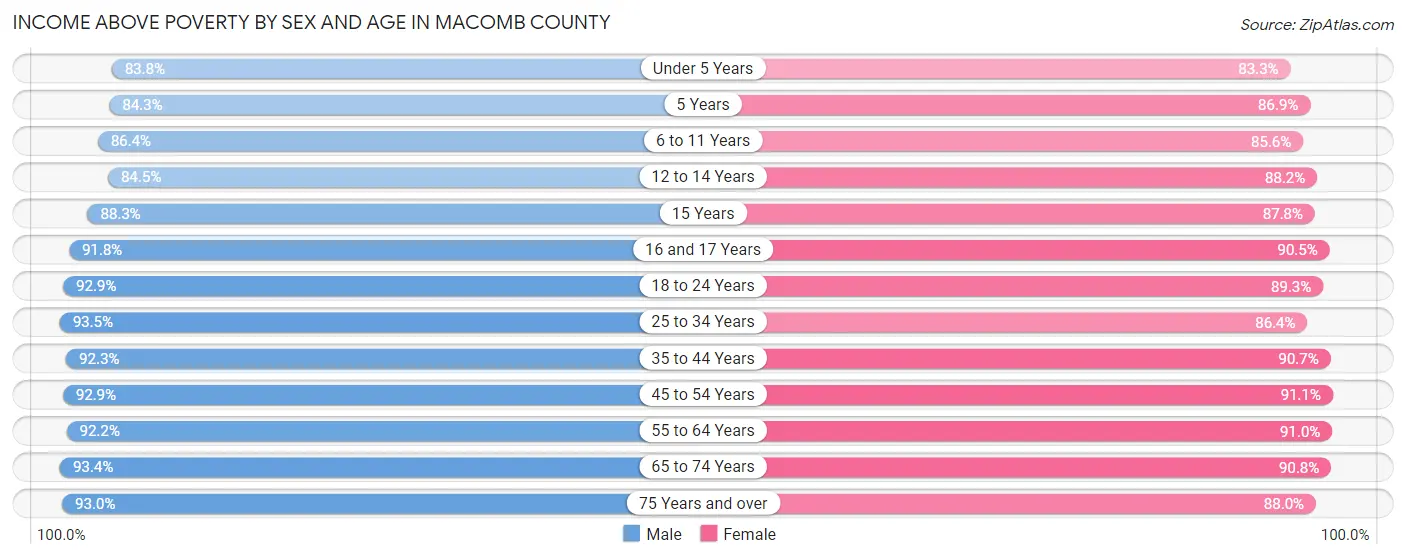
| Age Bracket | Male | Female |
| Under 5 Years | 19,941 (83.8%) | 18,734 (83.3%) |
| 5 Years | 3,820 (84.3%) | 3,878 (86.9%) |
| 6 to 11 Years | 25,544 (86.4%) | 25,555 (85.6%) |
| 12 to 14 Years | 14,766 (84.5%) | 12,848 (88.2%) |
| 15 Years | 4,920 (88.3%) | 4,310 (87.8%) |
| 16 and 17 Years | 10,839 (91.8%) | 10,395 (90.5%) |
| 18 to 24 Years | 34,155 (92.8%) | 31,427 (89.3%) |
| 25 to 34 Years | 55,737 (93.5%) | 51,119 (86.4%) |
| 35 to 44 Years | 47,861 (92.3%) | 48,068 (90.7%) |
| 45 to 54 Years | 53,840 (92.9%) | 54,546 (91.1%) |
| 55 to 64 Years | 56,821 (92.2%) | 58,508 (91.0%) |
| 65 to 74 Years | 38,955 (93.4%) | 42,999 (90.8%) |
| 75 Years and over | 22,594 (93.0%) | 32,601 (88.0%) |
| Total | 389,793 (91.4%) | 394,988 (89.0%) |
Income Below Poverty Among Married-Couple Families in Macomb County
The poverty statistics for married-couple families in Macomb County show that 4.1% or 6,781 of the total 165,314 families live below the poverty line. Families with 5 or more children have the highest poverty rate of 18.4%, comprising of 133 families. On the other hand, families with no children have the lowest poverty rate of 3.1%, which includes 3,085 families.
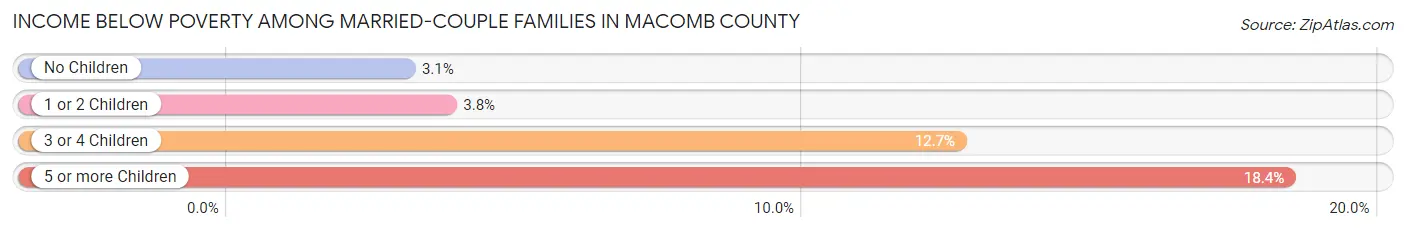
| Children | Above Poverty | Below Poverty |
| No Children | 96,968 (96.9%) | 3,085 (3.1%) |
| 1 or 2 Children | 50,086 (96.2%) | 1,980 (3.8%) |
| 3 or 4 Children | 10,890 (87.3%) | 1,583 (12.7%) |
| 5 or more Children | 589 (81.6%) | 133 (18.4%) |
| Total | 158,533 (95.9%) | 6,781 (4.1%) |
Income Below Poverty Among Single-Parent Households in Macomb County
According to the poverty data in Macomb County, 8.5% or 1,610 single-father households and 19.2% or 8,247 single-mother households are living below the poverty line. Among single-father households, those with 3 or 4 children have the highest poverty rate, with 117 households (15.7%) experiencing poverty. Likewise, among single-mother households, those with 5 or more children have the highest poverty rate, with 151 households (73.0%) falling below the poverty line.
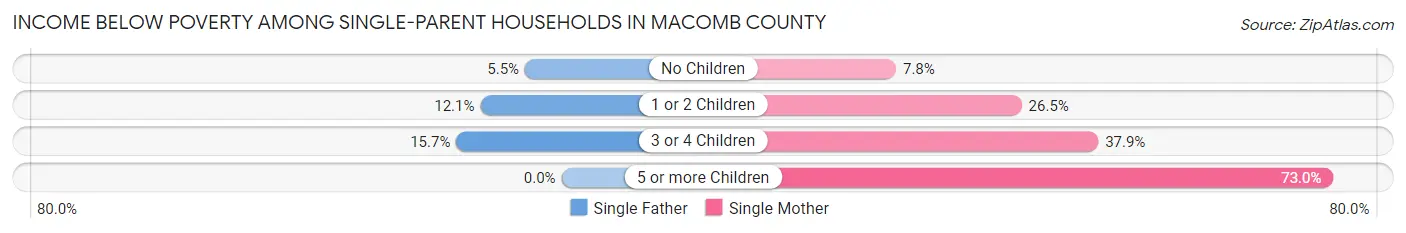
| Children | Single Father | Single Mother |
| No Children | 572 (5.4%) | 1,508 (7.8%) |
| 1 or 2 Children | 921 (12.1%) | 5,432 (26.5%) |
| 3 or 4 Children | 117 (15.7%) | 1,156 (37.9%) |
| 5 or more Children | 0 (0.0%) | 151 (73.0%) |
| Total | 1,610 (8.5%) | 8,247 (19.2%) |
Income Below Poverty Among Married-Couple vs Single-Parent Households in Macomb County
The poverty data for Macomb County shows that 6,781 of the married-couple family households (4.1%) and 9,857 of the single-parent households (15.9%) are living below the poverty level. Within the married-couple family households, those with 5 or more children have the highest poverty rate, with 133 households (18.4%) falling below the poverty line. Among the single-parent households, those with 5 or more children have the highest poverty rate, with 151 household (62.7%) living below poverty.
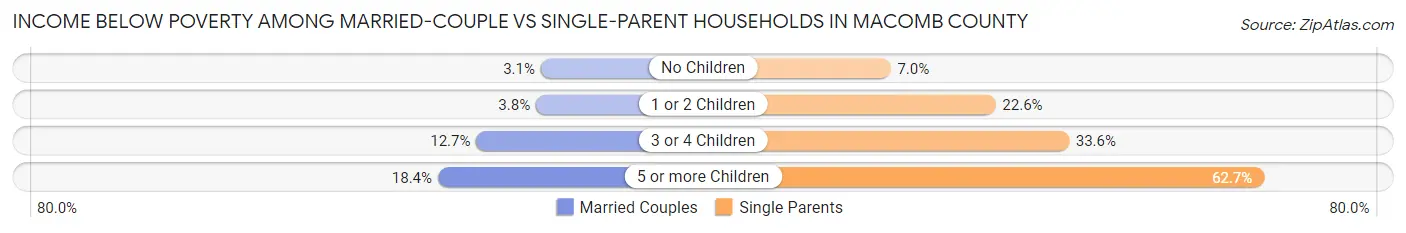
| Children | Married-Couple Families | Single-Parent Households |
| No Children | 3,085 (3.1%) | 2,080 (7.0%) |
| 1 or 2 Children | 1,980 (3.8%) | 6,353 (22.6%) |
| 3 or 4 Children | 1,583 (12.7%) | 1,273 (33.6%) |
| 5 or more Children | 133 (18.4%) | 151 (62.7%) |
| Total | 6,781 (4.1%) | 9,857 (15.9%) |
Race in Macomb County
The most populous races in Macomb County are White / Caucasian (680,537 | 77.5%), Black / African American (108,151 | 12.3%), and Two or more Races (40,084 | 4.6%).
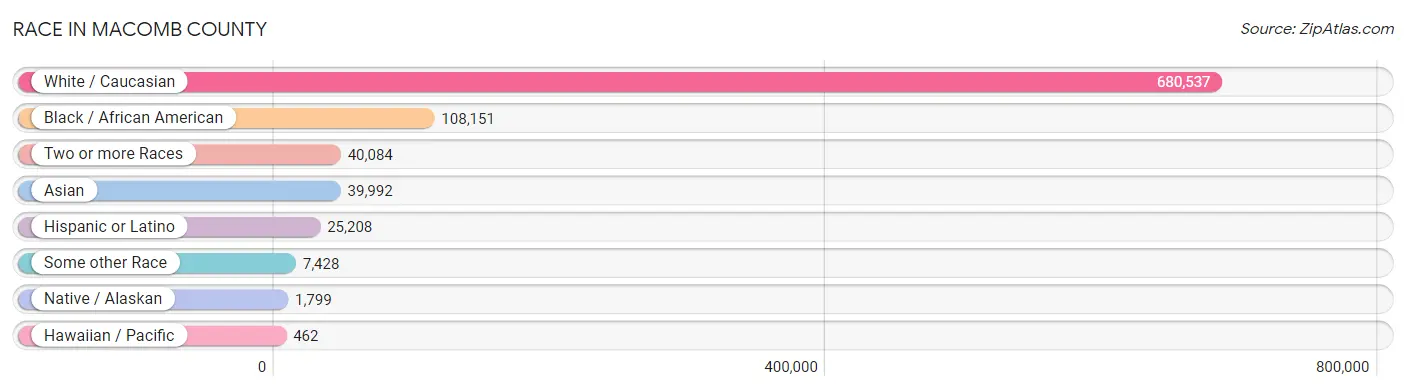
| Race | # Population | % Population |
| Asian | 39,992 | 4.5% |
| Black / African American | 108,151 | 12.3% |
| Hawaiian / Pacific | 462 | 0.1% |
| Hispanic or Latino | 25,208 | 2.9% |
| Native / Alaskan | 1,799 | 0.2% |
| White / Caucasian | 680,537 | 77.5% |
| Two or more Races | 40,084 | 4.6% |
| Some other Race | 7,428 | 0.9% |
| Total | 878,453 | 100.0% |
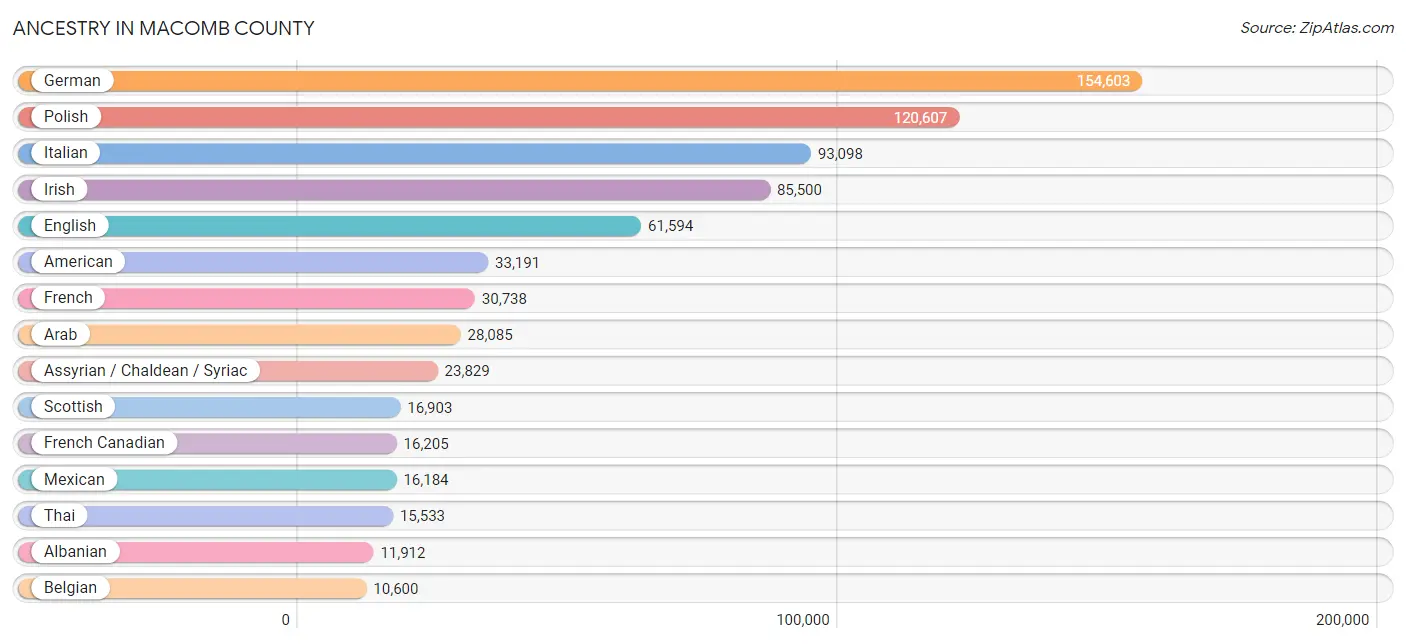
Ancestry in Macomb County
The most populous ancestries reported in Macomb County are German (154,603 | 17.6%), Polish (120,607 | 13.7%), Italian (93,098 | 10.6%), Irish (85,500 | 9.7%), and English (61,594 | 7.0%), together accounting for 58.7% of all Macomb County residents.
| Ancestry | # Population | % Population |
| Afghan | 26 | 0.0% |
| African | 3,847 | 0.4% |
| Albanian | 11,912 | 1.4% |
| Aleut | 5 | 0.0% |
| Alsatian | 57 | 0.0% |
| American | 33,191 | 3.8% |
| Apache | 183 | 0.0% |
| Arab | 28,085 | 3.2% |
| Argentinean | 278 | 0.0% |
| Armenian | 1,739 | 0.2% |
| Assyrian / Chaldean / Syriac | 23,829 | 2.7% |
| Australian | 116 | 0.0% |
| Austrian | 1,786 | 0.2% |
| Bahamian | 72 | 0.0% |
| Bangladeshi | 4,182 | 0.5% |
| Barbadian | 18 | 0.0% |
| Basque | 36 | 0.0% |
| Belgian | 10,600 | 1.2% |
| Bhutanese | 1,492 | 0.2% |
| Blackfeet | 564 | 0.1% |
| Bolivian | 30 | 0.0% |
| Brazilian | 480 | 0.1% |
| British | 3,835 | 0.4% |
| British West Indian | 33 | 0.0% |
| Bulgarian | 364 | 0.0% |
| Burmese | 2,375 | 0.3% |
| Cajun | 8 | 0.0% |
| Canadian | 3,905 | 0.4% |
| Celtic | 229 | 0.0% |
| Central American | 943 | 0.1% |
| Central American Indian | 138 | 0.0% |
| Cherokee | 1,959 | 0.2% |
| Cheyenne | 3 | 0.0% |
| Chickasaw | 24 | 0.0% |
| Chilean | 43 | 0.0% |
| Chippewa | 1,202 | 0.1% |
| Choctaw | 125 | 0.0% |
| Colombian | 641 | 0.1% |
| Comanche | 35 | 0.0% |
| Costa Rican | 186 | 0.0% |
| Cree | 16 | 0.0% |
| Creek | 306 | 0.0% |
| Croatian | 1,792 | 0.2% |
| Crow | 5 | 0.0% |
| Cuban | 806 | 0.1% |
| Czech | 3,201 | 0.4% |
| Czechoslovakian | 883 | 0.1% |
| Danish | 1,926 | 0.2% |
| Delaware | 11 | 0.0% |
| Dominican | 182 | 0.0% |
| Dutch | 9,084 | 1.0% |
| Dutch West Indian | 43 | 0.0% |
| Eastern European | 1,600 | 0.2% |
| Ecuadorian | 267 | 0.0% |
| Egyptian | 648 | 0.1% |
| English | 61,594 | 7.0% |
| Estonian | 10 | 0.0% |
| Ethiopian | 38 | 0.0% |
| European | 9,575 | 1.1% |
| Fijian | 16 | 0.0% |
| Filipino | 416 | 0.1% |
| Finnish | 3,560 | 0.4% |
| French | 30,738 | 3.5% |
| French American Indian | 270 | 0.0% |
| French Canadian | 16,205 | 1.8% |
| German | 154,603 | 17.6% |
| German Russian | 7 | 0.0% |
| Ghanaian | 264 | 0.0% |
| Greek | 6,844 | 0.8% |
| Guamanian / Chamorro | 63 | 0.0% |
| Guatemalan | 112 | 0.0% |
| Guyanese | 22 | 0.0% |
| Haitian | 267 | 0.0% |
| Honduran | 80 | 0.0% |
| Hopi | 23 | 0.0% |
| Hungarian | 5,429 | 0.6% |
| Icelander | 43 | 0.0% |
| Indian (Asian) | 4,700 | 0.5% |
| Indonesian | 87 | 0.0% |
| Iranian | 214 | 0.0% |
| Iraqi | 10,524 | 1.2% |
| Irish | 85,500 | 9.7% |
| Iroquois | 466 | 0.1% |
| Israeli | 144 | 0.0% |
| Italian | 93,098 | 10.6% |
| Jamaican | 658 | 0.1% |
| Japanese | 379 | 0.0% |
| Jordanian | 901 | 0.1% |
| Kenyan | 189 | 0.0% |
| Korean | 6,627 | 0.7% |
| Laotian | 13 | 0.0% |
| Latvian | 45 | 0.0% |
| Lebanese | 6,929 | 0.8% |
| Liberian | 62 | 0.0% |
| Lithuanian | 2,467 | 0.3% |
| Lumbee | 153 | 0.0% |
| Luxembourger | 101 | 0.0% |
| Macedonian | 5,784 | 0.7% |
| Malaysian | 516 | 0.1% |
| Maltese | 1,131 | 0.1% |
| Mexican | 16,184 | 1.8% |
| Mexican American Indian | 228 | 0.0% |
| Mongolian | 14 | 0.0% |
| Moroccan | 84 | 0.0% |
| Native Hawaiian | 399 | 0.1% |
| Navajo | 71 | 0.0% |
| New Zealander | 8 | 0.0% |
| Nicaraguan | 91 | 0.0% |
| Nigerian | 491 | 0.1% |
| Northern European | 612 | 0.1% |
| Norwegian | 4,001 | 0.5% |
| Osage | 22 | 0.0% |
| Ottawa | 114 | 0.0% |
| Pakistani | 545 | 0.1% |
| Palestinian | 387 | 0.0% |
| Panamanian | 174 | 0.0% |
| Pennsylvania German | 96 | 0.0% |
| Peruvian | 222 | 0.0% |
| Polish | 120,607 | 13.7% |
| Portuguese | 475 | 0.1% |
| Potawatomi | 193 | 0.0% |
| Pueblo | 23 | 0.0% |
| Puerto Rican | 2,828 | 0.3% |
| Romanian | 4,381 | 0.5% |
| Russian | 5,291 | 0.6% |
| Salvadoran | 300 | 0.0% |
| Samoan | 135 | 0.0% |
| Scandinavian | 1,305 | 0.2% |
| Scotch-Irish | 4,968 | 0.6% |
| Scottish | 16,903 | 1.9% |
| Seminole | 117 | 0.0% |
| Senegalese | 60 | 0.0% |
| Serbian | 3,023 | 0.3% |
| Sioux | 260 | 0.0% |
| Slavic | 760 | 0.1% |
| Slovak | 3,116 | 0.4% |
| Slovene | 459 | 0.1% |
| South African | 30 | 0.0% |
| South American | 1,744 | 0.2% |
| South American Indian | 9 | 0.0% |
| Soviet Union | 16 | 0.0% |
| Spaniard | 945 | 0.1% |
| Spanish | 349 | 0.0% |
| Spanish American | 9 | 0.0% |
| Sri Lankan | 2,794 | 0.3% |
| Subsaharan African | 5,287 | 0.6% |
| Sudanese | 7 | 0.0% |
| Swedish | 6,022 | 0.7% |
| Swiss | 741 | 0.1% |
| Syrian | 2,061 | 0.2% |
| Thai | 15,533 | 1.8% |
| Trinidadian and Tobagonian | 16 | 0.0% |
| Turkish | 285 | 0.0% |
| Ukrainian | 6,034 | 0.7% |
| Uruguayan | 3 | 0.0% |
| Ute | 1 | 0.0% |
| Venezuelan | 260 | 0.0% |
| Vietnamese | 4,770 | 0.5% |
| Welsh | 3,587 | 0.4% |
| West Indian | 86 | 0.0% |
| Yaqui | 6 | 0.0% |
| Yugoslavian | 4,659 | 0.5% | View All 162 Rows |
Immigrants in Macomb County
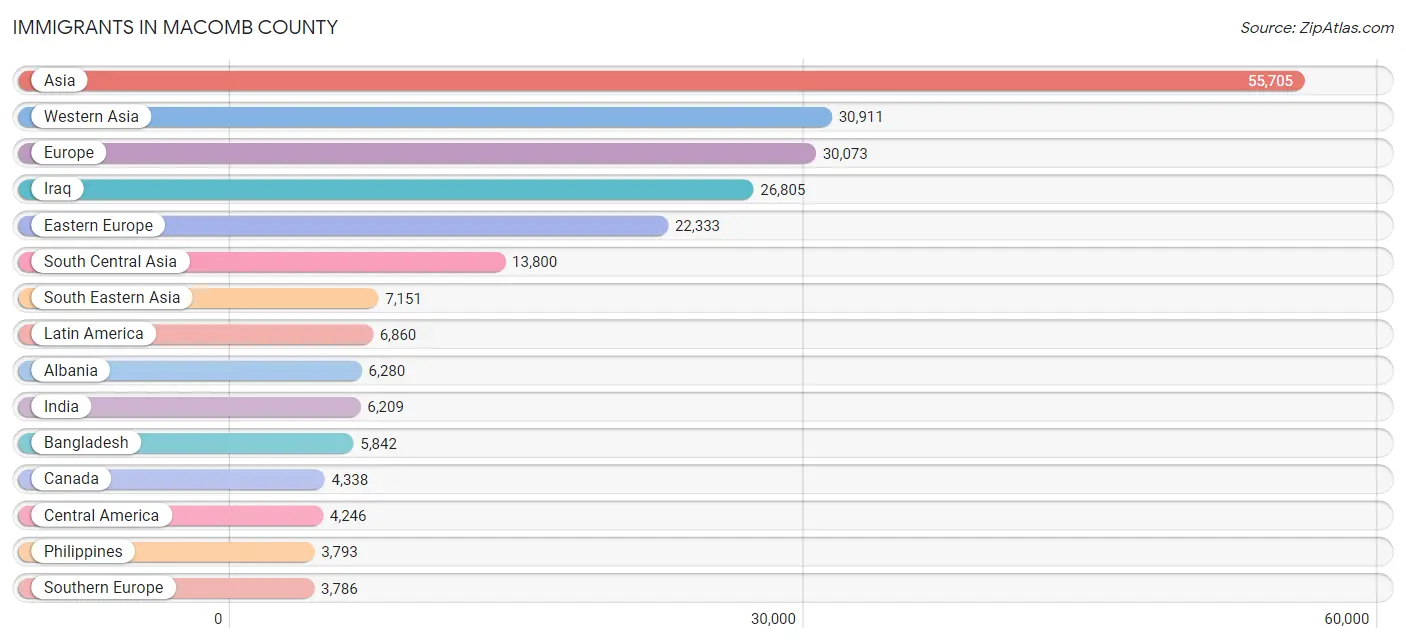
The most numerous immigrant groups reported in Macomb County came from Asia (55,705 | 6.3%), Western Asia (30,911 | 3.5%), Europe (30,073 | 3.4%), Iraq (26,805 | 3.0%), and Eastern Europe (22,333 | 2.5%), together accounting for 18.9% of all Macomb County residents.
| Immigration Origin | # Population | % Population |
| Africa | 1,998 | 0.2% |
| Albania | 6,280 | 0.7% |
| Argentina | 59 | 0.0% |
| Armenia | 50 | 0.0% |
| Asia | 55,705 | 6.3% |
| Australia | 57 | 0.0% |
| Austria | 230 | 0.0% |
| Bangladesh | 5,842 | 0.7% |
| Belarus | 9 | 0.0% |
| Belgium | 67 | 0.0% |
| Bosnia and Herzegovina | 2,289 | 0.3% |
| Brazil | 632 | 0.1% |
| Bulgaria | 246 | 0.0% |
| Cambodia | 146 | 0.0% |
| Cameroon | 39 | 0.0% |
| Canada | 4,338 | 0.5% |
| Caribbean | 889 | 0.1% |
| Central America | 4,246 | 0.5% |
| Chile | 28 | 0.0% |
| China | 2,122 | 0.2% |
| Colombia | 450 | 0.1% |
| Costa Rica | 107 | 0.0% |
| Croatia | 192 | 0.0% |
| Cuba | 250 | 0.0% |
| Czechoslovakia | 226 | 0.0% |
| Denmark | 44 | 0.0% |
| Dominican Republic | 64 | 0.0% |
| Eastern Africa | 302 | 0.0% |
| Eastern Asia | 3,773 | 0.4% |
| Eastern Europe | 22,333 | 2.5% |
| Ecuador | 246 | 0.0% |
| Egypt | 656 | 0.1% |
| El Salvador | 152 | 0.0% |
| England | 343 | 0.0% |
| Ethiopia | 10 | 0.0% |
| Europe | 30,073 | 3.4% |
| Fiji | 8 | 0.0% |
| France | 262 | 0.0% |
| Germany | 2,036 | 0.2% |
| Ghana | 54 | 0.0% |
| Greece | 731 | 0.1% |
| Guatemala | 77 | 0.0% |
| Guyana | 63 | 0.0% |
| Haiti | 108 | 0.0% |
| Honduras | 20 | 0.0% |
| Hong Kong | 162 | 0.0% |
| Hungary | 244 | 0.0% |
| India | 6,209 | 0.7% |
| Indonesia | 36 | 0.0% |
| Iran | 193 | 0.0% |
| Iraq | 26,805 | 3.0% |
| Ireland | 128 | 0.0% |
| Israel | 97 | 0.0% |
| Italy | 2,860 | 0.3% |
| Jamaica | 340 | 0.0% |
| Japan | 215 | 0.0% |
| Jordan | 819 | 0.1% |
| Kazakhstan | 6 | 0.0% |
| Kenya | 223 | 0.0% |
| Korea | 1,421 | 0.2% |
| Kuwait | 159 | 0.0% |
| Laos | 1,056 | 0.1% |
| Latin America | 6,860 | 0.8% |
| Latvia | 25 | 0.0% |
| Lebanon | 1,497 | 0.2% |
| Liberia | 38 | 0.0% |
| Lithuania | 191 | 0.0% |
| Malaysia | 104 | 0.0% |
| Mexico | 3,634 | 0.4% |
| Micronesia | 214 | 0.0% |
| Middle Africa | 61 | 0.0% |
| Moldova | 60 | 0.0% |
| Morocco | 61 | 0.0% |
| Nepal | 89 | 0.0% |
| Netherlands | 41 | 0.0% |
| Nicaragua | 156 | 0.0% |
| Nigeria | 265 | 0.0% |
| North Macedonia | 2,138 | 0.2% |
| Northern Africa | 904 | 0.1% |
| Northern Europe | 1,135 | 0.1% |
| Oceania | 310 | 0.0% |
| Pakistan | 1,408 | 0.2% |
| Panama | 100 | 0.0% |
| Peru | 43 | 0.0% |
| Philippines | 3,793 | 0.4% |
| Poland | 3,669 | 0.4% |
| Romania | 1,724 | 0.2% |
| Russia | 316 | 0.0% |
| Saudi Arabia | 80 | 0.0% |
| Scotland | 186 | 0.0% |
| Senegal | 103 | 0.0% |
| Serbia | 502 | 0.1% |
| Singapore | 14 | 0.0% |
| South Africa | 96 | 0.0% |
| South America | 1,725 | 0.2% |
| South Central Asia | 13,800 | 1.6% |
| South Eastern Asia | 7,151 | 0.8% |
| Southern Europe | 3,786 | 0.4% |
| Spain | 77 | 0.0% |
| Sri Lanka | 31 | 0.0% |
| Sudan | 21 | 0.0% |
| Sweden | 11 | 0.0% |
| Switzerland | 79 | 0.0% |
| Syria | 932 | 0.1% |
| Taiwan | 177 | 0.0% |
| Thailand | 418 | 0.1% |
| Trinidad and Tobago | 34 | 0.0% |
| Turkey | 245 | 0.0% |
| Ukraine | 1,371 | 0.2% |
| Uruguay | 38 | 0.0% |
| Uzbekistan | 22 | 0.0% |
| Venezuela | 166 | 0.0% |
| Vietnam | 1,513 | 0.2% |
| Western Africa | 469 | 0.1% |
| Western Asia | 30,911 | 3.5% |
| Western Europe | 2,715 | 0.3% |
| Yemen | 154 | 0.0% |
| Zaire | 6 | 0.0% |
| Zimbabwe | 7 | 0.0% | View All 119 Rows |
Sex and Age in Macomb County
Sex and Age in Macomb County
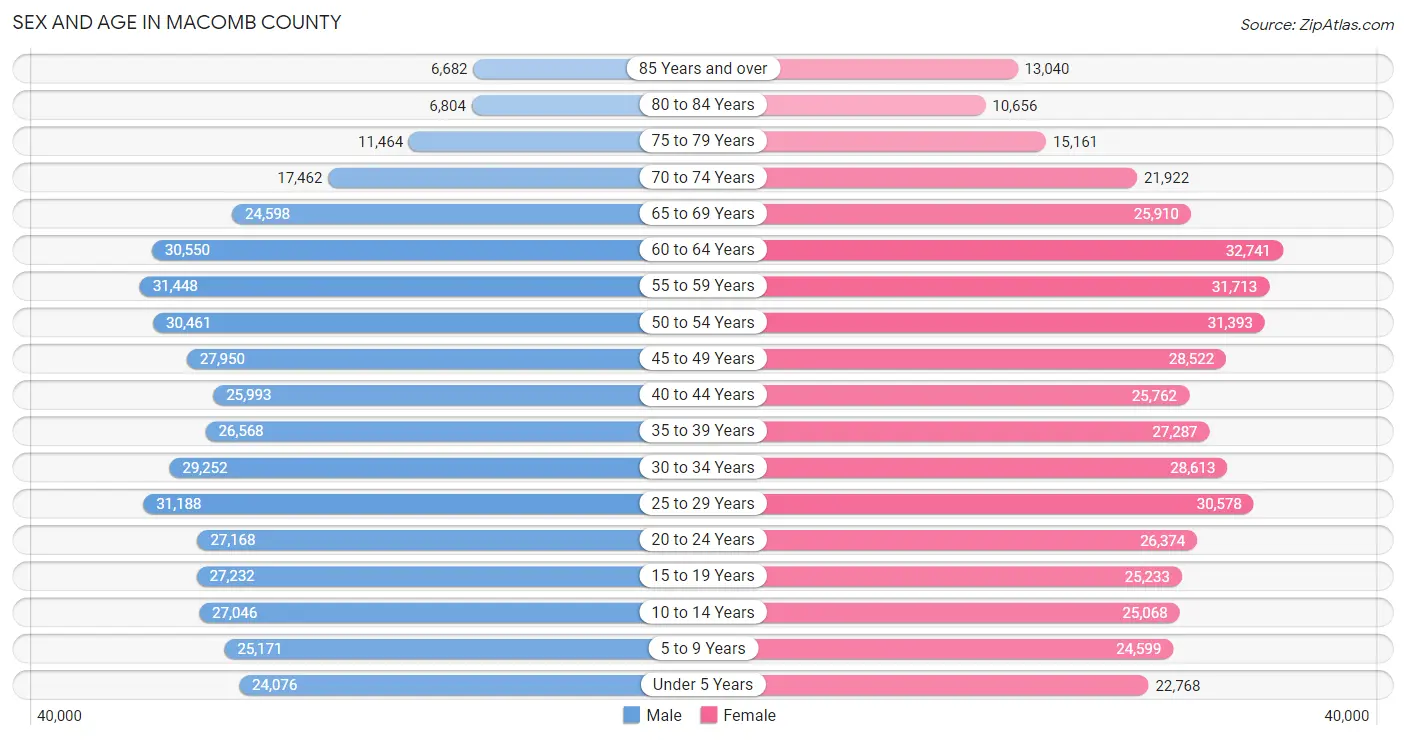
The most populous age groups in Macomb County are 55 to 59 Years (31,448 | 7.3%) for men and 60 to 64 Years (32,741 | 7.3%) for women.
| Age Bracket | Male | Female |
| Under 5 Years | 24,076 (5.6%) | 22,768 (5.1%) |
| 5 to 9 Years | 25,171 (5.8%) | 24,599 (5.5%) |
| 10 to 14 Years | 27,046 (6.3%) | 25,068 (5.6%) |
| 15 to 19 Years | 27,232 (6.3%) | 25,233 (5.6%) |
| 20 to 24 Years | 27,168 (6.3%) | 26,374 (5.9%) |
| 25 to 29 Years | 31,188 (7.2%) | 30,578 (6.8%) |
| 30 to 34 Years | 29,252 (6.8%) | 28,613 (6.4%) |
| 35 to 39 Years | 26,568 (6.2%) | 27,287 (6.1%) |
| 40 to 44 Years | 25,993 (6.0%) | 25,762 (5.8%) |
| 45 to 49 Years | 27,950 (6.5%) | 28,522 (6.4%) |
| 50 to 54 Years | 30,461 (7.1%) | 31,393 (7.0%) |
| 55 to 59 Years | 31,448 (7.3%) | 31,713 (7.1%) |
| 60 to 64 Years | 30,550 (7.1%) | 32,741 (7.3%) |
| 65 to 69 Years | 24,598 (5.7%) | 25,910 (5.8%) |
| 70 to 74 Years | 17,462 (4.1%) | 21,922 (4.9%) |
| 75 to 79 Years | 11,464 (2.7%) | 15,161 (3.4%) |
| 80 to 84 Years | 6,804 (1.6%) | 10,656 (2.4%) |
| 85 Years and over | 6,682 (1.5%) | 13,040 (2.9%) |
| Total | 431,113 (100.0%) | 447,340 (100.0%) |
Families and Households in Macomb County
Median Family Size in Macomb County
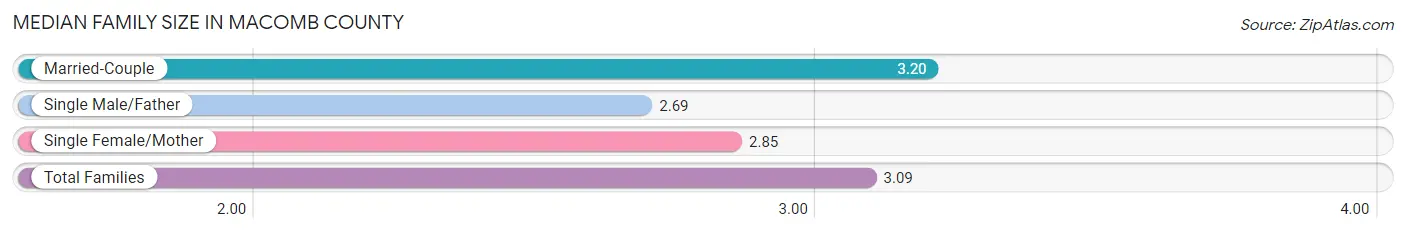
The median family size in Macomb County is 3.09 persons per family, with married-couple families (165,314 | 72.7%) accounting for the largest median family size of 3.2 persons per family. On the other hand, single male/father families (18,903 | 8.3%) represent the smallest median family size with 2.69 persons per family.
| Family Type | # Families | Family Size |
| Married-Couple | 165,314 (72.7%) | 3.20 |
| Single Male/Father | 18,903 (8.3%) | 2.69 |
| Single Female/Mother | 43,072 (19.0%) | 2.85 |
| Total Families | 227,289 (100.0%) | 3.09 |
Median Household Size in Macomb County
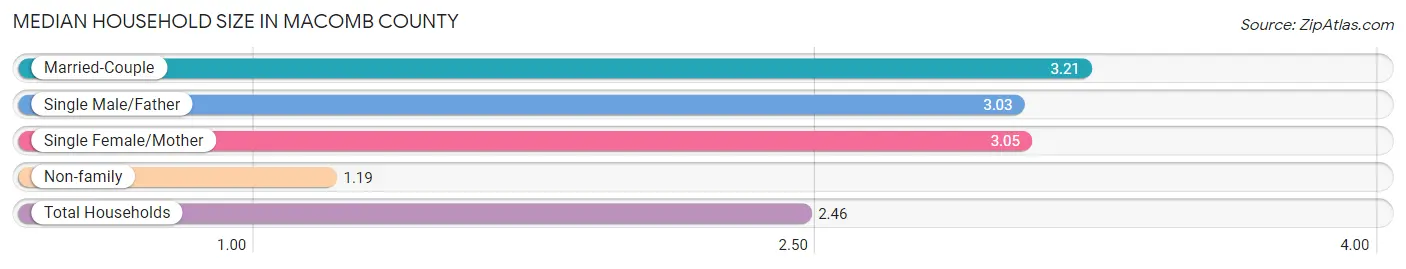
The median household size in Macomb County is 2.46 persons per household, with married-couple households (165,314 | 46.7%) accounting for the largest median household size of 3.21 persons per household. non-family households (126,962 | 35.8%) represent the smallest median household size with 1.19 persons per household.
| Household Type | # Households | Household Size |
| Married-Couple | 165,314 (46.7%) | 3.21 |
| Single Male/Father | 18,903 (5.3%) | 3.03 |
| Single Female/Mother | 43,072 (12.2%) | 3.05 |
| Non-family | 126,962 (35.8%) | 1.19 |
| Total Households | 354,251 (100.0%) | 2.46 |
Household Size by Marriage Status in Macomb County
Out of a total of 354,251 households in Macomb County, 227,289 (64.2%) are family households, while 126,962 (35.8%) are nonfamily households. The most numerous type of family households are 2-person households, comprising 98,415, and the most common type of nonfamily households are 1-person households, comprising 106,672.
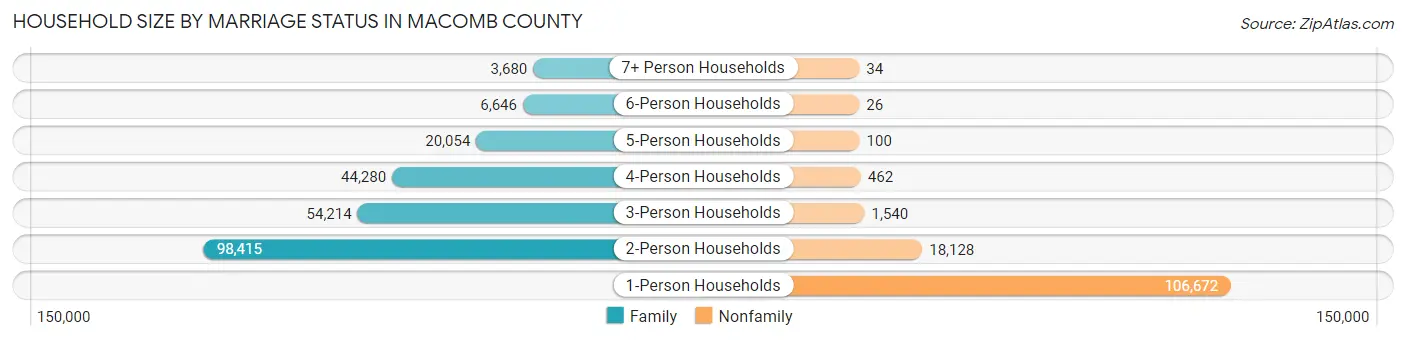
| Household Size | Family Households | Nonfamily Households |
| 1-Person Households | - | 106,672 (30.1%) |
| 2-Person Households | 98,415 (27.8%) | 18,128 (5.1%) |
| 3-Person Households | 54,214 (15.3%) | 1,540 (0.4%) |
| 4-Person Households | 44,280 (12.5%) | 462 (0.1%) |
| 5-Person Households | 20,054 (5.7%) | 100 (0.0%) |
| 6-Person Households | 6,646 (1.9%) | 26 (0.0%) |
| 7+ Person Households | 3,680 (1.0%) | 34 (0.0%) |
| Total | 227,289 (64.2%) | 126,962 (35.8%) |
Female Fertility in Macomb County
Fertility by Age in Macomb County
Average fertility rate in Macomb County is 52.0 births per 1,000 women. Women in the age bracket of 20 to 34 years have the highest fertility rate with 91.0 births per 1,000 women. Women in the age bracket of 20 to 34 years acount for 75.9% of all women with births.
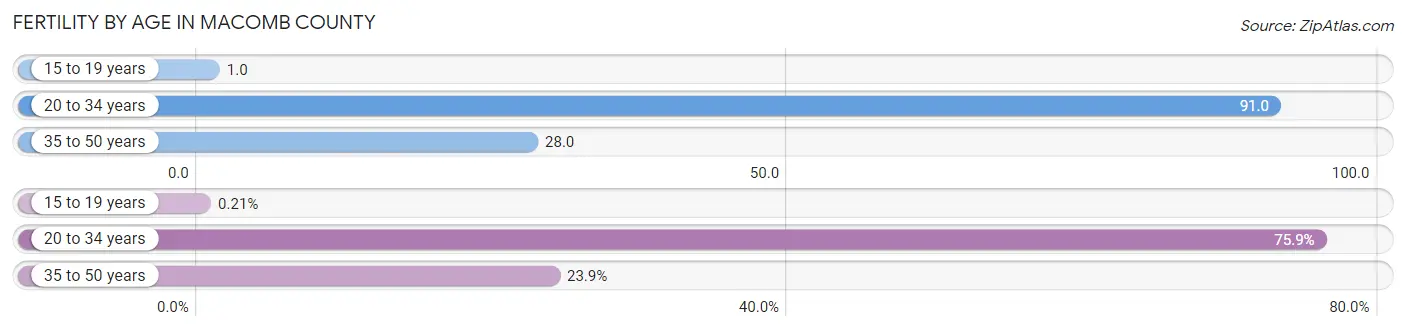
| Age Bracket | Women with Births | Births / 1,000 Women |
| 15 to 19 years | 21 (0.2%) | 1.0 |
| 20 to 34 years | 7,761 (75.9%) | 91.0 |
| 35 to 50 years | 2,443 (23.9%) | 28.0 |
| Total | 10,225 (100.0%) | 52.0 |
Fertility by Age by Marriage Status in Macomb County
75.6% of women with births (10,225) in Macomb County are married. The highest percentage of unmarried women with births falls into 15 to 19 years age bracket with 100.0% of them unmarried at the time of birth, while the lowest percentage of unmarried women with births belong to 35 to 50 years age bracket with 19.1% of them unmarried.
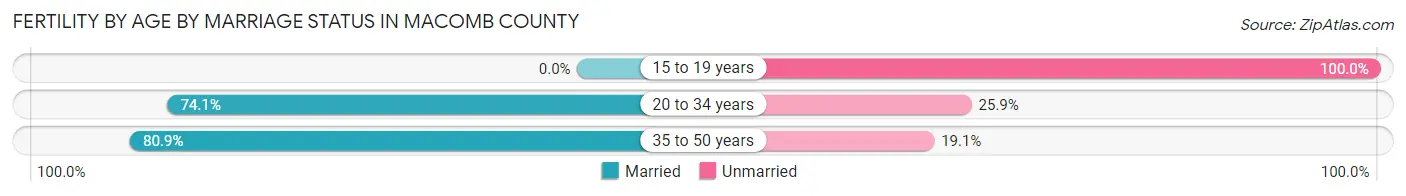
| Age Bracket | Married | Unmarried |
| 15 to 19 years | 0 (0.0%) | 21 (100.0%) |
| 20 to 34 years | 5,751 (74.1%) | 2,010 (25.9%) |
| 35 to 50 years | 1,976 (80.9%) | 467 (19.1%) |
| Total | 7,730 (75.6%) | 2,495 (24.4%) |
Fertility by Education in Macomb County
Average fertility rate in Macomb County is 52.0 births per 1,000 women. Women with the education attainment of graduate degree have the highest fertility rate of 75.0 births per 1,000 women, while women with the education attainment of less than high school have the lowest fertility at 28.0 births per 1,000 women. Women with the education attainment of college or associate's degree represent 33.0% of all women with births.
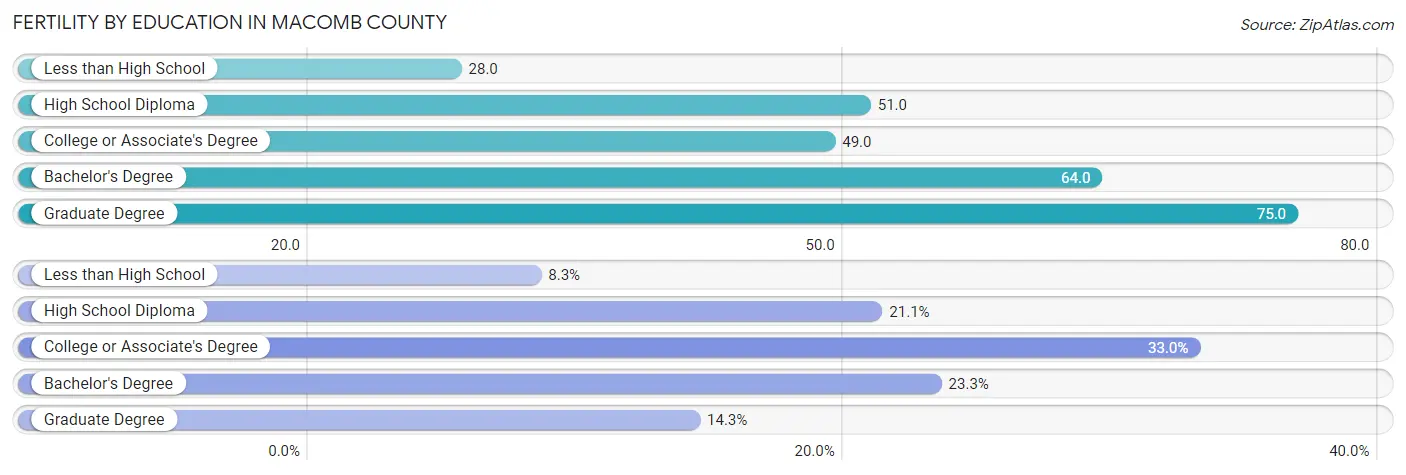
| Educational Attainment | Women with Births | Births / 1,000 Women |
| Less than High School | 851 (8.3%) | 28.0 |
| High School Diploma | 2,157 (21.1%) | 51.0 |
| College or Associate's Degree | 3,374 (33.0%) | 49.0 |
| Bachelor's Degree | 2,384 (23.3%) | 64.0 |
| Graduate Degree | 1,459 (14.3%) | 75.0 |
| Total | 10,225 (100.0%) | 52.0 |
Fertility by Education by Marriage Status in Macomb County
24.4% of women with births in Macomb County are unmarried. Women with the educational attainment of graduate degree are most likely to be married with 91.6% of them married at childbirth, while women with the educational attainment of less than high school are least likely to be married with 47.1% of them unmarried at childbirth.
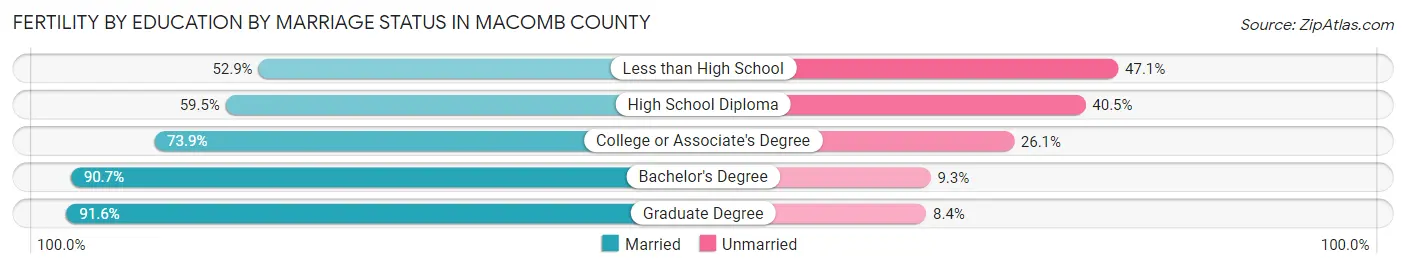
| Educational Attainment | Married | Unmarried |
| Less than High School | 450 (52.9%) | 401 (47.1%) |
| High School Diploma | 1,283 (59.5%) | 874 (40.5%) |
| College or Associate's Degree | 2,493 (73.9%) | 881 (26.1%) |
| Bachelor's Degree | 2,162 (90.7%) | 222 (9.3%) |
| Graduate Degree | 1,336 (91.6%) | 123 (8.4%) |
| Total | 7,730 (75.6%) | 2,495 (24.4%) |
Employment Characteristics in Macomb County
Employment by Class of Employer in Macomb County
Among the 422,678 employed individuals in Macomb County, private company employees (317,156 | 75.0%), not-for-profit organizations (33,733 | 8.0%), and local government employees (22,818 | 5.4%) make up the most common classes of employment.
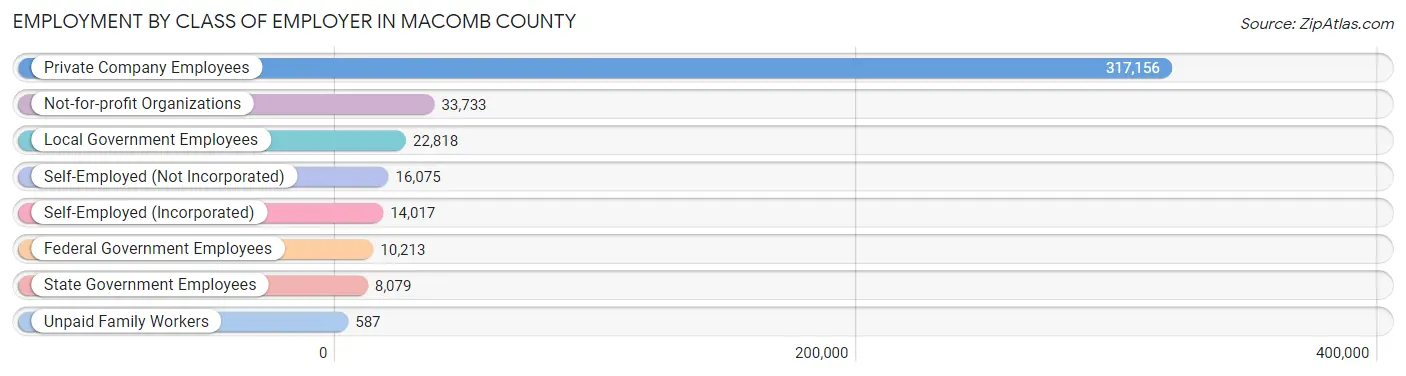
| Employer Class | # Employees | % Employees |
| Private Company Employees | 317,156 | 75.0% |
| Self-Employed (Incorporated) | 14,017 | 3.3% |
| Self-Employed (Not Incorporated) | 16,075 | 3.8% |
| Not-for-profit Organizations | 33,733 | 8.0% |
| Local Government Employees | 22,818 | 5.4% |
| State Government Employees | 8,079 | 1.9% |
| Federal Government Employees | 10,213 | 2.4% |
| Unpaid Family Workers | 587 | 0.1% |
| Total | 422,678 | 100.0% |
Employment Status by Age in Macomb County
According to the labor force statistics for Macomb County, out of the total population over 16 years of age (719,240), 64.0% or 460,314 individuals are in the labor force, with 5.7% or 26,238 of them unemployed. The age group with the highest labor force participation rate is 25 to 29 years, with 85.5% or 52,810 individuals in the labor force. Within the labor force, the 16 to 19 years age range has the highest percentage of unemployed individuals, with 17.9% or 3,667 of them being unemployed.
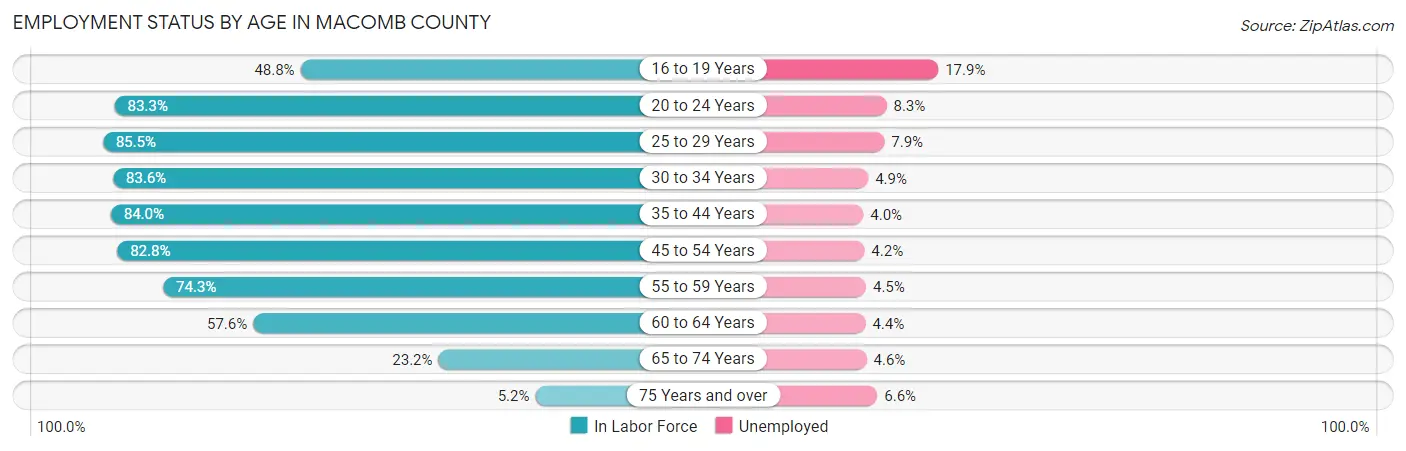
| Age Bracket | In Labor Force | Unemployed |
| 16 to 19 Years | 20,486 (48.8%) | 3,667 (17.9%) |
| 20 to 24 Years | 44,600 (83.3%) | 3,702 (8.3%) |
| 25 to 29 Years | 52,810 (85.5%) | 4,172 (7.9%) |
| 30 to 34 Years | 48,375 (83.6%) | 2,370 (4.9%) |
| 35 to 44 Years | 88,712 (84.0%) | 3,548 (4.0%) |
| 45 to 54 Years | 97,974 (82.8%) | 4,115 (4.2%) |
| 55 to 59 Years | 46,929 (74.3%) | 2,112 (4.5%) |
| 60 to 64 Years | 36,456 (57.6%) | 1,604 (4.4%) |
| 65 to 74 Years | 20,855 (23.2%) | 959 (4.6%) |
| 75 Years and over | 3,318 (5.2%) | 219 (6.6%) |
| Total | 460,314 (64.0%) | 26,238 (5.7%) |
Employment Status by Educational Attainment in Macomb County
According to labor force statistics for Macomb County, 79.0% of individuals (371,315) out of the total population between 25 and 64 years of age (470,019) are in the labor force, with 4.8% or 17,823 of them being unemployed. The group with the highest labor force participation rate are those with the educational attainment of bachelor's degree or higher, with 87.8% or 119,915 individuals in the labor force. Within the labor force, individuals with less than high school education have the highest percentage of unemployment, with 9.7% or 2,288 of them being unemployed.
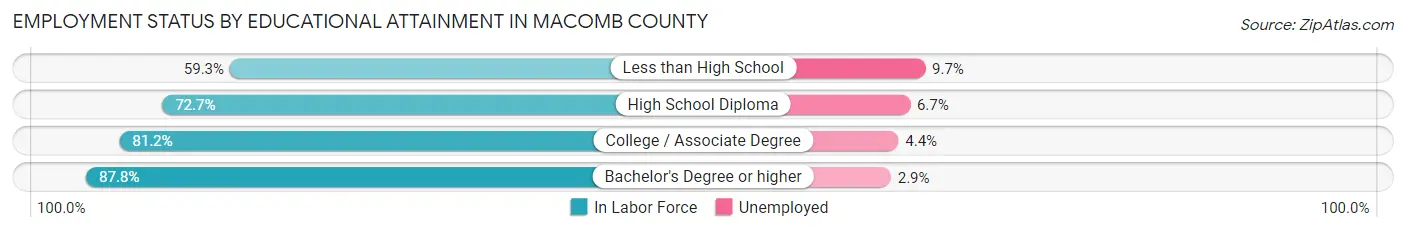
| Educational Attainment | In Labor Force | Unemployed |
| Less than High School | 23,588 (59.3%) | 3,858 (9.7%) |
| High School Diploma | 91,336 (72.7%) | 8,417 (6.7%) |
| College / Associate Degree | 136,441 (81.2%) | 7,393 (4.4%) |
| Bachelor's Degree or higher | 119,915 (87.8%) | 3,961 (2.9%) |
| Total | 371,315 (79.0%) | 22,561 (4.8%) |
Employment Occupations by Sex in Macomb County
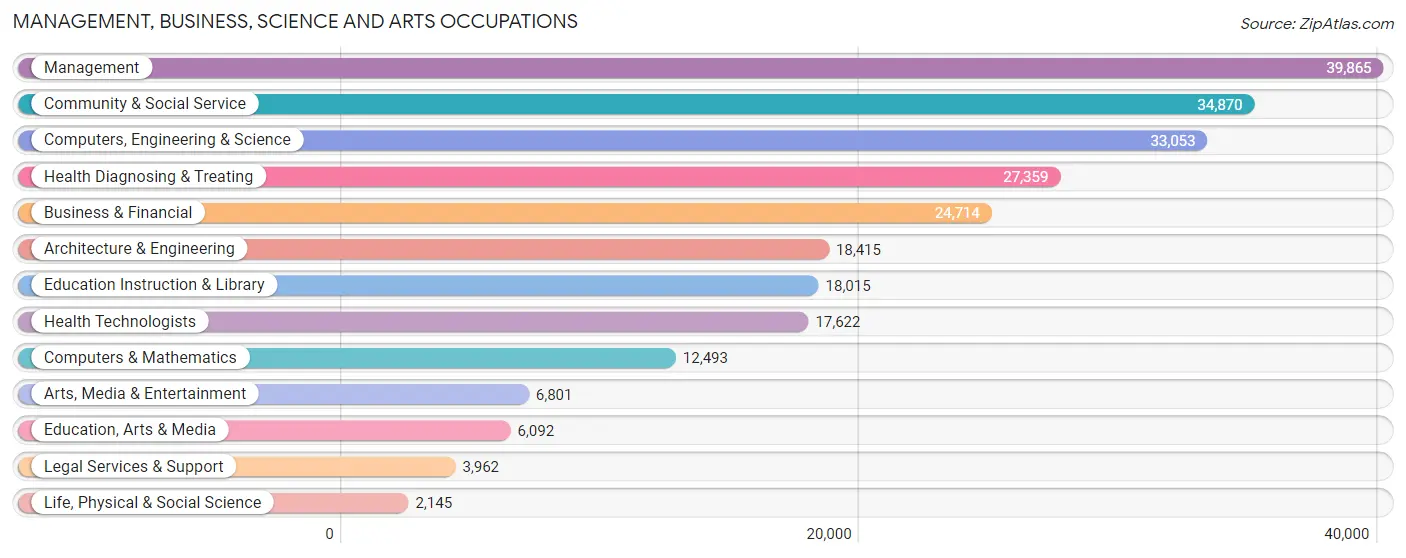
Management, Business, Science and Arts Occupations
The most common Management, Business, Science and Arts occupations in Macomb County are Management (39,865 | 9.2%), Community & Social Service (34,870 | 8.1%), Computers, Engineering & Science (33,053 | 7.6%), Health Diagnosing & Treating (27,359 | 6.3%), and Business & Financial (24,714 | 5.7%).
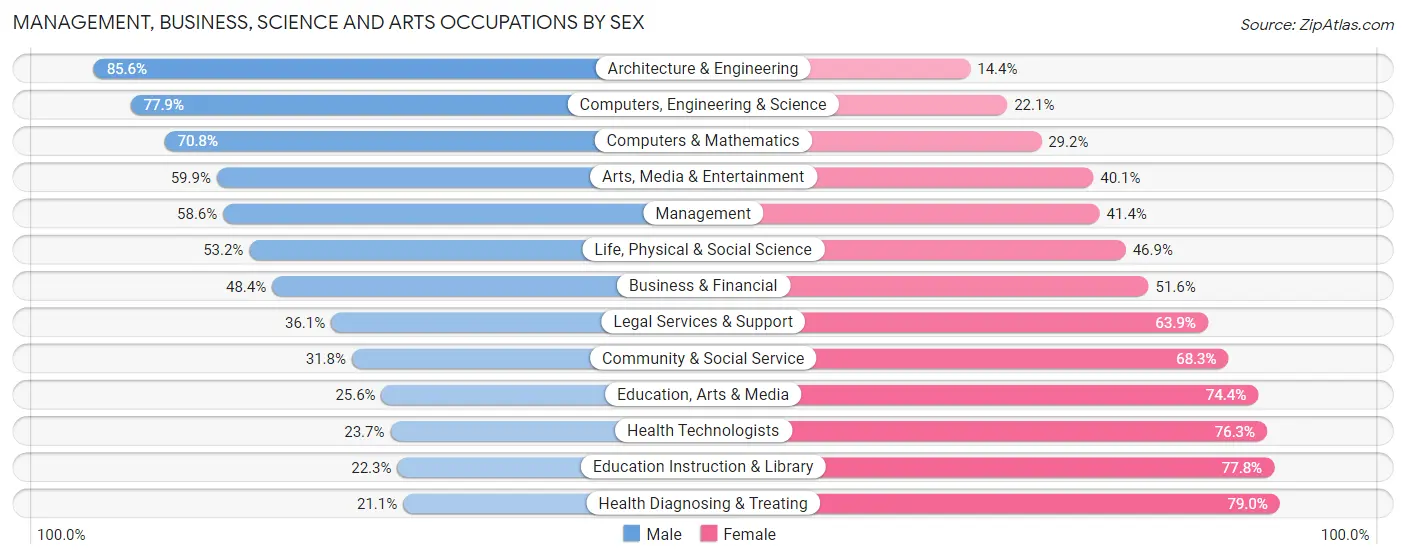
Management, Business, Science and Arts Occupations by Sex
Within the Management, Business, Science and Arts occupations in Macomb County, the most male-oriented occupations are Architecture & Engineering (85.6%), Computers, Engineering & Science (77.9%), and Computers & Mathematics (70.8%), while the most female-oriented occupations are Health Diagnosing & Treating (78.9%), Education Instruction & Library (77.7%), and Health Technologists (76.3%).
| Occupation | Male | Female |
| Management | 23,356 (58.6%) | 16,509 (41.4%) |
| Business & Financial | 11,958 (48.4%) | 12,756 (51.6%) |
| Computers, Engineering & Science | 25,742 (77.9%) | 7,311 (22.1%) |
| Computers & Mathematics | 8,842 (70.8%) | 3,651 (29.2%) |
| Architecture & Engineering | 15,760 (85.6%) | 2,655 (14.4%) |
| Life, Physical & Social Science | 1,140 (53.1%) | 1,005 (46.9%) |
| Community & Social Service | 11,070 (31.8%) | 23,800 (68.2%) |
| Education, Arts & Media | 1,557 (25.6%) | 4,535 (74.4%) |
| Legal Services & Support | 1,429 (36.1%) | 2,533 (63.9%) |
| Education Instruction & Library | 4,009 (22.3%) | 14,006 (77.7%) |
| Arts, Media & Entertainment | 4,075 (59.9%) | 2,726 (40.1%) |
| Health Diagnosing & Treating | 5,758 (21.0%) | 21,601 (78.9%) |
| Health Technologists | 4,180 (23.7%) | 13,442 (76.3%) |
| Total (Category) | 77,884 (48.7%) | 81,977 (51.3%) |
| Total (Overall) | 230,287 (53.1%) | 203,002 (46.9%) |
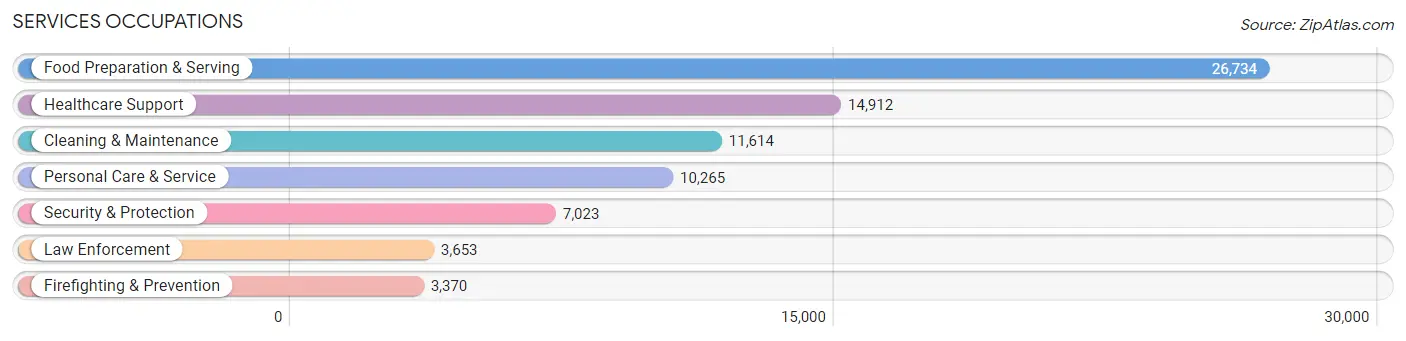
Services Occupations
The most common Services occupations in Macomb County are Food Preparation & Serving (26,734 | 6.2%), Healthcare Support (14,912 | 3.4%), Cleaning & Maintenance (11,614 | 2.7%), Personal Care & Service (10,265 | 2.4%), and Security & Protection (7,023 | 1.6%).
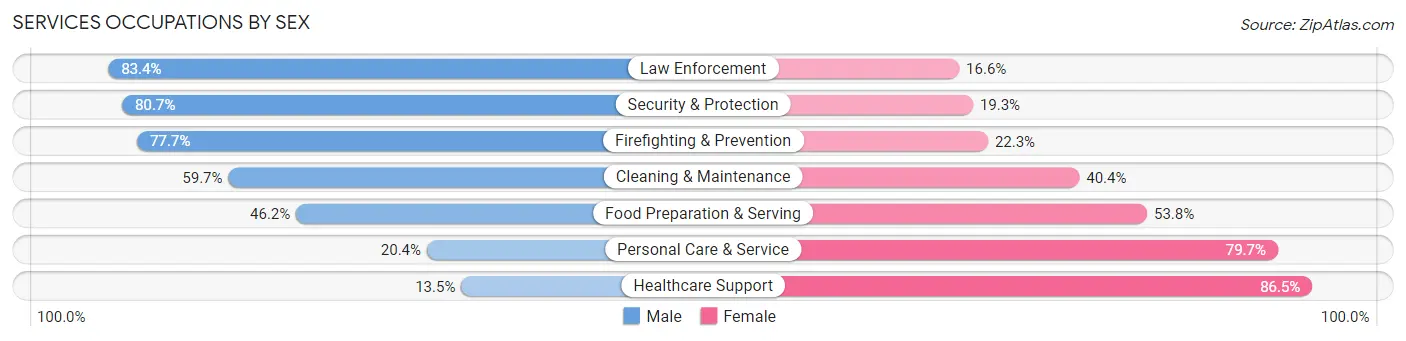
Services Occupations by Sex
Within the Services occupations in Macomb County, the most male-oriented occupations are Law Enforcement (83.4%), Security & Protection (80.7%), and Firefighting & Prevention (77.7%), while the most female-oriented occupations are Healthcare Support (86.5%), Personal Care & Service (79.6%), and Food Preparation & Serving (53.8%).
| Occupation | Male | Female |
| Healthcare Support | 2,019 (13.5%) | 12,893 (86.5%) |
| Security & Protection | 5,668 (80.7%) | 1,355 (19.3%) |
| Firefighting & Prevention | 2,620 (77.7%) | 750 (22.3%) |
| Law Enforcement | 3,048 (83.4%) | 605 (16.6%) |
| Food Preparation & Serving | 12,358 (46.2%) | 14,376 (53.8%) |
| Cleaning & Maintenance | 6,928 (59.7%) | 4,686 (40.4%) |
| Personal Care & Service | 2,089 (20.3%) | 8,176 (79.6%) |
| Total (Category) | 29,062 (41.2%) | 41,486 (58.8%) |
| Total (Overall) | 230,287 (53.1%) | 203,002 (46.9%) |
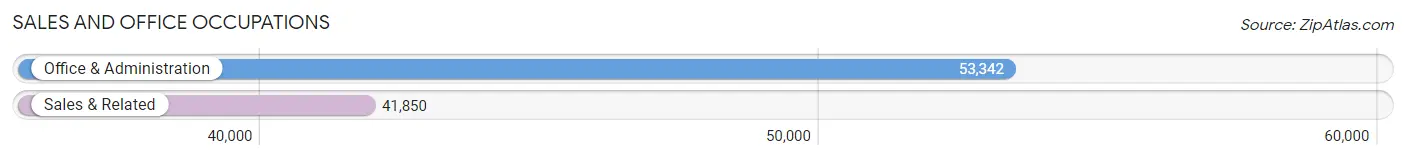
Sales and Office Occupations
The most common Sales and Office occupations in Macomb County are Office & Administration (53,342 | 12.3%), and Sales & Related (41,850 | 9.7%).
Sales and Office Occupations by Sex
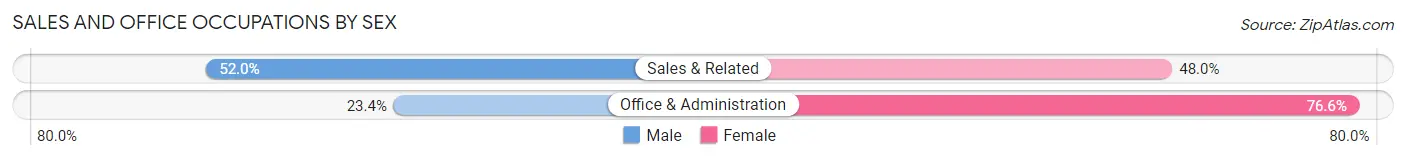
| Occupation | Male | Female |
| Sales & Related | 21,780 (52.0%) | 20,070 (48.0%) |
| Office & Administration | 12,459 (23.4%) | 40,883 (76.6%) |
| Total (Category) | 34,239 (36.0%) | 60,953 (64.0%) |
| Total (Overall) | 230,287 (53.1%) | 203,002 (46.9%) |
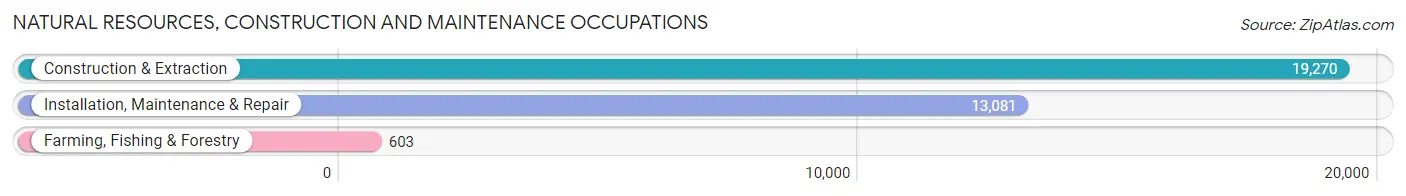
Natural Resources, Construction and Maintenance Occupations
The most common Natural Resources, Construction and Maintenance occupations in Macomb County are Construction & Extraction (19,270 | 4.4%), Installation, Maintenance & Repair (13,081 | 3.0%), and Farming, Fishing & Forestry (603 | 0.1%).
Natural Resources, Construction and Maintenance Occupations by Sex
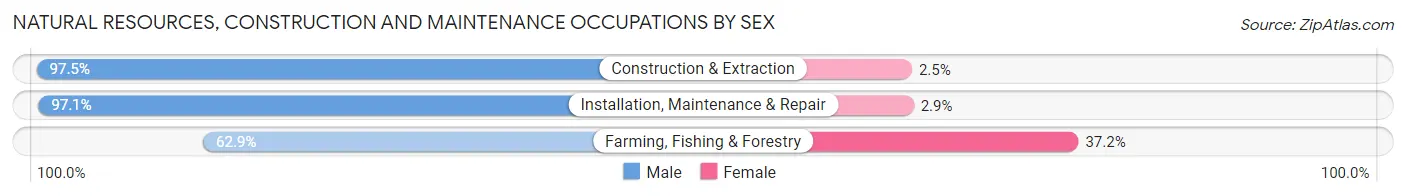
| Occupation | Male | Female |
| Farming, Fishing & Forestry | 379 (62.8%) | 224 (37.1%) |
| Construction & Extraction | 18,786 (97.5%) | 484 (2.5%) |
| Installation, Maintenance & Repair | 12,705 (97.1%) | 376 (2.9%) |
| Total (Category) | 31,870 (96.7%) | 1,084 (3.3%) |
| Total (Overall) | 230,287 (53.1%) | 203,002 (46.9%) |
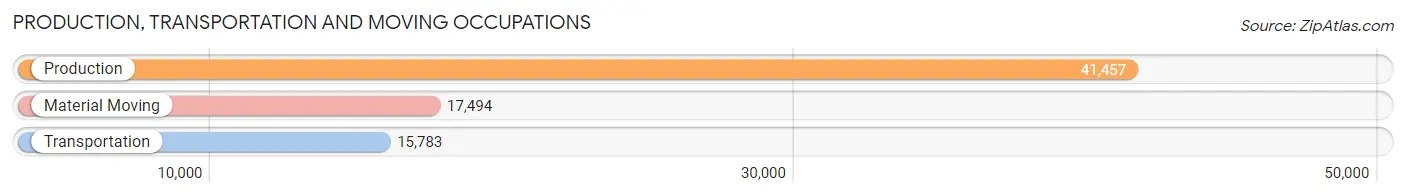
Production, Transportation and Moving Occupations
The most common Production, Transportation and Moving occupations in Macomb County are Production (41,457 | 9.6%), Material Moving (17,494 | 4.0%), and Transportation (15,783 | 3.6%).
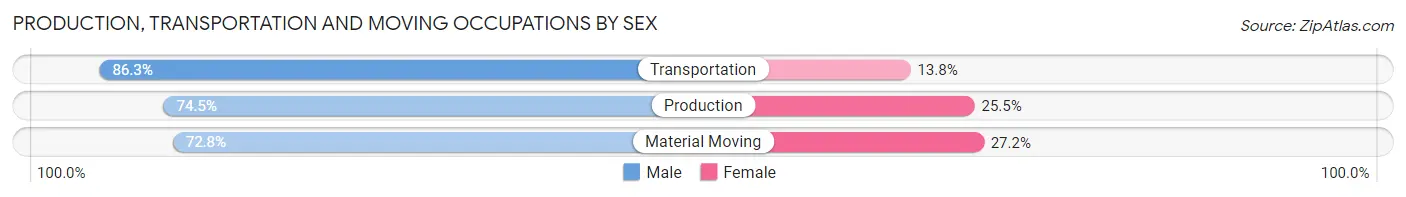
Production, Transportation and Moving Occupations by Sex
| Occupation | Male | Female |
| Production | 30,881 (74.5%) | 10,576 (25.5%) |
| Transportation | 13,613 (86.3%) | 2,170 (13.8%) |
| Material Moving | 12,738 (72.8%) | 4,756 (27.2%) |
| Total (Category) | 57,232 (76.6%) | 17,502 (23.4%) |
| Total (Overall) | 230,287 (53.1%) | 203,002 (46.9%) |
Employment Industries by Sex in Macomb County
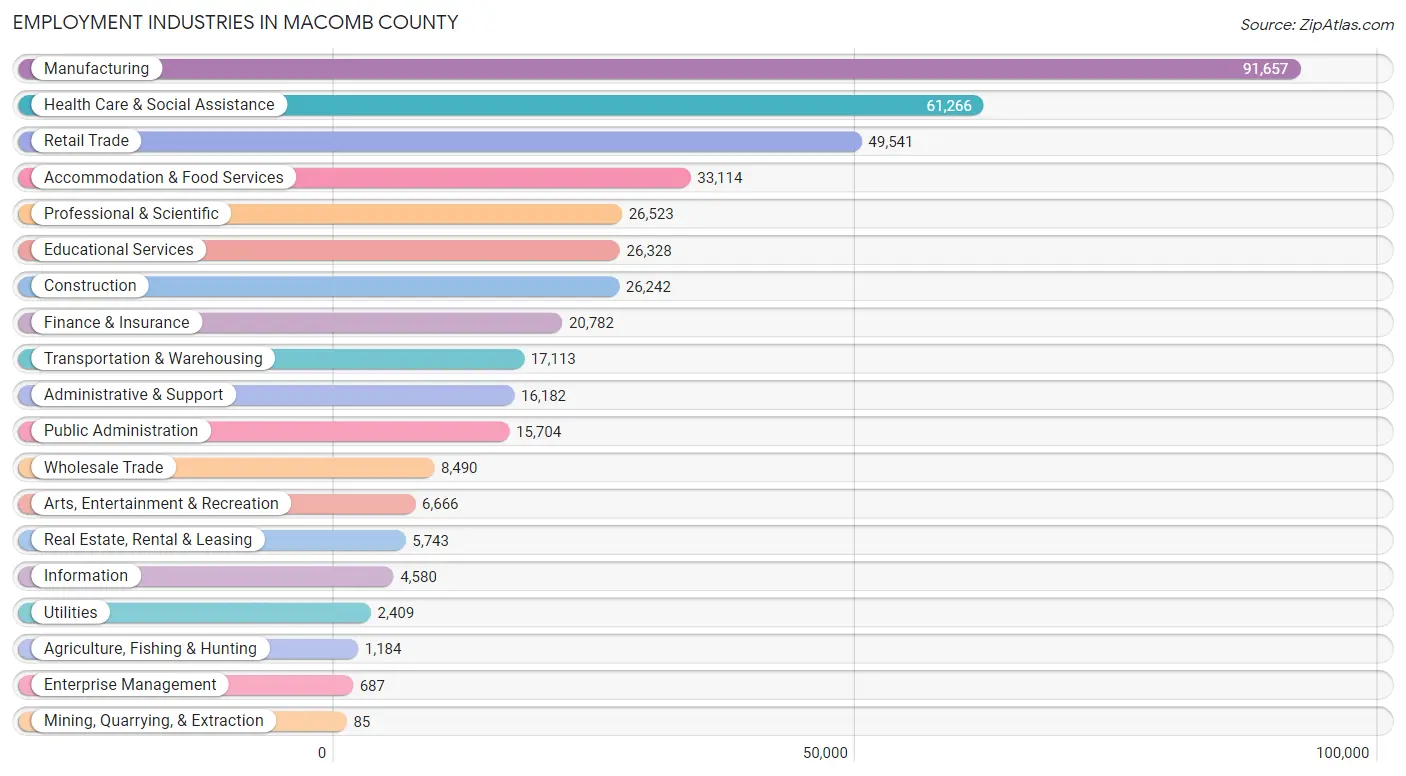
Employment Industries in Macomb County
The major employment industries in Macomb County include Manufacturing (91,657 | 21.1%), Health Care & Social Assistance (61,266 | 14.1%), Retail Trade (49,541 | 11.4%), Accommodation & Food Services (33,114 | 7.6%), and Professional & Scientific (26,523 | 6.1%).
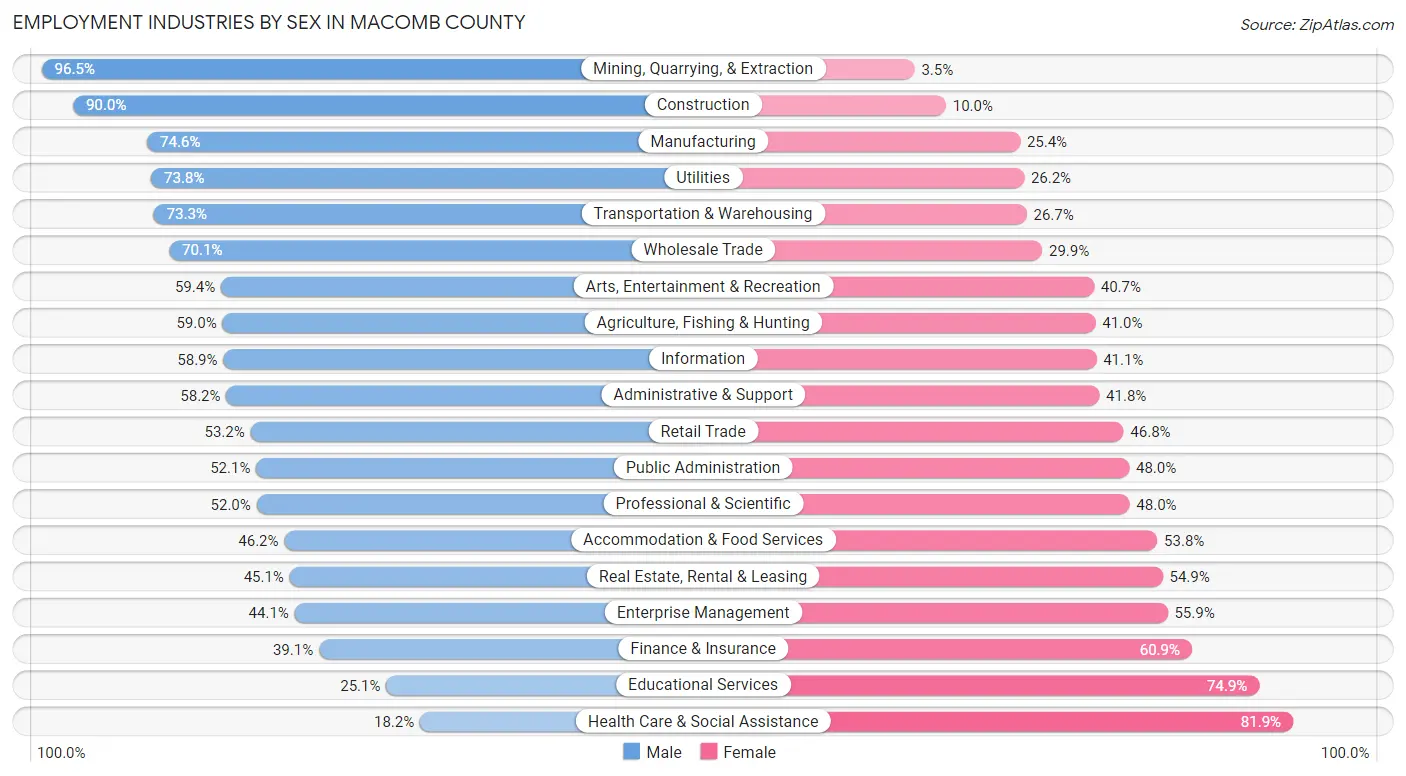
Employment Industries by Sex in Macomb County
The Macomb County industries that see more men than women are Mining, Quarrying, & Extraction (96.5%), Construction (90.0%), and Manufacturing (74.6%), whereas the industries that tend to have a higher number of women are Health Care & Social Assistance (81.9%), Educational Services (74.9%), and Finance & Insurance (60.9%).
| Industry | Male | Female |
| Agriculture, Fishing & Hunting | 699 (59.0%) | 485 (41.0%) |
| Mining, Quarrying, & Extraction | 82 (96.5%) | 3 (3.5%) |
| Construction | 23,613 (90.0%) | 2,629 (10.0%) |
| Manufacturing | 68,414 (74.6%) | 23,243 (25.4%) |
| Wholesale Trade | 5,949 (70.1%) | 2,541 (29.9%) |
| Retail Trade | 26,372 (53.2%) | 23,169 (46.8%) |
| Transportation & Warehousing | 12,541 (73.3%) | 4,572 (26.7%) |
| Utilities | 1,778 (73.8%) | 631 (26.2%) |
| Information | 2,696 (58.9%) | 1,884 (41.1%) |
| Finance & Insurance | 8,120 (39.1%) | 12,662 (60.9%) |
| Real Estate, Rental & Leasing | 2,592 (45.1%) | 3,151 (54.9%) |
| Professional & Scientific | 13,787 (52.0%) | 12,736 (48.0%) |
| Enterprise Management | 303 (44.1%) | 384 (55.9%) |
| Administrative & Support | 9,425 (58.2%) | 6,757 (41.8%) |
| Educational Services | 6,615 (25.1%) | 19,713 (74.9%) |
| Health Care & Social Assistance | 11,118 (18.1%) | 50,148 (81.9%) |
| Arts, Entertainment & Recreation | 3,956 (59.4%) | 2,710 (40.6%) |
| Accommodation & Food Services | 15,311 (46.2%) | 17,803 (53.8%) |
| Public Administration | 8,174 (52.0%) | 7,530 (47.9%) |
| Total | 230,287 (53.1%) | 203,002 (46.9%) |
Education in Macomb County
School Enrollment in Macomb County
The most common levels of schooling among the 195,084 students in Macomb County are high school (45,315 | 23.2%), college / undergraduate (40,790 | 20.9%), and middle school (40,505 | 20.8%).
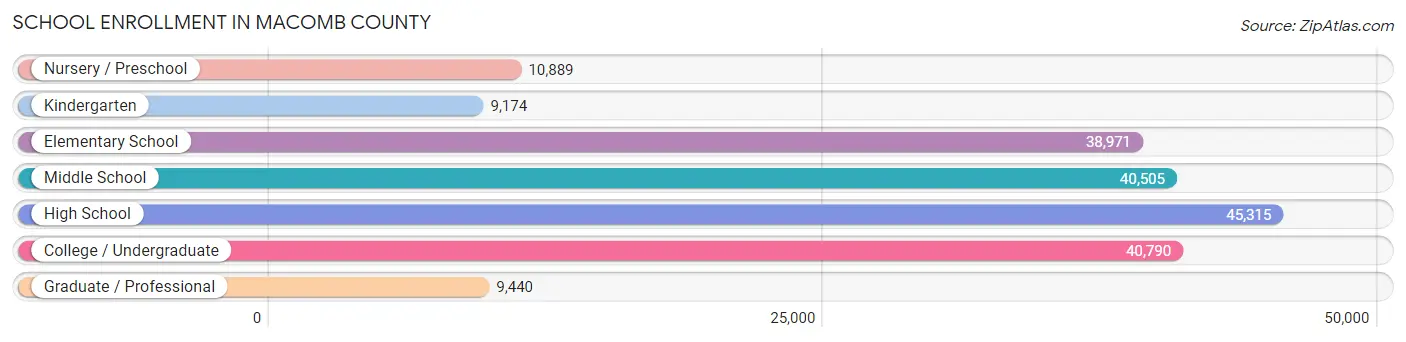
| School Level | # Students | % Students |
| Nursery / Preschool | 10,889 | 5.6% |
| Kindergarten | 9,174 | 4.7% |
| Elementary School | 38,971 | 20.0% |
| Middle School | 40,505 | 20.8% |
| High School | 45,315 | 23.2% |
| College / Undergraduate | 40,790 | 20.9% |
| Graduate / Professional | 9,440 | 4.8% |
| Total | 195,084 | 100.0% |
School Enrollment by Age by Funding Source in Macomb County
Out of a total of 195,084 students who are enrolled in schools in Macomb County, 23,800 (12.2%) attend a private institution, while the remaining 171,284 (87.8%) are enrolled in public schools. The age group of 3 to 4 year olds has the highest likelihood of being enrolled in private schools, with 2,515 (30.2% in the age bracket) enrolled. Conversely, the age group of 10 to 14 year olds has the lowest likelihood of being enrolled in a private school, with 46,496 (91.8% in the age bracket) attending a public institution.
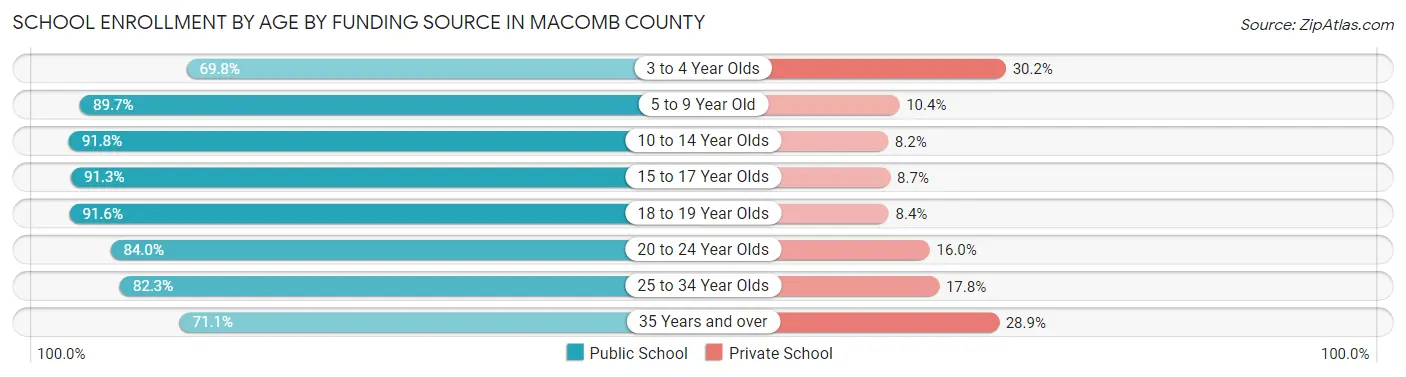
| Age Bracket | Public School | Private School |
| 3 to 4 Year Olds | 5,817 (69.8%) | 2,515 (30.2%) |
| 5 to 9 Year Old | 42,143 (89.6%) | 4,866 (10.3%) |
| 10 to 14 Year Olds | 46,496 (91.8%) | 4,176 (8.2%) |
| 15 to 17 Year Olds | 29,991 (91.3%) | 2,842 (8.7%) |
| 18 to 19 Year Olds | 12,152 (91.6%) | 1,110 (8.4%) |
| 20 to 24 Year Olds | 17,017 (84.0%) | 3,244 (16.0%) |
| 25 to 34 Year Olds | 10,951 (82.3%) | 2,363 (17.7%) |
| 35 Years and over | 6,686 (71.1%) | 2,715 (28.9%) |
| Total | 171,284 (87.8%) | 23,800 (12.2%) |
Educational Attainment by Field of Study in Macomb County
Business (43,571 | 24.4%), science & technology (23,378 | 13.1%), education (21,374 | 12.0%), engineering (18,882 | 10.6%), and arts & humanities (12,282 | 6.9%) are the most common fields of study among 178,215 individuals in Macomb County who have obtained a bachelor's degree or higher.
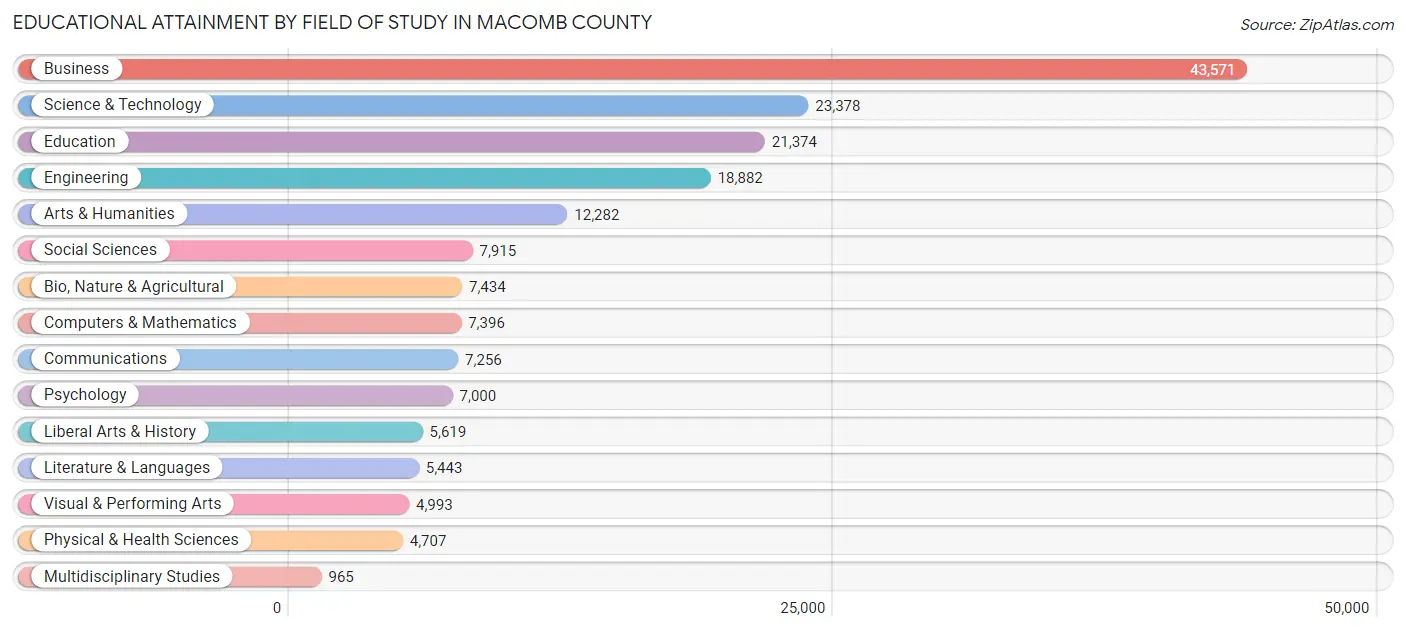
| Field of Study | # Graduates | % Graduates |
| Computers & Mathematics | 7,396 | 4.2% |
| Bio, Nature & Agricultural | 7,434 | 4.2% |
| Physical & Health Sciences | 4,707 | 2.6% |
| Psychology | 7,000 | 3.9% |
| Social Sciences | 7,915 | 4.4% |
| Engineering | 18,882 | 10.6% |
| Multidisciplinary Studies | 965 | 0.5% |
| Science & Technology | 23,378 | 13.1% |
| Business | 43,571 | 24.4% |
| Education | 21,374 | 12.0% |
| Literature & Languages | 5,443 | 3.0% |
| Liberal Arts & History | 5,619 | 3.2% |
| Visual & Performing Arts | 4,993 | 2.8% |
| Communications | 7,256 | 4.1% |
| Arts & Humanities | 12,282 | 6.9% |
| Total | 178,215 | 100.0% |
Transportation & Commute in Macomb County
Vehicle Availability by Sex in Macomb County
The most prevalent vehicle ownership categories in Macomb County are males with 2 vehicles (96,928, accounting for 42.9%) and females with 2 vehicles (81,822, making up 49.4%).
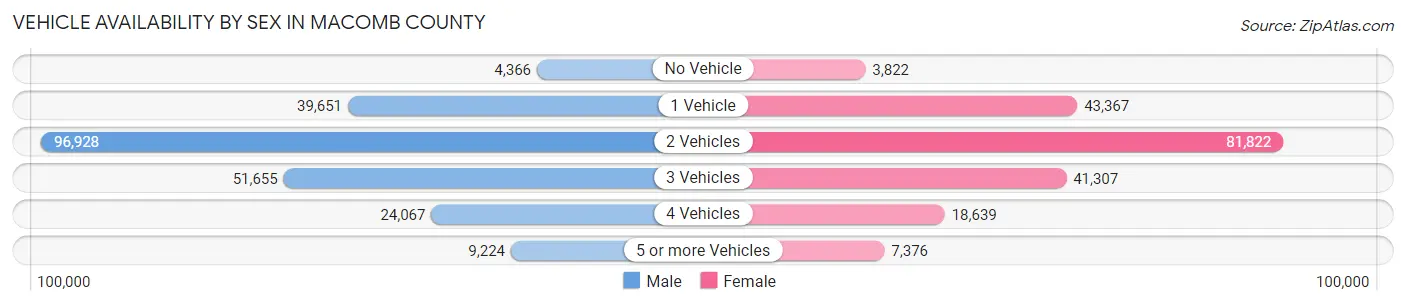
| Vehicles Available | Male | Female |
| No Vehicle | 4,366 (1.9%) | 3,822 (1.9%) |
| 1 Vehicle | 39,651 (17.5%) | 43,367 (22.1%) |
| 2 Vehicles | 96,928 (42.9%) | 81,822 (41.7%) |
| 3 Vehicles | 51,655 (22.9%) | 41,307 (21.0%) |
| 4 Vehicles | 24,067 (10.6%) | 18,639 (9.5%) |
| 5 or more Vehicles | 9,224 (4.1%) | 7,376 (3.8%) |
| Total | 225,891 (100.0%) | 196,333 (100.0%) |
Commute Time in Macomb County
The most frequently occuring commute durations in Macomb County are 30 to 34 minutes (60,185 commuters, 15.8%), 20 to 24 minutes (59,280 commuters, 15.5%), and 15 to 19 minutes (53,824 commuters, 14.1%).
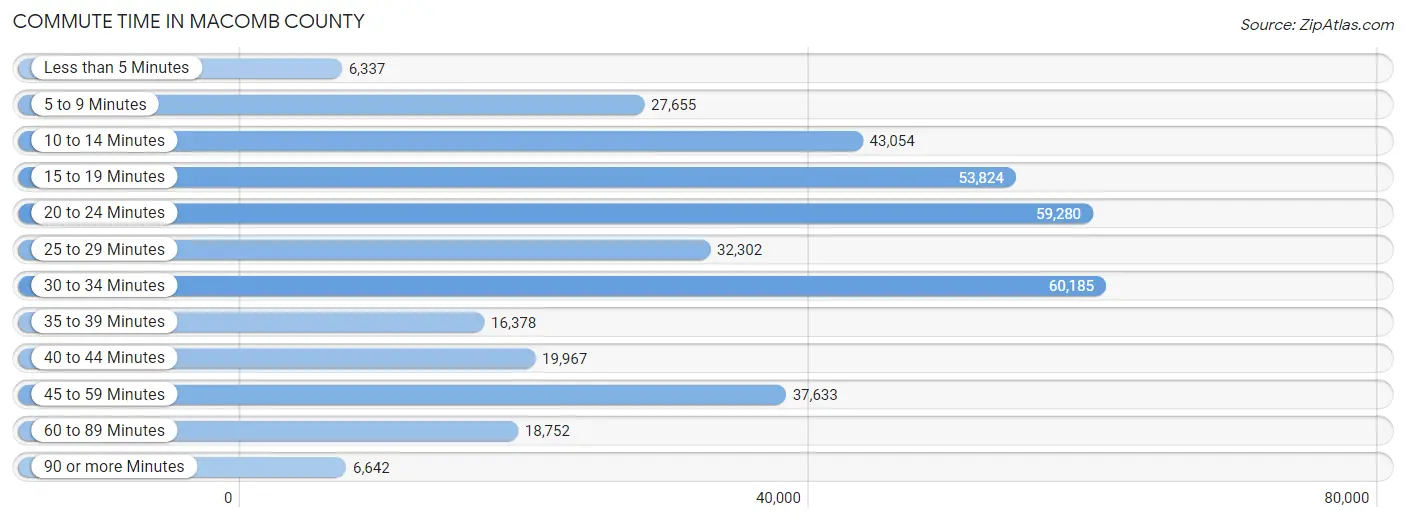
| Commute Time | # Commuters | % Commuters |
| Less than 5 Minutes | 6,337 | 1.7% |
| 5 to 9 Minutes | 27,655 | 7.2% |
| 10 to 14 Minutes | 43,054 | 11.3% |
| 15 to 19 Minutes | 53,824 | 14.1% |
| 20 to 24 Minutes | 59,280 | 15.5% |
| 25 to 29 Minutes | 32,302 | 8.5% |
| 30 to 34 Minutes | 60,185 | 15.8% |
| 35 to 39 Minutes | 16,378 | 4.3% |
| 40 to 44 Minutes | 19,967 | 5.2% |
| 45 to 59 Minutes | 37,633 | 9.9% |
| 60 to 89 Minutes | 18,752 | 4.9% |
| 90 or more Minutes | 6,642 | 1.7% |
Commute Time by Sex in Macomb County
The most common commute times in Macomb County are 30 to 34 minutes (34,278 commuters, 16.6%) for males and 20 to 24 minutes (27,565 commuters, 15.7%) for females.
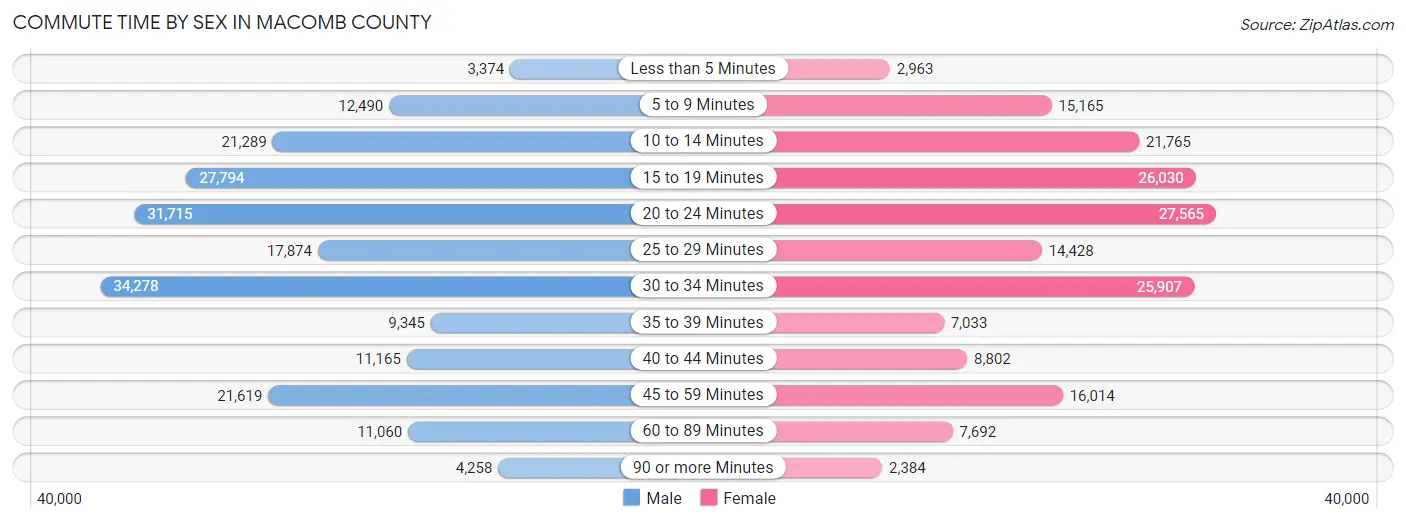
| Commute Time | Male | Female |
| Less than 5 Minutes | 3,374 (1.6%) | 2,963 (1.7%) |
| 5 to 9 Minutes | 12,490 (6.1%) | 15,165 (8.6%) |
| 10 to 14 Minutes | 21,289 (10.3%) | 21,765 (12.4%) |
| 15 to 19 Minutes | 27,794 (13.5%) | 26,030 (14.8%) |
| 20 to 24 Minutes | 31,715 (15.4%) | 27,565 (15.7%) |
| 25 to 29 Minutes | 17,874 (8.7%) | 14,428 (8.2%) |
| 30 to 34 Minutes | 34,278 (16.6%) | 25,907 (14.7%) |
| 35 to 39 Minutes | 9,345 (4.5%) | 7,033 (4.0%) |
| 40 to 44 Minutes | 11,165 (5.4%) | 8,802 (5.0%) |
| 45 to 59 Minutes | 21,619 (10.5%) | 16,014 (9.1%) |
| 60 to 89 Minutes | 11,060 (5.4%) | 7,692 (4.4%) |
| 90 or more Minutes | 4,258 (2.1%) | 2,384 (1.4%) |
Time of Departure to Work by Sex in Macomb County
The most frequent times of departure to work in Macomb County are 7:00 AM to 7:29 AM (25,854, 12.5%) for males and 7:00 AM to 7:29 AM (22,975, 13.1%) for females.
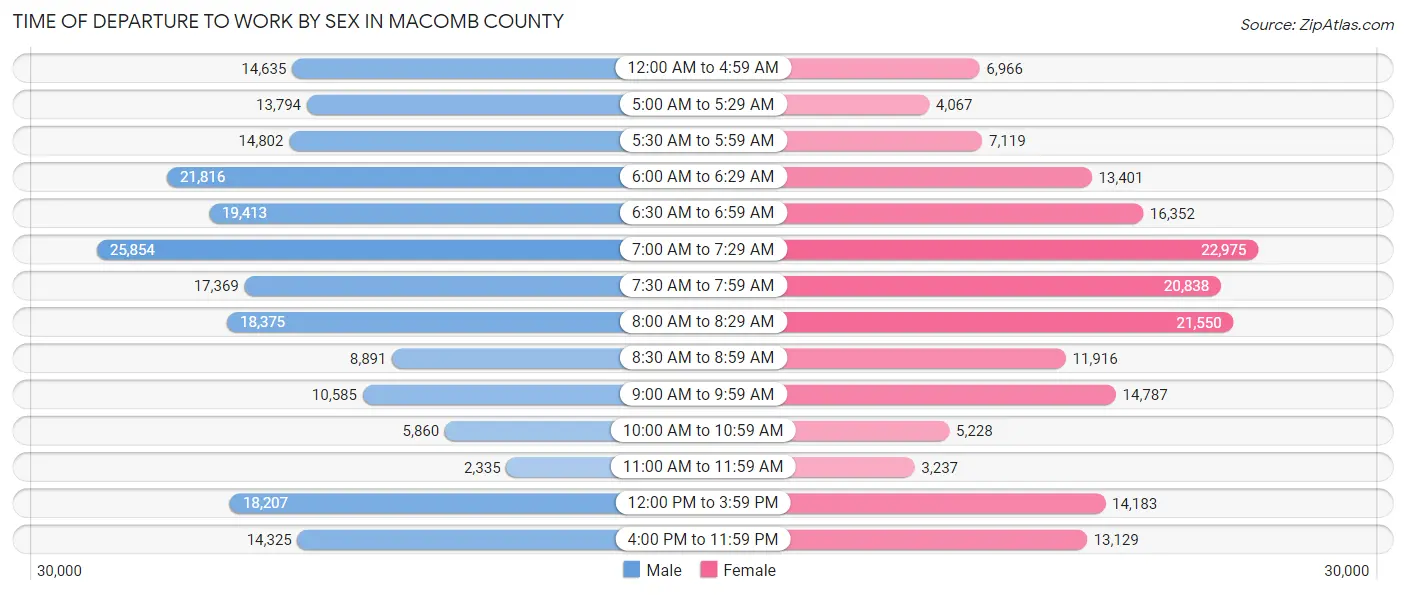
| Time of Departure | Male | Female |
| 12:00 AM to 4:59 AM | 14,635 (7.1%) | 6,966 (4.0%) |
| 5:00 AM to 5:29 AM | 13,794 (6.7%) | 4,067 (2.3%) |
| 5:30 AM to 5:59 AM | 14,802 (7.2%) | 7,119 (4.1%) |
| 6:00 AM to 6:29 AM | 21,816 (10.6%) | 13,401 (7.6%) |
| 6:30 AM to 6:59 AM | 19,413 (9.4%) | 16,352 (9.3%) |
| 7:00 AM to 7:29 AM | 25,854 (12.5%) | 22,975 (13.1%) |
| 7:30 AM to 7:59 AM | 17,369 (8.4%) | 20,838 (11.9%) |
| 8:00 AM to 8:29 AM | 18,375 (8.9%) | 21,550 (12.3%) |
| 8:30 AM to 8:59 AM | 8,891 (4.3%) | 11,916 (6.8%) |
| 9:00 AM to 9:59 AM | 10,585 (5.1%) | 14,787 (8.4%) |
| 10:00 AM to 10:59 AM | 5,860 (2.8%) | 5,228 (3.0%) |
| 11:00 AM to 11:59 AM | 2,335 (1.1%) | 3,237 (1.8%) |
| 12:00 PM to 3:59 PM | 18,207 (8.8%) | 14,183 (8.1%) |
| 4:00 PM to 11:59 PM | 14,325 (7.0%) | 13,129 (7.5%) |
| Total | 206,261 (100.0%) | 175,748 (100.0%) |
Housing Occupancy in Macomb County
Occupancy by Ownership in Macomb County
Of the total 354,251 dwellings in Macomb County, owner-occupied units account for 264,921 (74.8%), while renter-occupied units make up 89,330 (25.2%).
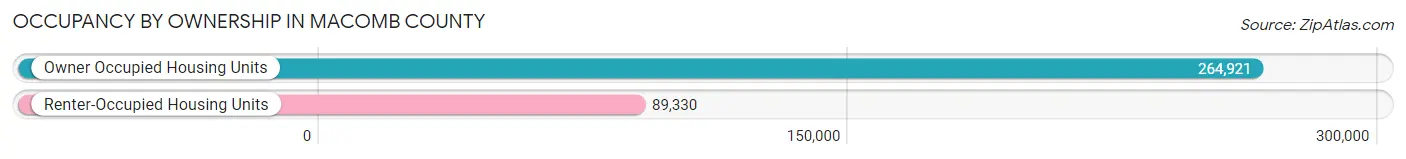
| Occupancy | # Housing Units | % Housing Units |
| Owner Occupied Housing Units | 264,921 | 74.8% |
| Renter-Occupied Housing Units | 89,330 | 25.2% |
| Total Occupied Housing Units | 354,251 | 100.0% |
Occupancy by Household Size in Macomb County
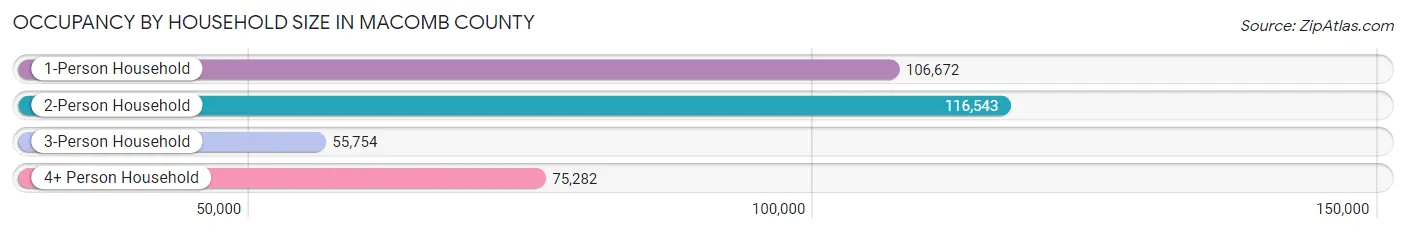
| Household Size | # Housing Units | % Housing Units |
| 1-Person Household | 106,672 | 30.1% |
| 2-Person Household | 116,543 | 32.9% |
| 3-Person Household | 55,754 | 15.7% |
| 4+ Person Household | 75,282 | 21.2% |
| Total Housing Units | 354,251 | 100.0% |
Occupancy by Ownership by Household Size in Macomb County
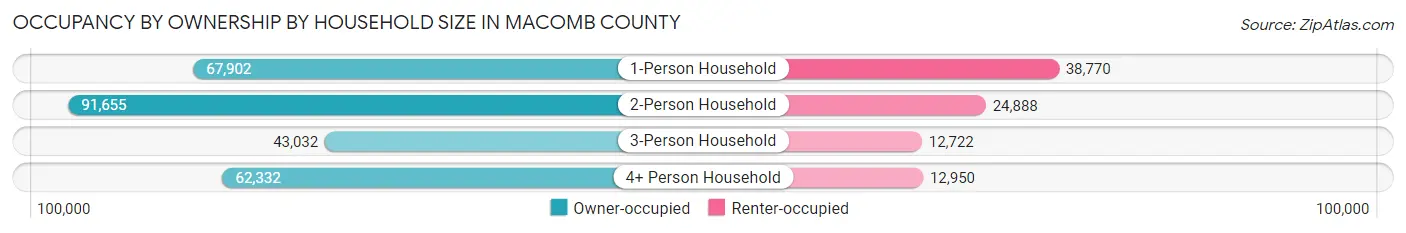
| Household Size | Owner-occupied | Renter-occupied |
| 1-Person Household | 67,902 (63.6%) | 38,770 (36.3%) |
| 2-Person Household | 91,655 (78.6%) | 24,888 (21.4%) |
| 3-Person Household | 43,032 (77.2%) | 12,722 (22.8%) |
| 4+ Person Household | 62,332 (82.8%) | 12,950 (17.2%) |
| Total Housing Units | 264,921 (74.8%) | 89,330 (25.2%) |
Occupancy by Educational Attainment in Macomb County
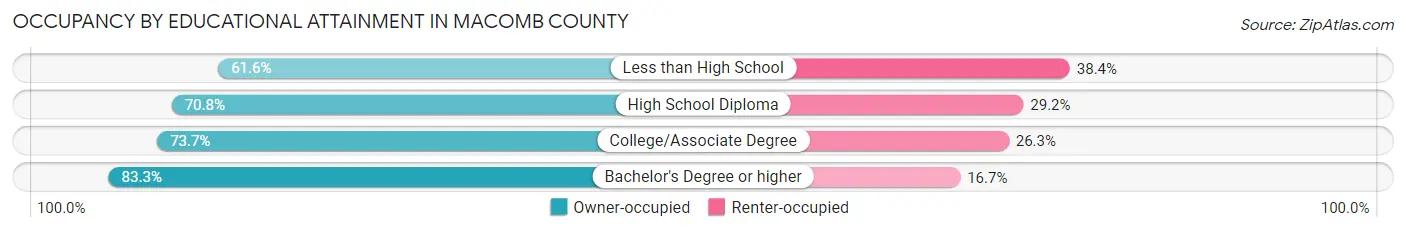
| Household Size | Owner-occupied | Renter-occupied |
| Less than High School | 16,488 (61.6%) | 10,277 (38.4%) |
| High School Diploma | 66,388 (70.8%) | 27,360 (29.2%) |
| College/Associate Degree | 97,382 (73.7%) | 34,755 (26.3%) |
| Bachelor's Degree or higher | 84,663 (83.3%) | 16,938 (16.7%) |
Occupancy by Age of Householder in Macomb County
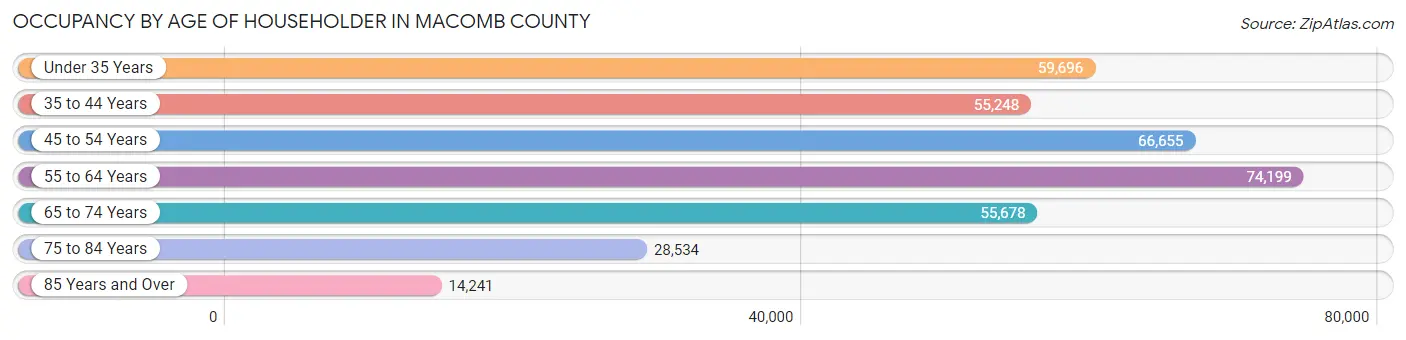
| Age Bracket | # Households | % Households |
| Under 35 Years | 59,696 | 16.9% |
| 35 to 44 Years | 55,248 | 15.6% |
| 45 to 54 Years | 66,655 | 18.8% |
| 55 to 64 Years | 74,199 | 20.9% |
| 65 to 74 Years | 55,678 | 15.7% |
| 75 to 84 Years | 28,534 | 8.1% |
| 85 Years and Over | 14,241 | 4.0% |
| Total | 354,251 | 100.0% |
Housing Finances in Macomb County
Median Income by Occupancy in Macomb County
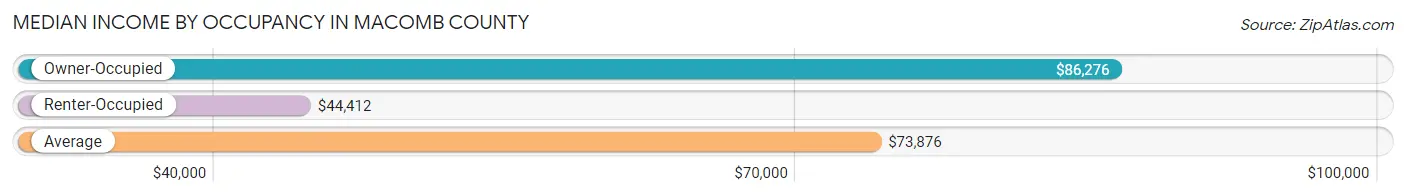
| Occupancy Type | # Households | Median Income |
| Owner-Occupied | 264,921 (74.8%) | $86,276 |
| Renter-Occupied | 89,330 (25.2%) | $44,412 |
| Average | 354,251 (100.0%) | $73,876 |
Occupancy by Householder Income Bracket in Macomb County
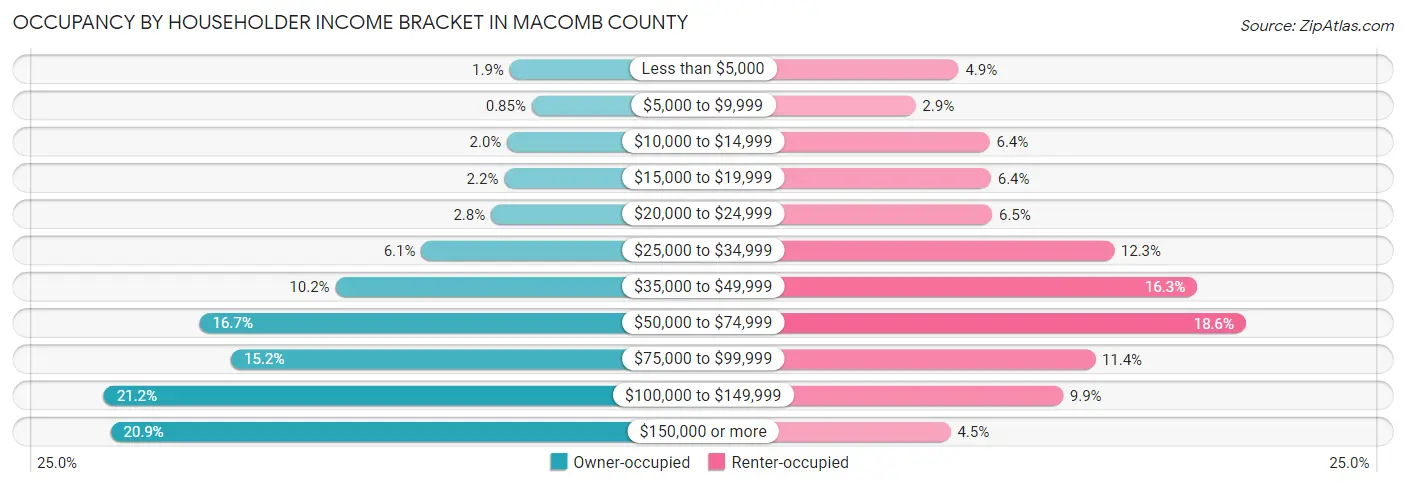
| Income Bracket | Owner-occupied | Renter-occupied |
| Less than $5,000 | 5,041 (1.9%) | 4,379 (4.9%) |
| $5,000 to $9,999 | 2,247 (0.9%) | 2,543 (2.9%) |
| $10,000 to $14,999 | 5,363 (2.0%) | 5,695 (6.4%) |
| $15,000 to $19,999 | 5,715 (2.2%) | 5,757 (6.4%) |
| $20,000 to $24,999 | 7,390 (2.8%) | 5,805 (6.5%) |
| $25,000 to $34,999 | 16,174 (6.1%) | 10,990 (12.3%) |
| $35,000 to $49,999 | 27,016 (10.2%) | 14,524 (16.3%) |
| $50,000 to $74,999 | 44,161 (16.7%) | 16,596 (18.6%) |
| $75,000 to $99,999 | 40,191 (15.2%) | 10,184 (11.4%) |
| $100,000 to $149,999 | 56,240 (21.2%) | 8,820 (9.9%) |
| $150,000 or more | 55,383 (20.9%) | 4,037 (4.5%) |
| Total | 264,921 (100.0%) | 89,330 (100.0%) |
Monthly Housing Cost Tiers in Macomb County
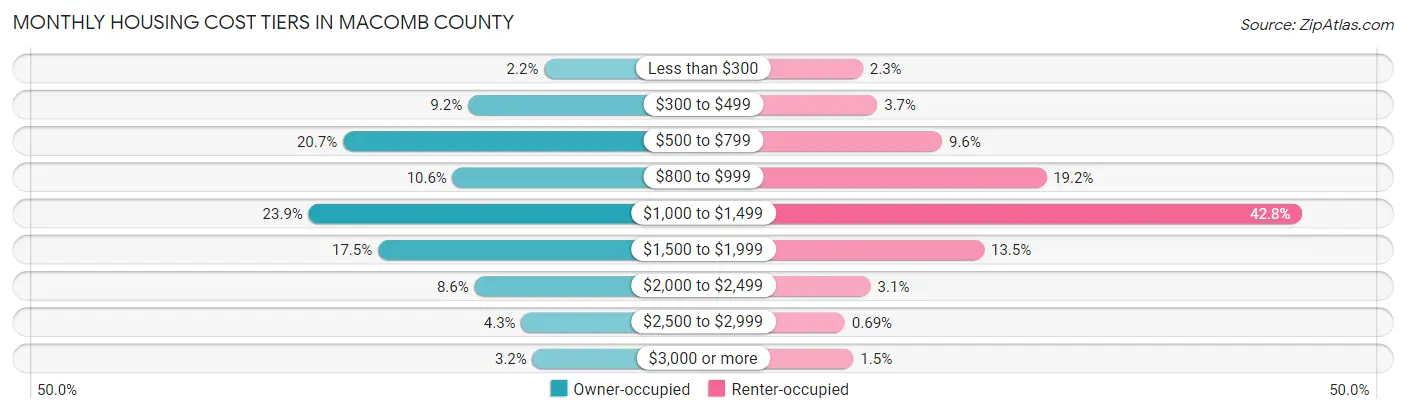
| Monthly Cost | Owner-occupied | Renter-occupied |
| Less than $300 | 5,733 (2.2%) | 2,092 (2.3%) |
| $300 to $499 | 24,322 (9.2%) | 3,275 (3.7%) |
| $500 to $799 | 54,810 (20.7%) | 8,601 (9.6%) |
| $800 to $999 | 28,042 (10.6%) | 17,167 (19.2%) |
| $1,000 to $1,499 | 63,186 (23.8%) | 38,230 (42.8%) |
| $1,500 to $1,999 | 46,248 (17.5%) | 12,062 (13.5%) |
| $2,000 to $2,499 | 22,723 (8.6%) | 2,735 (3.1%) |
| $2,500 to $2,999 | 11,287 (4.3%) | 616 (0.7%) |
| $3,000 or more | 8,570 (3.2%) | 1,316 (1.5%) |
| Total | 264,921 (100.0%) | 89,330 (100.0%) |
Physical Housing Characteristics in Macomb County
Housing Structures in Macomb County
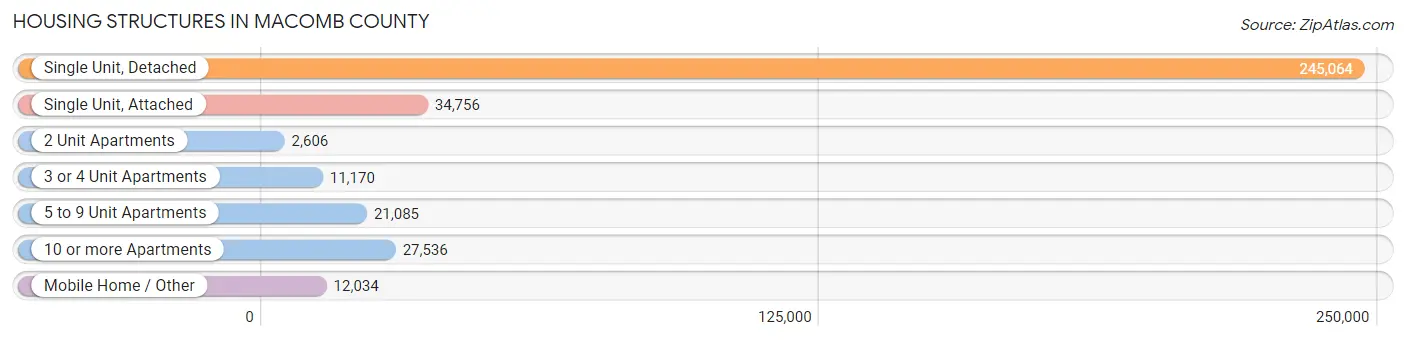
| Structure Type | # Housing Units | % Housing Units |
| Single Unit, Detached | 245,064 | 69.2% |
| Single Unit, Attached | 34,756 | 9.8% |
| 2 Unit Apartments | 2,606 | 0.7% |
| 3 or 4 Unit Apartments | 11,170 | 3.2% |
| 5 to 9 Unit Apartments | 21,085 | 5.9% |
| 10 or more Apartments | 27,536 | 7.8% |
| Mobile Home / Other | 12,034 | 3.4% |
| Total | 354,251 | 100.0% |
Housing Structures by Occupancy in Macomb County
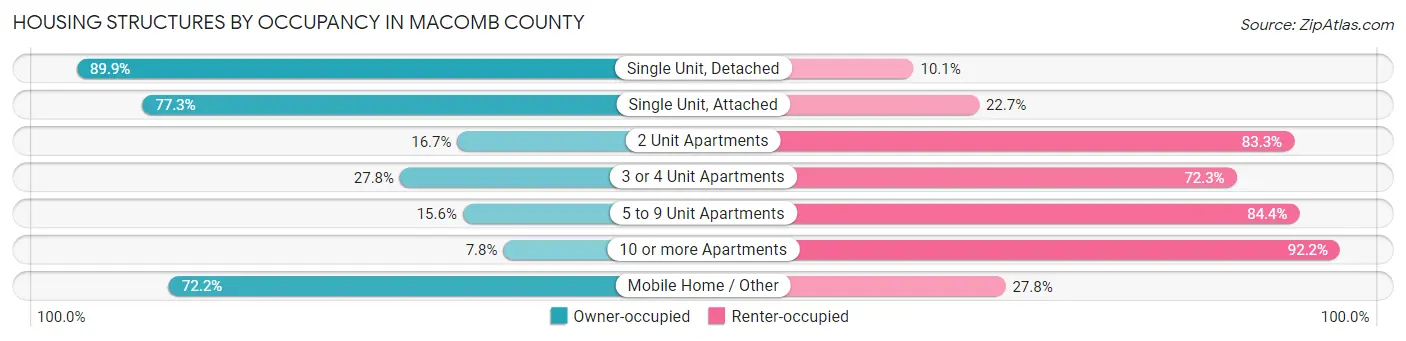
| Structure Type | Owner-occupied | Renter-occupied |
| Single Unit, Detached | 220,364 (89.9%) | 24,700 (10.1%) |
| Single Unit, Attached | 26,875 (77.3%) | 7,881 (22.7%) |
| 2 Unit Apartments | 435 (16.7%) | 2,171 (83.3%) |
| 3 or 4 Unit Apartments | 3,100 (27.8%) | 8,070 (72.3%) |
| 5 to 9 Unit Apartments | 3,297 (15.6%) | 17,788 (84.4%) |
| 10 or more Apartments | 2,160 (7.8%) | 25,376 (92.2%) |
| Mobile Home / Other | 8,690 (72.2%) | 3,344 (27.8%) |
| Total | 264,921 (74.8%) | 89,330 (25.2%) |
Housing Structures by Number of Rooms in Macomb County
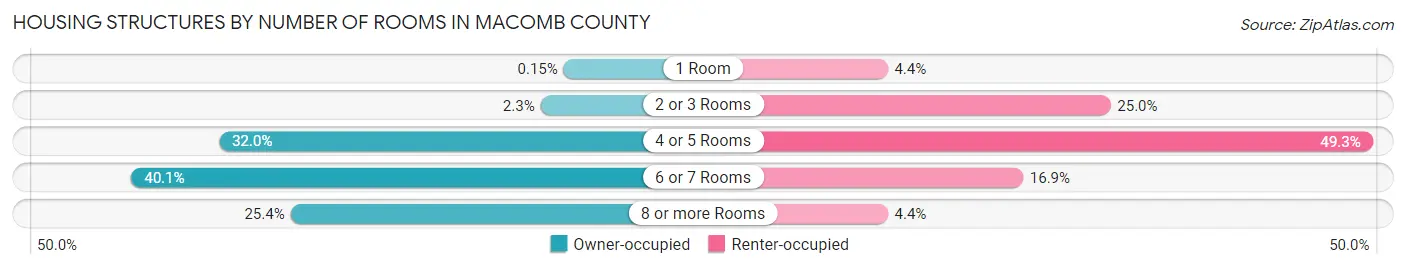
| Number of Rooms | Owner-occupied | Renter-occupied |
| 1 Room | 391 (0.2%) | 3,931 (4.4%) |
| 2 or 3 Rooms | 6,060 (2.3%) | 22,345 (25.0%) |
| 4 or 5 Rooms | 84,825 (32.0%) | 44,007 (49.3%) |
| 6 or 7 Rooms | 106,325 (40.1%) | 15,112 (16.9%) |
| 8 or more Rooms | 67,320 (25.4%) | 3,935 (4.4%) |
| Total | 264,921 (100.0%) | 89,330 (100.0%) |
Housing Structure by Heating Type in Macomb County
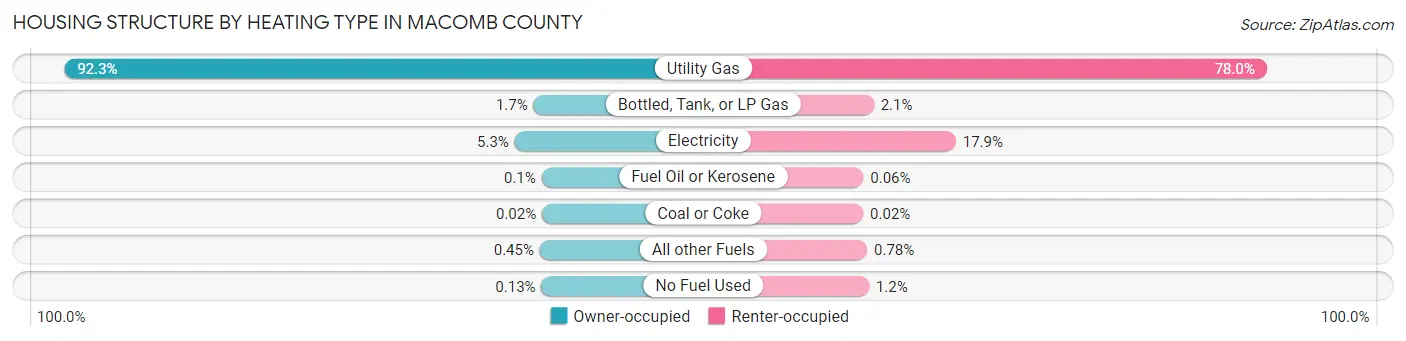
| Heating Type | Owner-occupied | Renter-occupied |
| Utility Gas | 244,641 (92.3%) | 69,681 (78.0%) |
| Bottled, Tank, or LP Gas | 4,392 (1.7%) | 1,837 (2.1%) |
| Electricity | 14,044 (5.3%) | 16,016 (17.9%) |
| Fuel Oil or Kerosene | 262 (0.1%) | 53 (0.1%) |
| Coal or Coke | 46 (0.0%) | 19 (0.0%) |
| All other Fuels | 1,189 (0.4%) | 695 (0.8%) |
| No Fuel Used | 347 (0.1%) | 1,029 (1.1%) |
| Total | 264,921 (100.0%) | 89,330 (100.0%) |
Household Vehicle Usage in Macomb County
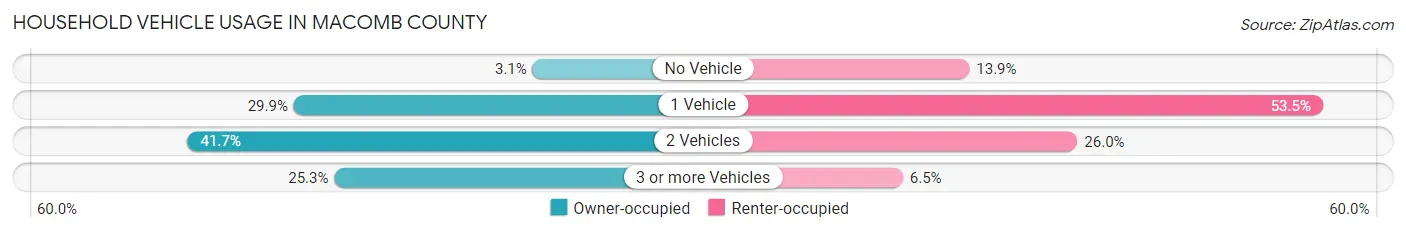
| Vehicles per Household | Owner-occupied | Renter-occupied |
| No Vehicle | 8,197 (3.1%) | 12,453 (13.9%) |
| 1 Vehicle | 79,084 (29.8%) | 47,811 (53.5%) |
| 2 Vehicles | 110,587 (41.7%) | 23,265 (26.0%) |
| 3 or more Vehicles | 67,053 (25.3%) | 5,801 (6.5%) |
| Total | 264,921 (100.0%) | 89,330 (100.0%) |
Real Estate & Mortgages in Macomb County
Real Estate and Mortgage Overview in Macomb County
| Characteristic | Without Mortgage | With Mortgage |
| Housing Units | 97,735 | 167,186 |
| Median Property Value | $193,500 | $229,100 |
| Median Household Income | $64,076 | $42,068 |
| Monthly Housing Costs | $606 | $8,419 |
| Real Estate Taxes | $2,880 | $5,711 |
Property Value by Mortgage Status in Macomb County
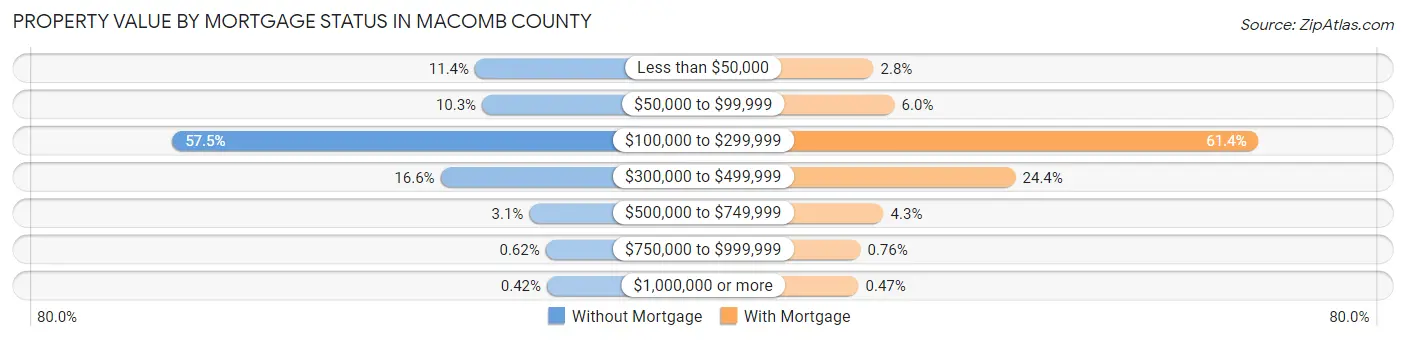
| Property Value | Without Mortgage | With Mortgage |
| Less than $50,000 | 11,129 (11.4%) | 4,590 (2.8%) |
| $50,000 to $99,999 | 10,081 (10.3%) | 9,972 (6.0%) |
| $100,000 to $299,999 | 56,200 (57.5%) | 102,657 (61.4%) |
| $300,000 to $499,999 | 16,266 (16.6%) | 40,770 (24.4%) |
| $500,000 to $749,999 | 3,041 (3.1%) | 7,152 (4.3%) |
| $750,000 to $999,999 | 606 (0.6%) | 1,267 (0.8%) |
| $1,000,000 or more | 412 (0.4%) | 778 (0.5%) |
| Total | 97,735 (100.0%) | 167,186 (100.0%) |
Household Income by Mortgage Status in Macomb County
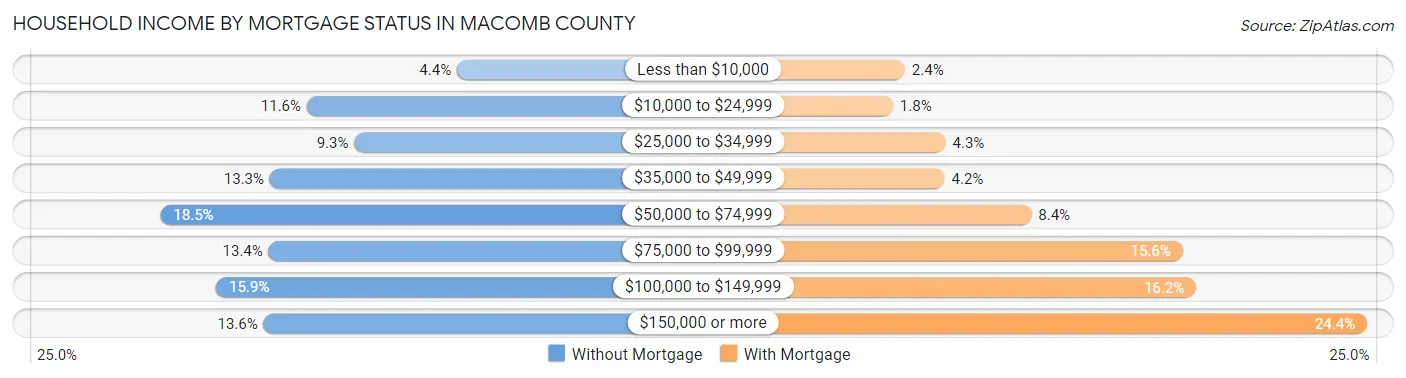
| Household Income | Without Mortgage | With Mortgage |
| Less than $10,000 | 4,311 (4.4%) | 3,927 (2.4%) |
| $10,000 to $24,999 | 11,300 (11.6%) | 2,977 (1.8%) |
| $25,000 to $34,999 | 9,086 (9.3%) | 7,168 (4.3%) |
| $35,000 to $49,999 | 13,016 (13.3%) | 7,088 (4.2%) |
| $50,000 to $74,999 | 18,109 (18.5%) | 14,000 (8.4%) |
| $75,000 to $99,999 | 13,080 (13.4%) | 26,052 (15.6%) |
| $100,000 to $149,999 | 15,518 (15.9%) | 27,111 (16.2%) |
| $150,000 or more | 13,315 (13.6%) | 40,722 (24.4%) |
| Total | 97,735 (100.0%) | 167,186 (100.0%) |
Property Value to Household Income Ratio in Macomb County
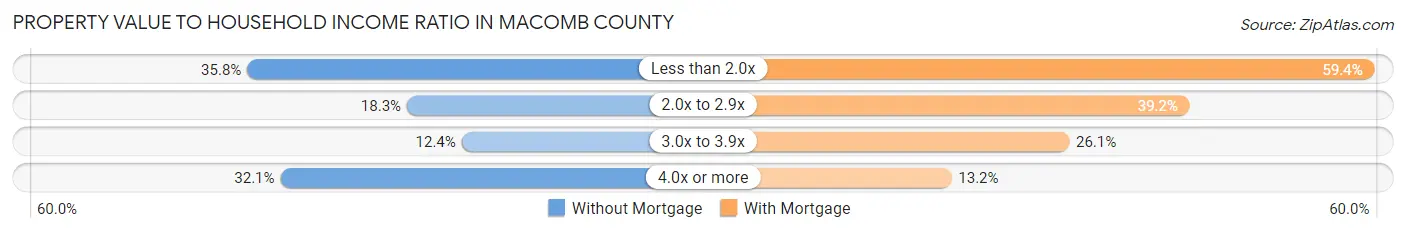
| Value-to-Income Ratio | Without Mortgage | With Mortgage |
| Less than 2.0x | 34,945 (35.7%) | 99,230 (59.4%) |
| 2.0x to 2.9x | 17,926 (18.3%) | 65,548 (39.2%) |
| 3.0x to 3.9x | 12,099 (12.4%) | 43,576 (26.1%) |
| 4.0x or more | 31,400 (32.1%) | 22,114 (13.2%) |
| Total | 97,735 (100.0%) | 167,186 (100.0%) |
Real Estate Taxes by Mortgage Status in Macomb County
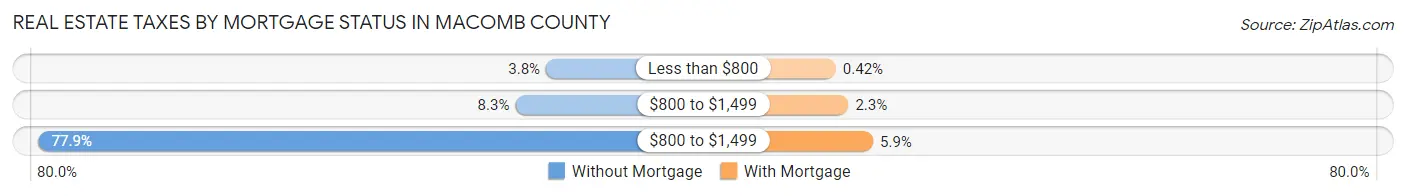
| Property Taxes | Without Mortgage | With Mortgage |
| Less than $800 | 3,731 (3.8%) | 703 (0.4%) |
| $800 to $1,499 | 8,123 (8.3%) | 3,781 (2.3%) |
| $800 to $1,499 | 76,176 (77.9%) | 9,780 (5.9%) |
| Total | 97,735 (100.0%) | 167,186 (100.0%) |
Health & Disability in Macomb County
Health Insurance Coverage by Age in Macomb County
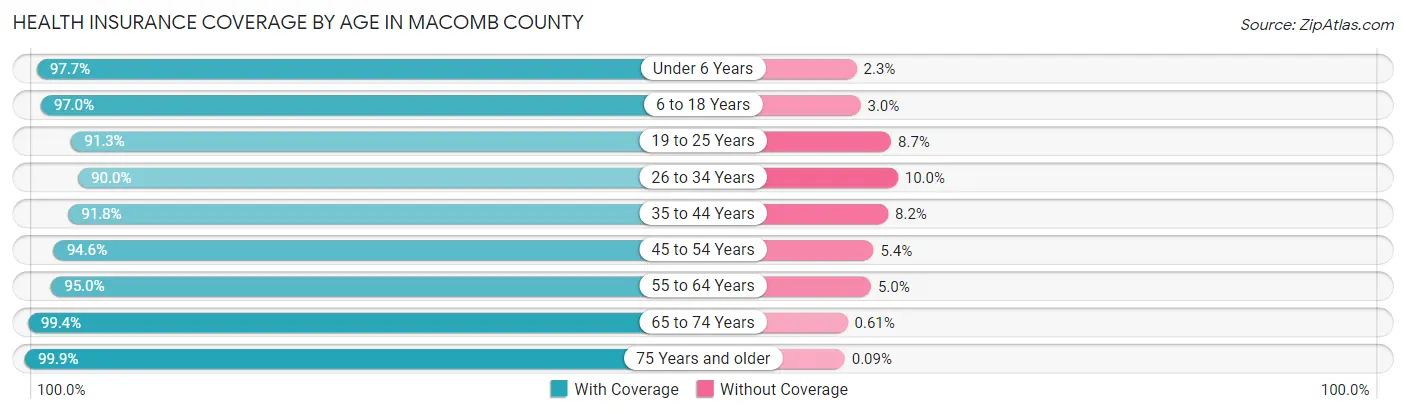
| Age Bracket | With Coverage | Without Coverage |
| Under 6 Years | 54,665 (97.7%) | 1,280 (2.3%) |
| 6 to 18 Years | 132,664 (97.0%) | 4,142 (3.0%) |
| 19 to 25 Years | 67,375 (91.3%) | 6,447 (8.7%) |
| 26 to 34 Years | 95,659 (90.0%) | 10,595 (10.0%) |
| 35 to 44 Years | 96,134 (91.8%) | 8,555 (8.2%) |
| 45 to 54 Years | 111,292 (94.6%) | 6,399 (5.4%) |
| 55 to 64 Years | 119,639 (95.0%) | 6,270 (5.0%) |
| 65 to 74 Years | 88,503 (99.4%) | 539 (0.6%) |
| 75 Years and older | 61,278 (99.9%) | 54 (0.1%) |
| Total | 827,209 (94.9%) | 44,281 (5.1%) |
Health Insurance Coverage by Citizenship Status in Macomb County
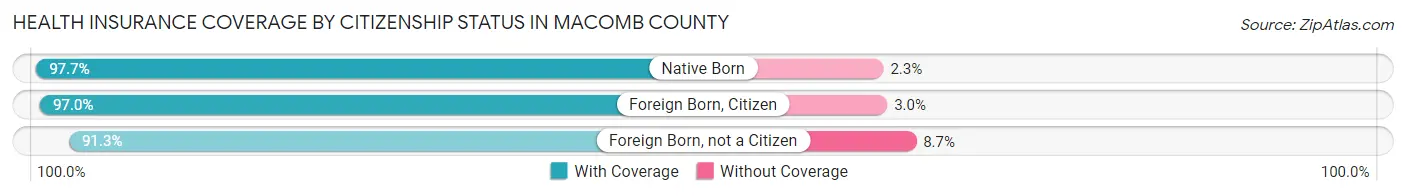
| Citizenship Status | With Coverage | Without Coverage |
| Native Born | 54,665 (97.7%) | 1,280 (2.3%) |
| Foreign Born, Citizen | 132,664 (97.0%) | 4,142 (3.0%) |
| Foreign Born, not a Citizen | 67,375 (91.3%) | 6,447 (8.7%) |
Health Insurance Coverage by Household Income in Macomb County
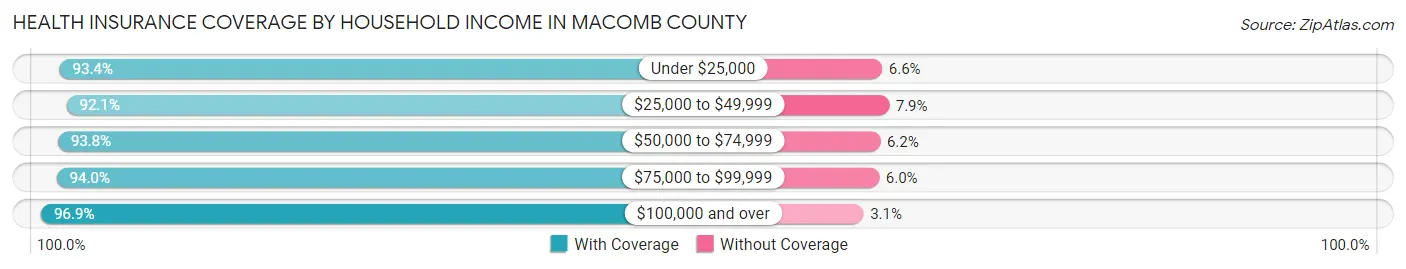
| Household Income | With Coverage | Without Coverage |
| Under $25,000 | 75,907 (93.4%) | 5,338 (6.6%) |
| $25,000 to $49,999 | 122,488 (92.1%) | 10,463 (7.9%) |
| $50,000 to $74,999 | 129,611 (93.8%) | 8,594 (6.2%) |
| $75,000 to $99,999 | 120,689 (94.0%) | 7,709 (6.0%) |
| $100,000 and over | 376,850 (96.9%) | 11,970 (3.1%) |
Public vs Private Health Insurance Coverage by Age in Macomb County
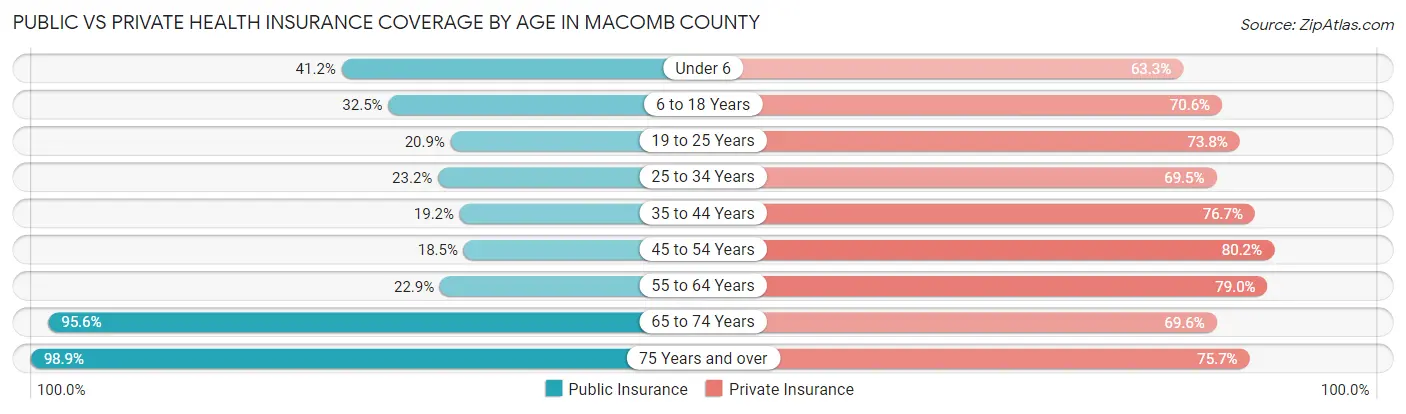
| Age Bracket | Public Insurance | Private Insurance |
| Under 6 | 23,023 (41.1%) | 35,424 (63.3%) |
| 6 to 18 Years | 44,416 (32.5%) | 96,513 (70.6%) |
| 19 to 25 Years | 15,434 (20.9%) | 54,509 (73.8%) |
| 25 to 34 Years | 24,698 (23.2%) | 73,854 (69.5%) |
| 35 to 44 Years | 20,108 (19.2%) | 80,246 (76.6%) |
| 45 to 54 Years | 21,749 (18.5%) | 94,375 (80.2%) |
| 55 to 64 Years | 28,822 (22.9%) | 99,458 (79.0%) |
| 65 to 74 Years | 85,119 (95.6%) | 61,945 (69.6%) |
| 75 Years and over | 60,634 (98.9%) | 46,400 (75.6%) |
| Total | 324,003 (37.2%) | 642,724 (73.8%) |
Disability Status by Sex by Age in Macomb County
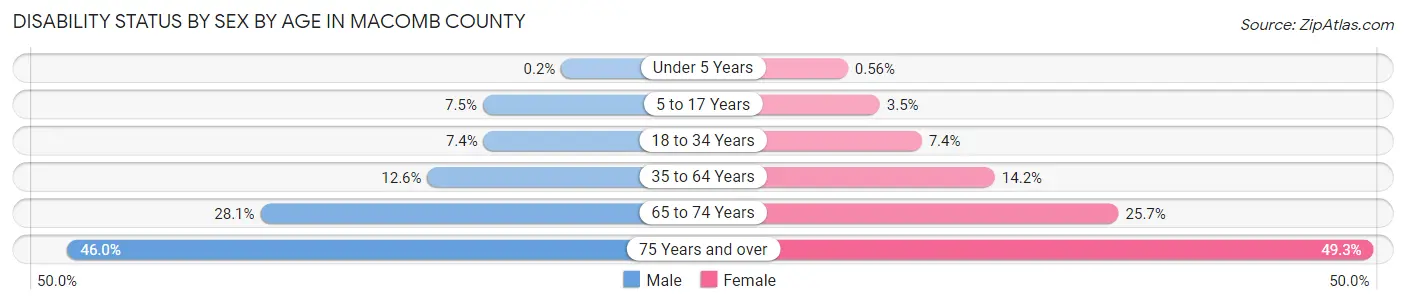
| Age Bracket | Male | Female |
| Under 5 Years | 49 (0.2%) | 128 (0.6%) |
| 5 to 17 Years | 5,205 (7.5%) | 2,331 (3.5%) |
| 18 to 34 Years | 7,117 (7.4%) | 7,000 (7.4%) |
| 35 to 64 Years | 21,604 (12.6%) | 25,158 (14.2%) |
| 65 to 74 Years | 11,726 (28.1%) | 12,163 (25.7%) |
| 75 Years and over | 11,173 (46.0%) | 18,280 (49.3%) |
Disability Class by Sex by Age in Macomb County
Disability Class: Hearing Difficulty
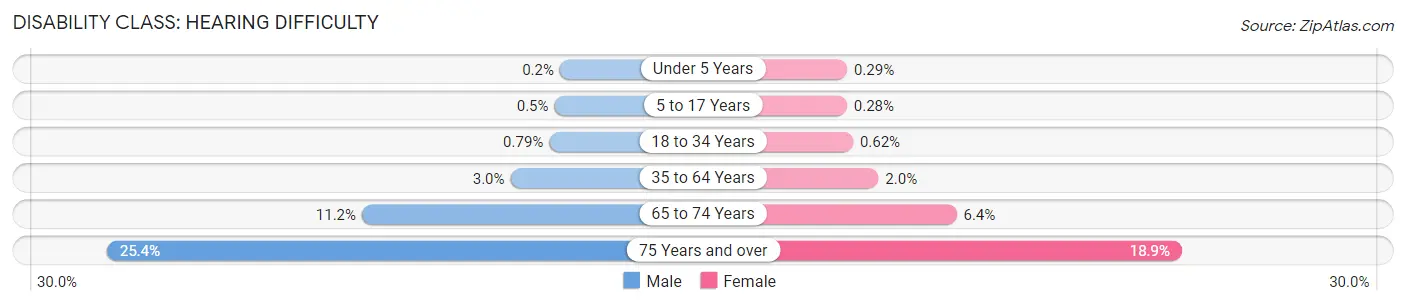
| Age Bracket | Male | Female |
| Under 5 Years | 49 (0.2%) | 67 (0.3%) |
| 5 to 17 Years | 348 (0.5%) | 183 (0.3%) |
| 18 to 34 Years | 762 (0.8%) | 588 (0.6%) |
| 35 to 64 Years | 5,043 (2.9%) | 3,612 (2.0%) |
| 65 to 74 Years | 4,678 (11.2%) | 3,025 (6.4%) |
| 75 Years and over | 6,173 (25.4%) | 7,011 (18.9%) |
Disability Class: Vision Difficulty
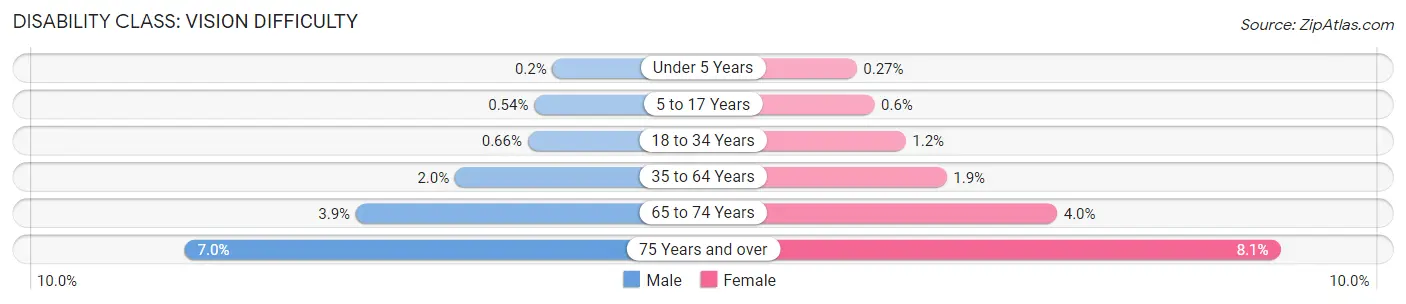
| Age Bracket | Male | Female |
| Under 5 Years | 49 (0.2%) | 61 (0.3%) |
| 5 to 17 Years | 373 (0.5%) | 395 (0.6%) |
| 18 to 34 Years | 636 (0.7%) | 1,114 (1.2%) |
| 35 to 64 Years | 3,435 (2.0%) | 3,434 (1.9%) |
| 65 to 74 Years | 1,604 (3.8%) | 1,890 (4.0%) |
| 75 Years and over | 1,707 (7.0%) | 3,016 (8.1%) |
Disability Class: Cognitive Difficulty
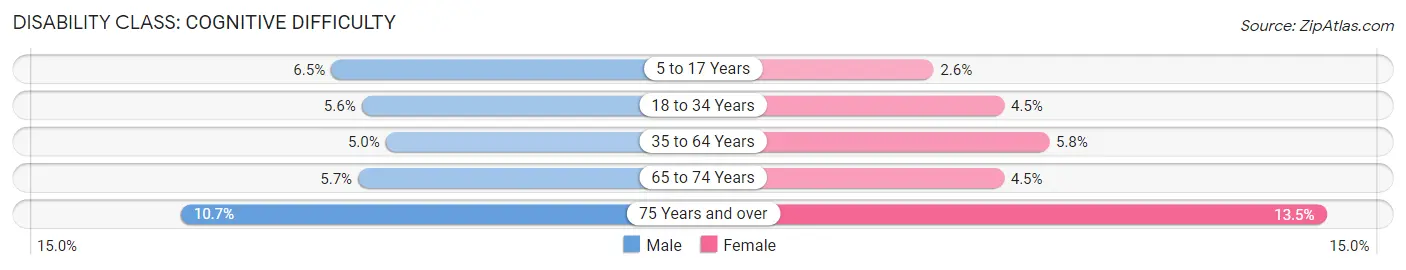
| Age Bracket | Male | Female |
| 5 to 17 Years | 4,500 (6.5%) | 1,686 (2.5%) |
| 18 to 34 Years | 5,399 (5.6%) | 4,262 (4.5%) |
| 35 to 64 Years | 8,476 (5.0%) | 10,211 (5.8%) |
| 65 to 74 Years | 2,385 (5.7%) | 2,136 (4.5%) |
| 75 Years and over | 2,586 (10.6%) | 4,997 (13.5%) |
Disability Class: Ambulatory Difficulty
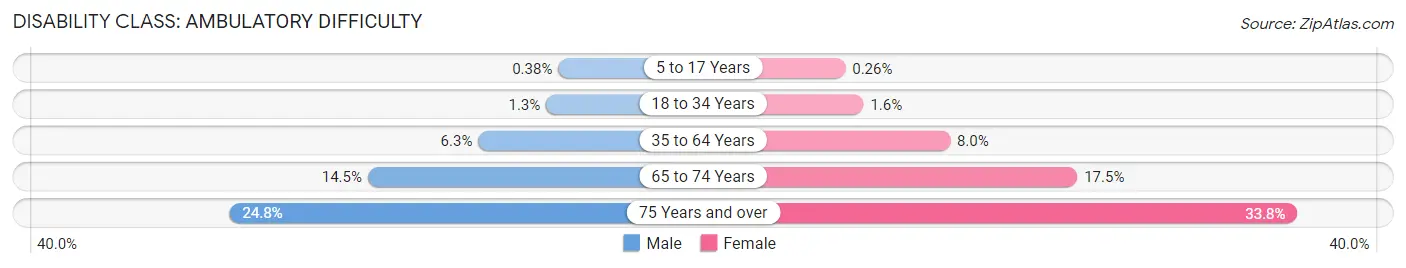
| Age Bracket | Male | Female |
| 5 to 17 Years | 267 (0.4%) | 174 (0.3%) |
| 18 to 34 Years | 1,230 (1.3%) | 1,523 (1.6%) |
| 35 to 64 Years | 10,822 (6.3%) | 14,223 (8.0%) |
| 65 to 74 Years | 6,056 (14.5%) | 8,276 (17.5%) |
| 75 Years and over | 6,020 (24.8%) | 12,530 (33.8%) |
Disability Class: Self-Care Difficulty
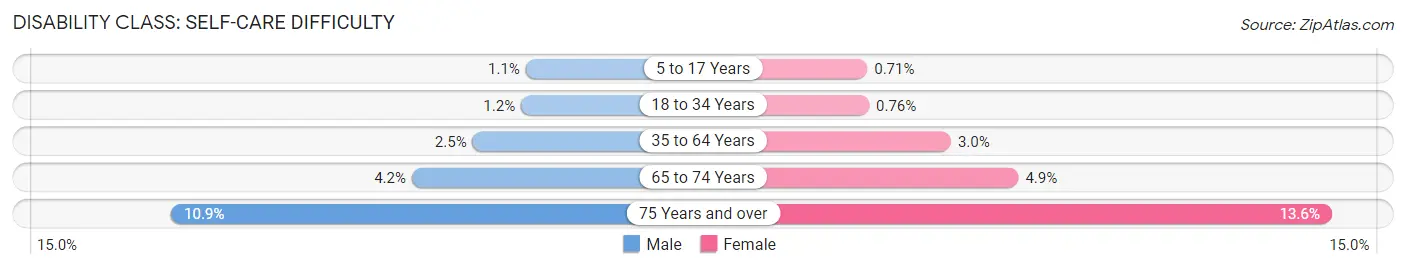
| Age Bracket | Male | Female |
| 5 to 17 Years | 729 (1.1%) | 469 (0.7%) |
| 18 to 34 Years | 1,135 (1.2%) | 719 (0.8%) |
| 35 to 64 Years | 4,338 (2.5%) | 5,392 (3.0%) |
| 65 to 74 Years | 1,761 (4.2%) | 2,331 (4.9%) |
| 75 Years and over | 2,653 (10.9%) | 5,054 (13.6%) |
Technology Access in Macomb County
Computing Device Access in Macomb County
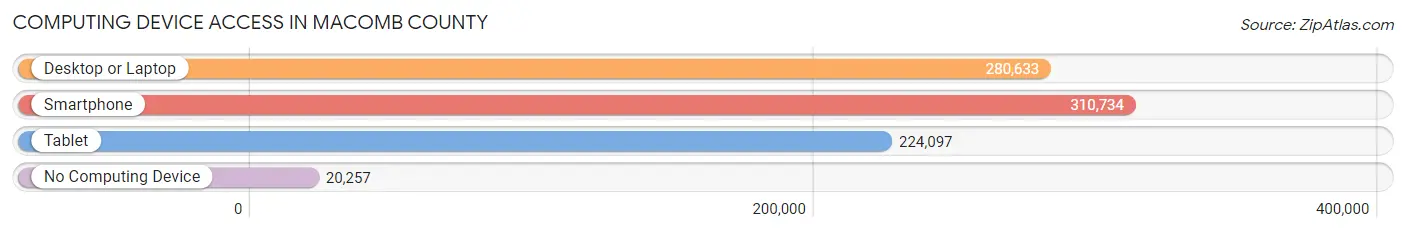
| Device Type | # Households | % Households |
| Desktop or Laptop | 280,633 | 79.2% |
| Smartphone | 310,734 | 87.7% |
| Tablet | 224,097 | 63.3% |
| No Computing Device | 20,257 | 5.7% |
| Total | 354,251 | 100.0% |
Internet Access in Macomb County
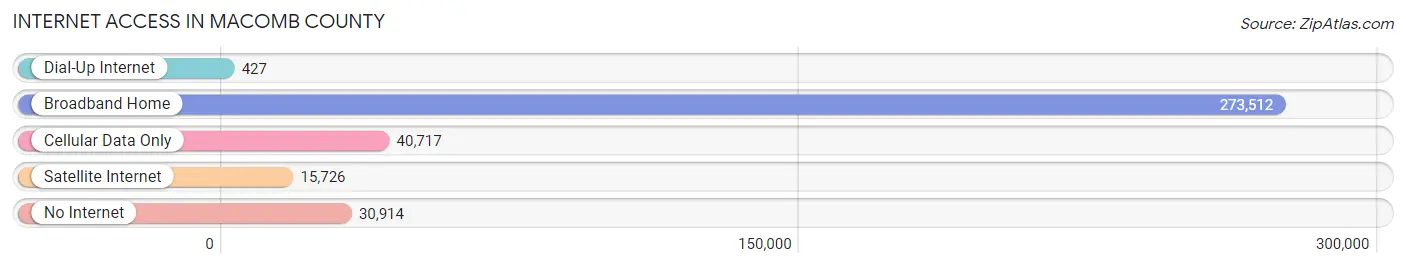
| Internet Type | # Households | % Households |
| Dial-Up Internet | 427 | 0.1% |
| Broadband Home | 273,512 | 77.2% |
| Cellular Data Only | 40,717 | 11.5% |
| Satellite Internet | 15,726 | 4.4% |
| No Internet | 30,914 | 8.7% |
| Total | 354,251 | 100.0% |
Macomb County Summary
Macomb County, Michigan is located in the southeastern corner of the state, just north of Detroit. It is the third most populous county in Michigan, with a population of 863,000 in 2019. The county seat is Mount Clemens, and the county is part of the Detroit metropolitan area.
History
Macomb County was established in 1818, and was named after General Alexander Macomb, a hero of the War of 1812. The county was originally part of Wayne County, but was split off in 1818. The county was initially sparsely populated, but began to grow rapidly in the mid-19th century with the arrival of immigrants from Europe. The county was also home to a large number of Native American tribes, including the Potawatomi, Ottawa, and Chippewa.
Geography
Macomb County is located in the southeastern corner of Michigan, just north of Detroit. It is bordered by Lake St. Clair to the east, Oakland County to the north, Wayne County to the west, and St. Clair County to the south. The county covers an area of 573 square miles, and is home to numerous lakes, rivers, and streams. The county is also home to several state parks, including Stony Creek Metropark, Lake St. Clair Metropark, and Wolcott Mill Metropark.
Economy
Macomb County has a diverse economy, with a mix of manufacturing, retail, and service industries. The county is home to several major employers, including Fiat Chrysler Automobiles, General Motors, and St. John Providence Health System. The county is also home to several universities and colleges, including Macomb Community College, Oakland University, and Wayne State University.
Demographics
As of 2019, Macomb County had a population of 863,000. The population is predominantly white (77.3%), with smaller percentages of African American (14.2%), Asian (3.7%), and Hispanic (3.2%) residents. The median household income is $63,000, and the median home value is $170,000. The county has a high rate of homeownership (77.3%), and a low rate of poverty (9.2%).
Macomb County is a diverse and vibrant county with a rich history and a strong economy. It is home to a variety of industries, universities, and parks, and is a great place to live and work.
Common Questions
What is Per Capita Income in Macomb County?
Per Capita income in Macomb County is $38,015.
What is the Median Family Income in Macomb County?
Median Family Income in Macomb County is $92,227.
What is the Median Household income in Macomb County?
Median Household Income in Macomb County is $73,876.
What is Income or Wage Gap in Macomb County?
Income or Wage Gap in Macomb County is 34.0%.
Women in Macomb County earn 66.0 cents for every dollar earned by a man.
What is Family Income Deficit in Macomb County?
Family Income Deficit in Macomb County is $9,991.
Families that are below poverty line in Macomb County earn $9,991 less on average than the poverty threshold level.
What is Inequality or Gini Index in Macomb County?
Inequality or Gini Index in Macomb County is 0.43.
What is the Total Population of Macomb County?
Total Population of Macomb County is 878,453.
What is the Total Male Population of Macomb County?
Total Male Population of Macomb County is 431,113.
What is the Total Female Population of Macomb County?
Total Female Population of Macomb County is 447,340.
What is the Ratio of Males per 100 Females in Macomb County?
There are 96.37 Males per 100 Females in Macomb County.
What is the Ratio of Females per 100 Males in Macomb County?
There are 103.76 Females per 100 Males in Macomb County.
What is the Median Population Age in Macomb County?
Median Population Age in Macomb County is 41.0 Years.
What is the Average Family Size in Macomb County
Average Family Size in Macomb County is 3.1 People.
What is the Average Household Size in Macomb County
Average Household Size in Macomb County is 2.5 People.
How Large is the Labor Force in Macomb County?
There are 460,314 People in the Labor Forcein in Macomb County.
What is the Percentage of People in the Labor Force in Macomb County?
64.0% of People are in the Labor Force in Macomb County.
What is the Unemployment Rate in Macomb County?
Unemployment Rate in Macomb County is 5.7%.