Muskegon County, MI Map & Demographics
Muskegon County Map
Muskegon County Overview
$30,812
PER CAPITA INCOME
$73,824
AVG FAMILY INCOME
$61,347
AVG HOUSEHOLD INCOME
29.1%
WAGE / INCOME GAP [ % ]
70.9¢/ $1
WAGE / INCOME GAP [ $ ]
$10,855
FAMILY INCOME DEFICIT
0.44
INEQUALITY / GINI INDEX
175,947
TOTAL POPULATION
88,360
MALE POPULATION
87,587
FEMALE POPULATION
100.88
MALES / 100 FEMALES
99.13
FEMALES / 100 MALES
39.4
MEDIAN AGE
3.1
AVG FAMILY SIZE
2.5
AVG HOUSEHOLD SIZE
83,413
LABOR FORCE [ PEOPLE ]
59.2%
PERCENT IN LABOR FORCE
7.5%
UNEMPLOYMENT RATE
Income in Muskegon County
Income Overview in Muskegon County
Per Capita Income in Muskegon County is $30,812, while median incomes of families and households are $73,824 and $61,347 respectively.
| Characteristic | Number | Measure |
| Per Capita Income | 175,947 | $30,812 |
| Median Family Income | 44,773 | $73,824 |
| Mean Family Income | 44,773 | $90,256 |
| Median Household Income | 66,595 | $61,347 |
| Mean Household Income | 66,595 | $78,993 |
| Income Deficit | 44,773 | $10,855 |
| Wage / Income Gap (%) | 175,947 | 29.06% |
| Wage / Income Gap ($) | 175,947 | 70.94¢ per $1 |
| Gini / Inequality Index | 175,947 | 0.44 |
Earnings by Sex in Muskegon County
Average Earnings in Muskegon County are $35,607, $42,272 for men and $29,989 for women, a difference of 29.1%.
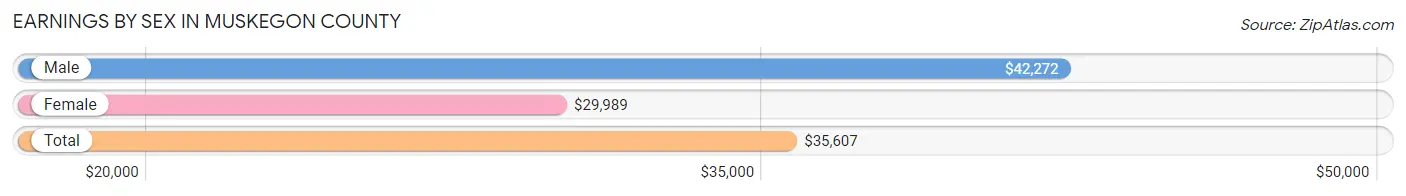
| Sex | Number | Average Earnings |
| Male | 44,891 (51.7%) | $42,272 |
| Female | 41,921 (48.3%) | $29,989 |
| Total | 86,812 (100.0%) | $35,607 |
Earnings by Sex by Income Bracket in Muskegon County
The most common earnings brackets in Muskegon County are $75,000 to $99,999 for men (4,488 | 10.0%) and $30,000 to $34,999 for women (3,345 | 8.0%).
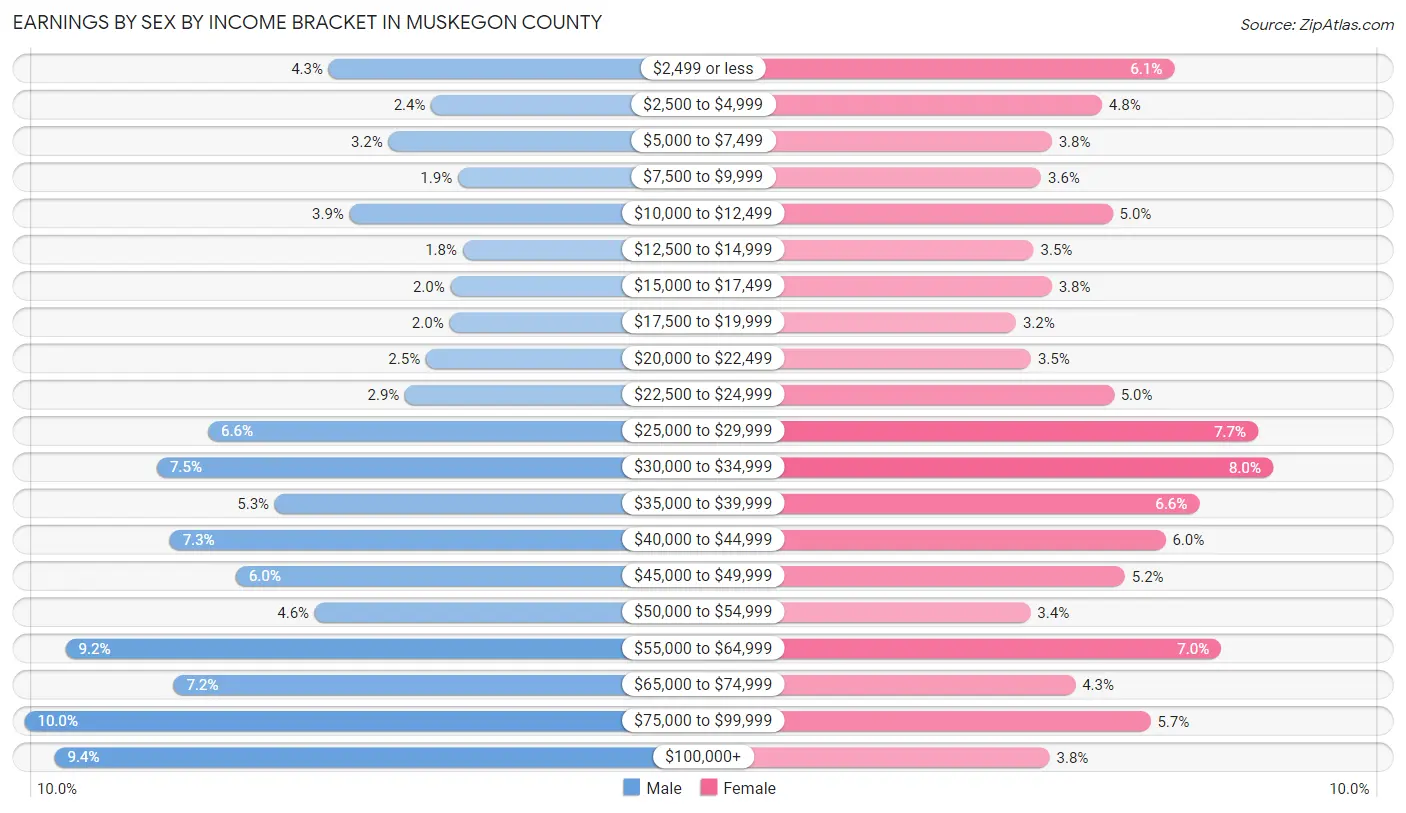
| Income | Male | Female |
| $2,499 or less | 1,929 (4.3%) | 2,568 (6.1%) |
| $2,500 to $4,999 | 1,069 (2.4%) | 2,004 (4.8%) |
| $5,000 to $7,499 | 1,426 (3.2%) | 1,610 (3.8%) |
| $7,500 to $9,999 | 844 (1.9%) | 1,525 (3.6%) |
| $10,000 to $12,499 | 1,756 (3.9%) | 2,087 (5.0%) |
| $12,500 to $14,999 | 805 (1.8%) | 1,469 (3.5%) |
| $15,000 to $17,499 | 908 (2.0%) | 1,609 (3.8%) |
| $17,500 to $19,999 | 917 (2.0%) | 1,327 (3.2%) |
| $20,000 to $22,499 | 1,114 (2.5%) | 1,446 (3.5%) |
| $22,500 to $24,999 | 1,287 (2.9%) | 2,096 (5.0%) |
| $25,000 to $29,999 | 2,947 (6.6%) | 3,226 (7.7%) |
| $30,000 to $34,999 | 3,374 (7.5%) | 3,345 (8.0%) |
| $35,000 to $39,999 | 2,383 (5.3%) | 2,768 (6.6%) |
| $40,000 to $44,999 | 3,266 (7.3%) | 2,503 (6.0%) |
| $45,000 to $49,999 | 2,712 (6.0%) | 2,183 (5.2%) |
| $50,000 to $54,999 | 2,049 (4.6%) | 1,440 (3.4%) |
| $55,000 to $64,999 | 4,144 (9.2%) | 2,940 (7.0%) |
| $65,000 to $74,999 | 3,235 (7.2%) | 1,795 (4.3%) |
| $75,000 to $99,999 | 4,488 (10.0%) | 2,386 (5.7%) |
| $100,000+ | 4,238 (9.4%) | 1,594 (3.8%) |
| Total | 44,891 (100.0%) | 41,921 (100.0%) |
Earnings by Sex by Educational Attainment in Muskegon County
Average earnings in Muskegon County are $46,833 for men and $34,614 for women, a difference of 26.1%. Men with an educational attainment of graduate degree enjoy the highest average annual earnings of $81,595, while those with less than high school education earn the least with $32,564. Women with an educational attainment of graduate degree earn the most with the average annual earnings of $67,936, while those with high school diploma education have the smallest earnings of $27,896.
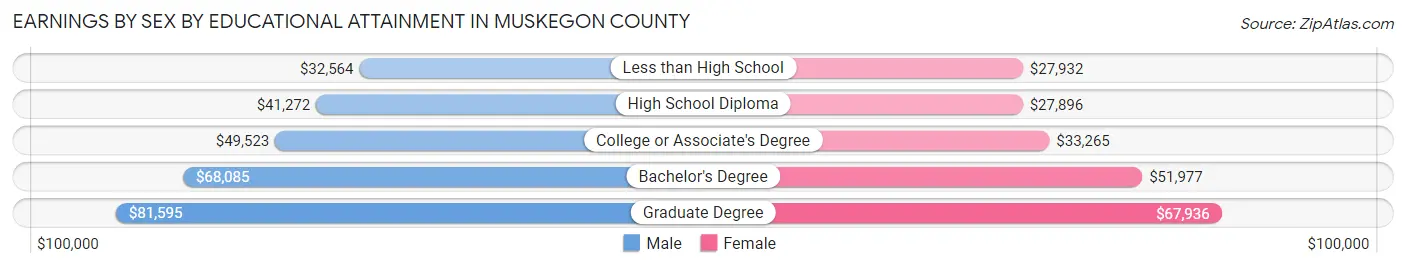
| Educational Attainment | Male Income | Female Income |
| Less than High School | $32,564 | $27,932 |
| High School Diploma | $41,272 | $27,896 |
| College or Associate's Degree | $49,523 | $33,265 |
| Bachelor's Degree | $68,085 | $51,977 |
| Graduate Degree | $81,595 | $67,936 |
| Total | $46,833 | $34,614 |
Family Income in Muskegon County
Family Income Brackets in Muskegon County
According to the Muskegon County family income data, there are 8,910 families falling into the $50,000 to $74,999 income range, which is the most common income bracket and makes up 19.9% of all families. Conversely, the $10,000 to $14,999 income bracket is the least frequent group with only 1,030 families (2.3%) belonging to this category.
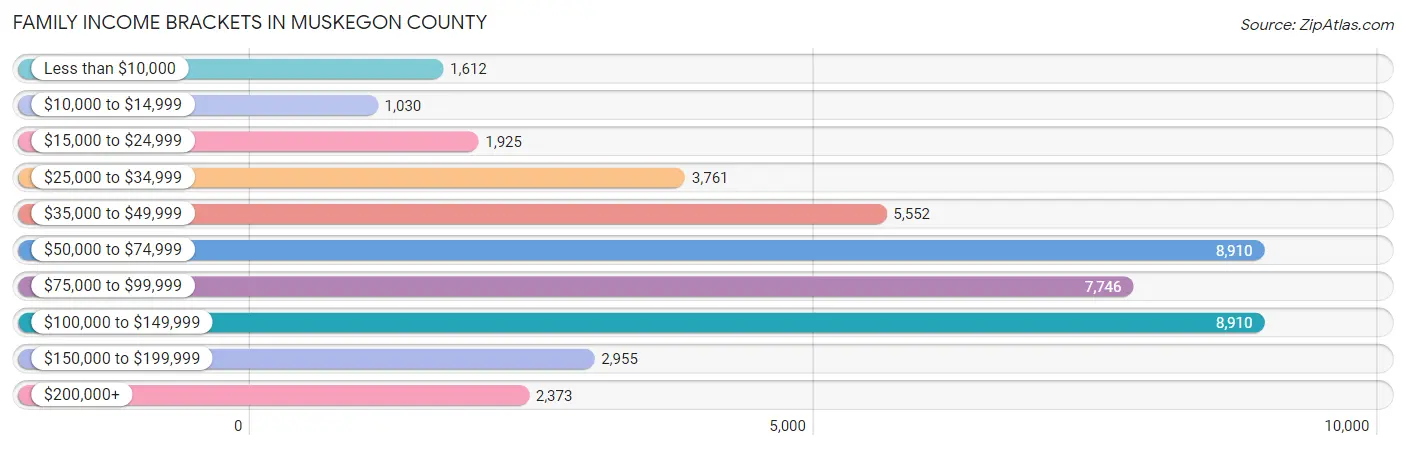
| Income Bracket | # Families | % Families |
| Less than $10,000 | 1,612 | 3.6% |
| $10,000 to $14,999 | 1,030 | 2.3% |
| $15,000 to $24,999 | 1,925 | 4.3% |
| $25,000 to $34,999 | 3,761 | 8.4% |
| $35,000 to $49,999 | 5,552 | 12.4% |
| $50,000 to $74,999 | 8,910 | 19.9% |
| $75,000 to $99,999 | 7,746 | 17.3% |
| $100,000 to $149,999 | 8,910 | 19.9% |
| $150,000 to $199,999 | 2,955 | 6.6% |
| $200,000+ | 2,373 | 5.3% |
Family Income by Famaliy Size in Muskegon County
7+ person families (639 | 1.4%) account for the highest median family income in Muskegon County with $103,862 per family, while 2-person families (22,552 | 50.4%) have the highest median income of $33,520 per family member.
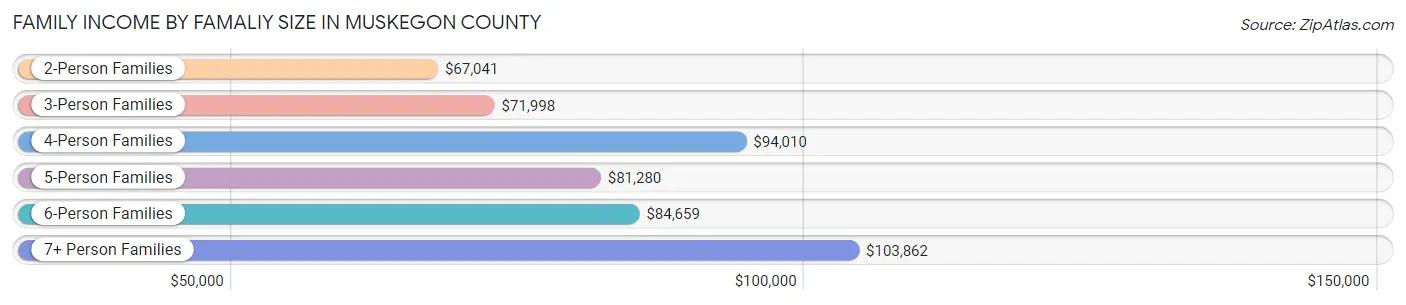
| Income Bracket | # Families | Median Income |
| 2-Person Families | 22,552 (50.4%) | $67,041 |
| 3-Person Families | 9,528 (21.3%) | $71,998 |
| 4-Person Families | 7,339 (16.4%) | $94,010 |
| 5-Person Families | 3,247 (7.2%) | $81,280 |
| 6-Person Families | 1,468 (3.3%) | $84,659 |
| 7+ Person Families | 639 (1.4%) | $103,862 |
| Total | 44,773 (100.0%) | $73,824 |
Family Income by Number of Earners in Muskegon County
The median family income in Muskegon County is $73,824, with families comprising 3+ earners (5,518) having the highest median family income of $119,607, while families with no earners (8,261) have the lowest median family income of $45,914, accounting for 12.3% and 18.4% of families, respectively.
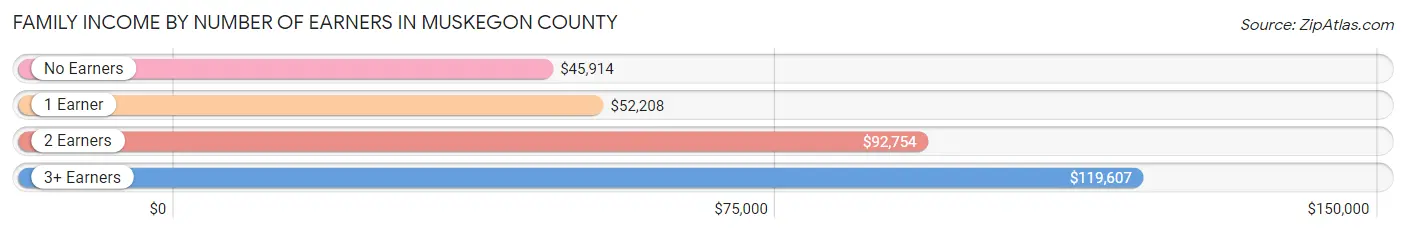
| Number of Earners | # Families | Median Income |
| No Earners | 8,261 (18.4%) | $45,914 |
| 1 Earner | 15,262 (34.1%) | $52,208 |
| 2 Earners | 15,732 (35.1%) | $92,754 |
| 3+ Earners | 5,518 (12.3%) | $119,607 |
| Total | 44,773 (100.0%) | $73,824 |
Household Income in Muskegon County
Household Income Brackets in Muskegon County
With 13,186 households falling in the category, the $50,000 to $74,999 income range is the most frequent in Muskegon County, accounting for 19.8% of all households. In contrast, only 2,664 households (4.0%) fall into the $200,000+ income bracket, making it the least populous group.
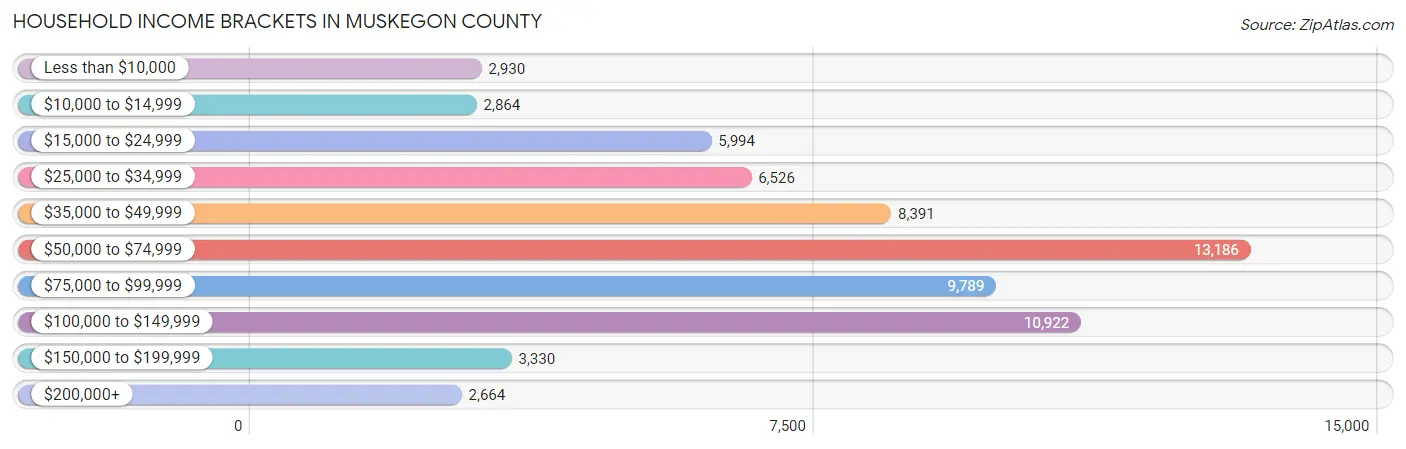
| Income Bracket | # Households | % Households |
| Less than $10,000 | 2,930 | 4.4% |
| $10,000 to $14,999 | 2,864 | 4.3% |
| $15,000 to $24,999 | 5,994 | 9.0% |
| $25,000 to $34,999 | 6,526 | 9.8% |
| $35,000 to $49,999 | 8,391 | 12.6% |
| $50,000 to $74,999 | 13,186 | 19.8% |
| $75,000 to $99,999 | 9,789 | 14.7% |
| $100,000 to $149,999 | 10,922 | 16.4% |
| $150,000 to $199,999 | 3,330 | 5.0% |
| $200,000+ | 2,664 | 4.0% |
Household Income by Householder Age in Muskegon County
The median household income in Muskegon County is $61,347, with the highest median household income of $71,790 found in the 45 to 64 years age bracket for the primary householder. A total of 24,824 households (37.3%) fall into this category. Meanwhile, the 65+ years age bracket for the primary householder has the lowest median household income of $45,685, with 19,391 households (29.1%) in this group.
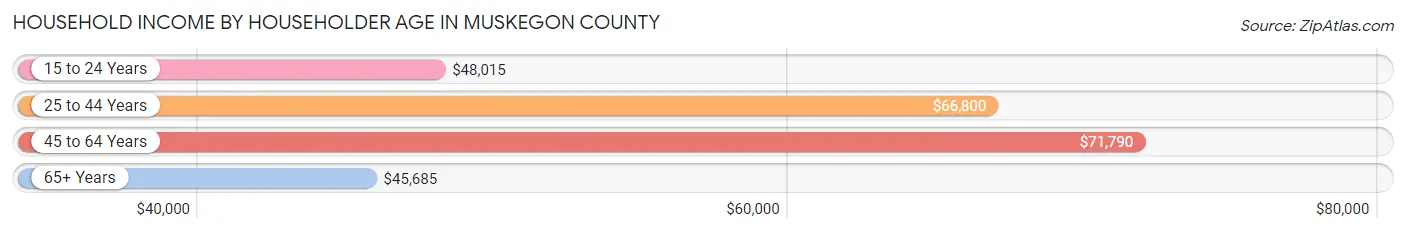
| Income Bracket | # Households | Median Income |
| 15 to 24 Years | 2,319 (3.5%) | $48,015 |
| 25 to 44 Years | 20,061 (30.1%) | $66,800 |
| 45 to 64 Years | 24,824 (37.3%) | $71,790 |
| 65+ Years | 19,391 (29.1%) | $45,685 |
| Total | 66,595 (100.0%) | $61,347 |
Poverty in Muskegon County
Income Below Poverty by Sex and Age in Muskegon County
With 12.2% poverty level for males and 13.6% for females among the residents of Muskegon County, 12 to 14 year old males and 15 year old females are the most vulnerable to poverty, with 717 males (20.9%) and 264 females (27.6%) in their respective age groups living below the poverty level.
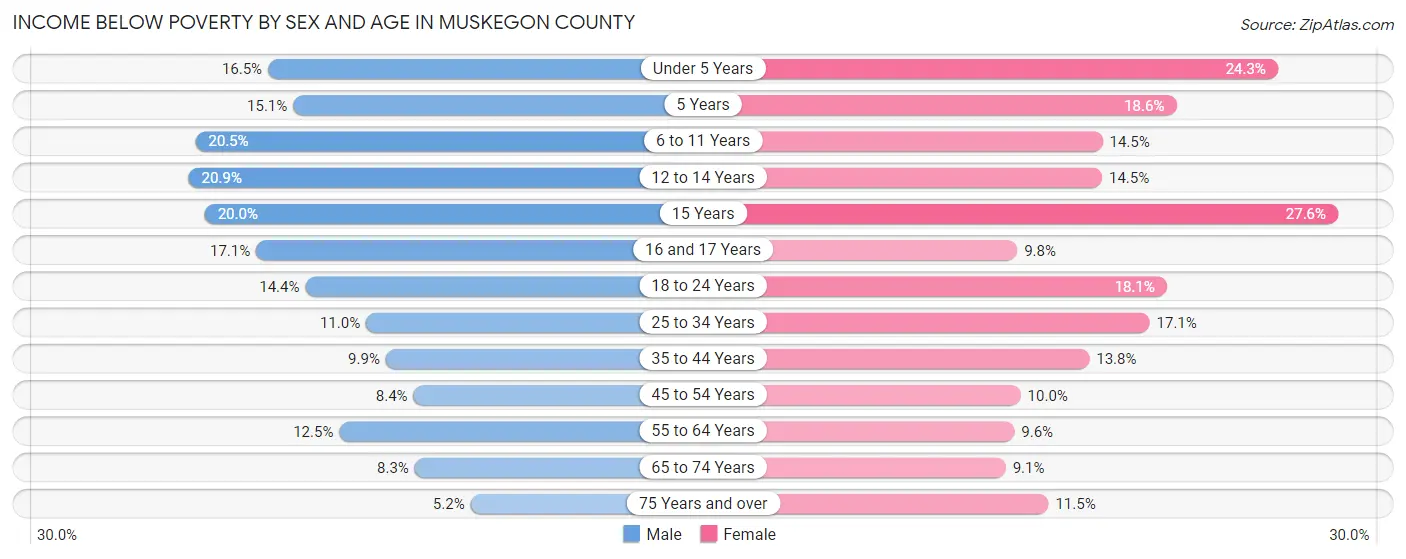
| Age Bracket | Male | Female |
| Under 5 Years | 852 (16.5%) | 1,192 (24.3%) |
| 5 Years | 165 (15.0%) | 211 (18.6%) |
| 6 to 11 Years | 1,329 (20.5%) | 955 (14.5%) |
| 12 to 14 Years | 717 (20.9%) | 436 (14.5%) |
| 15 Years | 275 (20.0%) | 264 (27.6%) |
| 16 and 17 Years | 378 (17.1%) | 237 (9.8%) |
| 18 to 24 Years | 1,017 (14.4%) | 1,182 (18.1%) |
| 25 to 34 Years | 1,226 (11.0%) | 1,888 (17.1%) |
| 35 to 44 Years | 1,036 (9.9%) | 1,458 (13.8%) |
| 45 to 54 Years | 853 (8.4%) | 996 (10.0%) |
| 55 to 64 Years | 1,429 (12.5%) | 1,186 (9.6%) |
| 65 to 74 Years | 719 (8.3%) | 878 (9.1%) |
| 75 Years and over | 250 (5.2%) | 794 (11.5%) |
| Total | 10,246 (12.2%) | 11,677 (13.6%) |
Income Above Poverty by Sex and Age in Muskegon County
According to the poverty statistics in Muskegon County, males aged 75 years and over and females aged 65 to 74 years are the age groups that are most secure financially, with 94.8% of males and 90.9% of females in these age groups living above the poverty line.
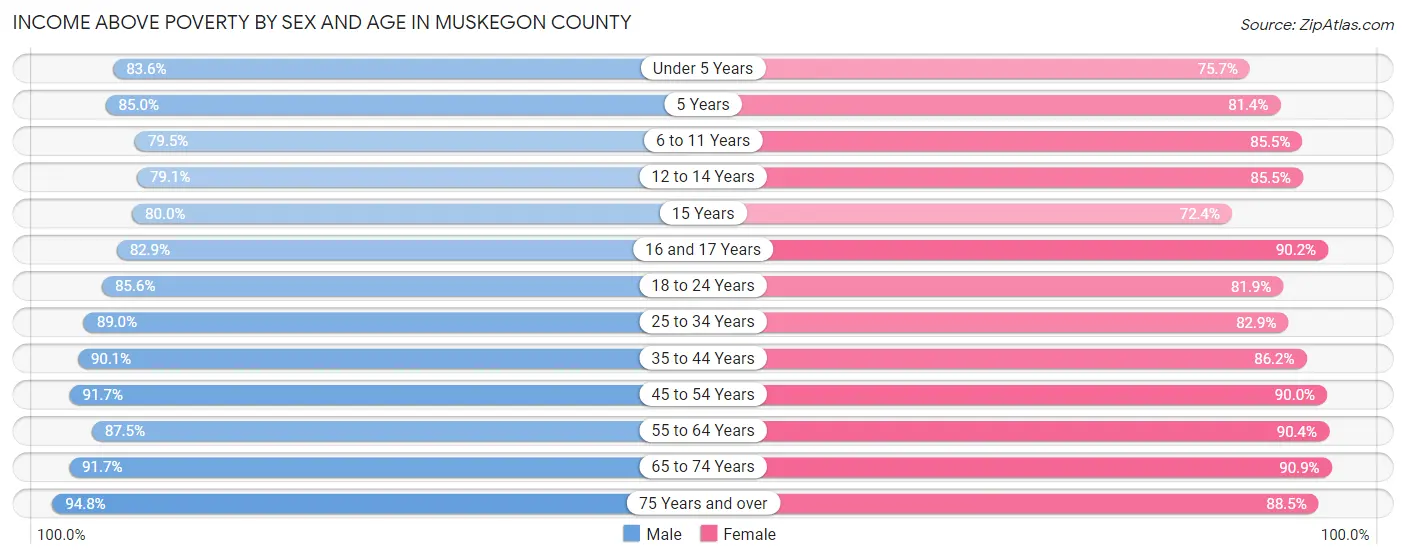
| Age Bracket | Male | Female |
| Under 5 Years | 4,326 (83.6%) | 3,720 (75.7%) |
| 5 Years | 931 (85.0%) | 922 (81.4%) |
| 6 to 11 Years | 5,156 (79.5%) | 5,620 (85.5%) |
| 12 to 14 Years | 2,718 (79.1%) | 2,574 (85.5%) |
| 15 Years | 1,102 (80.0%) | 692 (72.4%) |
| 16 and 17 Years | 1,831 (82.9%) | 2,190 (90.2%) |
| 18 to 24 Years | 6,058 (85.6%) | 5,351 (81.9%) |
| 25 to 34 Years | 9,927 (89.0%) | 9,124 (82.9%) |
| 35 to 44 Years | 9,442 (90.1%) | 9,126 (86.2%) |
| 45 to 54 Years | 9,368 (91.6%) | 9,002 (90.0%) |
| 55 to 64 Years | 10,020 (87.5%) | 11,157 (90.4%) |
| 65 to 74 Years | 7,967 (91.7%) | 8,737 (90.9%) |
| 75 Years and over | 4,584 (94.8%) | 6,104 (88.5%) |
| Total | 73,430 (87.8%) | 74,319 (86.4%) |
Income Below Poverty Among Married-Couple Families in Muskegon County
The poverty statistics for married-couple families in Muskegon County show that 4.2% or 1,331 of the total 31,395 families live below the poverty line. Families with 5 or more children have the highest poverty rate of 9.6%, comprising of 29 families. On the other hand, families with no children have the lowest poverty rate of 3.4%, which includes 670 families.
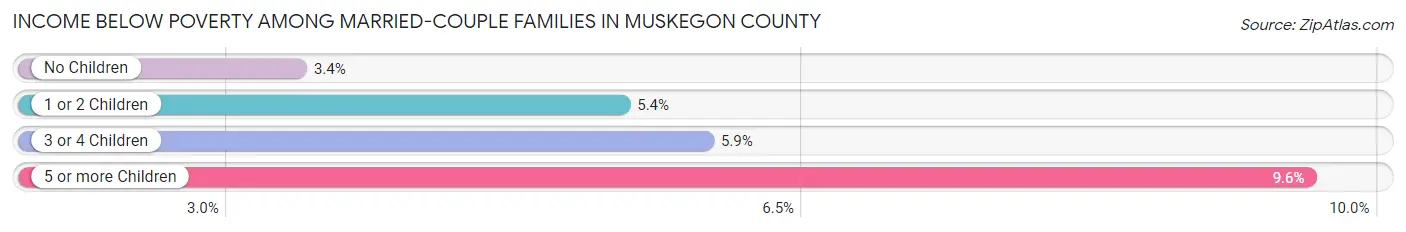
| Children | Above Poverty | Below Poverty |
| No Children | 18,938 (96.6%) | 670 (3.4%) |
| 1 or 2 Children | 8,363 (94.6%) | 476 (5.4%) |
| 3 or 4 Children | 2,489 (94.1%) | 156 (5.9%) |
| 5 or more Children | 274 (90.4%) | 29 (9.6%) |
| Total | 30,064 (95.8%) | 1,331 (4.2%) |
Income Below Poverty Among Single-Parent Households in Muskegon County
According to the poverty data in Muskegon County, 9.3% or 338 single-father households and 26.6% or 2,593 single-mother households are living below the poverty line. Among single-father households, those with 5 or more children have the highest poverty rate, with 57 households (85.1%) experiencing poverty. Likewise, among single-mother households, those with 5 or more children have the highest poverty rate, with 79 households (96.3%) falling below the poverty line.
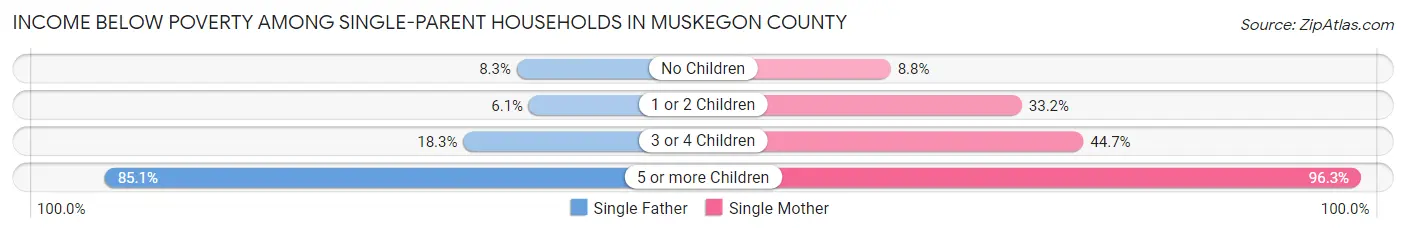
| Children | Single Father | Single Mother |
| No Children | 127 (8.3%) | 290 (8.8%) |
| 1 or 2 Children | 109 (6.1%) | 1,769 (33.2%) |
| 3 or 4 Children | 45 (18.3%) | 455 (44.7%) |
| 5 or more Children | 57 (85.1%) | 79 (96.3%) |
| Total | 338 (9.3%) | 2,593 (26.6%) |
Income Below Poverty Among Married-Couple vs Single-Parent Households in Muskegon County
The poverty data for Muskegon County shows that 1,331 of the married-couple family households (4.2%) and 2,931 of the single-parent households (21.9%) are living below the poverty level. Within the married-couple family households, those with 5 or more children have the highest poverty rate, with 29 households (9.6%) falling below the poverty line. Among the single-parent households, those with 5 or more children have the highest poverty rate, with 136 household (91.3%) living below poverty.
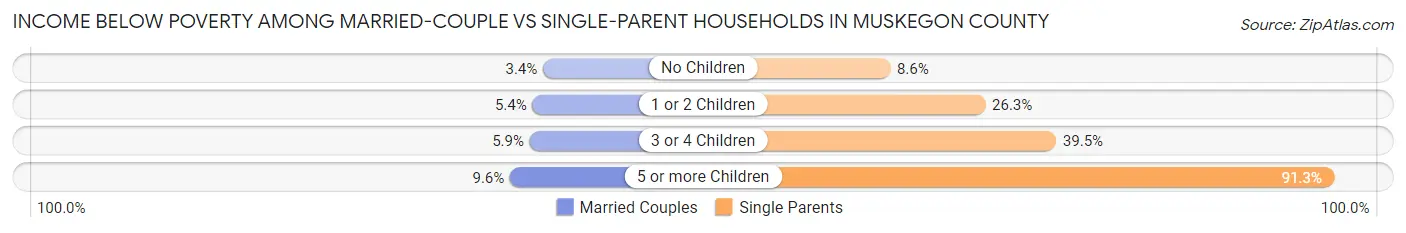
| Children | Married-Couple Families | Single-Parent Households |
| No Children | 670 (3.4%) | 417 (8.6%) |
| 1 or 2 Children | 476 (5.4%) | 1,878 (26.3%) |
| 3 or 4 Children | 156 (5.9%) | 500 (39.5%) |
| 5 or more Children | 29 (9.6%) | 136 (91.3%) |
| Total | 1,331 (4.2%) | 2,931 (21.9%) |
Race in Muskegon County
The most populous races in Muskegon County are White / Caucasian (137,379 | 78.1%), Black / African American (23,050 | 13.1%), and Two or more Races (11,576 | 6.6%).
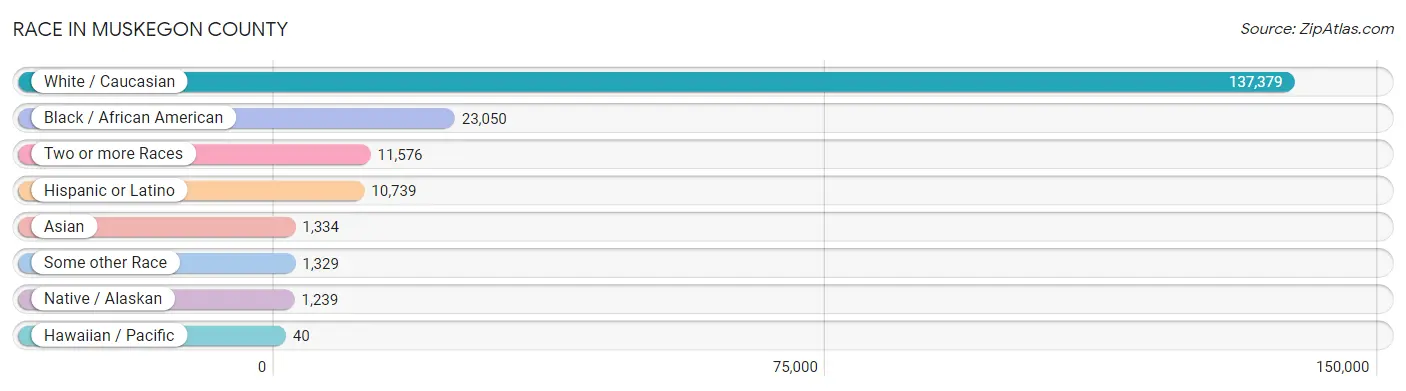
| Race | # Population | % Population |
| Asian | 1,334 | 0.8% |
| Black / African American | 23,050 | 13.1% |
| Hawaiian / Pacific | 40 | 0.0% |
| Hispanic or Latino | 10,739 | 6.1% |
| Native / Alaskan | 1,239 | 0.7% |
| White / Caucasian | 137,379 | 78.1% |
| Two or more Races | 11,576 | 6.6% |
| Some other Race | 1,329 | 0.8% |
| Total | 175,947 | 100.0% |
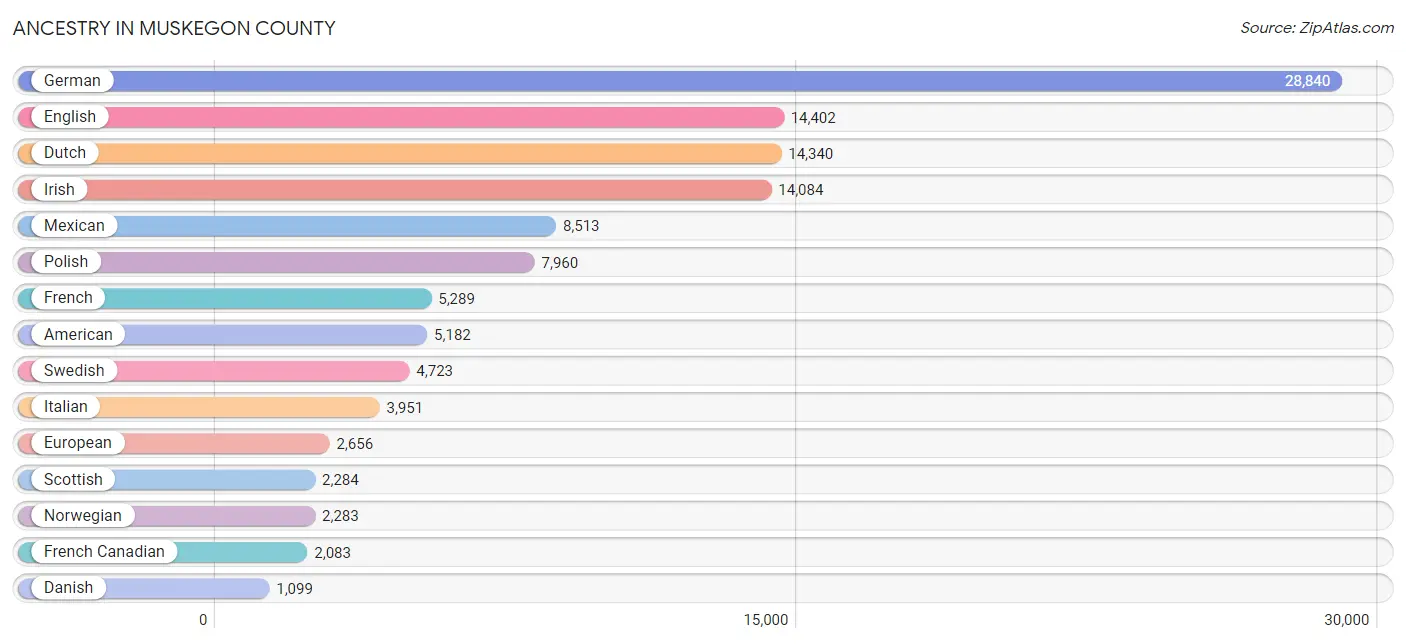
Ancestry in Muskegon County
The most populous ancestries reported in Muskegon County are German (28,840 | 16.4%), English (14,402 | 8.2%), Dutch (14,340 | 8.2%), Irish (14,084 | 8.0%), and Mexican (8,513 | 4.8%), together accounting for 45.6% of all Muskegon County residents.
| Ancestry | # Population | % Population |
| Afghan | 8 | 0.0% |
| African | 611 | 0.4% |
| Albanian | 2 | 0.0% |
| American | 5,182 | 2.9% |
| Apache | 54 | 0.0% |
| Arab | 149 | 0.1% |
| Argentinean | 2 | 0.0% |
| Armenian | 1 | 0.0% |
| Assyrian / Chaldean / Syriac | 6 | 0.0% |
| Australian | 77 | 0.0% |
| Austrian | 281 | 0.2% |
| Bangladeshi | 4 | 0.0% |
| Basque | 10 | 0.0% |
| Belgian | 378 | 0.2% |
| Bhutanese | 185 | 0.1% |
| Blackfeet | 118 | 0.1% |
| Bolivian | 10 | 0.0% |
| Brazilian | 17 | 0.0% |
| British | 591 | 0.3% |
| Bulgarian | 81 | 0.1% |
| Burmese | 758 | 0.4% |
| Canadian | 103 | 0.1% |
| Celtic | 44 | 0.0% |
| Central American | 553 | 0.3% |
| Central American Indian | 30 | 0.0% |
| Cherokee | 264 | 0.2% |
| Chilean | 30 | 0.0% |
| Chippewa | 510 | 0.3% |
| Choctaw | 8 | 0.0% |
| Colombian | 19 | 0.0% |
| Colville | 16 | 0.0% |
| Costa Rican | 69 | 0.0% |
| Cree | 16 | 0.0% |
| Croatian | 89 | 0.1% |
| Crow | 7 | 0.0% |
| Cuban | 134 | 0.1% |
| Czech | 802 | 0.5% |
| Czechoslovakian | 230 | 0.1% |
| Danish | 1,099 | 0.6% |
| Dominican | 284 | 0.2% |
| Dutch | 14,340 | 8.2% |
| Eastern European | 174 | 0.1% |
| Egyptian | 16 | 0.0% |
| English | 14,402 | 8.2% |
| Estonian | 11 | 0.0% |
| Ethiopian | 13 | 0.0% |
| European | 2,656 | 1.5% |
| Finnish | 944 | 0.5% |
| French | 5,289 | 3.0% |
| French American Indian | 3 | 0.0% |
| French Canadian | 2,083 | 1.2% |
| German | 28,840 | 16.4% |
| Ghanaian | 16 | 0.0% |
| Greek | 419 | 0.2% |
| Guamanian / Chamorro | 14 | 0.0% |
| Guatemalan | 194 | 0.1% |
| Honduran | 30 | 0.0% |
| Hungarian | 976 | 0.5% |
| Icelander | 6 | 0.0% |
| Indian (Asian) | 275 | 0.2% |
| Inupiat | 16 | 0.0% |
| Iranian | 9 | 0.0% |
| Iraqi | 59 | 0.0% |
| Irish | 14,084 | 8.0% |
| Iroquois | 106 | 0.1% |
| Italian | 3,951 | 2.2% |
| Jamaican | 143 | 0.1% |
| Japanese | 10 | 0.0% |
| Korean | 291 | 0.2% |
| Laotian | 6 | 0.0% |
| Latvian | 35 | 0.0% |
| Lebanese | 45 | 0.0% |
| Liberian | 18 | 0.0% |
| Lithuanian | 764 | 0.4% |
| Lumbee | 6 | 0.0% |
| Macedonian | 22 | 0.0% |
| Malaysian | 4 | 0.0% |
| Maltese | 16 | 0.0% |
| Mexican | 8,513 | 4.8% |
| Mexican American Indian | 16 | 0.0% |
| Moroccan | 8 | 0.0% |
| Native Hawaiian | 78 | 0.0% |
| Navajo | 39 | 0.0% |
| Nicaraguan | 31 | 0.0% |
| Nigerian | 46 | 0.0% |
| Northern European | 94 | 0.1% |
| Norwegian | 2,283 | 1.3% |
| Ottawa | 676 | 0.4% |
| Pakistani | 52 | 0.0% |
| Panamanian | 37 | 0.0% |
| Pennsylvania German | 43 | 0.0% |
| Peruvian | 25 | 0.0% |
| Pima | 4 | 0.0% |
| Polish | 7,960 | 4.5% |
| Portuguese | 38 | 0.0% |
| Potawatomi | 262 | 0.2% |
| Pueblo | 9 | 0.0% |
| Puerto Rican | 781 | 0.4% |
| Romanian | 99 | 0.1% |
| Russian | 295 | 0.2% |
| Salvadoran | 192 | 0.1% |
| Samoan | 272 | 0.2% |
| Scandinavian | 521 | 0.3% |
| Scotch-Irish | 859 | 0.5% |
| Scottish | 2,284 | 1.3% |
| Serbian | 61 | 0.0% |
| Sioux | 30 | 0.0% |
| Slavic | 45 | 0.0% |
| Slovak | 593 | 0.3% |
| Slovene | 95 | 0.1% |
| South American | 86 | 0.1% |
| South American Indian | 8 | 0.0% |
| Spaniard | 66 | 0.0% |
| Spanish | 9 | 0.0% |
| Spanish American | 52 | 0.0% |
| Sri Lankan | 102 | 0.1% |
| Subsaharan African | 728 | 0.4% |
| Swedish | 4,723 | 2.7% |
| Swiss | 330 | 0.2% |
| Syrian | 20 | 0.0% |
| Thai | 386 | 0.2% |
| Trinidadian and Tobagonian | 4 | 0.0% |
| Turkish | 4 | 0.0% |
| Ukrainian | 274 | 0.2% |
| Welsh | 398 | 0.2% |
| Yugoslavian | 153 | 0.1% | View All 126 Rows |
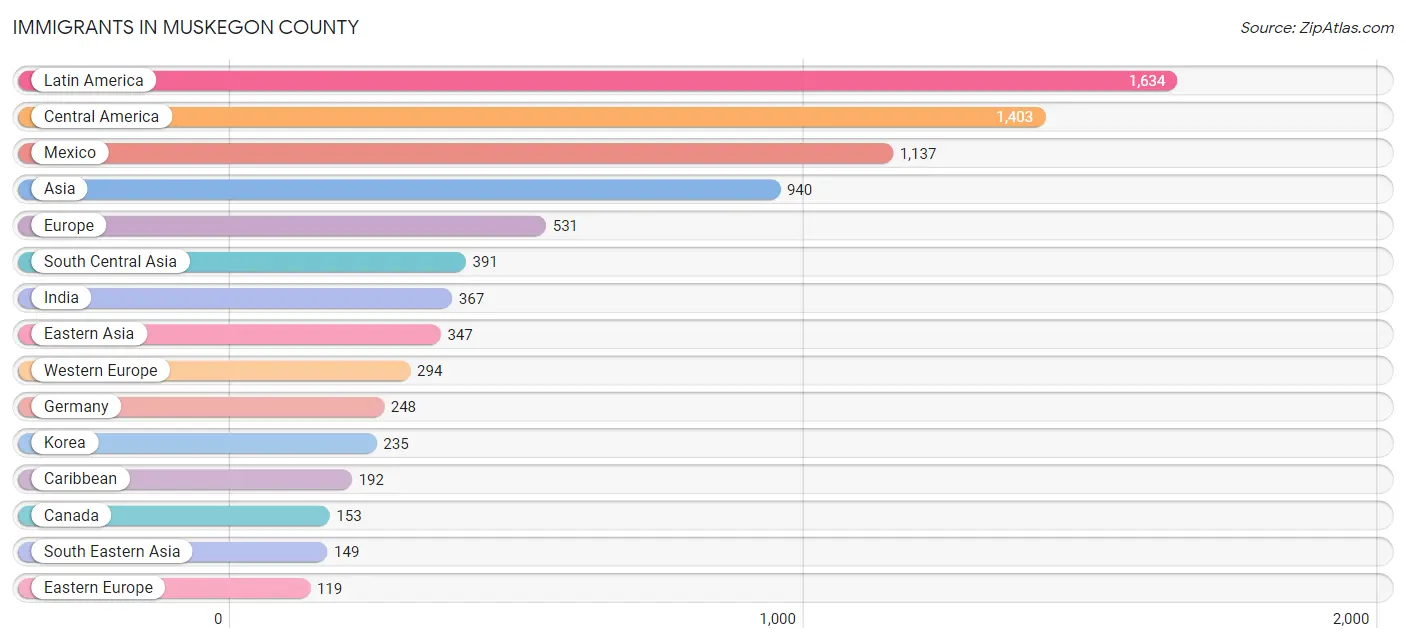
Immigrants in Muskegon County
The most numerous immigrant groups reported in Muskegon County came from Latin America (1,634 | 0.9%), Central America (1,403 | 0.8%), Mexico (1,137 | 0.6%), Asia (940 | 0.5%), and Europe (531 | 0.3%), together accounting for 3.2% of all Muskegon County residents.
| Immigration Origin | # Population | % Population |
| Africa | 66 | 0.0% |
| Asia | 940 | 0.5% |
| Australia | 44 | 0.0% |
| Austria | 4 | 0.0% |
| Brazil | 17 | 0.0% |
| Cameroon | 18 | 0.0% |
| Canada | 153 | 0.1% |
| Caribbean | 192 | 0.1% |
| Central America | 1,403 | 0.8% |
| Chile | 8 | 0.0% |
| China | 86 | 0.1% |
| Costa Rica | 69 | 0.0% |
| Cuba | 56 | 0.0% |
| Czechoslovakia | 13 | 0.0% |
| Denmark | 15 | 0.0% |
| Dominican Republic | 30 | 0.0% |
| Eastern Africa | 31 | 0.0% |
| Eastern Asia | 347 | 0.2% |
| Eastern Europe | 119 | 0.1% |
| El Salvador | 50 | 0.0% |
| England | 31 | 0.0% |
| Ethiopia | 28 | 0.0% |
| Europe | 531 | 0.3% |
| France | 12 | 0.0% |
| Germany | 248 | 0.1% |
| Guatemala | 44 | 0.0% |
| Honduras | 18 | 0.0% |
| India | 367 | 0.2% |
| Indonesia | 1 | 0.0% |
| Iran | 9 | 0.0% |
| Iraq | 53 | 0.0% |
| Italy | 13 | 0.0% |
| Jamaica | 78 | 0.0% |
| Japan | 26 | 0.0% |
| Kazakhstan | 4 | 0.0% |
| Korea | 235 | 0.1% |
| Latin America | 1,634 | 0.9% |
| Latvia | 10 | 0.0% |
| Liberia | 4 | 0.0% |
| Malaysia | 8 | 0.0% |
| Mexico | 1,137 | 0.6% |
| Middle Africa | 18 | 0.0% |
| Nepal | 4 | 0.0% |
| Netherlands | 30 | 0.0% |
| Nicaragua | 18 | 0.0% |
| Nigeria | 6 | 0.0% |
| Northern Africa | 7 | 0.0% |
| Northern Europe | 105 | 0.1% |
| Oceania | 53 | 0.0% |
| Panama | 67 | 0.0% |
| Peru | 2 | 0.0% |
| Philippines | 105 | 0.1% |
| Poland | 18 | 0.0% |
| Romania | 47 | 0.0% |
| Scotland | 14 | 0.0% |
| Singapore | 10 | 0.0% |
| South America | 39 | 0.0% |
| South Central Asia | 391 | 0.2% |
| South Eastern Asia | 149 | 0.1% |
| Southern Europe | 13 | 0.0% |
| Sweden | 30 | 0.0% |
| Taiwan | 11 | 0.0% |
| Trinidad and Tobago | 8 | 0.0% |
| Ukraine | 31 | 0.0% |
| Vietnam | 25 | 0.0% |
| Western Africa | 10 | 0.0% |
| Western Asia | 53 | 0.0% |
| Western Europe | 294 | 0.2% | View All 68 Rows |
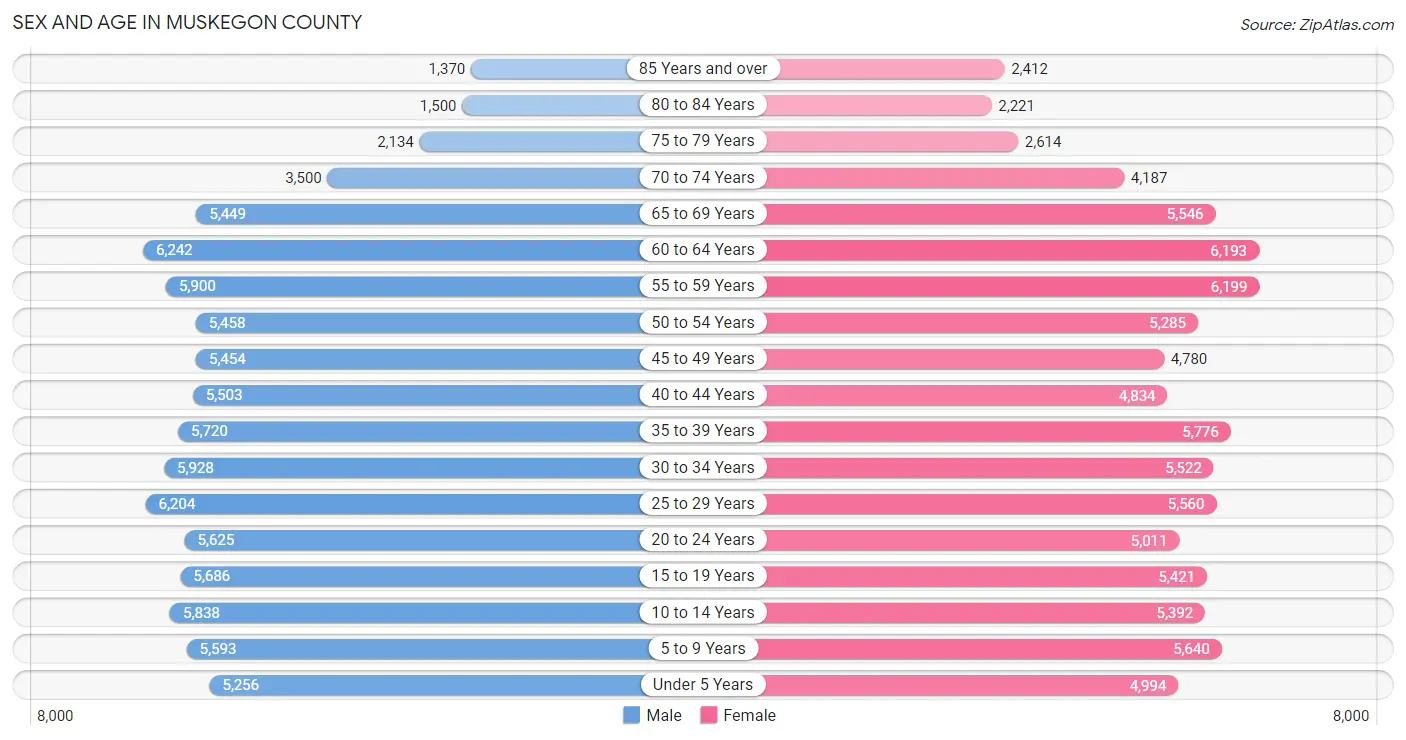
Sex and Age in Muskegon County
Sex and Age in Muskegon County
The most populous age groups in Muskegon County are 60 to 64 Years (6,242 | 7.1%) for men and 55 to 59 Years (6,199 | 7.1%) for women.
| Age Bracket | Male | Female |
| Under 5 Years | 5,256 (5.9%) | 4,994 (5.7%) |
| 5 to 9 Years | 5,593 (6.3%) | 5,640 (6.4%) |
| 10 to 14 Years | 5,838 (6.6%) | 5,392 (6.2%) |
| 15 to 19 Years | 5,686 (6.4%) | 5,421 (6.2%) |
| 20 to 24 Years | 5,625 (6.4%) | 5,011 (5.7%) |
| 25 to 29 Years | 6,204 (7.0%) | 5,560 (6.4%) |
| 30 to 34 Years | 5,928 (6.7%) | 5,522 (6.3%) |
| 35 to 39 Years | 5,720 (6.5%) | 5,776 (6.6%) |
| 40 to 44 Years | 5,503 (6.2%) | 4,834 (5.5%) |
| 45 to 49 Years | 5,454 (6.2%) | 4,780 (5.5%) |
| 50 to 54 Years | 5,458 (6.2%) | 5,285 (6.0%) |
| 55 to 59 Years | 5,900 (6.7%) | 6,199 (7.1%) |
| 60 to 64 Years | 6,242 (7.1%) | 6,193 (7.1%) |
| 65 to 69 Years | 5,449 (6.2%) | 5,546 (6.3%) |
| 70 to 74 Years | 3,500 (4.0%) | 4,187 (4.8%) |
| 75 to 79 Years | 2,134 (2.4%) | 2,614 (3.0%) |
| 80 to 84 Years | 1,500 (1.7%) | 2,221 (2.5%) |
| 85 Years and over | 1,370 (1.5%) | 2,412 (2.8%) |
| Total | 88,360 (100.0%) | 87,587 (100.0%) |
Families and Households in Muskegon County
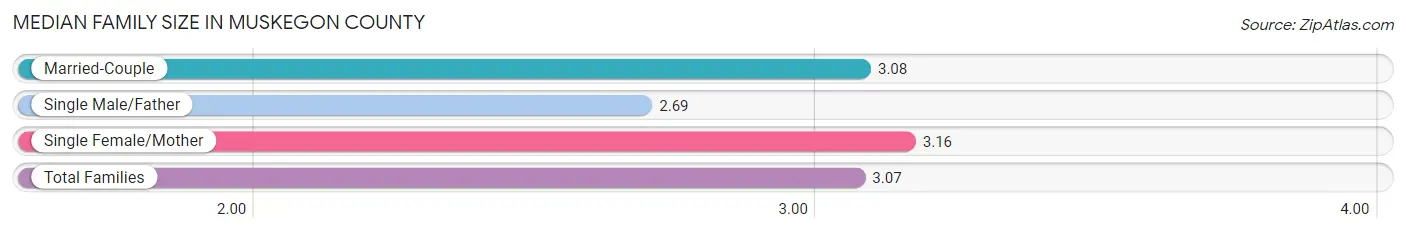
Median Family Size in Muskegon County
The median family size in Muskegon County is 3.07 persons per family, with single female/mother families (9,740 | 21.7%) accounting for the largest median family size of 3.16 persons per family. On the other hand, single male/father families (3,638 | 8.1%) represent the smallest median family size with 2.69 persons per family.
| Family Type | # Families | Family Size |
| Married-Couple | 31,395 (70.1%) | 3.08 |
| Single Male/Father | 3,638 (8.1%) | 2.69 |
| Single Female/Mother | 9,740 (21.7%) | 3.16 |
| Total Families | 44,773 (100.0%) | 3.07 |
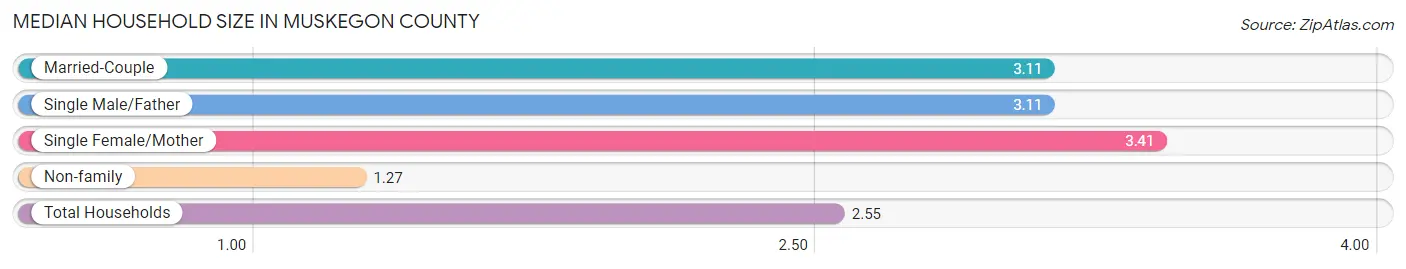
Median Household Size in Muskegon County
The median household size in Muskegon County is 2.55 persons per household, with single female/mother households (9,740 | 14.6%) accounting for the largest median household size of 3.41 persons per household. non-family households (21,822 | 32.8%) represent the smallest median household size with 1.27 persons per household.
| Household Type | # Households | Household Size |
| Married-Couple | 31,395 (47.1%) | 3.11 |
| Single Male/Father | 3,638 (5.5%) | 3.11 |
| Single Female/Mother | 9,740 (14.6%) | 3.41 |
| Non-family | 21,822 (32.8%) | 1.27 |
| Total Households | 66,595 (100.0%) | 2.55 |
Household Size by Marriage Status in Muskegon County
Out of a total of 66,595 households in Muskegon County, 44,773 (67.2%) are family households, while 21,822 (32.8%) are nonfamily households. The most numerous type of family households are 2-person households, comprising 20,772, and the most common type of nonfamily households are 1-person households, comprising 17,454.
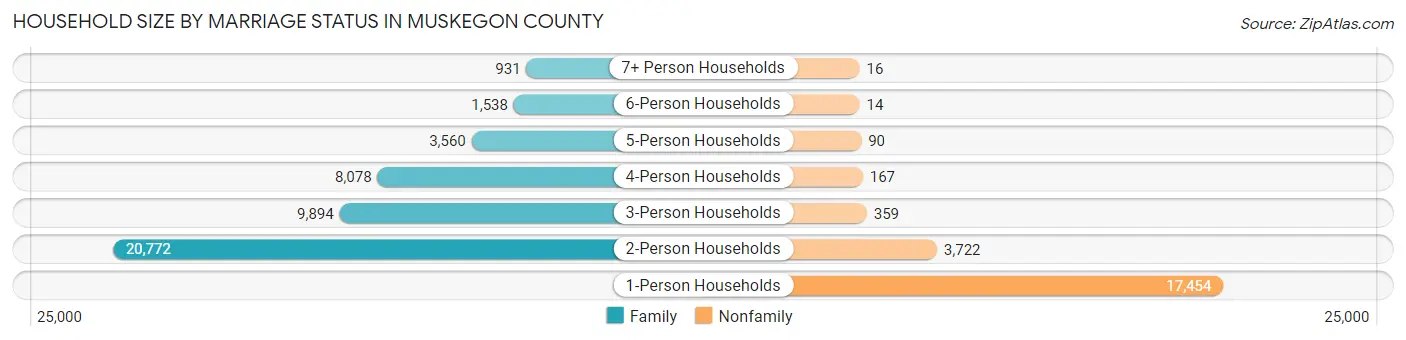
| Household Size | Family Households | Nonfamily Households |
| 1-Person Households | - | 17,454 (26.2%) |
| 2-Person Households | 20,772 (31.2%) | 3,722 (5.6%) |
| 3-Person Households | 9,894 (14.9%) | 359 (0.5%) |
| 4-Person Households | 8,078 (12.1%) | 167 (0.3%) |
| 5-Person Households | 3,560 (5.3%) | 90 (0.1%) |
| 6-Person Households | 1,538 (2.3%) | 14 (0.0%) |
| 7+ Person Households | 931 (1.4%) | 16 (0.0%) |
| Total | 44,773 (67.2%) | 21,822 (32.8%) |
Female Fertility in Muskegon County
Fertility by Age in Muskegon County
Average fertility rate in Muskegon County is 49.0 births per 1,000 women. Women in the age bracket of 20 to 34 years have the highest fertility rate with 89.0 births per 1,000 women. Women in the age bracket of 20 to 34 years acount for 77.4% of all women with births.
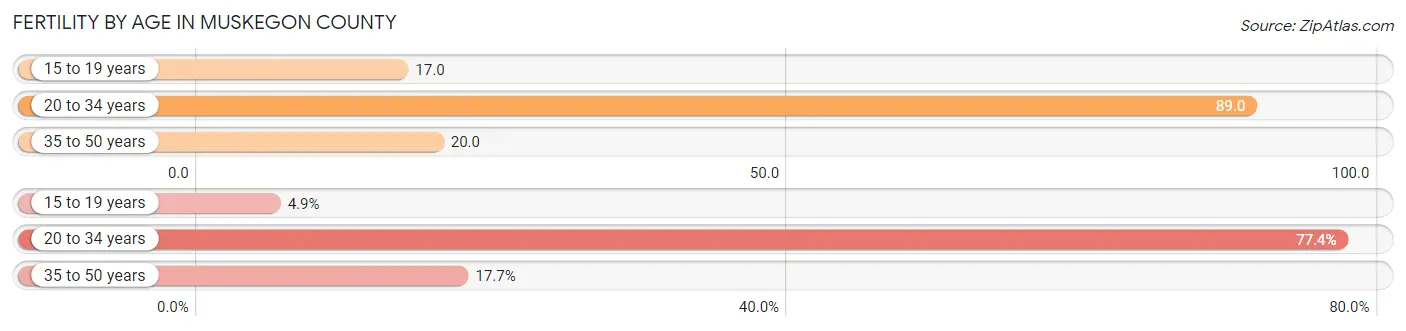
| Age Bracket | Women with Births | Births / 1,000 Women |
| 15 to 19 years | 91 (4.9%) | 17.0 |
| 20 to 34 years | 1,427 (77.4%) | 89.0 |
| 35 to 50 years | 326 (17.7%) | 20.0 |
| Total | 1,844 (100.0%) | 49.0 |
Fertility by Age by Marriage Status in Muskegon County
58.6% of women with births (1,844) in Muskegon County are married. The highest percentage of unmarried women with births falls into 15 to 19 years age bracket with 100.0% of them unmarried at the time of birth, while the lowest percentage of unmarried women with births belong to 35 to 50 years age bracket with 20.9% of them unmarried.
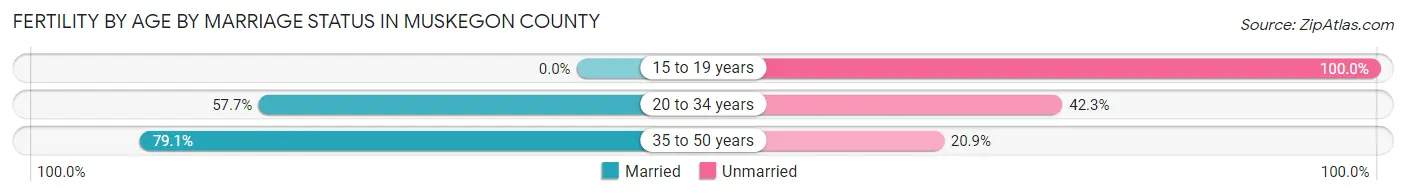
| Age Bracket | Married | Unmarried |
| 15 to 19 years | 0 (0.0%) | 91 (100.0%) |
| 20 to 34 years | 823 (57.7%) | 604 (42.3%) |
| 35 to 50 years | 258 (79.1%) | 68 (20.9%) |
| Total | 1,081 (58.6%) | 763 (41.4%) |
Fertility by Education in Muskegon County
Average fertility rate in Muskegon County is 49.0 births per 1,000 women. Women with the education attainment of graduate degree have the highest fertility rate of 62.0 births per 1,000 women, while women with the education attainment of less than high school have the lowest fertility at 40.0 births per 1,000 women. Women with the education attainment of college or associate's degree represent 41.1% of all women with births.
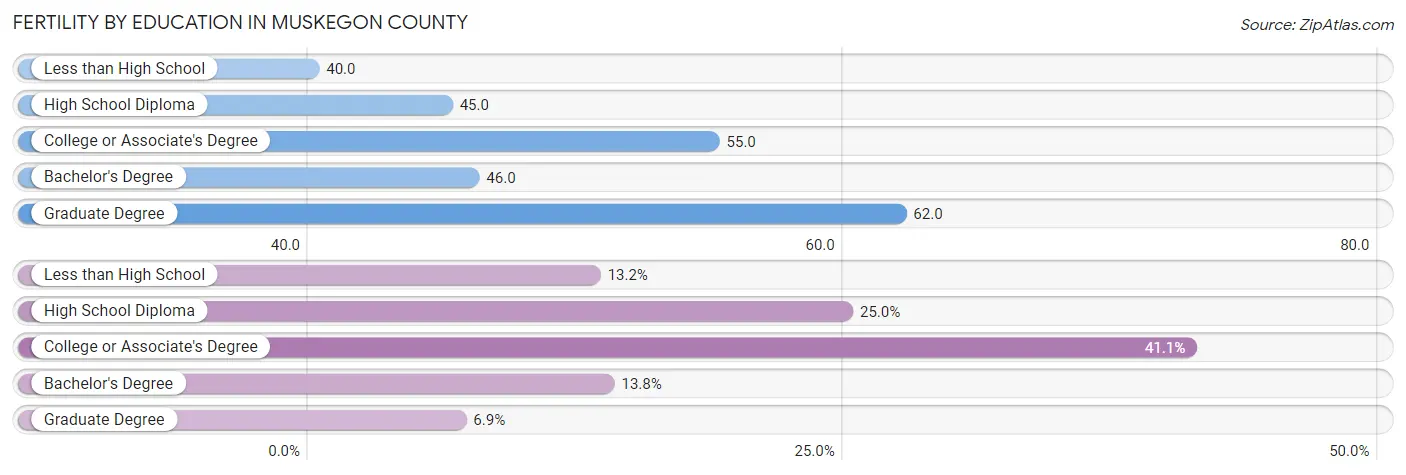
| Educational Attainment | Women with Births | Births / 1,000 Women |
| Less than High School | 243 (13.2%) | 40.0 |
| High School Diploma | 461 (25.0%) | 45.0 |
| College or Associate's Degree | 758 (41.1%) | 55.0 |
| Bachelor's Degree | 255 (13.8%) | 46.0 |
| Graduate Degree | 127 (6.9%) | 62.0 |
| Total | 1,844 (100.0%) | 49.0 |
Fertility by Education by Marriage Status in Muskegon County
41.4% of women with births in Muskegon County are unmarried. Women with the educational attainment of bachelor's degree are most likely to be married with 90.6% of them married at childbirth, while women with the educational attainment of less than high school are least likely to be married with 60.5% of them unmarried at childbirth.
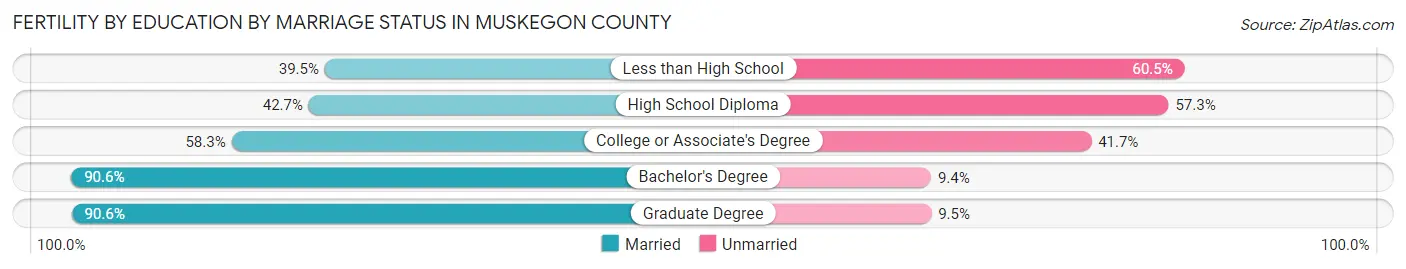
| Educational Attainment | Married | Unmarried |
| Less than High School | 96 (39.5%) | 147 (60.5%) |
| High School Diploma | 197 (42.7%) | 264 (57.3%) |
| College or Associate's Degree | 442 (58.3%) | 316 (41.7%) |
| Bachelor's Degree | 231 (90.6%) | 24 (9.4%) |
| Graduate Degree | 115 (90.5%) | 12 (9.5%) |
| Total | 1,081 (58.6%) | 763 (41.4%) |
Employment Characteristics in Muskegon County
Employment by Class of Employer in Muskegon County
Among the 75,385 employed individuals in Muskegon County, private company employees (55,215 | 73.2%), not-for-profit organizations (6,652 | 8.8%), and local government employees (5,139 | 6.8%) make up the most common classes of employment.
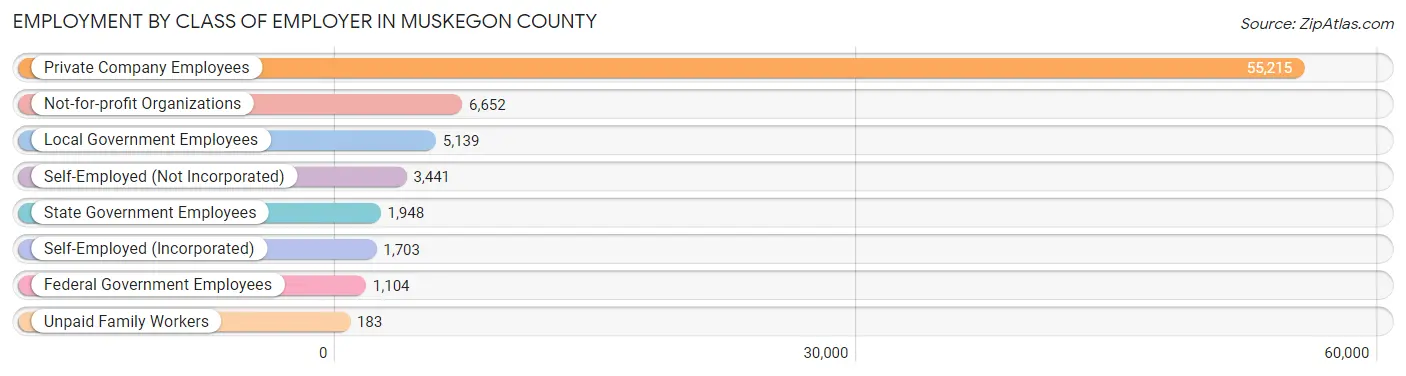
| Employer Class | # Employees | % Employees |
| Private Company Employees | 55,215 | 73.2% |
| Self-Employed (Incorporated) | 1,703 | 2.3% |
| Self-Employed (Not Incorporated) | 3,441 | 4.6% |
| Not-for-profit Organizations | 6,652 | 8.8% |
| Local Government Employees | 5,139 | 6.8% |
| State Government Employees | 1,948 | 2.6% |
| Federal Government Employees | 1,104 | 1.5% |
| Unpaid Family Workers | 183 | 0.2% |
| Total | 75,385 | 100.0% |
Employment Status by Age in Muskegon County
According to the labor force statistics for Muskegon County, out of the total population over 16 years of age (140,901), 59.2% or 83,413 individuals are in the labor force, with 7.5% or 6,256 of them unemployed. The age group with the highest labor force participation rate is 25 to 29 years, with 80.9% or 9,517 individuals in the labor force. Within the labor force, the 16 to 19 years age range has the highest percentage of unemployed individuals, with 15.5% or 646 of them being unemployed.
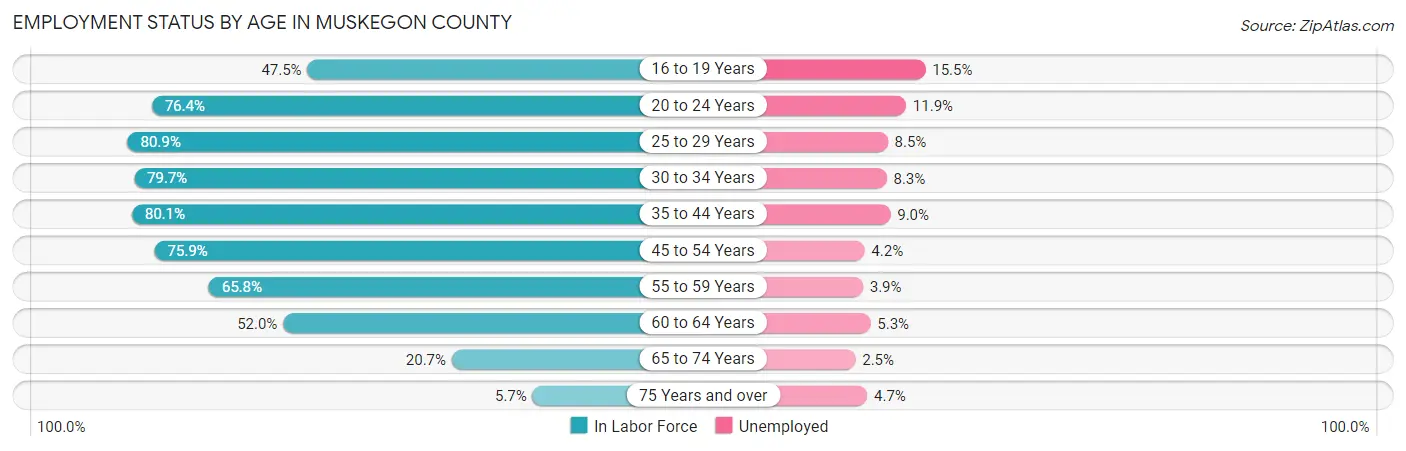
| Age Bracket | In Labor Force | Unemployed |
| 16 to 19 Years | 4,168 (47.5%) | 646 (15.5%) |
| 20 to 24 Years | 8,126 (76.4%) | 967 (11.9%) |
| 25 to 29 Years | 9,517 (80.9%) | 809 (8.5%) |
| 30 to 34 Years | 9,126 (79.7%) | 757 (8.3%) |
| 35 to 44 Years | 17,488 (80.1%) | 1,574 (9.0%) |
| 45 to 54 Years | 15,922 (75.9%) | 669 (4.2%) |
| 55 to 59 Years | 7,961 (65.8%) | 310 (3.9%) |
| 60 to 64 Years | 6,466 (52.0%) | 343 (5.3%) |
| 65 to 74 Years | 3,867 (20.7%) | 97 (2.5%) |
| 75 Years and over | 698 (5.7%) | 33 (4.7%) |
| Total | 83,413 (59.2%) | 6,256 (7.5%) |
Employment Status by Educational Attainment in Muskegon County
According to labor force statistics for Muskegon County, 73.4% of individuals (66,470) out of the total population between 25 and 64 years of age (90,558) are in the labor force, with 6.7% or 4,453 of them being unemployed. The group with the highest labor force participation rate are those with the educational attainment of bachelor's degree or higher, with 83.4% or 15,411 individuals in the labor force. Within the labor force, individuals with less than high school education have the highest percentage of unemployment, with 18.9% or 698 of them being unemployed.
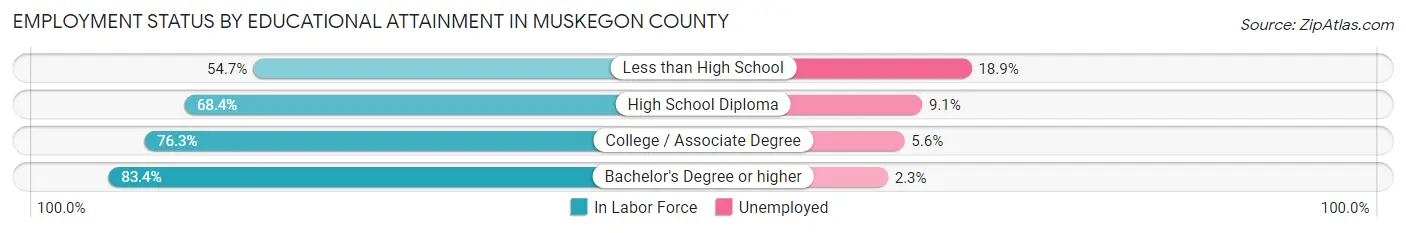
| Educational Attainment | In Labor Force | Unemployed |
| Less than High School | 3,692 (54.7%) | 1,276 (18.9%) |
| High School Diploma | 21,372 (68.4%) | 2,843 (9.1%) |
| College / Associate Degree | 26,005 (76.3%) | 1,909 (5.6%) |
| Bachelor's Degree or higher | 15,411 (83.4%) | 425 (2.3%) |
| Total | 66,470 (73.4%) | 6,067 (6.7%) |
Employment Occupations by Sex in Muskegon County
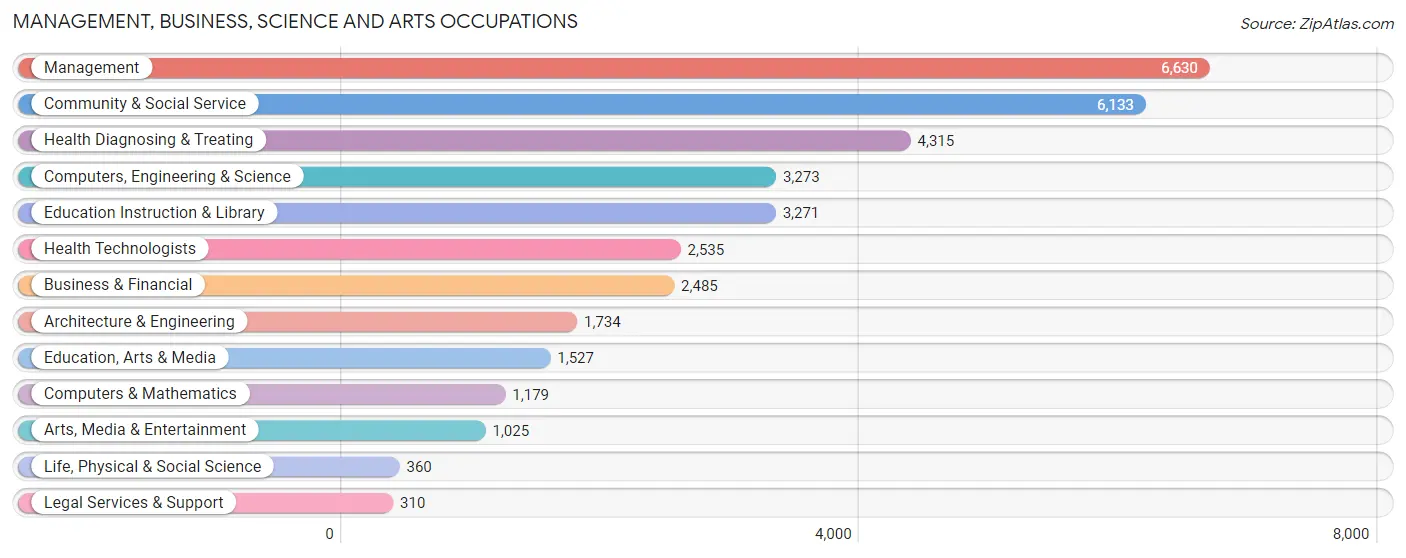
Management, Business, Science and Arts Occupations
The most common Management, Business, Science and Arts occupations in Muskegon County are Management (6,630 | 8.6%), Community & Social Service (6,133 | 8.0%), Health Diagnosing & Treating (4,315 | 5.6%), Computers, Engineering & Science (3,273 | 4.3%), and Education Instruction & Library (3,271 | 4.2%).
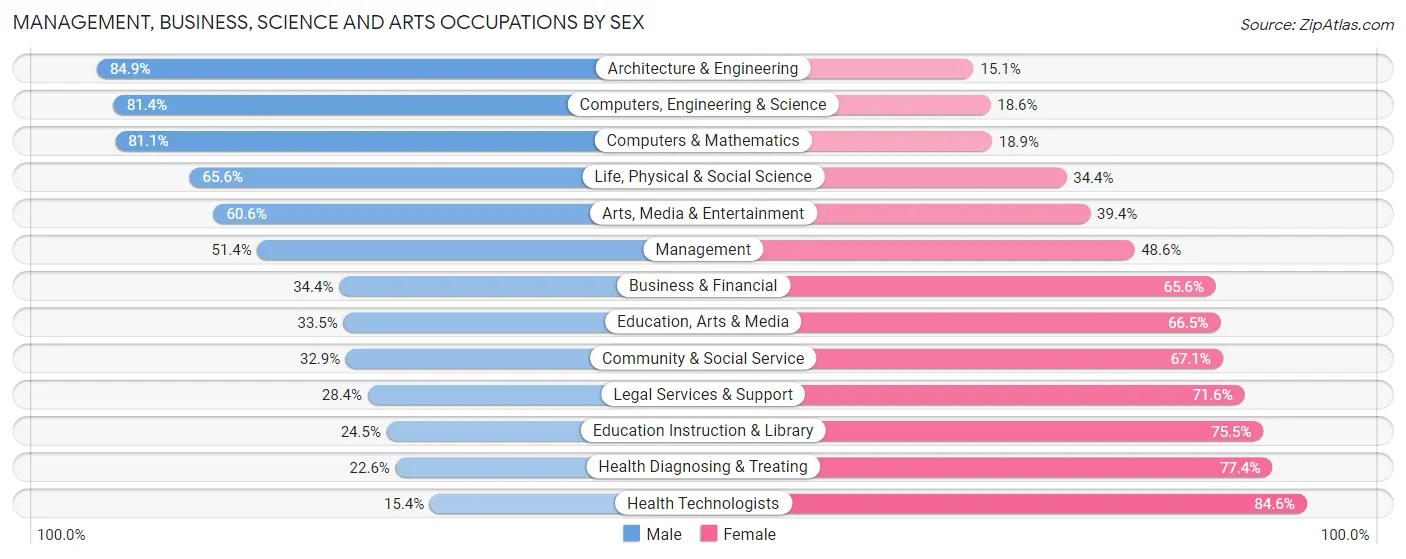
Management, Business, Science and Arts Occupations by Sex
Within the Management, Business, Science and Arts occupations in Muskegon County, the most male-oriented occupations are Architecture & Engineering (84.9%), Computers, Engineering & Science (81.4%), and Computers & Mathematics (81.1%), while the most female-oriented occupations are Health Technologists (84.6%), Health Diagnosing & Treating (77.4%), and Education Instruction & Library (75.5%).
| Occupation | Male | Female |
| Management | 3,407 (51.4%) | 3,223 (48.6%) |
| Business & Financial | 854 (34.4%) | 1,631 (65.6%) |
| Computers, Engineering & Science | 2,664 (81.4%) | 609 (18.6%) |
| Computers & Mathematics | 956 (81.1%) | 223 (18.9%) |
| Architecture & Engineering | 1,472 (84.9%) | 262 (15.1%) |
| Life, Physical & Social Science | 236 (65.6%) | 124 (34.4%) |
| Community & Social Service | 2,020 (32.9%) | 4,113 (67.1%) |
| Education, Arts & Media | 511 (33.5%) | 1,016 (66.5%) |
| Legal Services & Support | 88 (28.4%) | 222 (71.6%) |
| Education Instruction & Library | 800 (24.5%) | 2,471 (75.5%) |
| Arts, Media & Entertainment | 621 (60.6%) | 404 (39.4%) |
| Health Diagnosing & Treating | 975 (22.6%) | 3,340 (77.4%) |
| Health Technologists | 391 (15.4%) | 2,144 (84.6%) |
| Total (Category) | 9,920 (43.4%) | 12,916 (56.6%) |
| Total (Overall) | 39,996 (51.9%) | 37,086 (48.1%) |
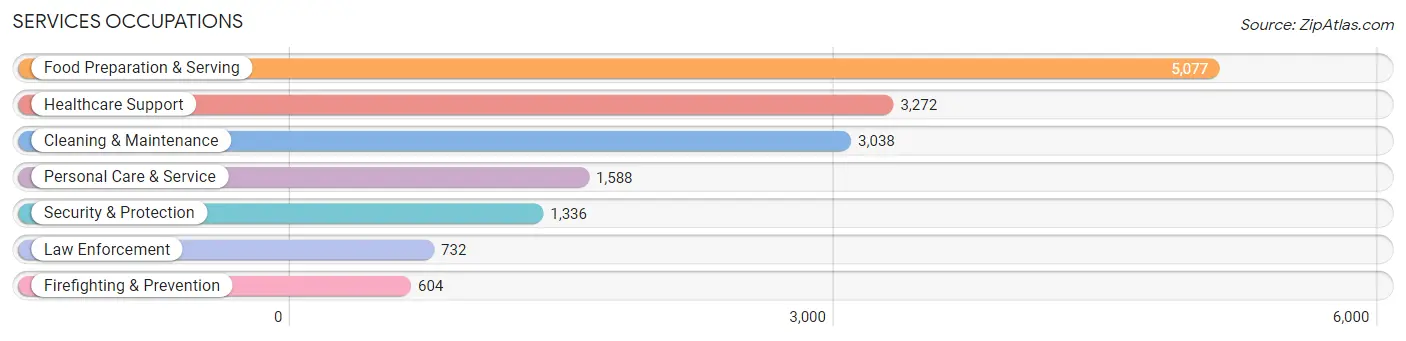
Services Occupations
The most common Services occupations in Muskegon County are Food Preparation & Serving (5,077 | 6.6%), Healthcare Support (3,272 | 4.2%), Cleaning & Maintenance (3,038 | 3.9%), Personal Care & Service (1,588 | 2.1%), and Security & Protection (1,336 | 1.7%).
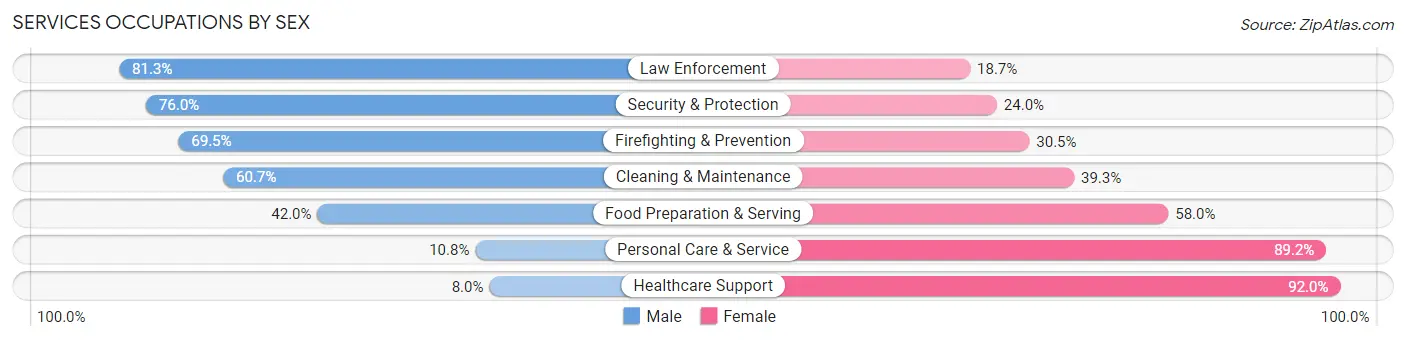
Services Occupations by Sex
Within the Services occupations in Muskegon County, the most male-oriented occupations are Law Enforcement (81.3%), Security & Protection (76.0%), and Firefighting & Prevention (69.5%), while the most female-oriented occupations are Healthcare Support (92.0%), Personal Care & Service (89.2%), and Food Preparation & Serving (58.0%).
| Occupation | Male | Female |
| Healthcare Support | 261 (8.0%) | 3,011 (92.0%) |
| Security & Protection | 1,015 (76.0%) | 321 (24.0%) |
| Firefighting & Prevention | 420 (69.5%) | 184 (30.5%) |
| Law Enforcement | 595 (81.3%) | 137 (18.7%) |
| Food Preparation & Serving | 2,134 (42.0%) | 2,943 (58.0%) |
| Cleaning & Maintenance | 1,844 (60.7%) | 1,194 (39.3%) |
| Personal Care & Service | 171 (10.8%) | 1,417 (89.2%) |
| Total (Category) | 5,425 (37.9%) | 8,886 (62.1%) |
| Total (Overall) | 39,996 (51.9%) | 37,086 (48.1%) |
Sales and Office Occupations
The most common Sales and Office occupations in Muskegon County are Office & Administration (7,955 | 10.3%), and Sales & Related (6,418 | 8.3%).
Sales and Office Occupations by Sex
| Occupation | Male | Female |
| Sales & Related | 3,079 (48.0%) | 3,339 (52.0%) |
| Office & Administration | 1,876 (23.6%) | 6,079 (76.4%) |
| Total (Category) | 4,955 (34.5%) | 9,418 (65.5%) |
| Total (Overall) | 39,996 (51.9%) | 37,086 (48.1%) |
Natural Resources, Construction and Maintenance Occupations
The most common Natural Resources, Construction and Maintenance occupations in Muskegon County are Construction & Extraction (3,182 | 4.1%), Installation, Maintenance & Repair (2,973 | 3.9%), and Farming, Fishing & Forestry (233 | 0.3%).
Natural Resources, Construction and Maintenance Occupations by Sex
| Occupation | Male | Female |
| Farming, Fishing & Forestry | 162 (69.5%) | 71 (30.5%) |
| Construction & Extraction | 3,016 (94.8%) | 166 (5.2%) |
| Installation, Maintenance & Repair | 2,927 (98.5%) | 46 (1.5%) |
| Total (Category) | 6,105 (95.6%) | 283 (4.4%) |
| Total (Overall) | 39,996 (51.9%) | 37,086 (48.1%) |
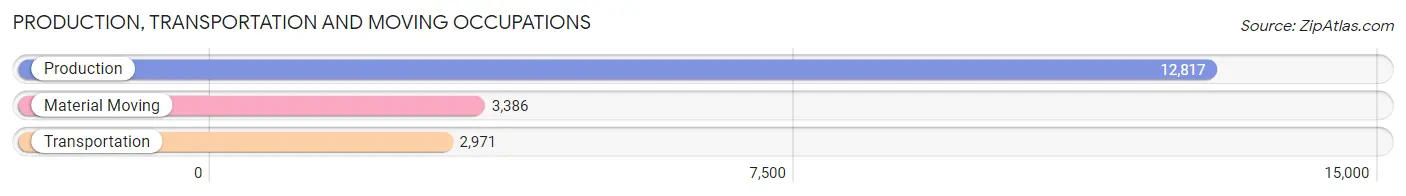
Production, Transportation and Moving Occupations
The most common Production, Transportation and Moving occupations in Muskegon County are Production (12,817 | 16.6%), Material Moving (3,386 | 4.4%), and Transportation (2,971 | 3.8%).
Production, Transportation and Moving Occupations by Sex
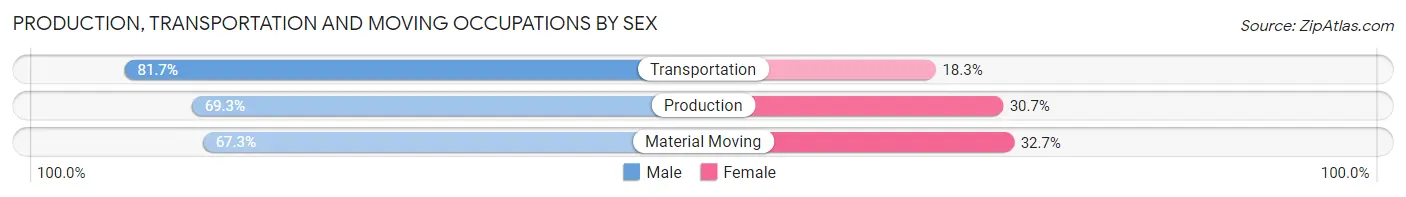
| Occupation | Male | Female |
| Production | 8,886 (69.3%) | 3,931 (30.7%) |
| Transportation | 2,426 (81.7%) | 545 (18.3%) |
| Material Moving | 2,279 (67.3%) | 1,107 (32.7%) |
| Total (Category) | 13,591 (70.9%) | 5,583 (29.1%) |
| Total (Overall) | 39,996 (51.9%) | 37,086 (48.1%) |
Employment Industries by Sex in Muskegon County
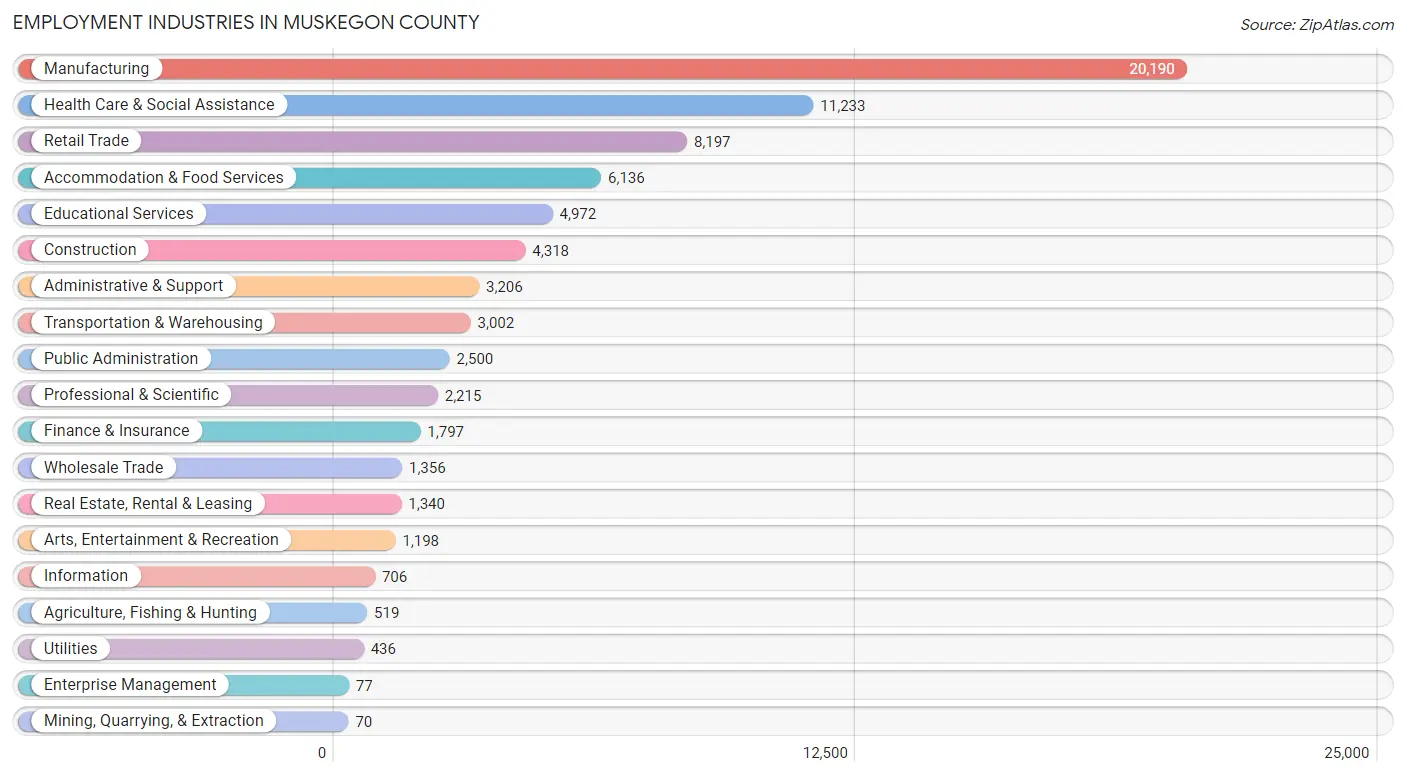
Employment Industries in Muskegon County
The major employment industries in Muskegon County include Manufacturing (20,190 | 26.2%), Health Care & Social Assistance (11,233 | 14.6%), Retail Trade (8,197 | 10.6%), Accommodation & Food Services (6,136 | 8.0%), and Educational Services (4,972 | 6.5%).
Employment Industries by Sex in Muskegon County
The Muskegon County industries that see more men than women are Construction (90.6%), Mining, Quarrying, & Extraction (87.1%), and Wholesale Trade (79.3%), whereas the industries that tend to have a higher number of women are Health Care & Social Assistance (83.1%), Enterprise Management (79.2%), and Educational Services (73.2%).
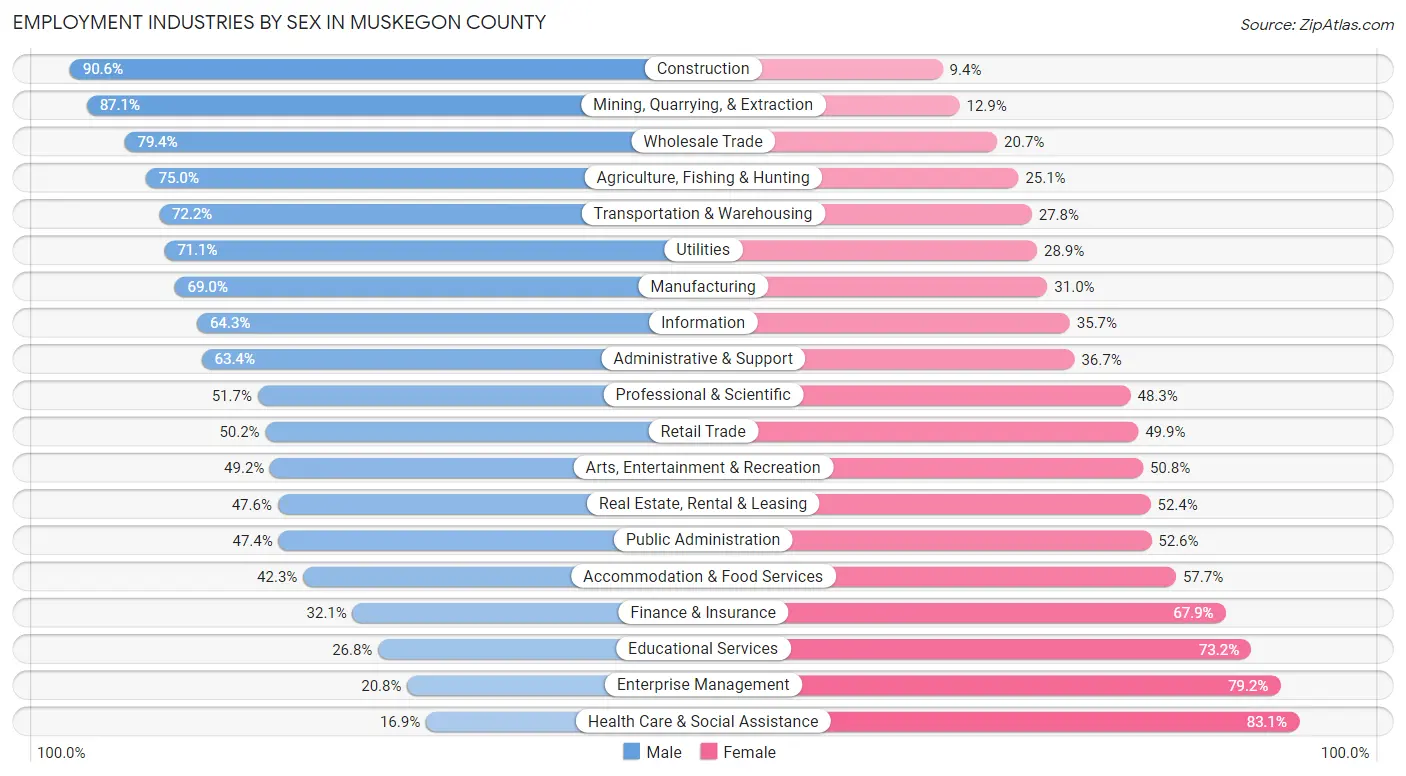
| Industry | Male | Female |
| Agriculture, Fishing & Hunting | 389 (75.0%) | 130 (25.1%) |
| Mining, Quarrying, & Extraction | 61 (87.1%) | 9 (12.9%) |
| Construction | 3,914 (90.6%) | 404 (9.4%) |
| Manufacturing | 13,923 (69.0%) | 6,267 (31.0%) |
| Wholesale Trade | 1,076 (79.3%) | 280 (20.6%) |
| Retail Trade | 4,111 (50.1%) | 4,086 (49.8%) |
| Transportation & Warehousing | 2,167 (72.2%) | 835 (27.8%) |
| Utilities | 310 (71.1%) | 126 (28.9%) |
| Information | 454 (64.3%) | 252 (35.7%) |
| Finance & Insurance | 577 (32.1%) | 1,220 (67.9%) |
| Real Estate, Rental & Leasing | 638 (47.6%) | 702 (52.4%) |
| Professional & Scientific | 1,146 (51.7%) | 1,069 (48.3%) |
| Enterprise Management | 16 (20.8%) | 61 (79.2%) |
| Administrative & Support | 2,031 (63.3%) | 1,175 (36.6%) |
| Educational Services | 1,333 (26.8%) | 3,639 (73.2%) |
| Health Care & Social Assistance | 1,901 (16.9%) | 9,332 (83.1%) |
| Arts, Entertainment & Recreation | 589 (49.2%) | 609 (50.8%) |
| Accommodation & Food Services | 2,598 (42.3%) | 3,538 (57.7%) |
| Public Administration | 1,186 (47.4%) | 1,314 (52.6%) |
| Total | 39,996 (51.9%) | 37,086 (48.1%) |
Education in Muskegon County
School Enrollment in Muskegon County
The most common levels of schooling among the 37,695 students in Muskegon County are high school (9,035 | 24.0%), middle school (9,024 | 23.9%), and elementary school (8,764 | 23.3%).
| School Level | # Students | % Students |
| Nursery / Preschool | 1,801 | 4.8% |
| Kindergarten | 2,702 | 7.2% |
| Elementary School | 8,764 | 23.3% |
| Middle School | 9,024 | 23.9% |
| High School | 9,035 | 24.0% |
| College / Undergraduate | 5,700 | 15.1% |
| Graduate / Professional | 669 | 1.8% |
| Total | 37,695 | 100.0% |
School Enrollment by Age by Funding Source in Muskegon County
Out of a total of 37,695 students who are enrolled in schools in Muskegon County, 3,732 (9.9%) attend a private institution, while the remaining 33,963 (90.1%) are enrolled in public schools. The age group of 25 to 34 year olds has the highest likelihood of being enrolled in private schools, with 364 (28.4% in the age bracket) enrolled. Conversely, the age group of 10 to 14 year olds has the lowest likelihood of being enrolled in a private school, with 10,481 (95.3% in the age bracket) attending a public institution.
| Age Bracket | Public School | Private School |
| 3 to 4 Year Olds | 1,190 (84.3%) | 222 (15.7%) |
| 5 to 9 Year Old | 9,794 (91.9%) | 858 (8.1%) |
| 10 to 14 Year Olds | 10,481 (95.3%) | 518 (4.7%) |
| 15 to 17 Year Olds | 6,459 (94.5%) | 375 (5.5%) |
| 18 to 19 Year Olds | 2,213 (81.5%) | 501 (18.5%) |
| 20 to 24 Year Olds | 1,935 (76.5%) | 593 (23.5%) |
| 25 to 34 Year Olds | 919 (71.6%) | 364 (28.4%) |
| 35 Years and over | 991 (77.8%) | 282 (22.2%) |
| Total | 33,963 (90.1%) | 3,732 (9.9%) |
Educational Attainment by Field of Study in Muskegon County
Business (5,490 | 20.1%), education (4,471 | 16.4%), science & technology (3,129 | 11.5%), arts & humanities (2,593 | 9.5%), and engineering (1,575 | 5.8%) are the most common fields of study among 27,291 individuals in Muskegon County who have obtained a bachelor's degree or higher.
| Field of Study | # Graduates | % Graduates |
| Computers & Mathematics | 1,303 | 4.8% |
| Bio, Nature & Agricultural | 1,384 | 5.1% |
| Physical & Health Sciences | 777 | 2.9% |
| Psychology | 1,066 | 3.9% |
| Social Sciences | 1,427 | 5.2% |
| Engineering | 1,575 | 5.8% |
| Multidisciplinary Studies | 131 | 0.5% |
| Science & Technology | 3,129 | 11.5% |
| Business | 5,490 | 20.1% |
| Education | 4,471 | 16.4% |
| Literature & Languages | 970 | 3.5% |
| Liberal Arts & History | 1,167 | 4.3% |
| Visual & Performing Arts | 855 | 3.1% |
| Communications | 953 | 3.5% |
| Arts & Humanities | 2,593 | 9.5% |
| Total | 27,291 | 100.0% |
Transportation & Commute in Muskegon County
Vehicle Availability by Sex in Muskegon County
The most prevalent vehicle ownership categories in Muskegon County are males with 2 vehicles (17,085, accounting for 43.7%) and females with 2 vehicles (15,446, making up 47.7%).
| Vehicles Available | Male | Female |
| No Vehicle | 926 (2.4%) | 645 (1.8%) |
| 1 Vehicle | 6,329 (16.2%) | 8,019 (22.4%) |
| 2 Vehicles | 17,085 (43.7%) | 15,446 (43.1%) |
| 3 Vehicles | 9,444 (24.2%) | 7,626 (21.3%) |
| 4 Vehicles | 3,348 (8.6%) | 2,514 (7.0%) |
| 5 or more Vehicles | 1,927 (4.9%) | 1,569 (4.4%) |
| Total | 39,059 (100.0%) | 35,819 (100.0%) |
Commute Time in Muskegon County
The most frequently occuring commute durations in Muskegon County are 15 to 19 minutes (14,622 commuters, 20.5%), 20 to 24 minutes (11,388 commuters, 15.9%), and 10 to 14 minutes (10,896 commuters, 15.2%).
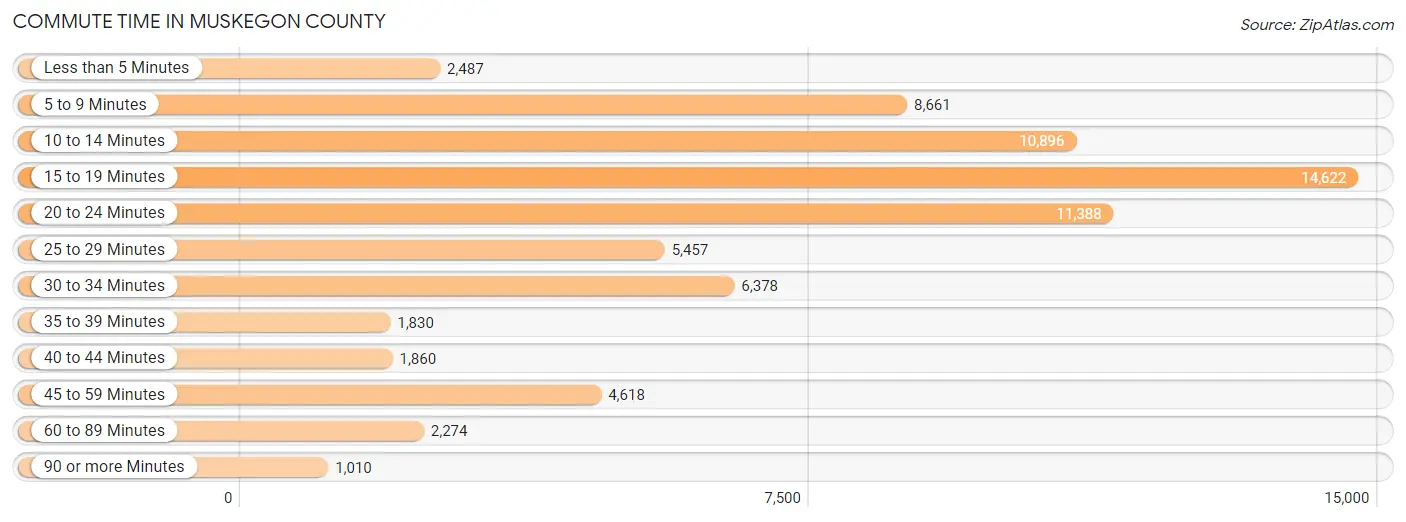
| Commute Time | # Commuters | % Commuters |
| Less than 5 Minutes | 2,487 | 3.5% |
| 5 to 9 Minutes | 8,661 | 12.1% |
| 10 to 14 Minutes | 10,896 | 15.2% |
| 15 to 19 Minutes | 14,622 | 20.5% |
| 20 to 24 Minutes | 11,388 | 15.9% |
| 25 to 29 Minutes | 5,457 | 7.6% |
| 30 to 34 Minutes | 6,378 | 8.9% |
| 35 to 39 Minutes | 1,830 | 2.6% |
| 40 to 44 Minutes | 1,860 | 2.6% |
| 45 to 59 Minutes | 4,618 | 6.5% |
| 60 to 89 Minutes | 2,274 | 3.2% |
| 90 or more Minutes | 1,010 | 1.4% |
Commute Time by Sex in Muskegon County
The most common commute times in Muskegon County are 15 to 19 minutes (7,045 commuters, 18.8%) for males and 15 to 19 minutes (7,577 commuters, 22.3%) for females.
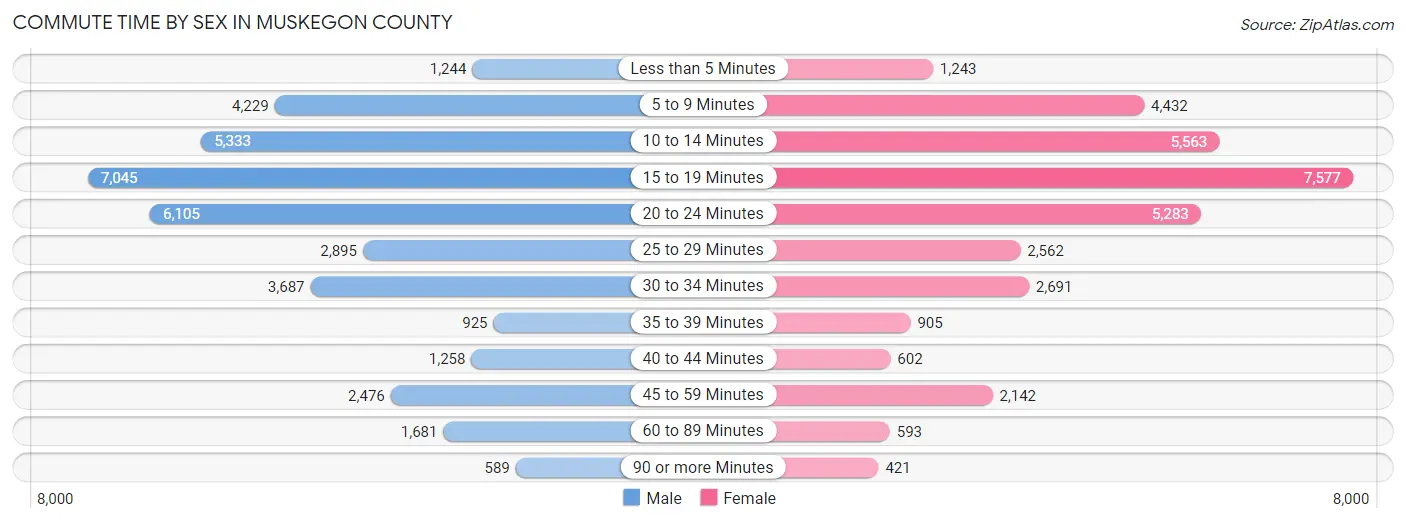
| Commute Time | Male | Female |
| Less than 5 Minutes | 1,244 (3.3%) | 1,243 (3.6%) |
| 5 to 9 Minutes | 4,229 (11.3%) | 4,432 (13.0%) |
| 10 to 14 Minutes | 5,333 (14.2%) | 5,563 (16.4%) |
| 15 to 19 Minutes | 7,045 (18.8%) | 7,577 (22.3%) |
| 20 to 24 Minutes | 6,105 (16.3%) | 5,283 (15.5%) |
| 25 to 29 Minutes | 2,895 (7.7%) | 2,562 (7.5%) |
| 30 to 34 Minutes | 3,687 (9.8%) | 2,691 (7.9%) |
| 35 to 39 Minutes | 925 (2.5%) | 905 (2.7%) |
| 40 to 44 Minutes | 1,258 (3.4%) | 602 (1.8%) |
| 45 to 59 Minutes | 2,476 (6.6%) | 2,142 (6.3%) |
| 60 to 89 Minutes | 1,681 (4.5%) | 593 (1.7%) |
| 90 or more Minutes | 589 (1.6%) | 421 (1.2%) |
Time of Departure to Work by Sex in Muskegon County
The most frequent times of departure to work in Muskegon County are 6:30 AM to 6:59 AM (4,459, 11.9%) for males and 7:30 AM to 7:59 AM (5,470, 16.1%) for females.
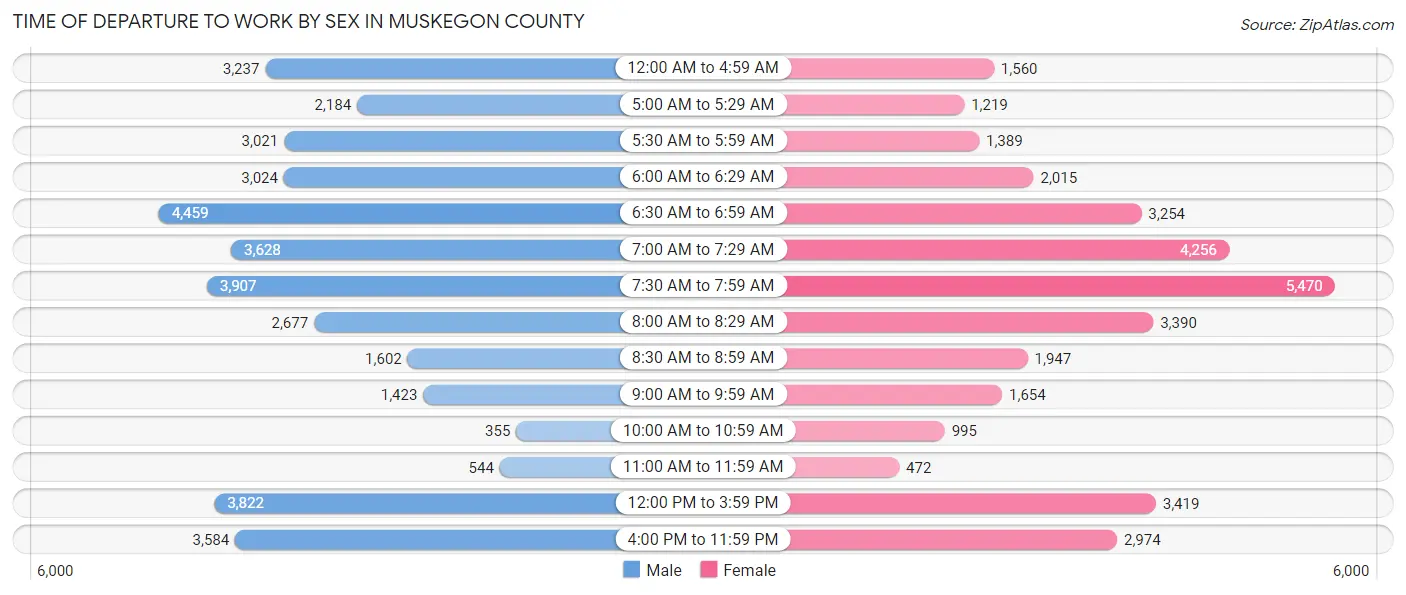
| Time of Departure | Male | Female |
| 12:00 AM to 4:59 AM | 3,237 (8.6%) | 1,560 (4.6%) |
| 5:00 AM to 5:29 AM | 2,184 (5.8%) | 1,219 (3.6%) |
| 5:30 AM to 5:59 AM | 3,021 (8.1%) | 1,389 (4.1%) |
| 6:00 AM to 6:29 AM | 3,024 (8.1%) | 2,015 (5.9%) |
| 6:30 AM to 6:59 AM | 4,459 (11.9%) | 3,254 (9.6%) |
| 7:00 AM to 7:29 AM | 3,628 (9.7%) | 4,256 (12.5%) |
| 7:30 AM to 7:59 AM | 3,907 (10.4%) | 5,470 (16.1%) |
| 8:00 AM to 8:29 AM | 2,677 (7.1%) | 3,390 (10.0%) |
| 8:30 AM to 8:59 AM | 1,602 (4.3%) | 1,947 (5.7%) |
| 9:00 AM to 9:59 AM | 1,423 (3.8%) | 1,654 (4.9%) |
| 10:00 AM to 10:59 AM | 355 (0.9%) | 995 (2.9%) |
| 11:00 AM to 11:59 AM | 544 (1.5%) | 472 (1.4%) |
| 12:00 PM to 3:59 PM | 3,822 (10.2%) | 3,419 (10.1%) |
| 4:00 PM to 11:59 PM | 3,584 (9.6%) | 2,974 (8.7%) |
| Total | 37,467 (100.0%) | 34,014 (100.0%) |
Housing Occupancy in Muskegon County
Occupancy by Ownership in Muskegon County
Of the total 66,595 dwellings in Muskegon County, owner-occupied units account for 51,460 (77.3%), while renter-occupied units make up 15,135 (22.7%).
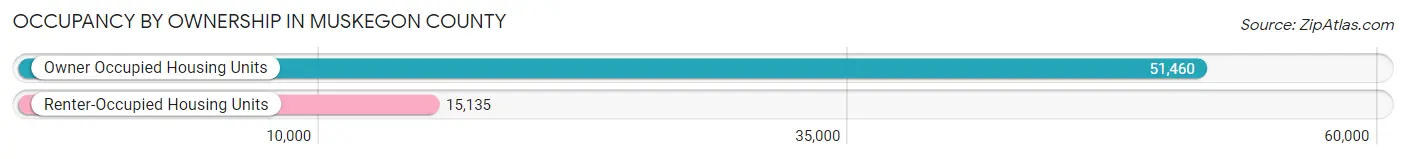
| Occupancy | # Housing Units | % Housing Units |
| Owner Occupied Housing Units | 51,460 | 77.3% |
| Renter-Occupied Housing Units | 15,135 | 22.7% |
| Total Occupied Housing Units | 66,595 | 100.0% |
Occupancy by Household Size in Muskegon County
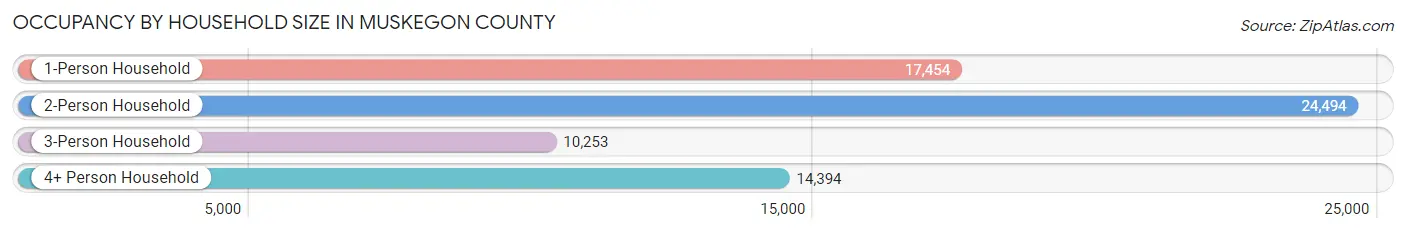
| Household Size | # Housing Units | % Housing Units |
| 1-Person Household | 17,454 | 26.2% |
| 2-Person Household | 24,494 | 36.8% |
| 3-Person Household | 10,253 | 15.4% |
| 4+ Person Household | 14,394 | 21.6% |
| Total Housing Units | 66,595 | 100.0% |
Occupancy by Ownership by Household Size in Muskegon County
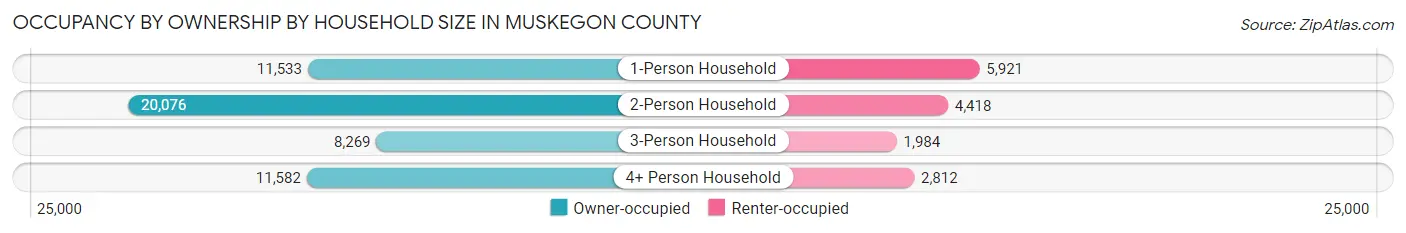
| Household Size | Owner-occupied | Renter-occupied |
| 1-Person Household | 11,533 (66.1%) | 5,921 (33.9%) |
| 2-Person Household | 20,076 (82.0%) | 4,418 (18.0%) |
| 3-Person Household | 8,269 (80.6%) | 1,984 (19.4%) |
| 4+ Person Household | 11,582 (80.5%) | 2,812 (19.5%) |
| Total Housing Units | 51,460 (77.3%) | 15,135 (22.7%) |
Occupancy by Educational Attainment in Muskegon County
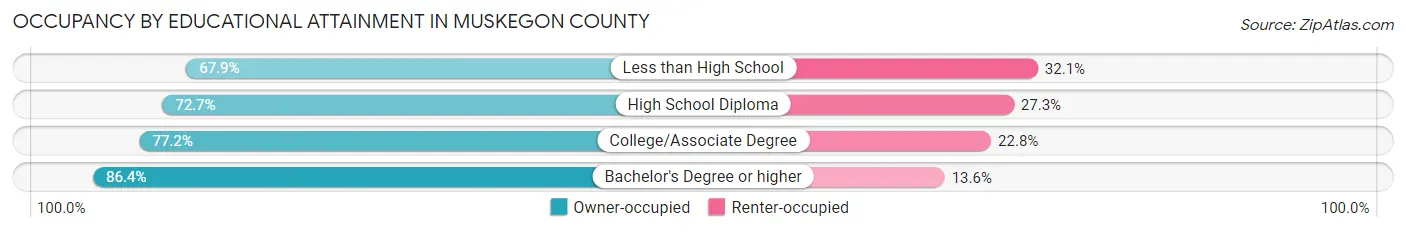
| Household Size | Owner-occupied | Renter-occupied |
| Less than High School | 2,714 (67.9%) | 1,281 (32.1%) |
| High School Diploma | 15,844 (72.7%) | 5,953 (27.3%) |
| College/Associate Degree | 19,761 (77.2%) | 5,835 (22.8%) |
| Bachelor's Degree or higher | 13,141 (86.4%) | 2,066 (13.6%) |
Occupancy by Age of Householder in Muskegon County
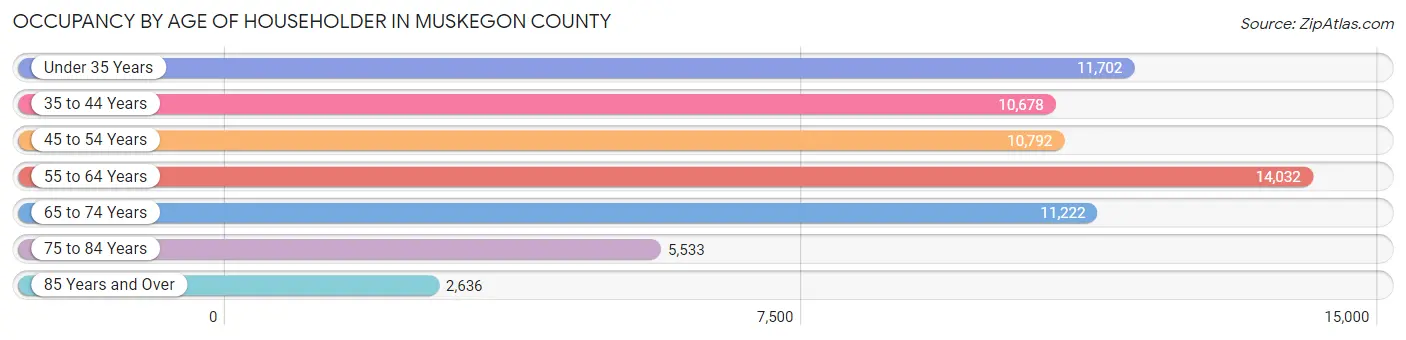
| Age Bracket | # Households | % Households |
| Under 35 Years | 11,702 | 17.6% |
| 35 to 44 Years | 10,678 | 16.0% |
| 45 to 54 Years | 10,792 | 16.2% |
| 55 to 64 Years | 14,032 | 21.1% |
| 65 to 74 Years | 11,222 | 16.9% |
| 75 to 84 Years | 5,533 | 8.3% |
| 85 Years and Over | 2,636 | 4.0% |
| Total | 66,595 | 100.0% |
Housing Finances in Muskegon County
Median Income by Occupancy in Muskegon County
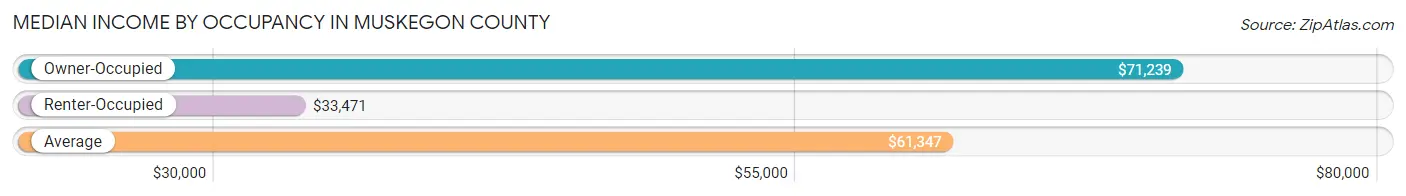
| Occupancy Type | # Households | Median Income |
| Owner-Occupied | 51,460 (77.3%) | $71,239 |
| Renter-Occupied | 15,135 (22.7%) | $33,471 |
| Average | 66,595 (100.0%) | $61,347 |
Occupancy by Householder Income Bracket in Muskegon County
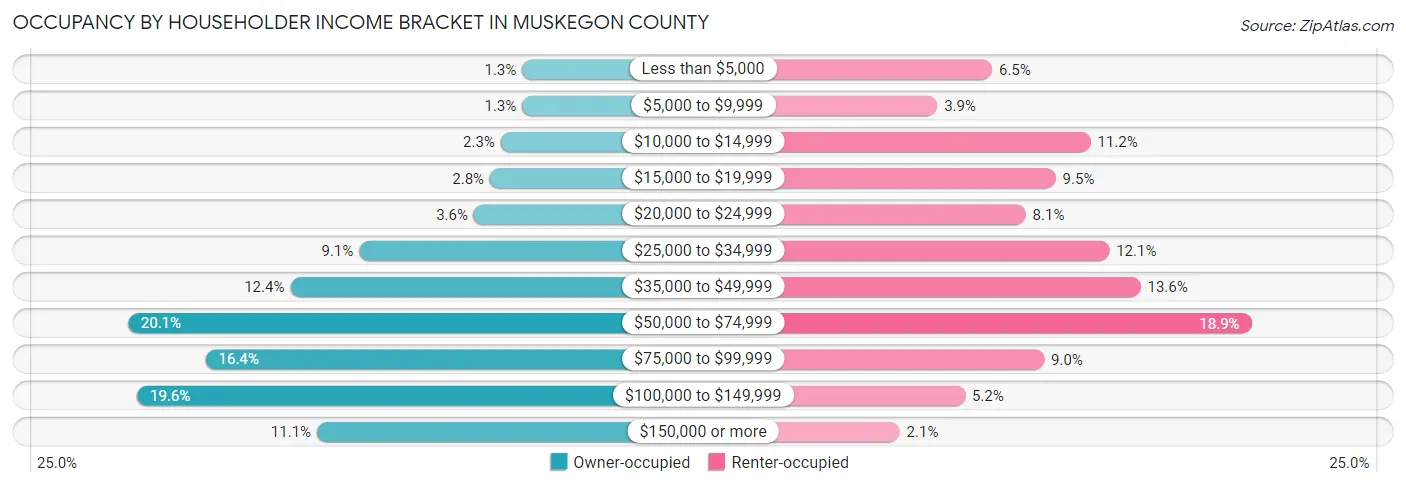
| Income Bracket | Owner-occupied | Renter-occupied |
| Less than $5,000 | 674 (1.3%) | 984 (6.5%) |
| $5,000 to $9,999 | 675 (1.3%) | 589 (3.9%) |
| $10,000 to $14,999 | 1,200 (2.3%) | 1,693 (11.2%) |
| $15,000 to $19,999 | 1,459 (2.8%) | 1,442 (9.5%) |
| $20,000 to $24,999 | 1,859 (3.6%) | 1,226 (8.1%) |
| $25,000 to $34,999 | 4,667 (9.1%) | 1,828 (12.1%) |
| $35,000 to $49,999 | 6,356 (12.3%) | 2,054 (13.6%) |
| $50,000 to $74,999 | 10,331 (20.1%) | 2,853 (18.9%) |
| $75,000 to $99,999 | 8,430 (16.4%) | 1,359 (9.0%) |
| $100,000 to $149,999 | 10,106 (19.6%) | 789 (5.2%) |
| $150,000 or more | 5,703 (11.1%) | 318 (2.1%) |
| Total | 51,460 (100.0%) | 15,135 (100.0%) |
Monthly Housing Cost Tiers in Muskegon County
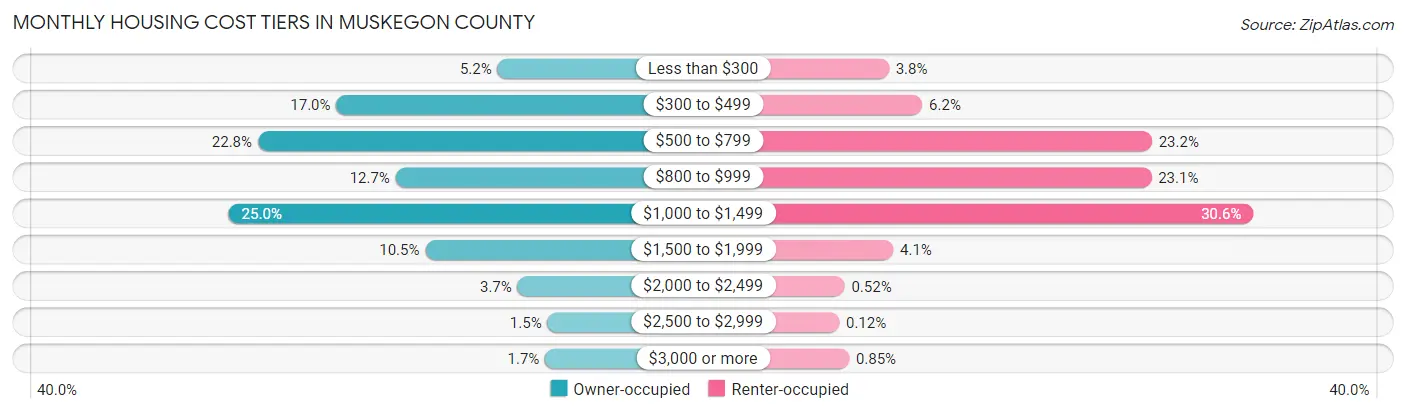
| Monthly Cost | Owner-occupied | Renter-occupied |
| Less than $300 | 2,659 (5.2%) | 572 (3.8%) |
| $300 to $499 | 8,770 (17.0%) | 945 (6.2%) |
| $500 to $799 | 11,744 (22.8%) | 3,503 (23.2%) |
| $800 to $999 | 6,522 (12.7%) | 3,498 (23.1%) |
| $1,000 to $1,499 | 12,850 (25.0%) | 4,635 (30.6%) |
| $1,500 to $1,999 | 5,397 (10.5%) | 620 (4.1%) |
| $2,000 to $2,499 | 1,899 (3.7%) | 78 (0.5%) |
| $2,500 to $2,999 | 766 (1.5%) | 18 (0.1%) |
| $3,000 or more | 853 (1.7%) | 129 (0.9%) |
| Total | 51,460 (100.0%) | 15,135 (100.0%) |
Physical Housing Characteristics in Muskegon County
Housing Structures in Muskegon County
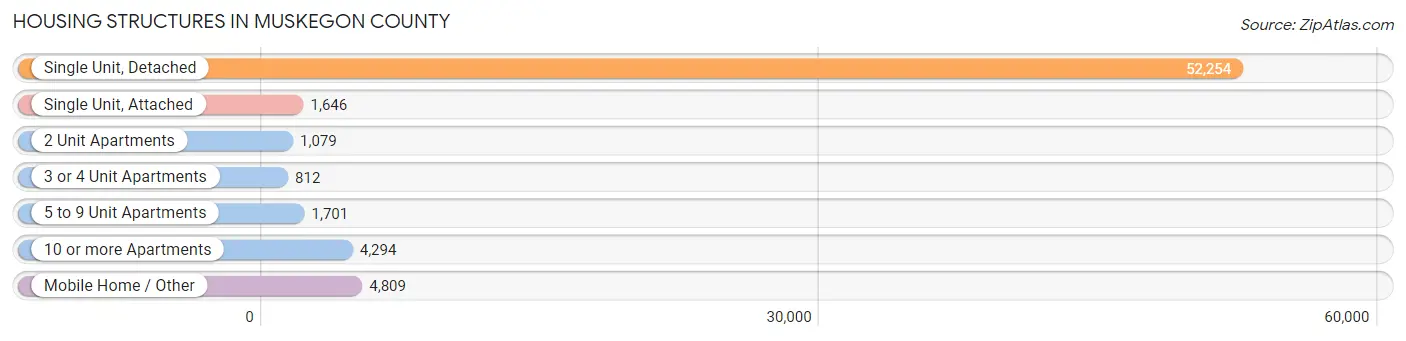
| Structure Type | # Housing Units | % Housing Units |
| Single Unit, Detached | 52,254 | 78.5% |
| Single Unit, Attached | 1,646 | 2.5% |
| 2 Unit Apartments | 1,079 | 1.6% |
| 3 or 4 Unit Apartments | 812 | 1.2% |
| 5 to 9 Unit Apartments | 1,701 | 2.5% |
| 10 or more Apartments | 4,294 | 6.5% |
| Mobile Home / Other | 4,809 | 7.2% |
| Total | 66,595 | 100.0% |
Housing Structures by Occupancy in Muskegon County
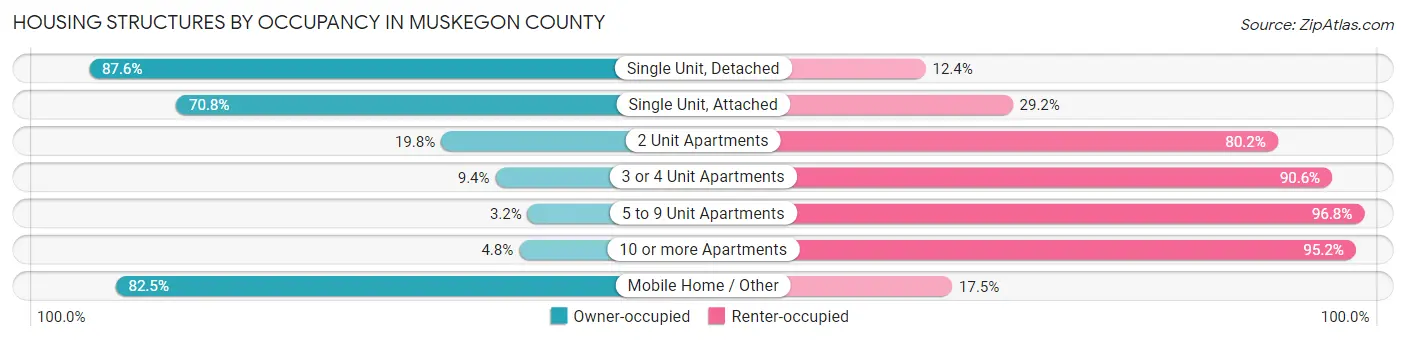
| Structure Type | Owner-occupied | Renter-occupied |
| Single Unit, Detached | 45,777 (87.6%) | 6,477 (12.4%) |
| Single Unit, Attached | 1,166 (70.8%) | 480 (29.2%) |
| 2 Unit Apartments | 214 (19.8%) | 865 (80.2%) |
| 3 or 4 Unit Apartments | 76 (9.4%) | 736 (90.6%) |
| 5 to 9 Unit Apartments | 54 (3.2%) | 1,647 (96.8%) |
| 10 or more Apartments | 206 (4.8%) | 4,088 (95.2%) |
| Mobile Home / Other | 3,967 (82.5%) | 842 (17.5%) |
| Total | 51,460 (77.3%) | 15,135 (22.7%) |
Housing Structures by Number of Rooms in Muskegon County
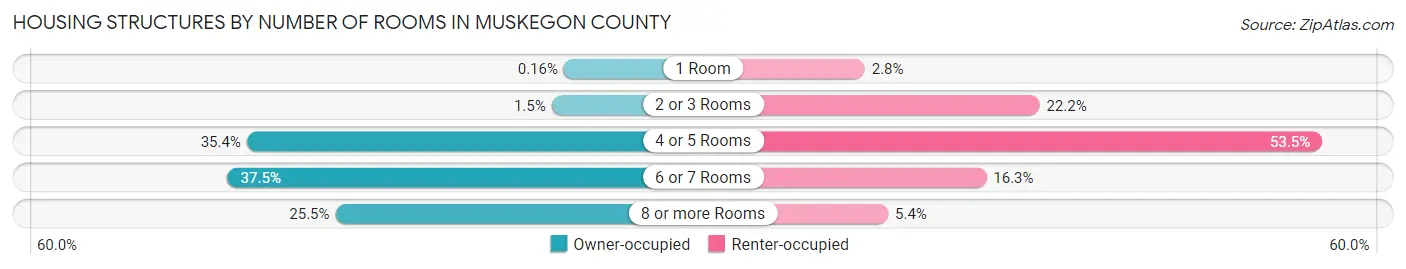
| Number of Rooms | Owner-occupied | Renter-occupied |
| 1 Room | 84 (0.2%) | 418 (2.8%) |
| 2 or 3 Rooms | 780 (1.5%) | 3,352 (22.2%) |
| 4 or 5 Rooms | 18,192 (35.3%) | 8,097 (53.5%) |
| 6 or 7 Rooms | 19,276 (37.5%) | 2,459 (16.3%) |
| 8 or more Rooms | 13,128 (25.5%) | 809 (5.3%) |
| Total | 51,460 (100.0%) | 15,135 (100.0%) |
Housing Structure by Heating Type in Muskegon County
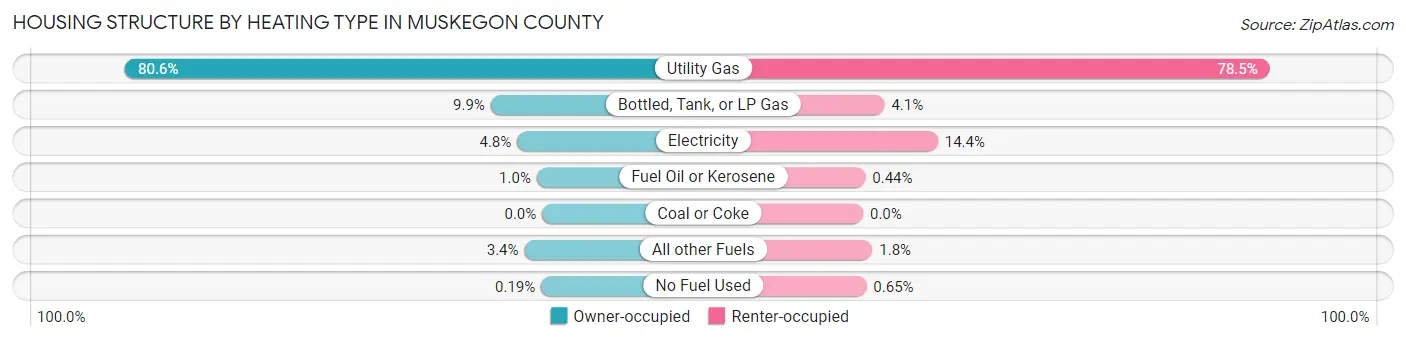
| Heating Type | Owner-occupied | Renter-occupied |
| Utility Gas | 41,463 (80.6%) | 11,887 (78.5%) |
| Bottled, Tank, or LP Gas | 5,111 (9.9%) | 626 (4.1%) |
| Electricity | 2,483 (4.8%) | 2,186 (14.4%) |
| Fuel Oil or Kerosene | 536 (1.0%) | 66 (0.4%) |
| Coal or Coke | 0 (0.0%) | 0 (0.0%) |
| All other Fuels | 1,767 (3.4%) | 271 (1.8%) |
| No Fuel Used | 100 (0.2%) | 99 (0.6%) |
| Total | 51,460 (100.0%) | 15,135 (100.0%) |
Household Vehicle Usage in Muskegon County
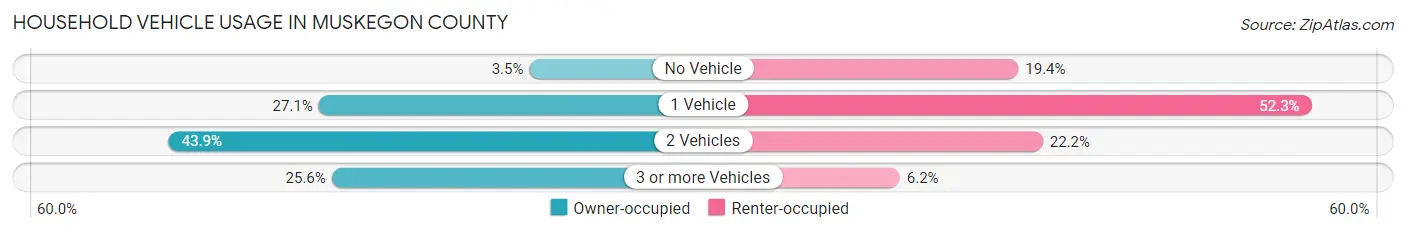
| Vehicles per Household | Owner-occupied | Renter-occupied |
| No Vehicle | 1,781 (3.5%) | 2,940 (19.4%) |
| 1 Vehicle | 13,926 (27.1%) | 7,908 (52.2%) |
| 2 Vehicles | 22,572 (43.9%) | 3,356 (22.2%) |
| 3 or more Vehicles | 13,181 (25.6%) | 931 (6.1%) |
| Total | 51,460 (100.0%) | 15,135 (100.0%) |
Real Estate & Mortgages in Muskegon County
Real Estate and Mortgage Overview in Muskegon County
| Characteristic | Without Mortgage | With Mortgage |
| Housing Units | 21,710 | 29,750 |
| Median Property Value | $145,200 | $170,500 |
| Median Household Income | $55,597 | $3,849 |
| Monthly Housing Costs | $495 | $848 |
| Real Estate Taxes | $2,096 | $1,139 |
Property Value by Mortgage Status in Muskegon County
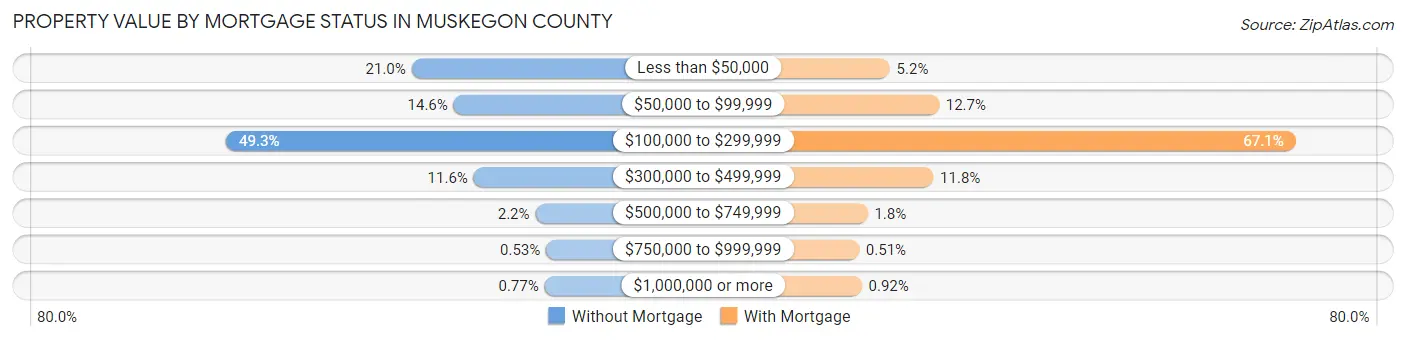
| Property Value | Without Mortgage | With Mortgage |
| Less than $50,000 | 4,567 (21.0%) | 1,546 (5.2%) |
| $50,000 to $99,999 | 3,177 (14.6%) | 3,774 (12.7%) |
| $100,000 to $299,999 | 10,699 (49.3%) | 19,947 (67.0%) |
| $300,000 to $499,999 | 2,511 (11.6%) | 3,519 (11.8%) |
| $500,000 to $749,999 | 472 (2.2%) | 540 (1.8%) |
| $750,000 to $999,999 | 116 (0.5%) | 151 (0.5%) |
| $1,000,000 or more | 168 (0.8%) | 273 (0.9%) |
| Total | 21,710 (100.0%) | 29,750 (100.0%) |
Household Income by Mortgage Status in Muskegon County
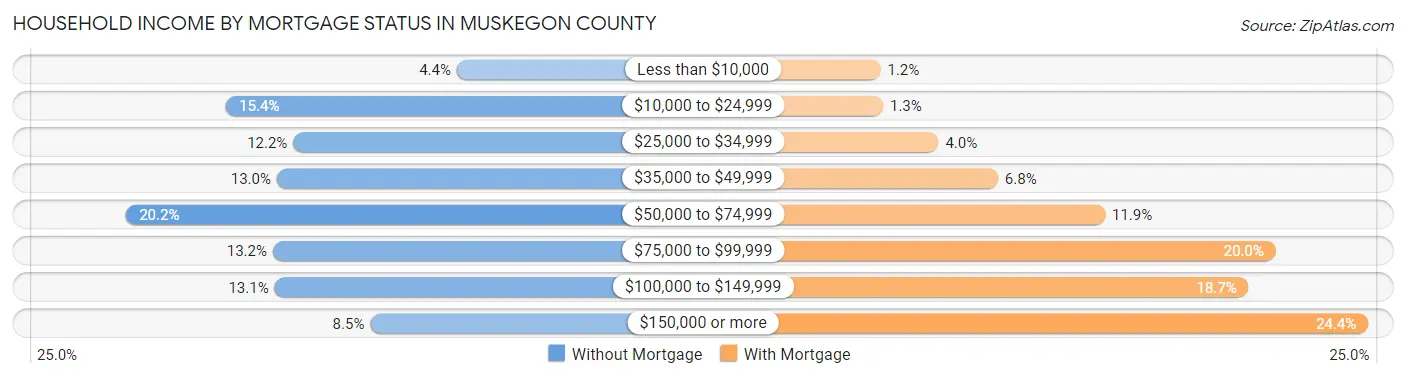
| Household Income | Without Mortgage | With Mortgage |
| Less than $10,000 | 959 (4.4%) | 355 (1.2%) |
| $10,000 to $24,999 | 3,343 (15.4%) | 390 (1.3%) |
| $25,000 to $34,999 | 2,651 (12.2%) | 1,175 (4.0%) |
| $35,000 to $49,999 | 2,821 (13.0%) | 2,016 (6.8%) |
| $50,000 to $74,999 | 4,377 (20.2%) | 3,535 (11.9%) |
| $75,000 to $99,999 | 2,862 (13.2%) | 5,954 (20.0%) |
| $100,000 to $149,999 | 2,843 (13.1%) | 5,568 (18.7%) |
| $150,000 or more | 1,854 (8.5%) | 7,263 (24.4%) |
| Total | 21,710 (100.0%) | 29,750 (100.0%) |
Property Value to Household Income Ratio in Muskegon County
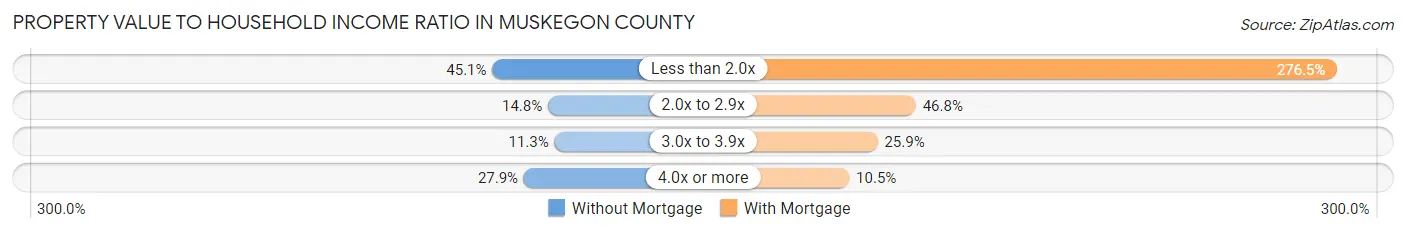
| Value-to-Income Ratio | Without Mortgage | With Mortgage |
| Less than 2.0x | 9,800 (45.1%) | 82,244 (276.4%) |
| 2.0x to 2.9x | 3,214 (14.8%) | 13,911 (46.8%) |
| 3.0x to 3.9x | 2,443 (11.3%) | 7,708 (25.9%) |
| 4.0x or more | 6,066 (27.9%) | 3,121 (10.5%) |
| Total | 21,710 (100.0%) | 29,750 (100.0%) |
Real Estate Taxes by Mortgage Status in Muskegon County
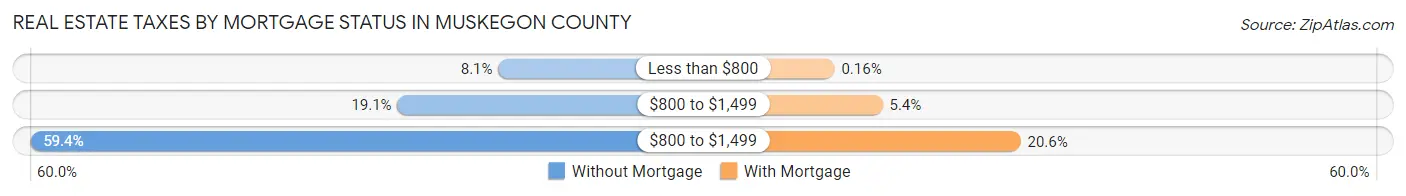
| Property Taxes | Without Mortgage | With Mortgage |
| Less than $800 | 1,754 (8.1%) | 47 (0.2%) |
| $800 to $1,499 | 4,155 (19.1%) | 1,611 (5.4%) |
| $800 to $1,499 | 12,891 (59.4%) | 6,113 (20.5%) |
| Total | 21,710 (100.0%) | 29,750 (100.0%) |
Health & Disability in Muskegon County
Health Insurance Coverage by Age in Muskegon County
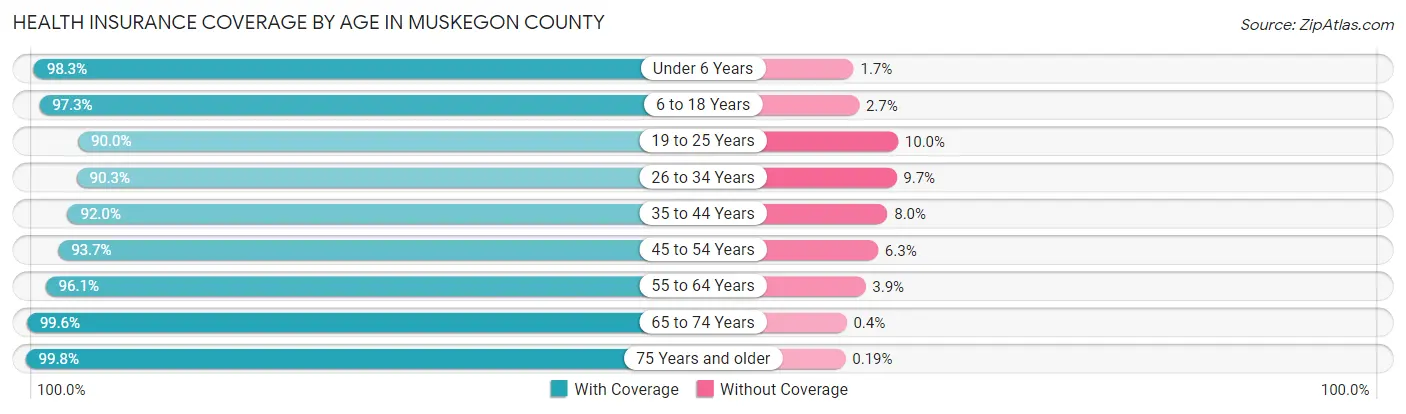
| Age Bracket | With Coverage | Without Coverage |
| Under 6 Years | 12,321 (98.3%) | 216 (1.7%) |
| 6 to 18 Years | 28,824 (97.3%) | 808 (2.7%) |
| 19 to 25 Years | 12,816 (90.0%) | 1,423 (10.0%) |
| 26 to 34 Years | 18,036 (90.3%) | 1,940 (9.7%) |
| 35 to 44 Years | 19,370 (92.0%) | 1,690 (8.0%) |
| 45 to 54 Years | 18,924 (93.7%) | 1,266 (6.3%) |
| 55 to 64 Years | 22,858 (96.1%) | 934 (3.9%) |
| 65 to 74 Years | 18,227 (99.6%) | 74 (0.4%) |
| 75 Years and older | 11,710 (99.8%) | 22 (0.2%) |
| Total | 163,086 (95.1%) | 8,373 (4.9%) |
Health Insurance Coverage by Citizenship Status in Muskegon County
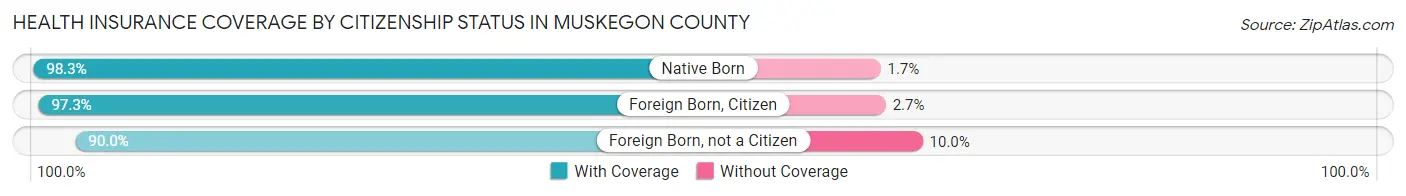
| Citizenship Status | With Coverage | Without Coverage |
| Native Born | 12,321 (98.3%) | 216 (1.7%) |
| Foreign Born, Citizen | 28,824 (97.3%) | 808 (2.7%) |
| Foreign Born, not a Citizen | 12,816 (90.0%) | 1,423 (10.0%) |
Health Insurance Coverage by Household Income in Muskegon County
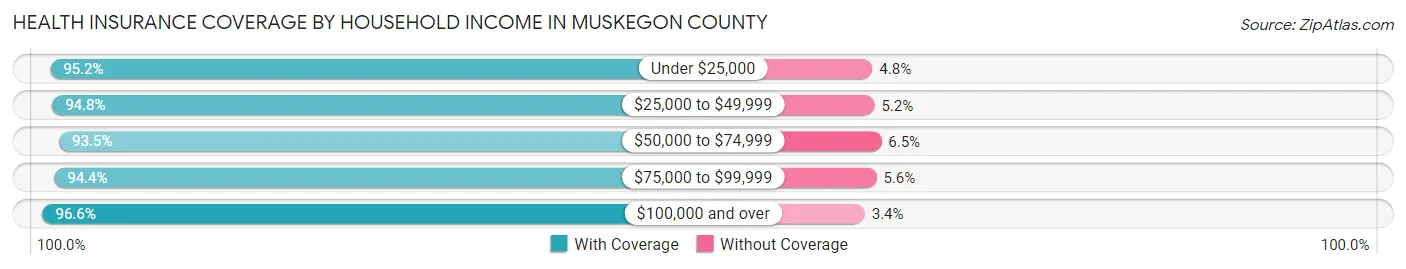
| Household Income | With Coverage | Without Coverage |
| Under $25,000 | 19,410 (95.2%) | 979 (4.8%) |
| $25,000 to $49,999 | 30,670 (94.8%) | 1,675 (5.2%) |
| $50,000 to $74,999 | 31,610 (93.5%) | 2,186 (6.5%) |
| $75,000 to $99,999 | 26,747 (94.4%) | 1,577 (5.6%) |
| $100,000 and over | 52,999 (96.6%) | 1,850 (3.4%) |
Public vs Private Health Insurance Coverage by Age in Muskegon County
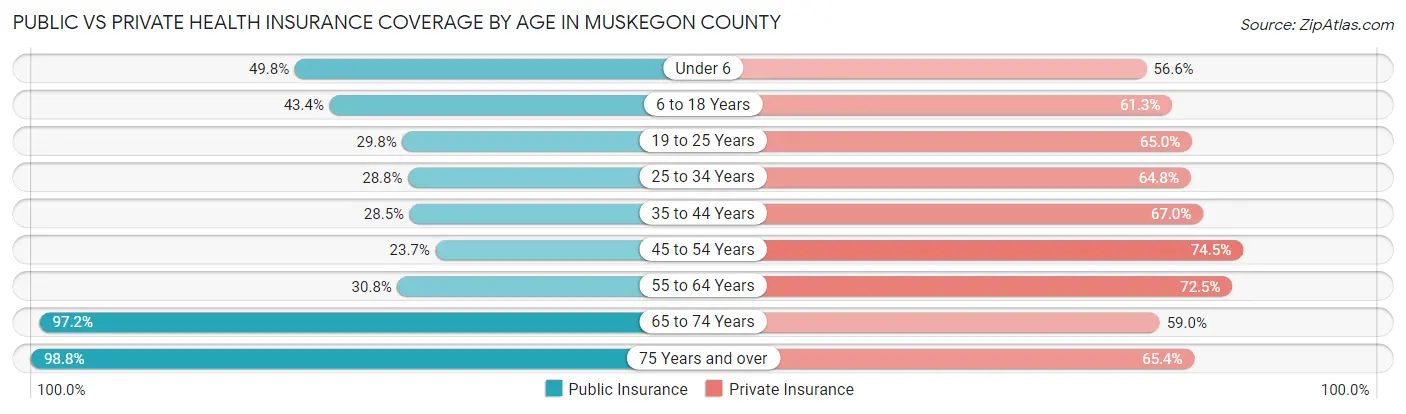
| Age Bracket | Public Insurance | Private Insurance |
| Under 6 | 6,245 (49.8%) | 7,090 (56.6%) |
| 6 to 18 Years | 12,849 (43.4%) | 18,173 (61.3%) |
| 19 to 25 Years | 4,249 (29.8%) | 9,258 (65.0%) |
| 25 to 34 Years | 5,750 (28.8%) | 12,941 (64.8%) |
| 35 to 44 Years | 5,997 (28.5%) | 14,118 (67.0%) |
| 45 to 54 Years | 4,787 (23.7%) | 15,034 (74.5%) |
| 55 to 64 Years | 7,316 (30.7%) | 17,248 (72.5%) |
| 65 to 74 Years | 17,791 (97.2%) | 10,800 (59.0%) |
| 75 Years and over | 11,592 (98.8%) | 7,677 (65.4%) |
| Total | 76,576 (44.7%) | 112,339 (65.5%) |
Disability Status by Sex by Age in Muskegon County
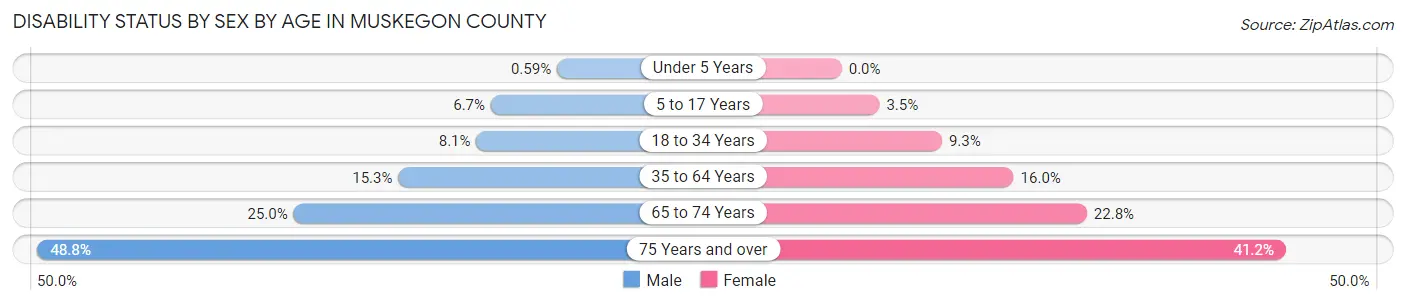
| Age Bracket | Male | Female |
| Under 5 Years | 31 (0.6%) | 0 (0.0%) |
| 5 to 17 Years | 1,010 (6.7%) | 506 (3.5%) |
| 18 to 34 Years | 1,502 (8.1%) | 1,676 (9.3%) |
| 35 to 64 Years | 4,919 (15.3%) | 5,251 (16.0%) |
| 65 to 74 Years | 2,175 (25.0%) | 2,187 (22.8%) |
| 75 Years and over | 2,359 (48.8%) | 2,842 (41.2%) |
Disability Class by Sex by Age in Muskegon County
Disability Class: Hearing Difficulty
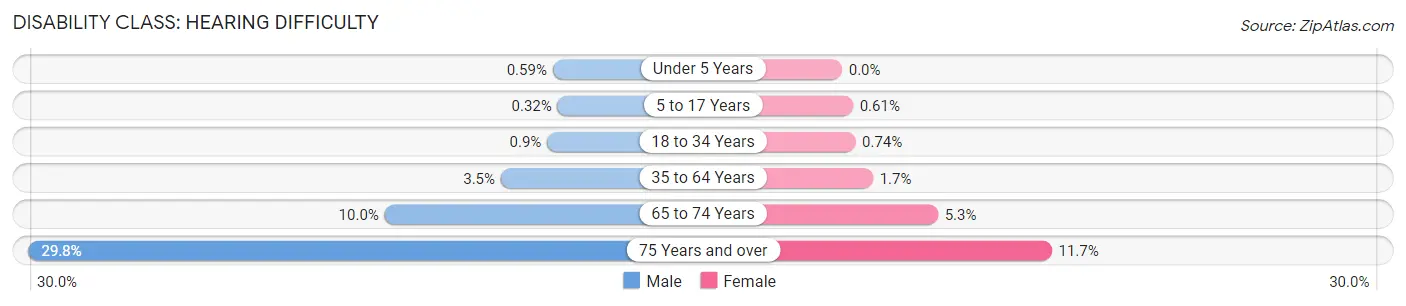
| Age Bracket | Male | Female |
| Under 5 Years | 31 (0.6%) | 0 (0.0%) |
| 5 to 17 Years | 48 (0.3%) | 89 (0.6%) |
| 18 to 34 Years | 167 (0.9%) | 133 (0.7%) |
| 35 to 64 Years | 1,116 (3.5%) | 565 (1.7%) |
| 65 to 74 Years | 864 (10.0%) | 513 (5.3%) |
| 75 Years and over | 1,440 (29.8%) | 806 (11.7%) |
Disability Class: Vision Difficulty
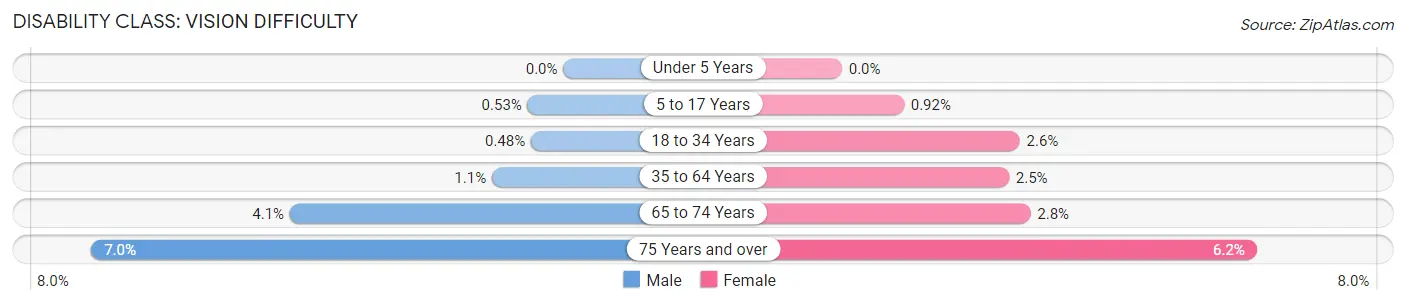
| Age Bracket | Male | Female |
| Under 5 Years | 0 (0.0%) | 0 (0.0%) |
| 5 to 17 Years | 80 (0.5%) | 133 (0.9%) |
| 18 to 34 Years | 89 (0.5%) | 475 (2.6%) |
| 35 to 64 Years | 342 (1.1%) | 817 (2.5%) |
| 65 to 74 Years | 353 (4.1%) | 269 (2.8%) |
| 75 Years and over | 339 (7.0%) | 425 (6.2%) |
Disability Class: Cognitive Difficulty
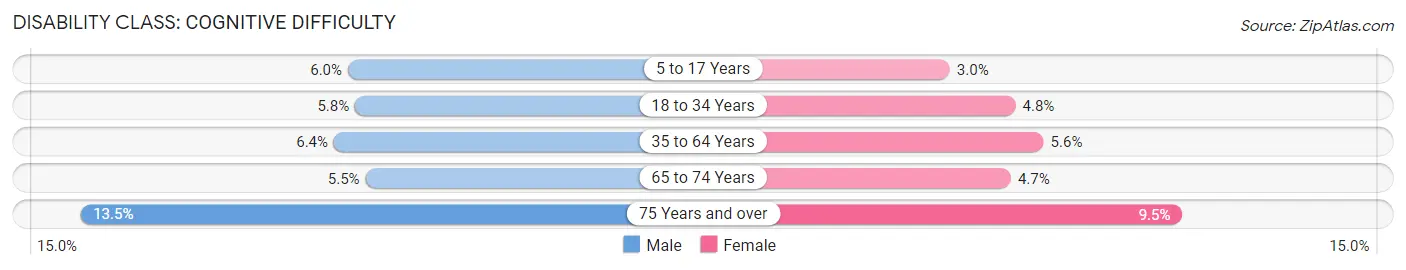
| Age Bracket | Male | Female |
| 5 to 17 Years | 901 (6.0%) | 435 (3.0%) |
| 18 to 34 Years | 1,079 (5.8%) | 872 (4.8%) |
| 35 to 64 Years | 2,053 (6.4%) | 1,849 (5.6%) |
| 65 to 74 Years | 479 (5.5%) | 453 (4.7%) |
| 75 Years and over | 650 (13.5%) | 654 (9.5%) |
Disability Class: Ambulatory Difficulty
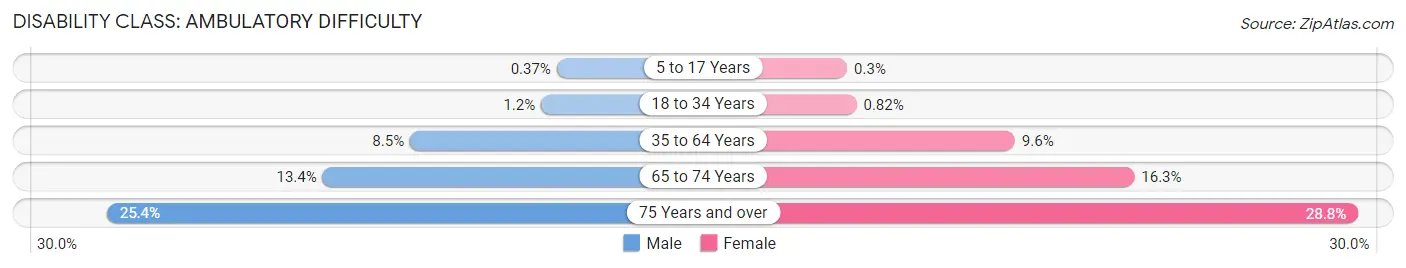
| Age Bracket | Male | Female |
| 5 to 17 Years | 56 (0.4%) | 43 (0.3%) |
| 18 to 34 Years | 231 (1.2%) | 147 (0.8%) |
| 35 to 64 Years | 2,742 (8.5%) | 3,173 (9.6%) |
| 65 to 74 Years | 1,165 (13.4%) | 1,566 (16.3%) |
| 75 Years and over | 1,229 (25.4%) | 1,983 (28.7%) |
Disability Class: Self-Care Difficulty
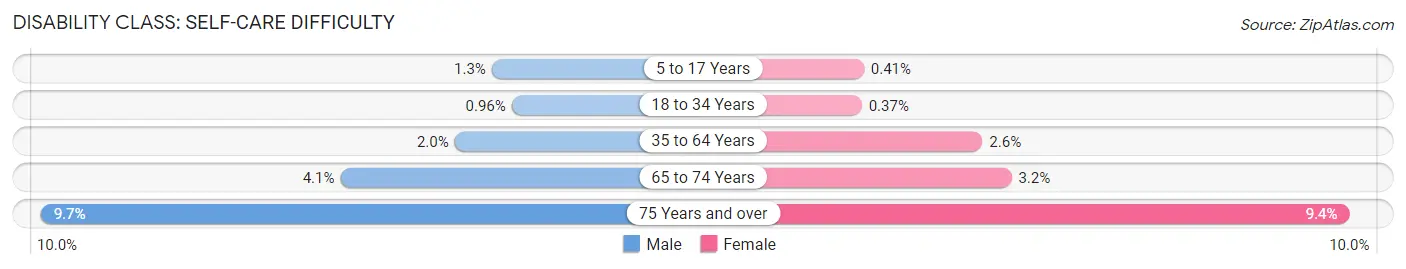
| Age Bracket | Male | Female |
| 5 to 17 Years | 200 (1.3%) | 60 (0.4%) |
| 18 to 34 Years | 178 (1.0%) | 67 (0.4%) |
| 35 to 64 Years | 649 (2.0%) | 860 (2.6%) |
| 65 to 74 Years | 360 (4.1%) | 303 (3.2%) |
| 75 Years and over | 469 (9.7%) | 650 (9.4%) |
Technology Access in Muskegon County
Computing Device Access in Muskegon County
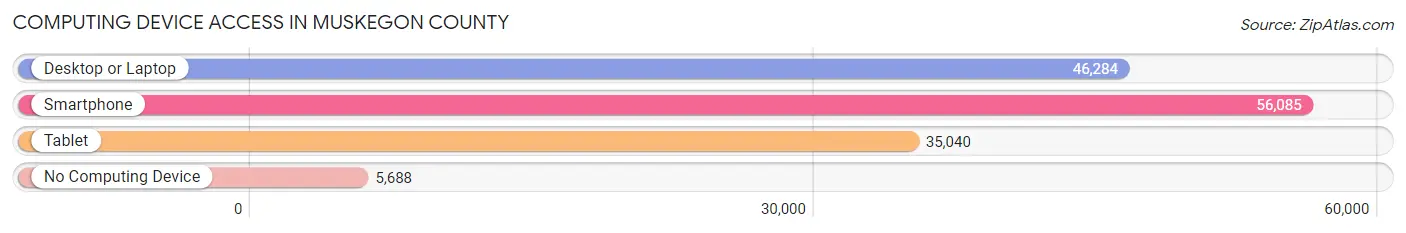
| Device Type | # Households | % Households |
| Desktop or Laptop | 46,284 | 69.5% |
| Smartphone | 56,085 | 84.2% |
| Tablet | 35,040 | 52.6% |
| No Computing Device | 5,688 | 8.5% |
| Total | 66,595 | 100.0% |
Internet Access in Muskegon County
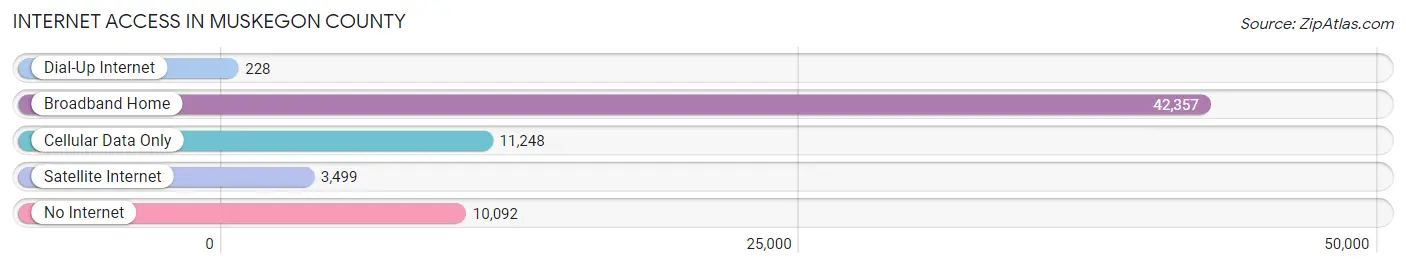
| Internet Type | # Households | % Households |
| Dial-Up Internet | 228 | 0.3% |
| Broadband Home | 42,357 | 63.6% |
| Cellular Data Only | 11,248 | 16.9% |
| Satellite Internet | 3,499 | 5.2% |
| No Internet | 10,092 | 15.1% |
| Total | 66,595 | 100.0% |
Muskegon County Summary
Muskegon County is located in the western part of the Lower Peninsula of Michigan. It is bordered by Lake Michigan to the west, Oceana County to the north, Newaygo County to the east, and Ottawa County to the south. The county seat is Muskegon, and the largest city is Norton Shores. The county has a total area of 1,460 square miles, of which 1,077 square miles is land and 383 square miles is water.
The county was first settled in 1837 by European Americans, primarily from New England. The county was organized in 1859 and named after the Muskegon River, which flows through the county. The county was originally part of Ottawa County, but was split off in 1859.
The economy of Muskegon County is largely based on manufacturing, with the automotive, aerospace, and defense industries being the largest employers. Other major employers include healthcare, retail, and tourism. The county is also home to several colleges and universities, including Muskegon Community College, Baker College, and Grand Valley State University.
The population of Muskegon County was estimated to be 172,344 in 2019. The population is largely white (86.3%), with African Americans making up 8.2% of the population, and Hispanics making up 4.2%. The median household income in the county was $50,945 in 2019, and the median home value was $133,400.
The county is served by several major highways, including Interstate 96, US-31, and M-46. The county is also served by several airports, including Muskegon County Airport, Muskegon County International Airport, and Muskegon County Regional Airport.
Muskegon County is home to several parks and recreational areas, including Muskegon State Park, Muskegon County Parks, and Muskegon County Recreation Areas. The county is also home to several museums, including the Muskegon Museum of Art, the Muskegon Heritage Museum, and the Muskegon County Historical Museum.
Muskegon County is a great place to live, work, and play. With its diverse economy, beautiful parks and recreational areas, and rich history, Muskegon County is a great place to call home.
Common Questions
What is Per Capita Income in Muskegon County?
Per Capita income in Muskegon County is $30,812.
What is the Median Family Income in Muskegon County?
Median Family Income in Muskegon County is $73,824.
What is the Median Household income in Muskegon County?
Median Household Income in Muskegon County is $61,347.
What is Income or Wage Gap in Muskegon County?
Income or Wage Gap in Muskegon County is 29.1%.
Women in Muskegon County earn 70.9 cents for every dollar earned by a man.
What is Family Income Deficit in Muskegon County?
Family Income Deficit in Muskegon County is $10,855.
Families that are below poverty line in Muskegon County earn $10,855 less on average than the poverty threshold level.
What is Inequality or Gini Index in Muskegon County?
Inequality or Gini Index in Muskegon County is 0.44.
What is the Total Population of Muskegon County?
Total Population of Muskegon County is 175,947.
What is the Total Male Population of Muskegon County?
Total Male Population of Muskegon County is 88,360.
What is the Total Female Population of Muskegon County?
Total Female Population of Muskegon County is 87,587.
What is the Ratio of Males per 100 Females in Muskegon County?
There are 100.88 Males per 100 Females in Muskegon County.
What is the Ratio of Females per 100 Males in Muskegon County?
There are 99.13 Females per 100 Males in Muskegon County.
What is the Median Population Age in Muskegon County?
Median Population Age in Muskegon County is 39.4 Years.
What is the Average Family Size in Muskegon County
Average Family Size in Muskegon County is 3.1 People.
What is the Average Household Size in Muskegon County
Average Household Size in Muskegon County is 2.5 People.
How Large is the Labor Force in Muskegon County?
There are 83,413 People in the Labor Forcein in Muskegon County.
What is the Percentage of People in the Labor Force in Muskegon County?
59.2% of People are in the Labor Force in Muskegon County.
What is the Unemployment Rate in Muskegon County?
Unemployment Rate in Muskegon County is 7.5%.