Grand Traverse County, MI Map & Demographics
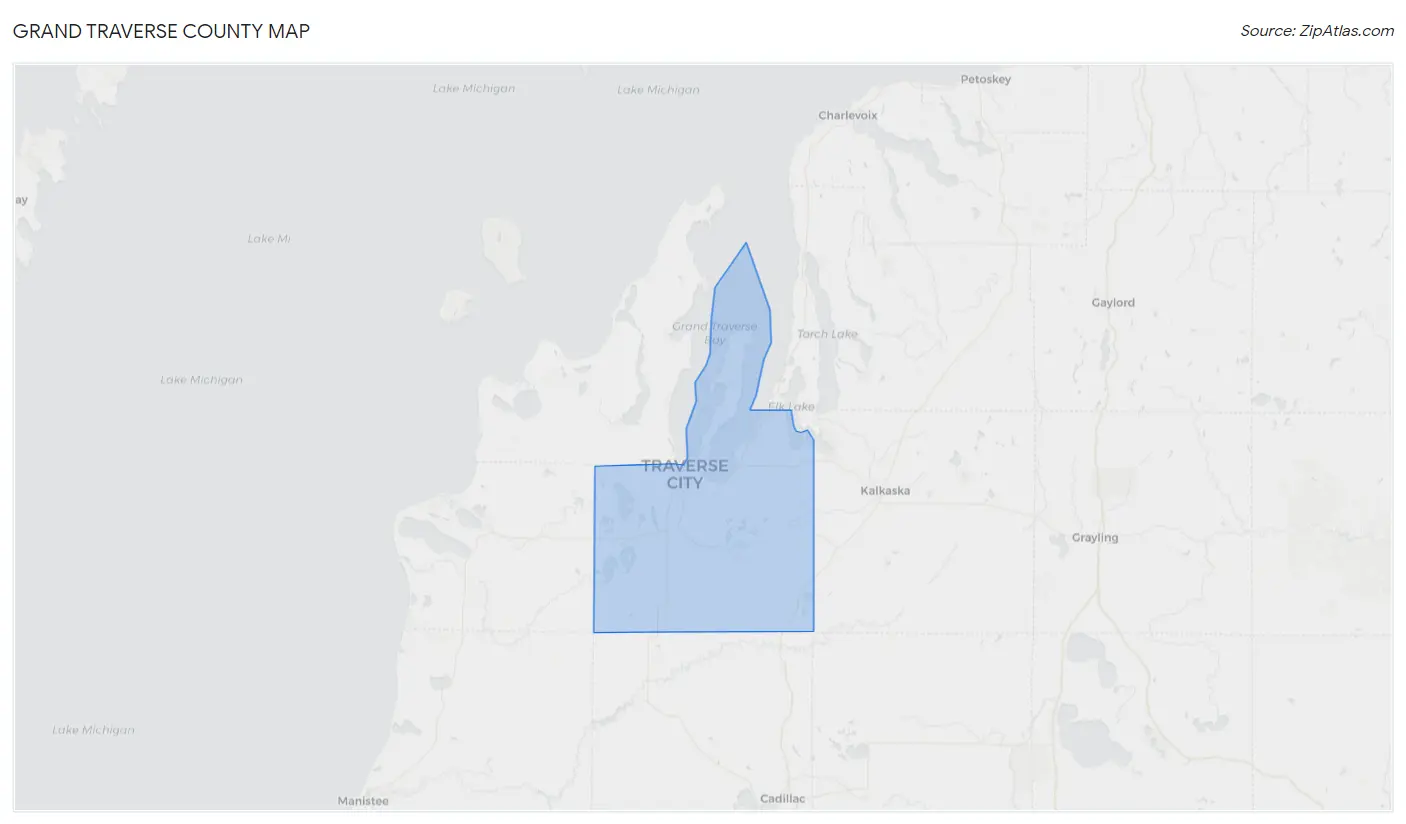
Grand Traverse County Map
Grand Traverse County Overview
$40,644
PER CAPITA INCOME
$93,542
AVG FAMILY INCOME
$75,553
AVG HOUSEHOLD INCOME
24.5%
WAGE / INCOME GAP [ % ]
75.5¢/ $1
WAGE / INCOME GAP [ $ ]
$11,194
FAMILY INCOME DEFICIT
0.44
INEQUALITY / GINI INDEX
95,315
TOTAL POPULATION
47,300
MALE POPULATION
48,015
FEMALE POPULATION
98.51
MALES / 100 FEMALES
101.51
FEMALES / 100 MALES
42.8
MEDIAN AGE
3.0
AVG FAMILY SIZE
2.4
AVG HOUSEHOLD SIZE
50,483
LABOR FORCE [ PEOPLE ]
64.3%
PERCENT IN LABOR FORCE
3.9%
UNEMPLOYMENT RATE
Grand Traverse County Area Codes
Income in Grand Traverse County
Income Overview in Grand Traverse County
Per Capita Income in Grand Traverse County is $40,644, while median incomes of families and households are $93,542 and $75,553 respectively.
| Characteristic | Number | Measure |
| Per Capita Income | 95,315 | $40,644 |
| Median Family Income | 23,898 | $93,542 |
| Mean Family Income | 23,898 | $113,356 |
| Median Household Income | 38,572 | $75,553 |
| Mean Household Income | 38,572 | $96,733 |
| Income Deficit | 23,898 | $11,194 |
| Wage / Income Gap (%) | 95,315 | 24.45% |
| Wage / Income Gap ($) | 95,315 | 75.55¢ per $1 |
| Gini / Inequality Index | 95,315 | 0.44 |
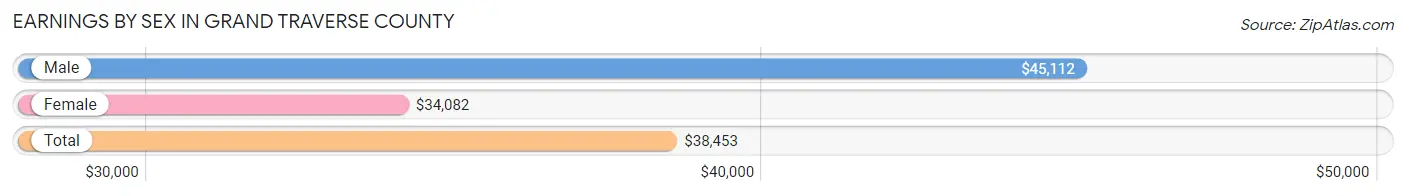
Earnings by Sex in Grand Traverse County
Average Earnings in Grand Traverse County are $38,453, $45,112 for men and $34,082 for women, a difference of 24.4%.
| Sex | Number | Average Earnings |
| Male | 27,930 (52.2%) | $45,112 |
| Female | 25,557 (47.8%) | $34,082 |
| Total | 53,487 (100.0%) | $38,453 |
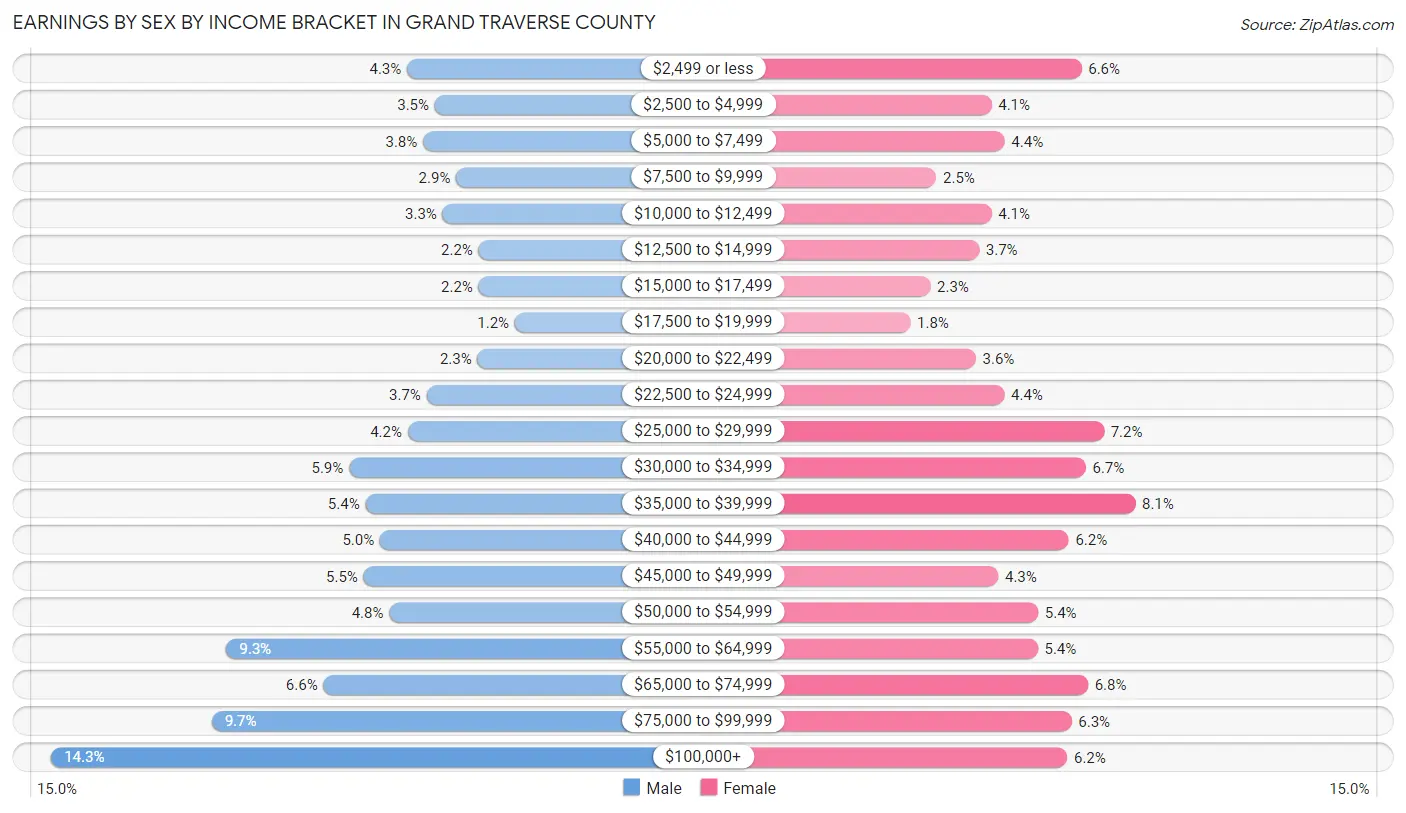
Earnings by Sex by Income Bracket in Grand Traverse County
The most common earnings brackets in Grand Traverse County are $100,000+ for men (3,981 | 14.2%) and $35,000 to $39,999 for women (2,069 | 8.1%).
| Income | Male | Female |
| $2,499 or less | 1,188 (4.3%) | 1,683 (6.6%) |
| $2,500 to $4,999 | 970 (3.5%) | 1,037 (4.1%) |
| $5,000 to $7,499 | 1,062 (3.8%) | 1,131 (4.4%) |
| $7,500 to $9,999 | 802 (2.9%) | 642 (2.5%) |
| $10,000 to $12,499 | 907 (3.3%) | 1,037 (4.1%) |
| $12,500 to $14,999 | 625 (2.2%) | 947 (3.7%) |
| $15,000 to $17,499 | 626 (2.2%) | 599 (2.3%) |
| $17,500 to $19,999 | 340 (1.2%) | 454 (1.8%) |
| $20,000 to $22,499 | 634 (2.3%) | 926 (3.6%) |
| $22,500 to $24,999 | 1,034 (3.7%) | 1,130 (4.4%) |
| $25,000 to $29,999 | 1,181 (4.2%) | 1,844 (7.2%) |
| $30,000 to $34,999 | 1,643 (5.9%) | 1,715 (6.7%) |
| $35,000 to $39,999 | 1,515 (5.4%) | 2,069 (8.1%) |
| $40,000 to $44,999 | 1,398 (5.0%) | 1,593 (6.2%) |
| $45,000 to $49,999 | 1,528 (5.5%) | 1,085 (4.3%) |
| $50,000 to $54,999 | 1,326 (4.8%) | 1,373 (5.4%) |
| $55,000 to $64,999 | 2,606 (9.3%) | 1,369 (5.4%) |
| $65,000 to $74,999 | 1,844 (6.6%) | 1,729 (6.8%) |
| $75,000 to $99,999 | 2,720 (9.7%) | 1,612 (6.3%) |
| $100,000+ | 3,981 (14.2%) | 1,582 (6.2%) |
| Total | 27,930 (100.0%) | 25,557 (100.0%) |
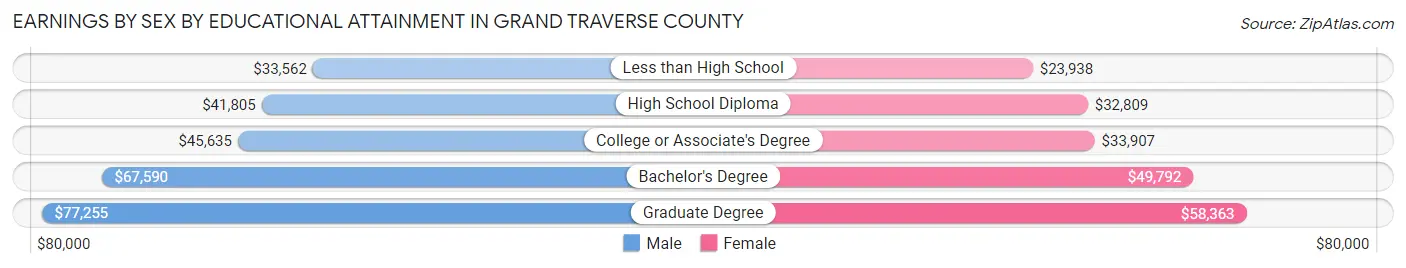
Earnings by Sex by Educational Attainment in Grand Traverse County
Average earnings in Grand Traverse County are $51,563 for men and $38,043 for women, a difference of 26.2%. Men with an educational attainment of graduate degree enjoy the highest average annual earnings of $77,255, while those with less than high school education earn the least with $33,562. Women with an educational attainment of graduate degree earn the most with the average annual earnings of $58,363, while those with less than high school education have the smallest earnings of $23,938.
| Educational Attainment | Male Income | Female Income |
| Less than High School | $33,562 | $23,938 |
| High School Diploma | $41,805 | $32,809 |
| College or Associate's Degree | $45,635 | $33,907 |
| Bachelor's Degree | $67,590 | $49,792 |
| Graduate Degree | $77,255 | $58,363 |
| Total | $51,563 | $38,043 |
Family Income in Grand Traverse County
Family Income Brackets in Grand Traverse County
According to the Grand Traverse County family income data, there are 6,142 families falling into the $100,000 to $149,999 income range, which is the most common income bracket and makes up 25.7% of all families. Conversely, the $10,000 to $14,999 income bracket is the least frequent group with only 287 families (1.2%) belonging to this category.
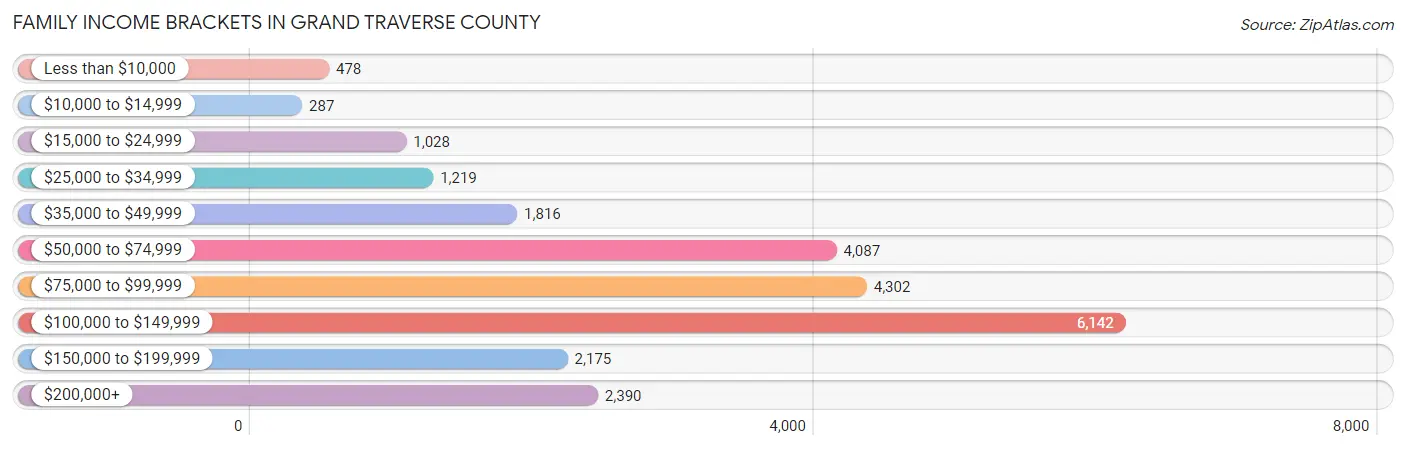
| Income Bracket | # Families | % Families |
| Less than $10,000 | 478 | 2.0% |
| $10,000 to $14,999 | 287 | 1.2% |
| $15,000 to $24,999 | 1,028 | 4.3% |
| $25,000 to $34,999 | 1,219 | 5.1% |
| $35,000 to $49,999 | 1,816 | 7.6% |
| $50,000 to $74,999 | 4,087 | 17.1% |
| $75,000 to $99,999 | 4,302 | 18.0% |
| $100,000 to $149,999 | 6,142 | 25.7% |
| $150,000 to $199,999 | 2,175 | 9.1% |
| $200,000+ | 2,390 | 10.0% |
Family Income by Famaliy Size in Grand Traverse County
5-person families (1,561 | 6.5%) account for the highest median family income in Grand Traverse County with $107,724 per family, while 2-person families (12,781 | 53.5%) have the highest median income of $41,677 per family member.
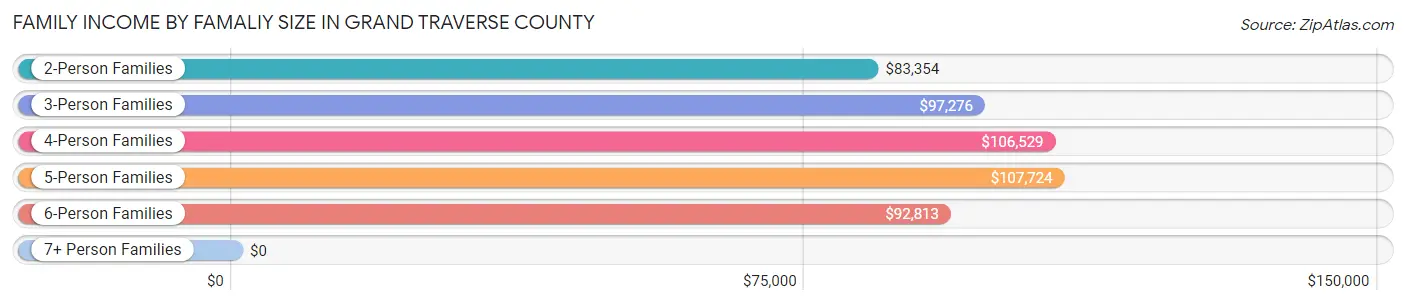
| Income Bracket | # Families | Median Income |
| 2-Person Families | 12,781 (53.5%) | $83,354 |
| 3-Person Families | 5,024 (21.0%) | $97,276 |
| 4-Person Families | 3,822 (16.0%) | $106,529 |
| 5-Person Families | 1,561 (6.5%) | $107,724 |
| 6-Person Families | 461 (1.9%) | $92,813 |
| 7+ Person Families | 249 (1.0%) | $0 |
| Total | 23,898 (100.0%) | $93,542 |
Family Income by Number of Earners in Grand Traverse County
The median family income in Grand Traverse County is $93,542, with families comprising 3+ earners (2,618) having the highest median family income of $120,303, while families with no earners (3,939) have the lowest median family income of $63,101, accounting for 11.0% and 16.5% of families, respectively.
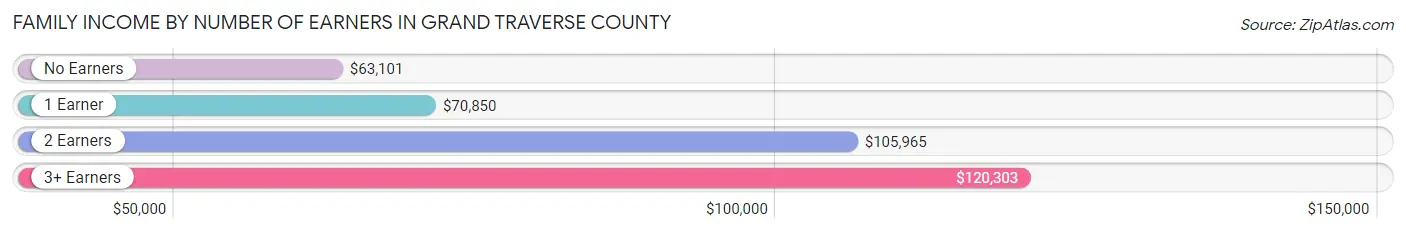
| Number of Earners | # Families | Median Income |
| No Earners | 3,939 (16.5%) | $63,101 |
| 1 Earner | 7,280 (30.5%) | $70,850 |
| 2 Earners | 10,061 (42.1%) | $105,965 |
| 3+ Earners | 2,618 (11.0%) | $120,303 |
| Total | 23,898 (100.0%) | $93,542 |
Household Income in Grand Traverse County
Household Income Brackets in Grand Traverse County
With 7,792 households falling in the category, the $100,000 to $149,999 income range is the most frequent in Grand Traverse County, accounting for 20.2% of all households. In contrast, only 849 households (2.2%) fall into the $10,000 to $14,999 income bracket, making it the least populous group.
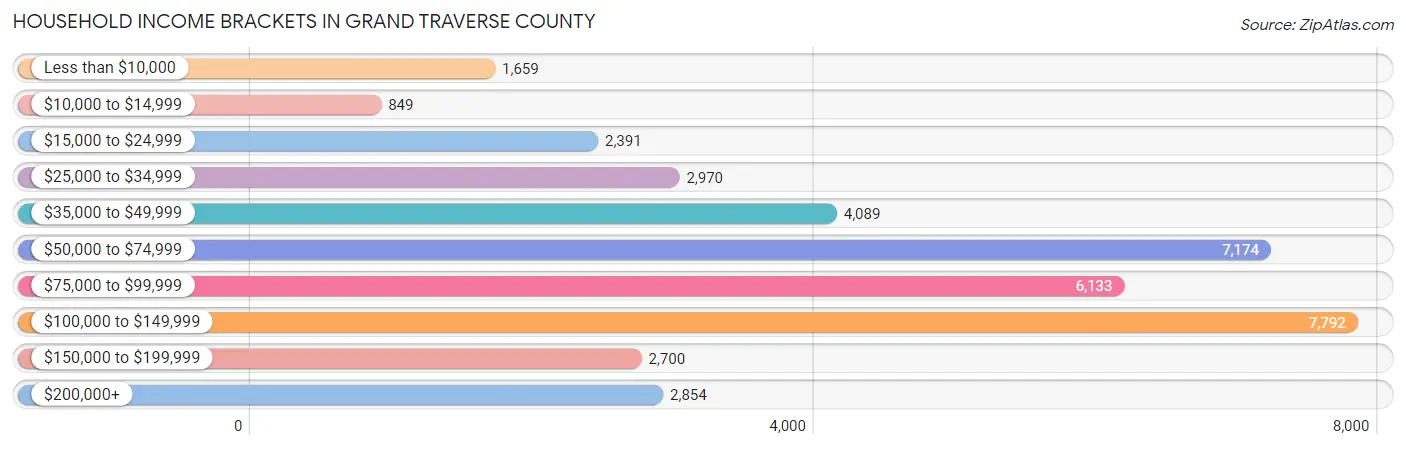
| Income Bracket | # Households | % Households |
| Less than $10,000 | 1,659 | 4.3% |
| $10,000 to $14,999 | 849 | 2.2% |
| $15,000 to $24,999 | 2,391 | 6.2% |
| $25,000 to $34,999 | 2,970 | 7.7% |
| $35,000 to $49,999 | 4,089 | 10.6% |
| $50,000 to $74,999 | 7,174 | 18.6% |
| $75,000 to $99,999 | 6,133 | 15.9% |
| $100,000 to $149,999 | 7,792 | 20.2% |
| $150,000 to $199,999 | 2,700 | 7.0% |
| $200,000+ | 2,854 | 7.4% |
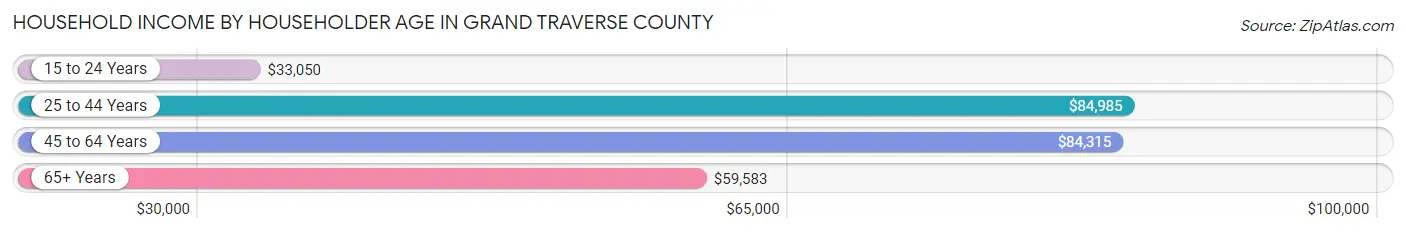
Household Income by Householder Age in Grand Traverse County
The median household income in Grand Traverse County is $75,553, with the highest median household income of $84,985 found in the 25 to 44 years age bracket for the primary householder. A total of 10,839 households (28.1%) fall into this category. Meanwhile, the 15 to 24 years age bracket for the primary householder has the lowest median household income of $33,050, with 914 households (2.4%) in this group.
| Income Bracket | # Households | Median Income |
| 15 to 24 Years | 914 (2.4%) | $33,050 |
| 25 to 44 Years | 10,839 (28.1%) | $84,985 |
| 45 to 64 Years | 14,233 (36.9%) | $84,315 |
| 65+ Years | 12,586 (32.6%) | $59,583 |
| Total | 38,572 (100.0%) | $75,553 |
Poverty in Grand Traverse County
Income Below Poverty by Sex and Age in Grand Traverse County
With 10.8% poverty level for males and 10.0% for females among the residents of Grand Traverse County, under 5 year old males and 5 year old females are the most vulnerable to poverty, with 605 males (24.4%) and 169 females (25.6%) in their respective age groups living below the poverty level.
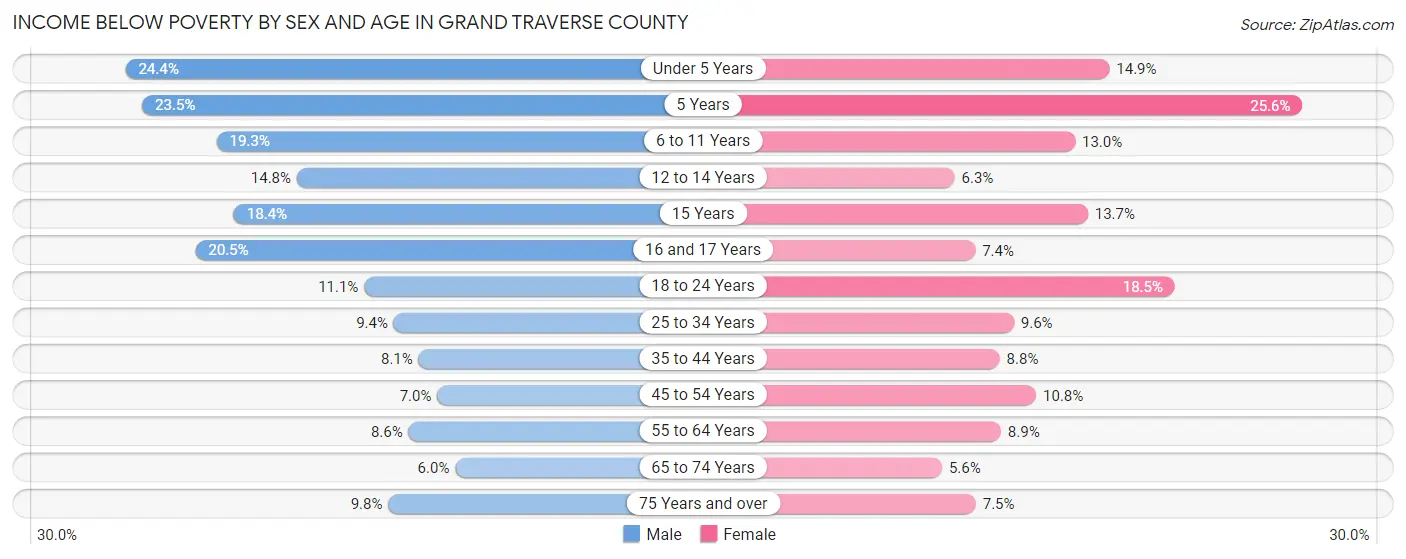
| Age Bracket | Male | Female |
| Under 5 Years | 605 (24.4%) | 317 (14.9%) |
| 5 Years | 122 (23.5%) | 169 (25.6%) |
| 6 to 11 Years | 625 (19.3%) | 346 (13.0%) |
| 12 to 14 Years | 250 (14.8%) | 104 (6.3%) |
| 15 Years | 127 (18.3%) | 97 (13.7%) |
| 16 and 17 Years | 209 (20.5%) | 70 (7.4%) |
| 18 to 24 Years | 421 (11.1%) | 644 (18.5%) |
| 25 to 34 Years | 550 (9.4%) | 562 (9.6%) |
| 35 to 44 Years | 463 (8.1%) | 492 (8.8%) |
| 45 to 54 Years | 410 (7.0%) | 625 (10.8%) |
| 55 to 64 Years | 603 (8.6%) | 649 (8.9%) |
| 65 to 74 Years | 342 (6.0%) | 343 (5.6%) |
| 75 Years and over | 300 (9.8%) | 327 (7.5%) |
| Total | 5,027 (10.8%) | 4,745 (10.0%) |
Income Above Poverty by Sex and Age in Grand Traverse County
According to the poverty statistics in Grand Traverse County, males aged 65 to 74 years and females aged 65 to 74 years are the age groups that are most secure financially, with 94.0% of males and 94.4% of females in these age groups living above the poverty line.
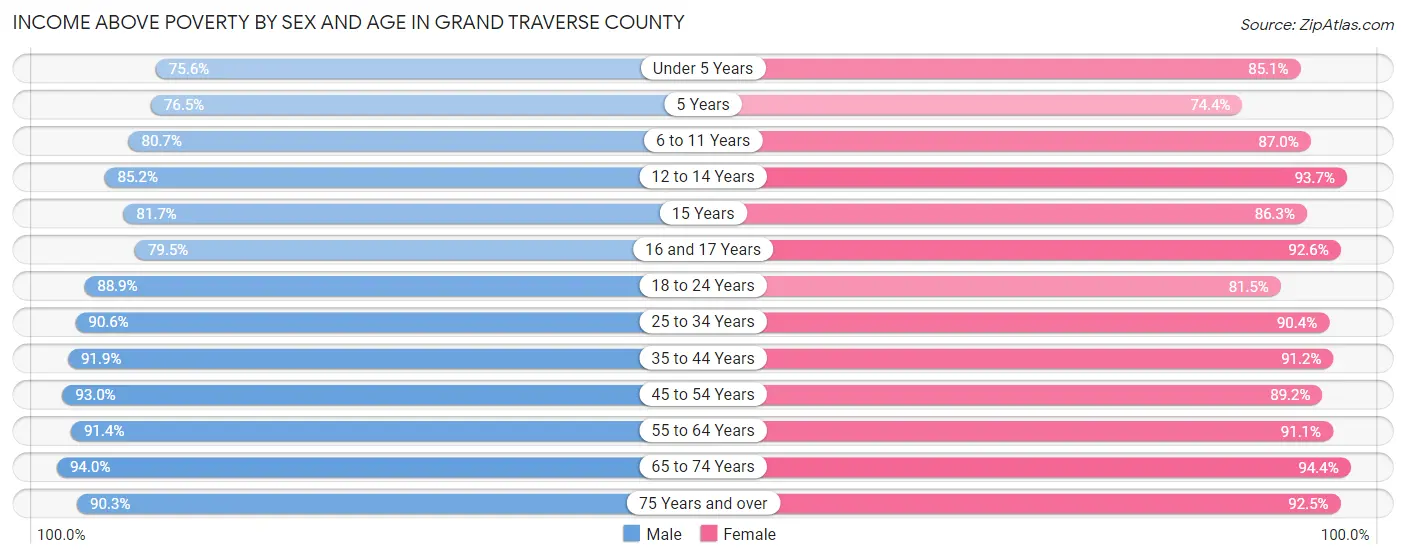
| Age Bracket | Male | Female |
| Under 5 Years | 1,877 (75.6%) | 1,810 (85.1%) |
| 5 Years | 398 (76.5%) | 490 (74.4%) |
| 6 to 11 Years | 2,612 (80.7%) | 2,317 (87.0%) |
| 12 to 14 Years | 1,435 (85.2%) | 1,553 (93.7%) |
| 15 Years | 565 (81.7%) | 611 (86.3%) |
| 16 and 17 Years | 811 (79.5%) | 872 (92.6%) |
| 18 to 24 Years | 3,376 (88.9%) | 2,830 (81.5%) |
| 25 to 34 Years | 5,276 (90.6%) | 5,304 (90.4%) |
| 35 to 44 Years | 5,281 (91.9%) | 5,104 (91.2%) |
| 45 to 54 Years | 5,430 (93.0%) | 5,152 (89.2%) |
| 55 to 64 Years | 6,396 (91.4%) | 6,679 (91.1%) |
| 65 to 74 Years | 5,342 (94.0%) | 5,802 (94.4%) |
| 75 Years and over | 2,777 (90.2%) | 4,054 (92.5%) |
| Total | 41,576 (89.2%) | 42,578 (90.0%) |
Income Below Poverty Among Married-Couple Families in Grand Traverse County
The poverty statistics for married-couple families in Grand Traverse County show that 3.2% or 608 of the total 19,083 families live below the poverty line. Families with 5 or more children have the highest poverty rate of 18.2%, comprising of 26 families. On the other hand, families with 1 or 2 children have the lowest poverty rate of 2.1%, which includes 102 families.
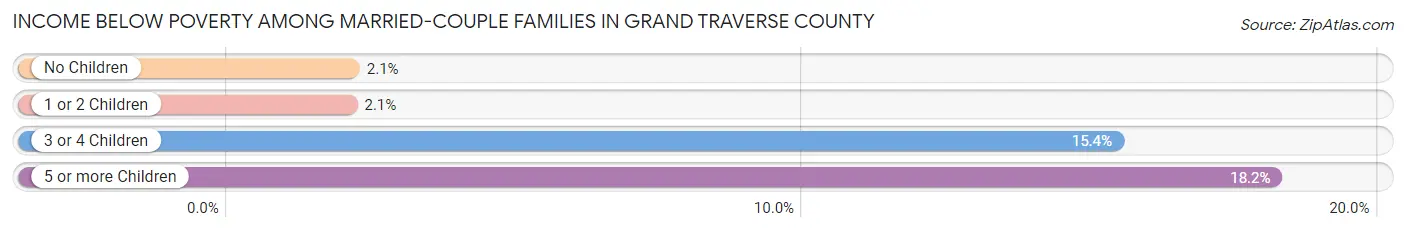
| Children | Above Poverty | Below Poverty |
| No Children | 12,410 (97.9%) | 269 (2.1%) |
| 1 or 2 Children | 4,791 (97.9%) | 102 (2.1%) |
| 3 or 4 Children | 1,157 (84.6%) | 211 (15.4%) |
| 5 or more Children | 117 (81.8%) | 26 (18.2%) |
| Total | 18,475 (96.8%) | 608 (3.2%) |
Income Below Poverty Among Single-Parent Households in Grand Traverse County
According to the poverty data in Grand Traverse County, 12.4% or 204 single-father households and 24.8% or 786 single-mother households are living below the poverty line. Among single-father households, those with 1 or 2 children have the highest poverty rate, with 173 households (16.5%) experiencing poverty. Likewise, among single-mother households, those with 5 or more children have the highest poverty rate, with 36 households (100.0%) falling below the poverty line.
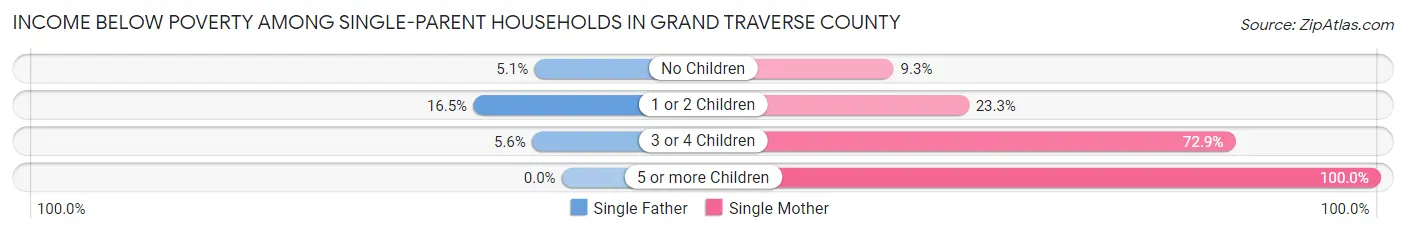
| Children | Single Father | Single Mother |
| No Children | 24 (5.1%) | 105 (9.3%) |
| 1 or 2 Children | 173 (16.5%) | 384 (23.3%) |
| 3 or 4 Children | 7 (5.6%) | 261 (72.9%) |
| 5 or more Children | 0 (0.0%) | 36 (100.0%) |
| Total | 204 (12.4%) | 786 (24.8%) |
Income Below Poverty Among Married-Couple vs Single-Parent Households in Grand Traverse County
The poverty data for Grand Traverse County shows that 608 of the married-couple family households (3.2%) and 990 of the single-parent households (20.6%) are living below the poverty level. Within the married-couple family households, those with 5 or more children have the highest poverty rate, with 26 households (18.2%) falling below the poverty line. Among the single-parent households, those with 5 or more children have the highest poverty rate, with 36 household (100.0%) living below poverty.
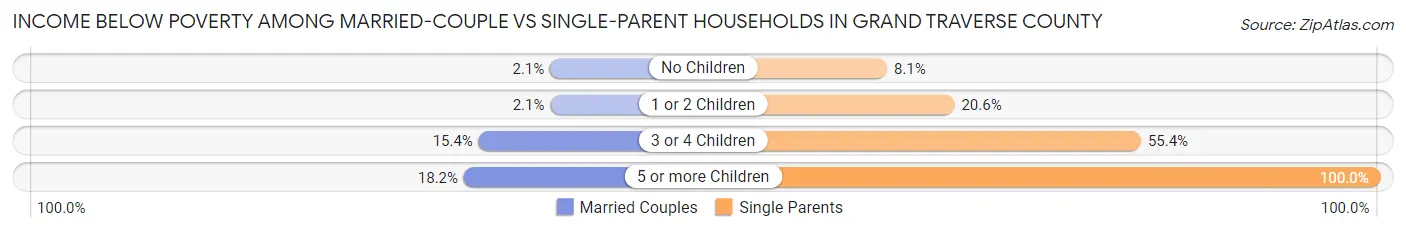
| Children | Married-Couple Families | Single-Parent Households |
| No Children | 269 (2.1%) | 129 (8.1%) |
| 1 or 2 Children | 102 (2.1%) | 557 (20.6%) |
| 3 or 4 Children | 211 (15.4%) | 268 (55.4%) |
| 5 or more Children | 26 (18.2%) | 36 (100.0%) |
| Total | 608 (3.2%) | 990 (20.6%) |
Race in Grand Traverse County
The most populous races in Grand Traverse County are White / Caucasian (88,814 | 93.2%), Two or more Races (3,684 | 3.9%), and Hispanic or Latino (2,951 | 3.1%).
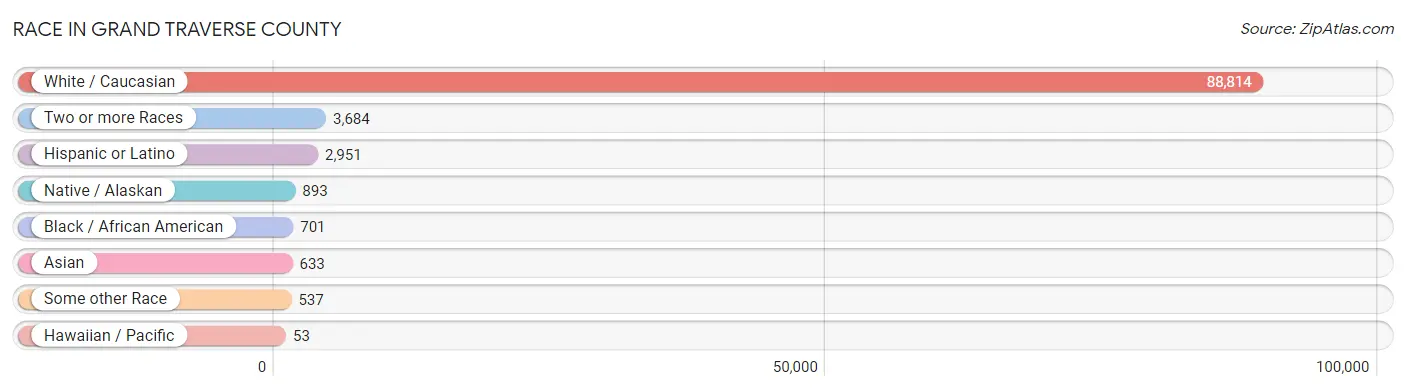
| Race | # Population | % Population |
| Asian | 633 | 0.7% |
| Black / African American | 701 | 0.7% |
| Hawaiian / Pacific | 53 | 0.1% |
| Hispanic or Latino | 2,951 | 3.1% |
| Native / Alaskan | 893 | 0.9% |
| White / Caucasian | 88,814 | 93.2% |
| Two or more Races | 3,684 | 3.9% |
| Some other Race | 537 | 0.6% |
| Total | 95,315 | 100.0% |
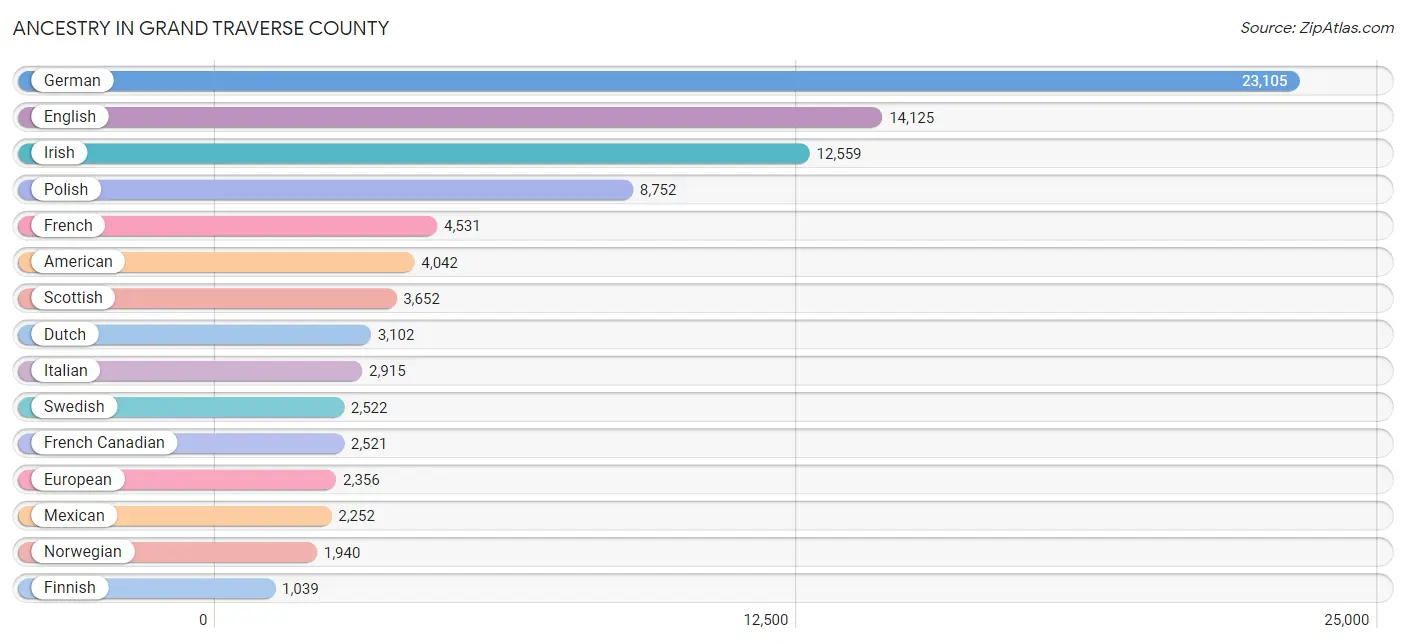
Ancestry in Grand Traverse County
The most populous ancestries reported in Grand Traverse County are German (23,105 | 24.2%), English (14,125 | 14.8%), Irish (12,559 | 13.2%), Polish (8,752 | 9.2%), and French (4,531 | 4.8%), together accounting for 66.2% of all Grand Traverse County residents.
| Ancestry | # Population | % Population |
| African | 48 | 0.1% |
| American | 4,042 | 4.2% |
| Apache | 34 | 0.0% |
| Arab | 70 | 0.1% |
| Armenian | 70 | 0.1% |
| Austrian | 242 | 0.3% |
| Bangladeshi | 23 | 0.0% |
| Belgian | 177 | 0.2% |
| Bhutanese | 45 | 0.1% |
| Blackfeet | 89 | 0.1% |
| British | 461 | 0.5% |
| British West Indian | 7 | 0.0% |
| Bulgarian | 112 | 0.1% |
| Burmese | 206 | 0.2% |
| Cambodian | 72 | 0.1% |
| Canadian | 461 | 0.5% |
| Celtic | 35 | 0.0% |
| Central American | 130 | 0.1% |
| Central American Indian | 239 | 0.3% |
| Cherokee | 306 | 0.3% |
| Chickasaw | 7 | 0.0% |
| Chippewa | 730 | 0.8% |
| Colombian | 24 | 0.0% |
| Croatian | 200 | 0.2% |
| Cuban | 109 | 0.1% |
| Czech | 916 | 1.0% |
| Czechoslovakian | 149 | 0.2% |
| Danish | 726 | 0.8% |
| Dutch | 3,102 | 3.3% |
| Eastern European | 442 | 0.5% |
| English | 14,125 | 14.8% |
| European | 2,356 | 2.5% |
| Filipino | 26 | 0.0% |
| Finnish | 1,039 | 1.1% |
| French | 4,531 | 4.8% |
| French American Indian | 1 | 0.0% |
| French Canadian | 2,521 | 2.6% |
| German | 23,105 | 24.2% |
| Greek | 213 | 0.2% |
| Guamanian / Chamorro | 5 | 0.0% |
| Guatemalan | 32 | 0.0% |
| Honduran | 4 | 0.0% |
| Hungarian | 924 | 1.0% |
| Icelander | 5 | 0.0% |
| Indian (Asian) | 219 | 0.2% |
| Irish | 12,559 | 13.2% |
| Italian | 2,915 | 3.1% |
| Jamaican | 20 | 0.0% |
| Korean | 220 | 0.2% |
| Laotian | 30 | 0.0% |
| Latvian | 48 | 0.1% |
| Lebanese | 64 | 0.1% |
| Lithuanian | 249 | 0.3% |
| Lumbee | 11 | 0.0% |
| Malaysian | 17 | 0.0% |
| Maltese | 6 | 0.0% |
| Mexican | 2,252 | 2.4% |
| Mexican American Indian | 28 | 0.0% |
| Native Hawaiian | 33 | 0.0% |
| Nigerian | 8 | 0.0% |
| Northern European | 216 | 0.2% |
| Norwegian | 1,940 | 2.0% |
| Ottawa | 120 | 0.1% |
| Pakistani | 23 | 0.0% |
| Pennsylvania German | 99 | 0.1% |
| Polish | 8,752 | 9.2% |
| Portuguese | 17 | 0.0% |
| Potawatomi | 90 | 0.1% |
| Puerto Rican | 167 | 0.2% |
| Romanian | 45 | 0.1% |
| Russian | 306 | 0.3% |
| Salvadoran | 94 | 0.1% |
| Samoan | 41 | 0.0% |
| Scandinavian | 651 | 0.7% |
| Scotch-Irish | 951 | 1.0% |
| Scottish | 3,652 | 3.8% |
| Seminole | 14 | 0.0% |
| Serbian | 28 | 0.0% |
| Sioux | 35 | 0.0% |
| Slavic | 100 | 0.1% |
| Slovak | 168 | 0.2% |
| Slovene | 31 | 0.0% |
| South American | 59 | 0.1% |
| Spaniard | 112 | 0.1% |
| Spanish | 59 | 0.1% |
| Sri Lankan | 124 | 0.1% |
| Subsaharan African | 95 | 0.1% |
| Swedish | 2,522 | 2.6% |
| Swiss | 400 | 0.4% |
| Syrian | 6 | 0.0% |
| Thai | 115 | 0.1% |
| Tlingit-Haida | 19 | 0.0% |
| Turkish | 30 | 0.0% |
| Ukrainian | 531 | 0.6% |
| Vietnamese | 26 | 0.0% |
| Welsh | 428 | 0.4% |
| Yugoslavian | 60 | 0.1% |
| Zimbabwean | 39 | 0.0% | View All 98 Rows |
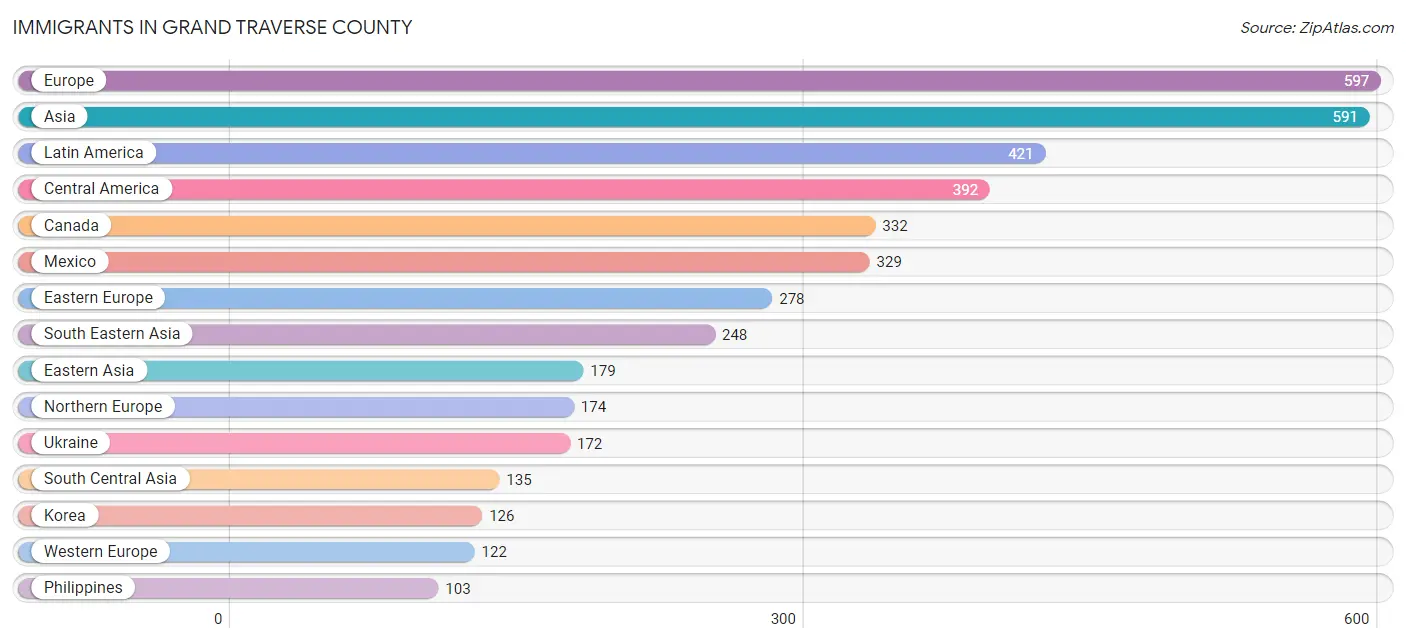
Immigrants in Grand Traverse County
The most numerous immigrant groups reported in Grand Traverse County came from Europe (597 | 0.6%), Asia (591 | 0.6%), Latin America (421 | 0.4%), Central America (392 | 0.4%), and Canada (332 | 0.4%), together accounting for 2.5% of all Grand Traverse County residents.
| Immigration Origin | # Population | % Population |
| Africa | 54 | 0.1% |
| Asia | 591 | 0.6% |
| Bangladesh | 26 | 0.0% |
| Bulgaria | 39 | 0.0% |
| Canada | 332 | 0.4% |
| Caribbean | 5 | 0.0% |
| Central America | 392 | 0.4% |
| China | 53 | 0.1% |
| Colombia | 24 | 0.0% |
| Costa Rica | 7 | 0.0% |
| Cuba | 5 | 0.0% |
| Eastern Africa | 34 | 0.0% |
| Eastern Asia | 179 | 0.2% |
| Eastern Europe | 278 | 0.3% |
| El Salvador | 20 | 0.0% |
| England | 62 | 0.1% |
| Europe | 597 | 0.6% |
| France | 23 | 0.0% |
| Germany | 99 | 0.1% |
| Ghana | 12 | 0.0% |
| Greece | 12 | 0.0% |
| Guatemala | 32 | 0.0% |
| Honduras | 4 | 0.0% |
| Hong Kong | 29 | 0.0% |
| India | 44 | 0.1% |
| Indonesia | 10 | 0.0% |
| Ireland | 4 | 0.0% |
| Italy | 11 | 0.0% |
| Korea | 126 | 0.1% |
| Laos | 17 | 0.0% |
| Latin America | 421 | 0.4% |
| Mexico | 329 | 0.4% |
| Nigeria | 8 | 0.0% |
| Northern Europe | 174 | 0.2% |
| Philippines | 103 | 0.1% |
| Poland | 13 | 0.0% |
| Romania | 24 | 0.0% |
| Russia | 1 | 0.0% |
| Scotland | 28 | 0.0% |
| Serbia | 29 | 0.0% |
| Singapore | 23 | 0.0% |
| South America | 24 | 0.0% |
| South Central Asia | 135 | 0.1% |
| South Eastern Asia | 248 | 0.3% |
| Southern Europe | 23 | 0.0% |
| Sri Lanka | 64 | 0.1% |
| Syria | 6 | 0.0% |
| Thailand | 46 | 0.1% |
| Turkey | 23 | 0.0% |
| Ukraine | 172 | 0.2% |
| Vietnam | 49 | 0.1% |
| Western Africa | 20 | 0.0% |
| Western Asia | 29 | 0.0% |
| Western Europe | 122 | 0.1% |
| Zimbabwe | 34 | 0.0% | View All 55 Rows |
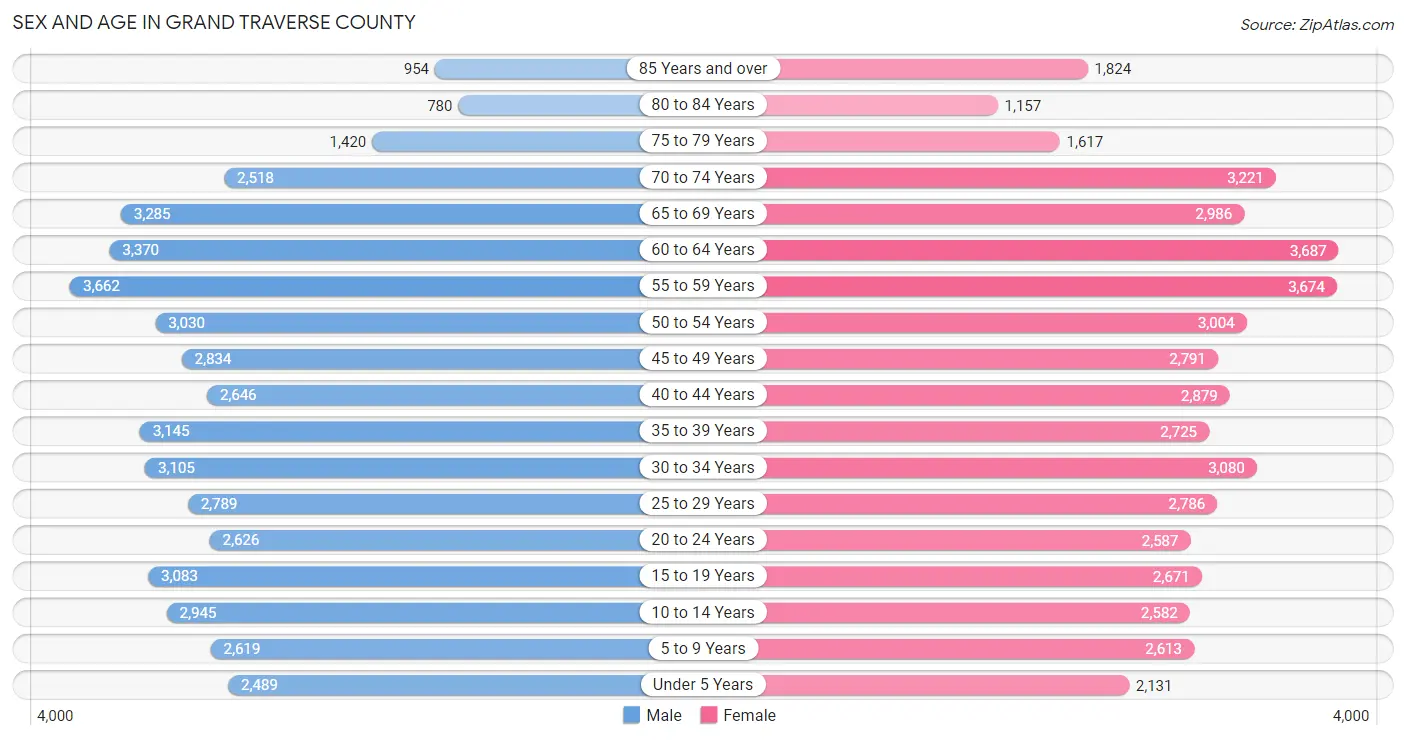
Sex and Age in Grand Traverse County
Sex and Age in Grand Traverse County
The most populous age groups in Grand Traverse County are 55 to 59 Years (3,662 | 7.7%) for men and 60 to 64 Years (3,687 | 7.7%) for women.
| Age Bracket | Male | Female |
| Under 5 Years | 2,489 (5.3%) | 2,131 (4.4%) |
| 5 to 9 Years | 2,619 (5.5%) | 2,613 (5.4%) |
| 10 to 14 Years | 2,945 (6.2%) | 2,582 (5.4%) |
| 15 to 19 Years | 3,083 (6.5%) | 2,671 (5.6%) |
| 20 to 24 Years | 2,626 (5.6%) | 2,587 (5.4%) |
| 25 to 29 Years | 2,789 (5.9%) | 2,786 (5.8%) |
| 30 to 34 Years | 3,105 (6.6%) | 3,080 (6.4%) |
| 35 to 39 Years | 3,145 (6.7%) | 2,725 (5.7%) |
| 40 to 44 Years | 2,646 (5.6%) | 2,879 (6.0%) |
| 45 to 49 Years | 2,834 (6.0%) | 2,791 (5.8%) |
| 50 to 54 Years | 3,030 (6.4%) | 3,004 (6.3%) |
| 55 to 59 Years | 3,662 (7.7%) | 3,674 (7.6%) |
| 60 to 64 Years | 3,370 (7.1%) | 3,687 (7.7%) |
| 65 to 69 Years | 3,285 (7.0%) | 2,986 (6.2%) |
| 70 to 74 Years | 2,518 (5.3%) | 3,221 (6.7%) |
| 75 to 79 Years | 1,420 (3.0%) | 1,617 (3.4%) |
| 80 to 84 Years | 780 (1.7%) | 1,157 (2.4%) |
| 85 Years and over | 954 (2.0%) | 1,824 (3.8%) |
| Total | 47,300 (100.0%) | 48,015 (100.0%) |
Families and Households in Grand Traverse County
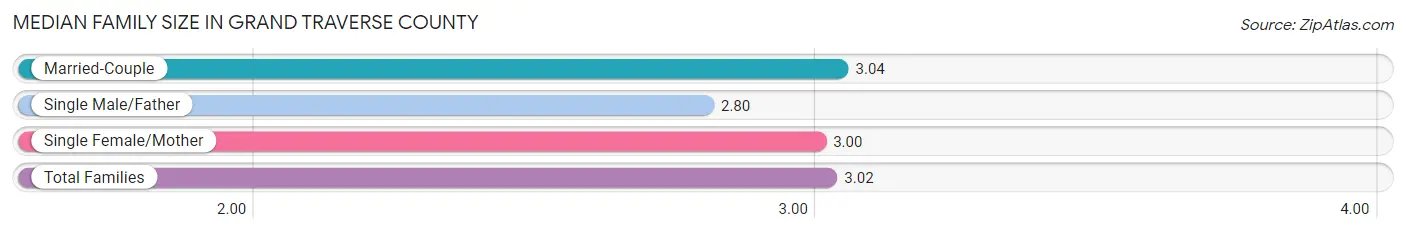
Median Family Size in Grand Traverse County
The median family size in Grand Traverse County is 3.02 persons per family, with married-couple families (19,083 | 79.8%) accounting for the largest median family size of 3.04 persons per family. On the other hand, single male/father families (1,644 | 6.9%) represent the smallest median family size with 2.80 persons per family.
| Family Type | # Families | Family Size |
| Married-Couple | 19,083 (79.8%) | 3.04 |
| Single Male/Father | 1,644 (6.9%) | 2.80 |
| Single Female/Mother | 3,171 (13.3%) | 3.00 |
| Total Families | 23,898 (100.0%) | 3.02 |
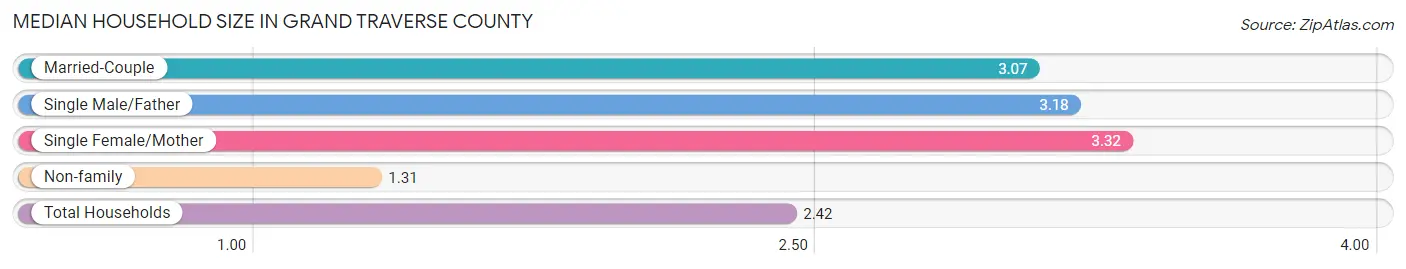
Median Household Size in Grand Traverse County
The median household size in Grand Traverse County is 2.42 persons per household, with single female/mother households (3,171 | 8.2%) accounting for the largest median household size of 3.32 persons per household. non-family households (14,674 | 38.0%) represent the smallest median household size with 1.31 persons per household.
| Household Type | # Households | Household Size |
| Married-Couple | 19,083 (49.5%) | 3.07 |
| Single Male/Father | 1,644 (4.3%) | 3.18 |
| Single Female/Mother | 3,171 (8.2%) | 3.32 |
| Non-family | 14,674 (38.0%) | 1.31 |
| Total Households | 38,572 (100.0%) | 2.42 |
Household Size by Marriage Status in Grand Traverse County
Out of a total of 38,572 households in Grand Traverse County, 23,898 (62.0%) are family households, while 14,674 (38.0%) are nonfamily households. The most numerous type of family households are 2-person households, comprising 11,998, and the most common type of nonfamily households are 1-person households, comprising 11,193.
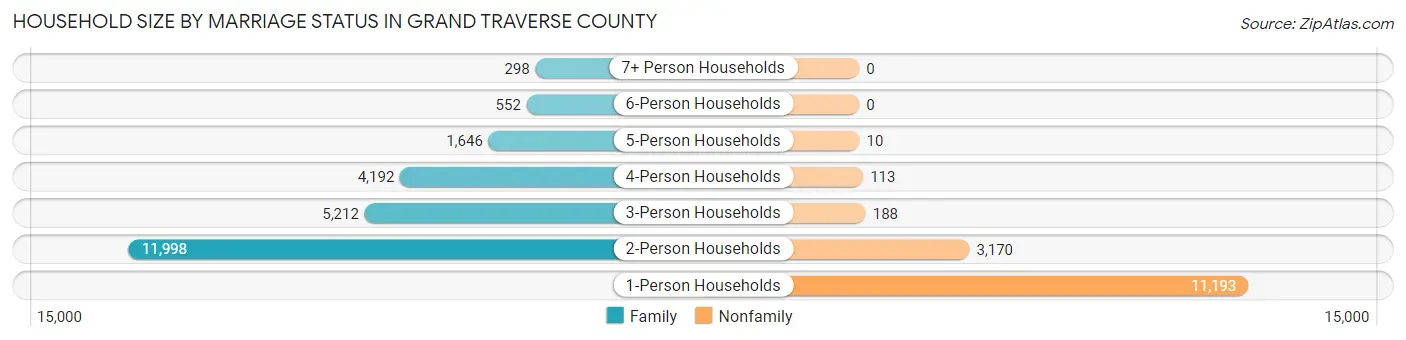
| Household Size | Family Households | Nonfamily Households |
| 1-Person Households | - | 11,193 (29.0%) |
| 2-Person Households | 11,998 (31.1%) | 3,170 (8.2%) |
| 3-Person Households | 5,212 (13.5%) | 188 (0.5%) |
| 4-Person Households | 4,192 (10.9%) | 113 (0.3%) |
| 5-Person Households | 1,646 (4.3%) | 10 (0.0%) |
| 6-Person Households | 552 (1.4%) | 0 (0.0%) |
| 7+ Person Households | 298 (0.8%) | 0 (0.0%) |
| Total | 23,898 (62.0%) | 14,674 (38.0%) |
Female Fertility in Grand Traverse County
Fertility by Age in Grand Traverse County
Average fertility rate in Grand Traverse County is 38.0 births per 1,000 women. Women in the age bracket of 20 to 34 years have the highest fertility rate with 71.0 births per 1,000 women. Women in the age bracket of 20 to 34 years acount for 80.2% of all women with births.
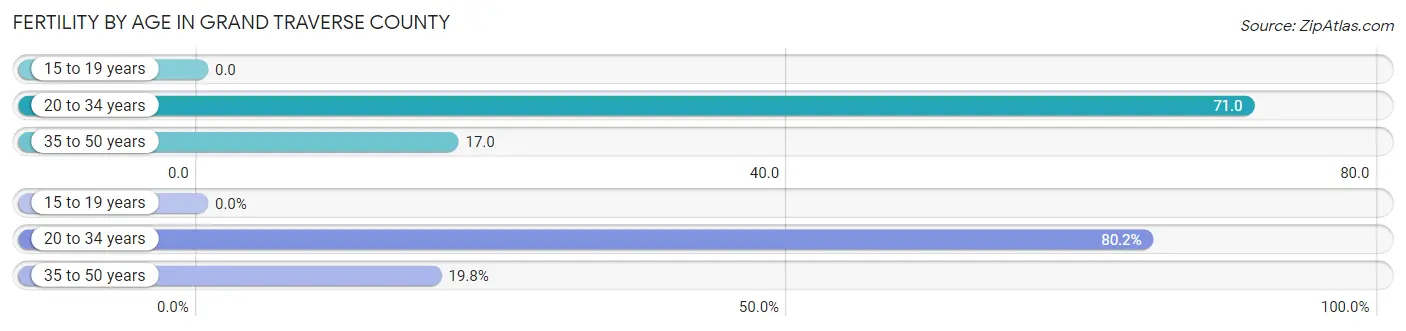
| Age Bracket | Women with Births | Births / 1,000 Women |
| 15 to 19 years | 0 (0.0%) | 0.0 |
| 20 to 34 years | 603 (80.2%) | 71.0 |
| 35 to 50 years | 149 (19.8%) | 17.0 |
| Total | 752 (100.0%) | 38.0 |
Fertility by Age by Marriage Status in Grand Traverse County
77.4% of women with births (752) in Grand Traverse County are married. The highest percentage of unmarried women with births falls into 20 to 34 years age bracket with 23.9% of them unmarried at the time of birth, while the lowest percentage of unmarried women with births belong to 35 to 50 years age bracket with 17.4% of them unmarried.
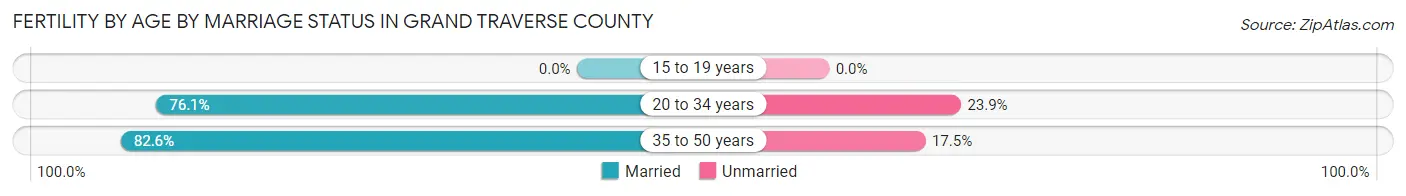
| Age Bracket | Married | Unmarried |
| 15 to 19 years | 0 (0.0%) | 0 (0.0%) |
| 20 to 34 years | 459 (76.1%) | 144 (23.9%) |
| 35 to 50 years | 123 (82.6%) | 26 (17.4%) |
| Total | 582 (77.4%) | 170 (22.6%) |
Fertility by Education in Grand Traverse County
Average fertility rate in Grand Traverse County is 38.0 births per 1,000 women. Women with the education attainment of college or associate's degree have the highest fertility rate of 55.0 births per 1,000 women, while women with the education attainment of less than high school have the lowest fertility at 10.0 births per 1,000 women. Women with the education attainment of college or associate's degree represent 48.4% of all women with births.
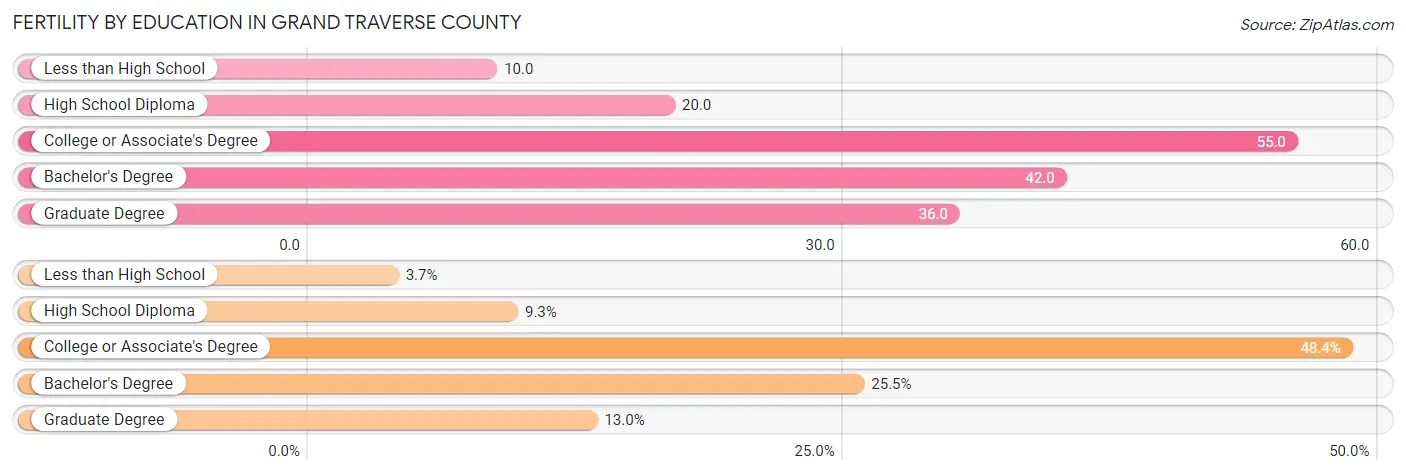
| Educational Attainment | Women with Births | Births / 1,000 Women |
| Less than High School | 28 (3.7%) | 10.0 |
| High School Diploma | 70 (9.3%) | 20.0 |
| College or Associate's Degree | 364 (48.4%) | 55.0 |
| Bachelor's Degree | 192 (25.5%) | 42.0 |
| Graduate Degree | 98 (13.0%) | 36.0 |
| Total | 752 (100.0%) | 38.0 |
Fertility by Education by Marriage Status in Grand Traverse County
22.6% of women with births in Grand Traverse County are unmarried. Women with the educational attainment of graduate degree are most likely to be married with 100.0% of them married at childbirth, while women with the educational attainment of less than high school are least likely to be married with 50.0% of them unmarried at childbirth.
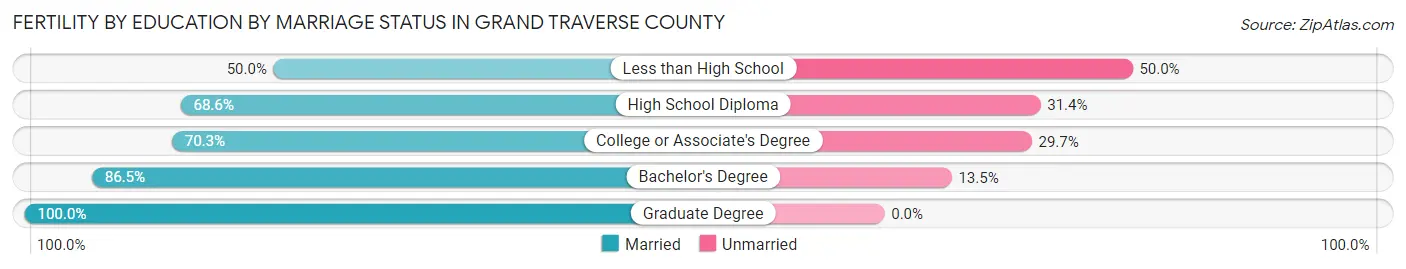
| Educational Attainment | Married | Unmarried |
| Less than High School | 14 (50.0%) | 14 (50.0%) |
| High School Diploma | 48 (68.6%) | 22 (31.4%) |
| College or Associate's Degree | 256 (70.3%) | 108 (29.7%) |
| Bachelor's Degree | 166 (86.5%) | 26 (13.5%) |
| Graduate Degree | 98 (100.0%) | 0 (0.0%) |
| Total | 582 (77.4%) | 170 (22.6%) |
Employment Characteristics in Grand Traverse County
Employment by Class of Employer in Grand Traverse County
Among the 47,745 employed individuals in Grand Traverse County, private company employees (31,780 | 66.6%), not-for-profit organizations (5,461 | 11.4%), and self-employed (not incorporated) (3,452 | 7.2%) make up the most common classes of employment.
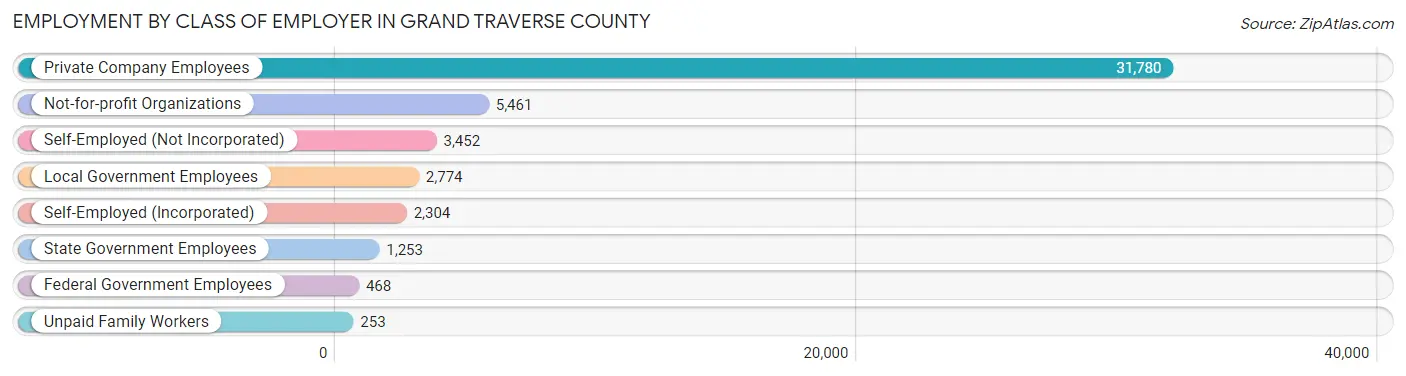
| Employer Class | # Employees | % Employees |
| Private Company Employees | 31,780 | 66.6% |
| Self-Employed (Incorporated) | 2,304 | 4.8% |
| Self-Employed (Not Incorporated) | 3,452 | 7.2% |
| Not-for-profit Organizations | 5,461 | 11.4% |
| Local Government Employees | 2,774 | 5.8% |
| State Government Employees | 1,253 | 2.6% |
| Federal Government Employees | 468 | 1.0% |
| Unpaid Family Workers | 253 | 0.5% |
| Total | 47,745 | 100.0% |
Employment Status by Age in Grand Traverse County
According to the labor force statistics for Grand Traverse County, out of the total population over 16 years of age (78,512), 64.3% or 50,483 individuals are in the labor force, with 3.9% or 1,969 of them unemployed. The age group with the highest labor force participation rate is 30 to 34 years, with 90.2% or 5,579 individuals in the labor force. Within the labor force, the 16 to 19 years age range has the highest percentage of unemployed individuals, with 9.3% or 234 of them being unemployed.
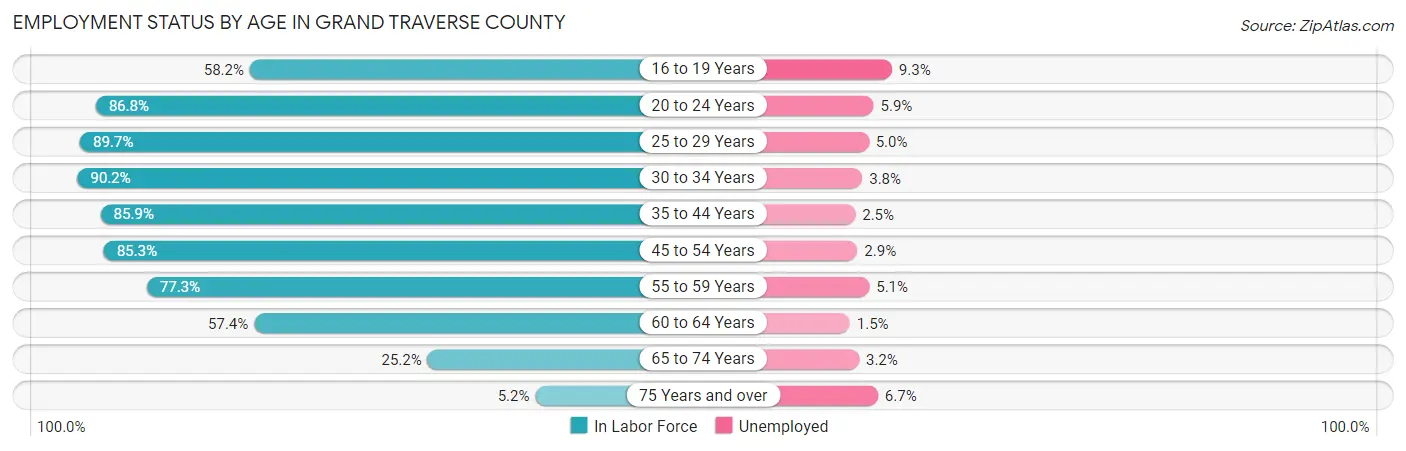
| Age Bracket | In Labor Force | Unemployed |
| 16 to 19 Years | 2,520 (58.2%) | 234 (9.3%) |
| 20 to 24 Years | 4,525 (86.8%) | 267 (5.9%) |
| 25 to 29 Years | 5,001 (89.7%) | 250 (5.0%) |
| 30 to 34 Years | 5,579 (90.2%) | 212 (3.8%) |
| 35 to 44 Years | 9,788 (85.9%) | 245 (2.5%) |
| 45 to 54 Years | 9,945 (85.3%) | 288 (2.9%) |
| 55 to 59 Years | 5,671 (77.3%) | 289 (5.1%) |
| 60 to 64 Years | 4,051 (57.4%) | 61 (1.5%) |
| 65 to 74 Years | 3,027 (25.2%) | 97 (3.2%) |
| 75 Years and over | 403 (5.2%) | 27 (6.7%) |
| Total | 50,483 (64.3%) | 1,969 (3.9%) |
Employment Status by Educational Attainment in Grand Traverse County
According to labor force statistics for Grand Traverse County, 81.4% of individuals (40,054) out of the total population between 25 and 64 years of age (49,207) are in the labor force, with 3.4% or 1,362 of them being unemployed. The group with the highest labor force participation rate are those with the educational attainment of bachelor's degree or higher, with 87.6% or 16,706 individuals in the labor force. Within the labor force, individuals with less than high school education have the highest percentage of unemployment, with 5.0% or 82 of them being unemployed.
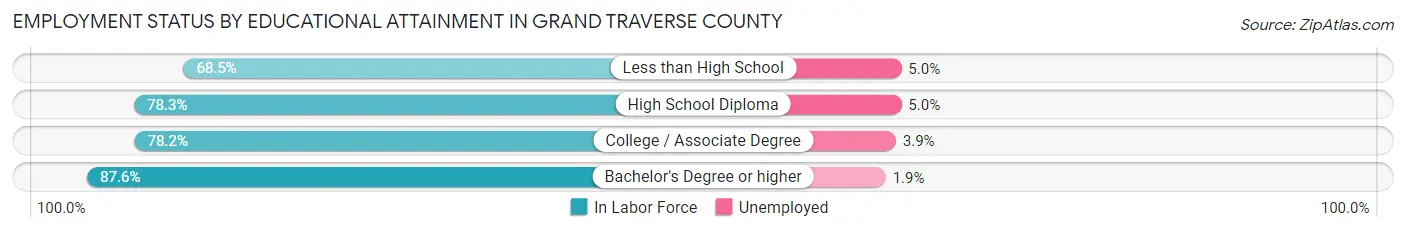
| Educational Attainment | In Labor Force | Unemployed |
| Less than High School | 1,646 (68.5%) | 120 (5.0%) |
| High School Diploma | 8,210 (78.3%) | 524 (5.0%) |
| College / Associate Degree | 13,488 (78.2%) | 673 (3.9%) |
| Bachelor's Degree or higher | 16,706 (87.6%) | 362 (1.9%) |
| Total | 40,054 (81.4%) | 1,673 (3.4%) |
Employment Occupations by Sex in Grand Traverse County
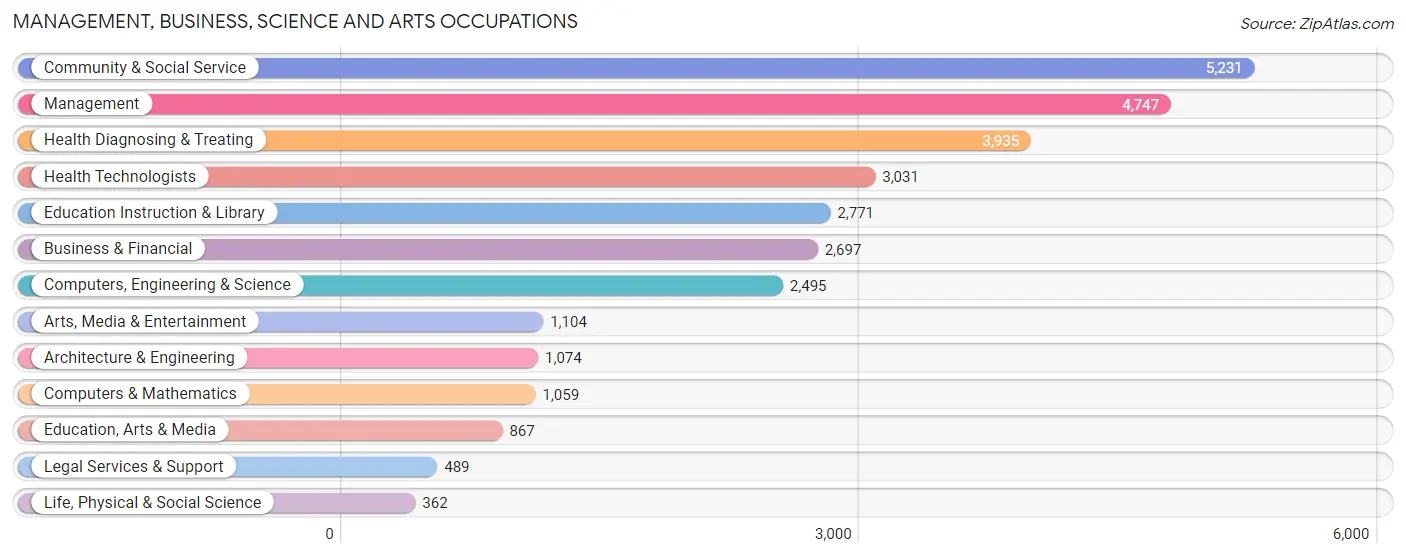
Management, Business, Science and Arts Occupations
The most common Management, Business, Science and Arts occupations in Grand Traverse County are Community & Social Service (5,231 | 10.8%), Management (4,747 | 9.8%), Health Diagnosing & Treating (3,935 | 8.1%), Health Technologists (3,031 | 6.2%), and Education Instruction & Library (2,771 | 5.7%).
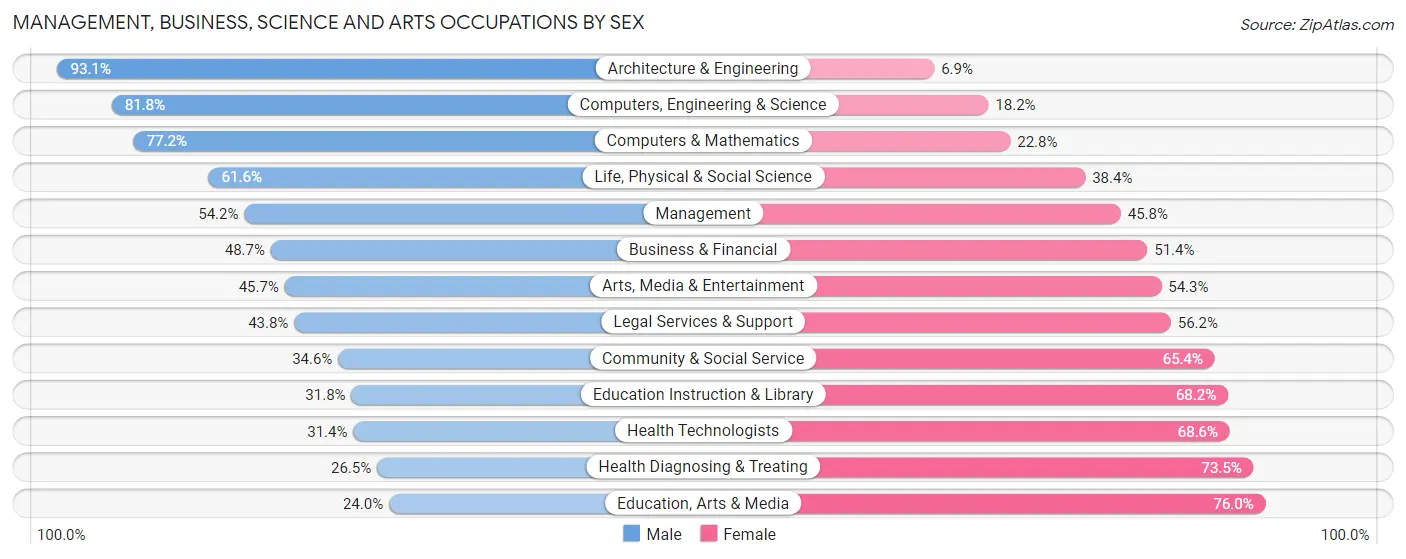
Management, Business, Science and Arts Occupations by Sex
Within the Management, Business, Science and Arts occupations in Grand Traverse County, the most male-oriented occupations are Architecture & Engineering (93.1%), Computers, Engineering & Science (81.8%), and Computers & Mathematics (77.2%), while the most female-oriented occupations are Education, Arts & Media (76.0%), Health Diagnosing & Treating (73.5%), and Health Technologists (68.6%).
| Occupation | Male | Female |
| Management | 2,572 (54.2%) | 2,175 (45.8%) |
| Business & Financial | 1,312 (48.6%) | 1,385 (51.3%) |
| Computers, Engineering & Science | 2,041 (81.8%) | 454 (18.2%) |
| Computers & Mathematics | 818 (77.2%) | 241 (22.8%) |
| Architecture & Engineering | 1,000 (93.1%) | 74 (6.9%) |
| Life, Physical & Social Science | 223 (61.6%) | 139 (38.4%) |
| Community & Social Service | 1,809 (34.6%) | 3,422 (65.4%) |
| Education, Arts & Media | 208 (24.0%) | 659 (76.0%) |
| Legal Services & Support | 214 (43.8%) | 275 (56.2%) |
| Education Instruction & Library | 882 (31.8%) | 1,889 (68.2%) |
| Arts, Media & Entertainment | 505 (45.7%) | 599 (54.3%) |
| Health Diagnosing & Treating | 1,042 (26.5%) | 2,893 (73.5%) |
| Health Technologists | 953 (31.4%) | 2,078 (68.6%) |
| Total (Category) | 8,776 (45.9%) | 10,329 (54.1%) |
| Total (Overall) | 25,552 (52.7%) | 22,917 (47.3%) |
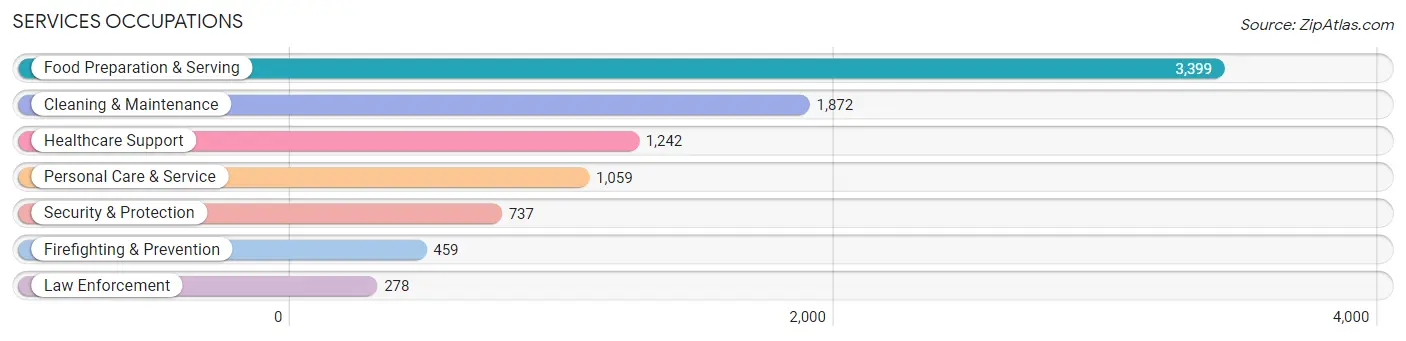
Services Occupations
The most common Services occupations in Grand Traverse County are Food Preparation & Serving (3,399 | 7.0%), Cleaning & Maintenance (1,872 | 3.9%), Healthcare Support (1,242 | 2.6%), Personal Care & Service (1,059 | 2.2%), and Security & Protection (737 | 1.5%).
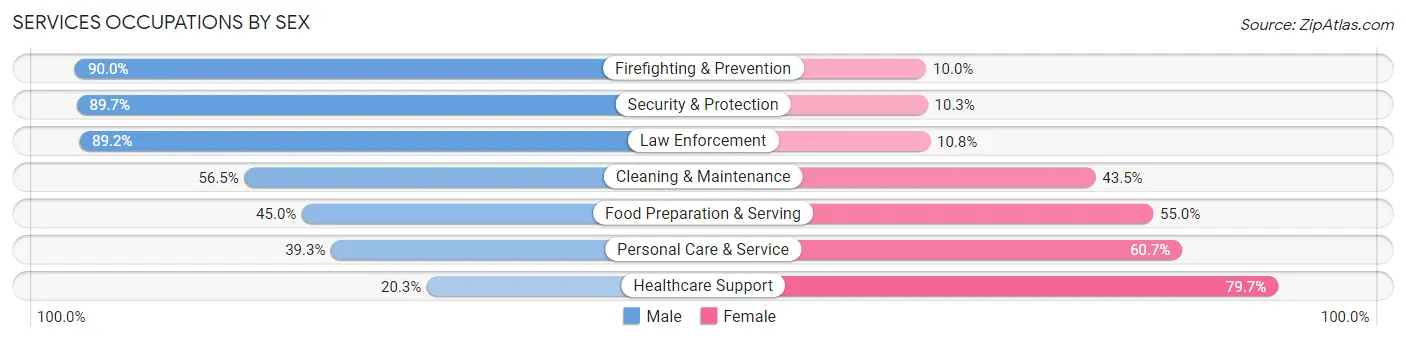
Services Occupations by Sex
Within the Services occupations in Grand Traverse County, the most male-oriented occupations are Firefighting & Prevention (90.0%), Security & Protection (89.7%), and Law Enforcement (89.2%), while the most female-oriented occupations are Healthcare Support (79.7%), Personal Care & Service (60.7%), and Food Preparation & Serving (55.0%).
| Occupation | Male | Female |
| Healthcare Support | 252 (20.3%) | 990 (79.7%) |
| Security & Protection | 661 (89.7%) | 76 (10.3%) |
| Firefighting & Prevention | 413 (90.0%) | 46 (10.0%) |
| Law Enforcement | 248 (89.2%) | 30 (10.8%) |
| Food Preparation & Serving | 1,531 (45.0%) | 1,868 (55.0%) |
| Cleaning & Maintenance | 1,057 (56.5%) | 815 (43.5%) |
| Personal Care & Service | 416 (39.3%) | 643 (60.7%) |
| Total (Category) | 3,917 (47.1%) | 4,392 (52.9%) |
| Total (Overall) | 25,552 (52.7%) | 22,917 (47.3%) |
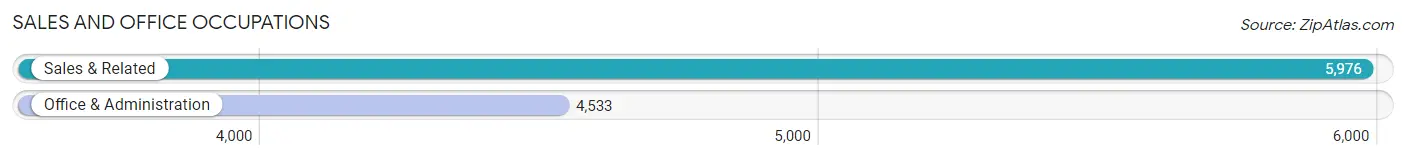
Sales and Office Occupations
The most common Sales and Office occupations in Grand Traverse County are Sales & Related (5,976 | 12.3%), and Office & Administration (4,533 | 9.3%).
Sales and Office Occupations by Sex
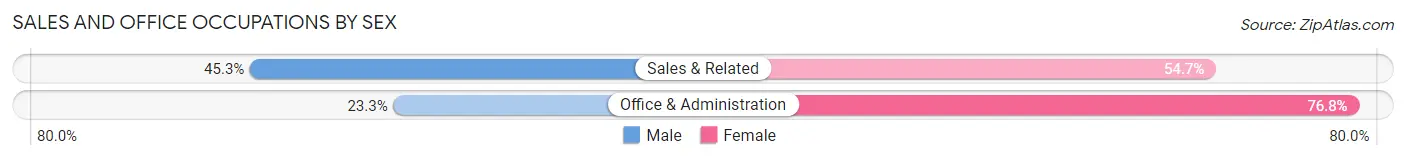
| Occupation | Male | Female |
| Sales & Related | 2,707 (45.3%) | 3,269 (54.7%) |
| Office & Administration | 1,054 (23.3%) | 3,479 (76.7%) |
| Total (Category) | 3,761 (35.8%) | 6,748 (64.2%) |
| Total (Overall) | 25,552 (52.7%) | 22,917 (47.3%) |
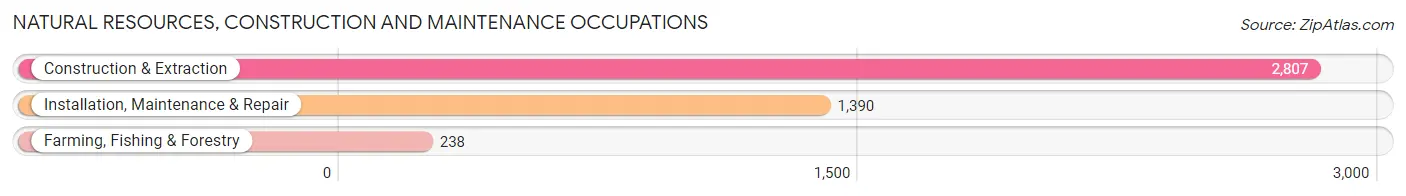
Natural Resources, Construction and Maintenance Occupations
The most common Natural Resources, Construction and Maintenance occupations in Grand Traverse County are Construction & Extraction (2,807 | 5.8%), Installation, Maintenance & Repair (1,390 | 2.9%), and Farming, Fishing & Forestry (238 | 0.5%).
Natural Resources, Construction and Maintenance Occupations by Sex
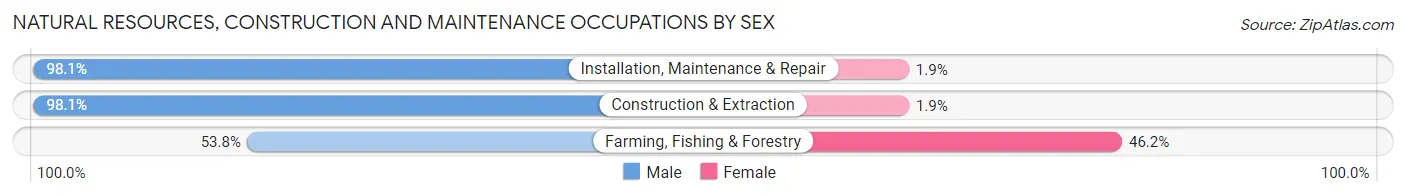
| Occupation | Male | Female |
| Farming, Fishing & Forestry | 128 (53.8%) | 110 (46.2%) |
| Construction & Extraction | 2,754 (98.1%) | 53 (1.9%) |
| Installation, Maintenance & Repair | 1,364 (98.1%) | 26 (1.9%) |
| Total (Category) | 4,246 (95.7%) | 189 (4.3%) |
| Total (Overall) | 25,552 (52.7%) | 22,917 (47.3%) |
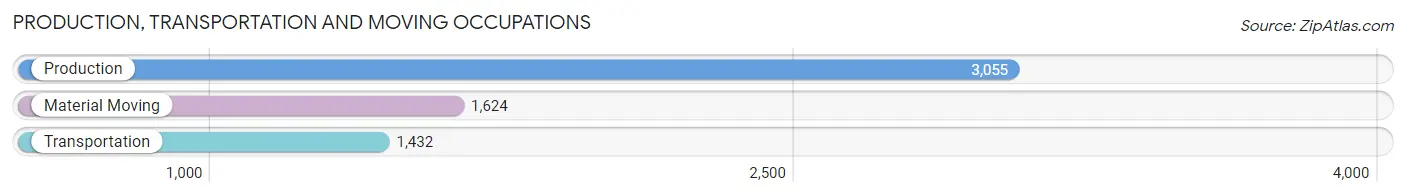
Production, Transportation and Moving Occupations
The most common Production, Transportation and Moving occupations in Grand Traverse County are Production (3,055 | 6.3%), Material Moving (1,624 | 3.4%), and Transportation (1,432 | 2.9%).
Production, Transportation and Moving Occupations by Sex
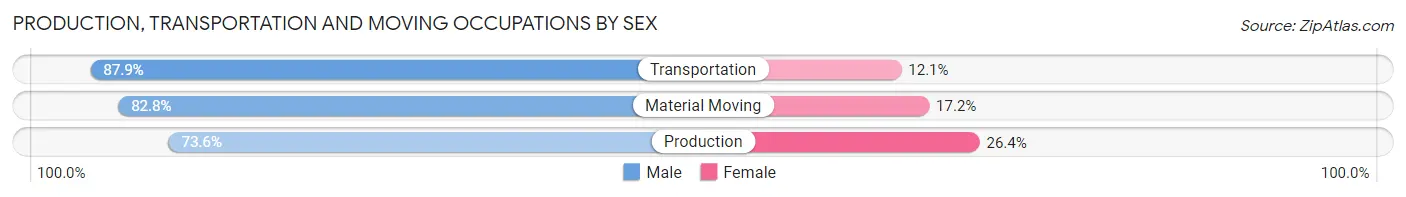
| Occupation | Male | Female |
| Production | 2,248 (73.6%) | 807 (26.4%) |
| Transportation | 1,259 (87.9%) | 173 (12.1%) |
| Material Moving | 1,345 (82.8%) | 279 (17.2%) |
| Total (Category) | 4,852 (79.4%) | 1,259 (20.6%) |
| Total (Overall) | 25,552 (52.7%) | 22,917 (47.3%) |
Employment Industries by Sex in Grand Traverse County
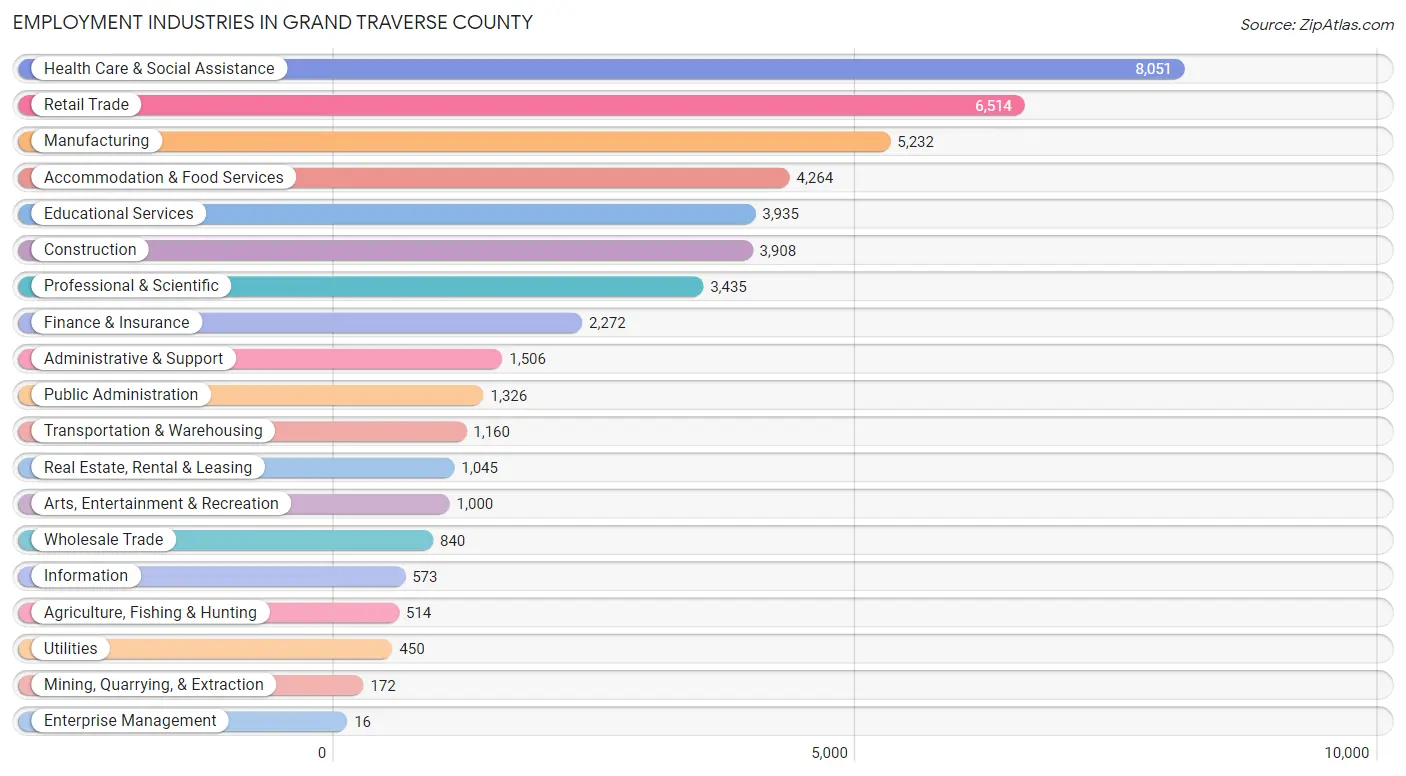
Employment Industries in Grand Traverse County
The major employment industries in Grand Traverse County include Health Care & Social Assistance (8,051 | 16.6%), Retail Trade (6,514 | 13.4%), Manufacturing (5,232 | 10.8%), Accommodation & Food Services (4,264 | 8.8%), and Educational Services (3,935 | 8.1%).
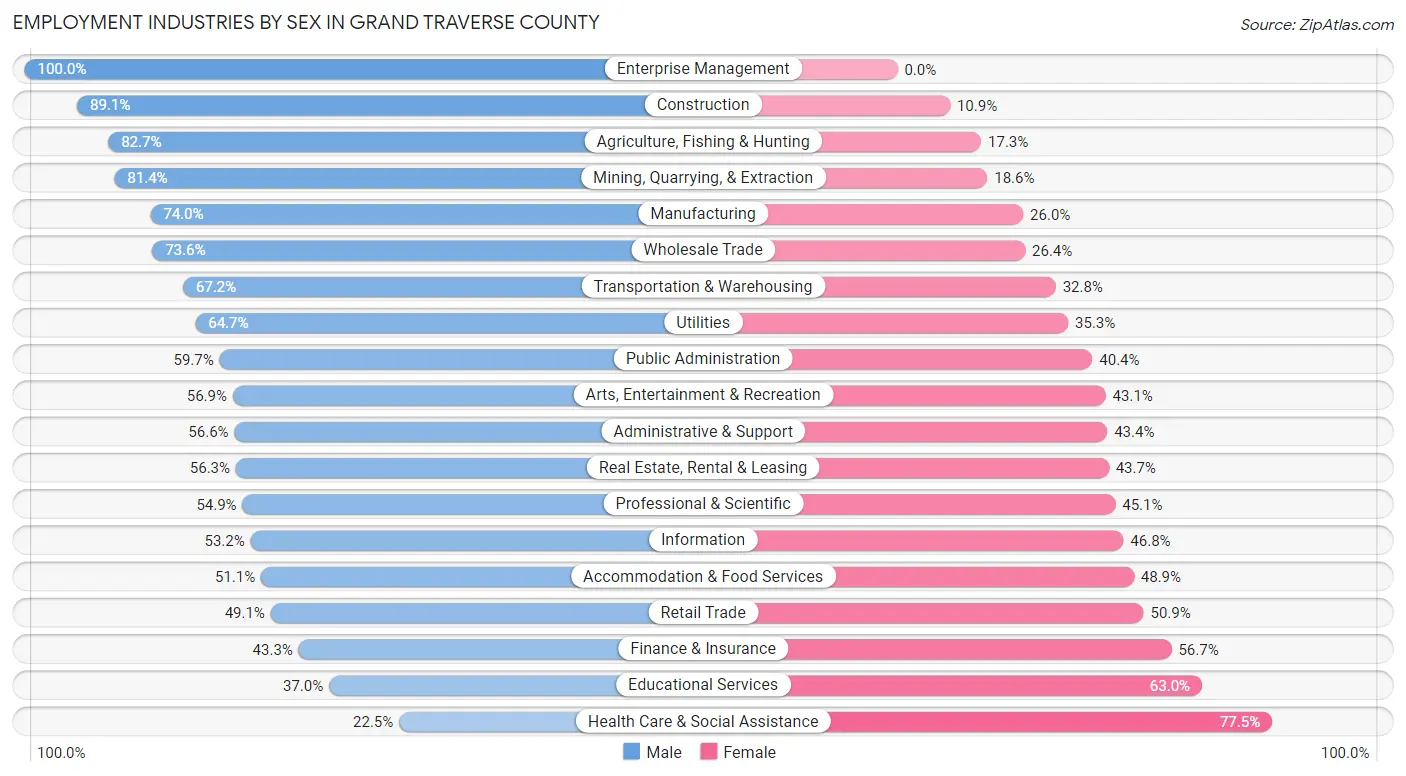
Employment Industries by Sex in Grand Traverse County
The Grand Traverse County industries that see more men than women are Enterprise Management (100.0%), Construction (89.1%), and Agriculture, Fishing & Hunting (82.7%), whereas the industries that tend to have a higher number of women are Health Care & Social Assistance (77.5%), Educational Services (63.0%), and Finance & Insurance (56.7%).
| Industry | Male | Female |
| Agriculture, Fishing & Hunting | 425 (82.7%) | 89 (17.3%) |
| Mining, Quarrying, & Extraction | 140 (81.4%) | 32 (18.6%) |
| Construction | 3,483 (89.1%) | 425 (10.9%) |
| Manufacturing | 3,870 (74.0%) | 1,362 (26.0%) |
| Wholesale Trade | 618 (73.6%) | 222 (26.4%) |
| Retail Trade | 3,196 (49.1%) | 3,318 (50.9%) |
| Transportation & Warehousing | 780 (67.2%) | 380 (32.8%) |
| Utilities | 291 (64.7%) | 159 (35.3%) |
| Information | 305 (53.2%) | 268 (46.8%) |
| Finance & Insurance | 983 (43.3%) | 1,289 (56.7%) |
| Real Estate, Rental & Leasing | 588 (56.3%) | 457 (43.7%) |
| Professional & Scientific | 1,886 (54.9%) | 1,549 (45.1%) |
| Enterprise Management | 16 (100.0%) | 0 (0.0%) |
| Administrative & Support | 852 (56.6%) | 654 (43.4%) |
| Educational Services | 1,455 (37.0%) | 2,480 (63.0%) |
| Health Care & Social Assistance | 1,810 (22.5%) | 6,241 (77.5%) |
| Arts, Entertainment & Recreation | 569 (56.9%) | 431 (43.1%) |
| Accommodation & Food Services | 2,177 (51.1%) | 2,087 (48.9%) |
| Public Administration | 791 (59.7%) | 535 (40.4%) |
| Total | 25,552 (52.7%) | 22,917 (47.3%) |
Education in Grand Traverse County
School Enrollment in Grand Traverse County
The most common levels of schooling among the 20,898 students in Grand Traverse County are high school (4,736 | 22.7%), middle school (4,400 | 21.0%), and college / undergraduate (4,398 | 21.0%).
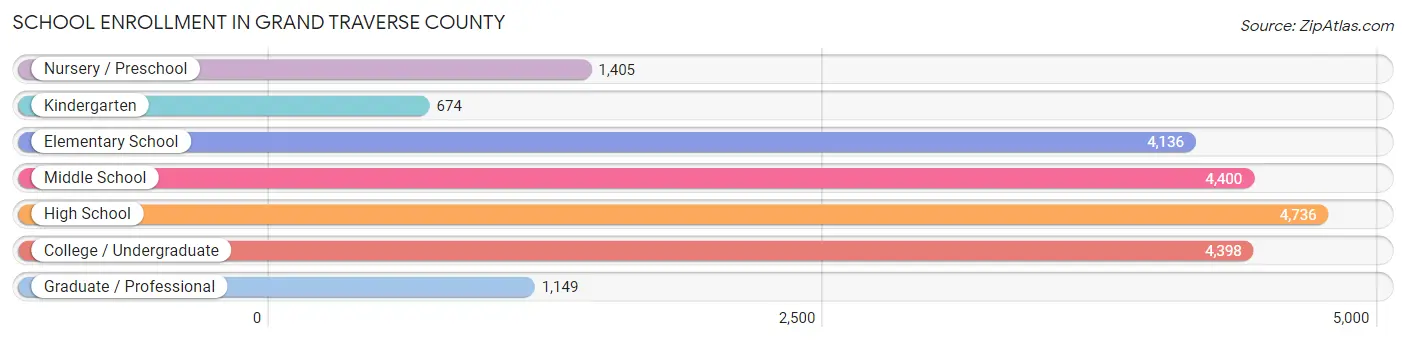
| School Level | # Students | % Students |
| Nursery / Preschool | 1,405 | 6.7% |
| Kindergarten | 674 | 3.2% |
| Elementary School | 4,136 | 19.8% |
| Middle School | 4,400 | 21.0% |
| High School | 4,736 | 22.7% |
| College / Undergraduate | 4,398 | 21.0% |
| Graduate / Professional | 1,149 | 5.5% |
| Total | 20,898 | 100.0% |
School Enrollment by Age by Funding Source in Grand Traverse County
Out of a total of 20,898 students who are enrolled in schools in Grand Traverse County, 3,302 (15.8%) attend a private institution, while the remaining 17,596 (84.2%) are enrolled in public schools. The age group of 3 to 4 year olds has the highest likelihood of being enrolled in private schools, with 367 (35.8% in the age bracket) enrolled. Conversely, the age group of 20 to 24 year olds has the lowest likelihood of being enrolled in a private school, with 2,073 (97.2% in the age bracket) attending a public institution.
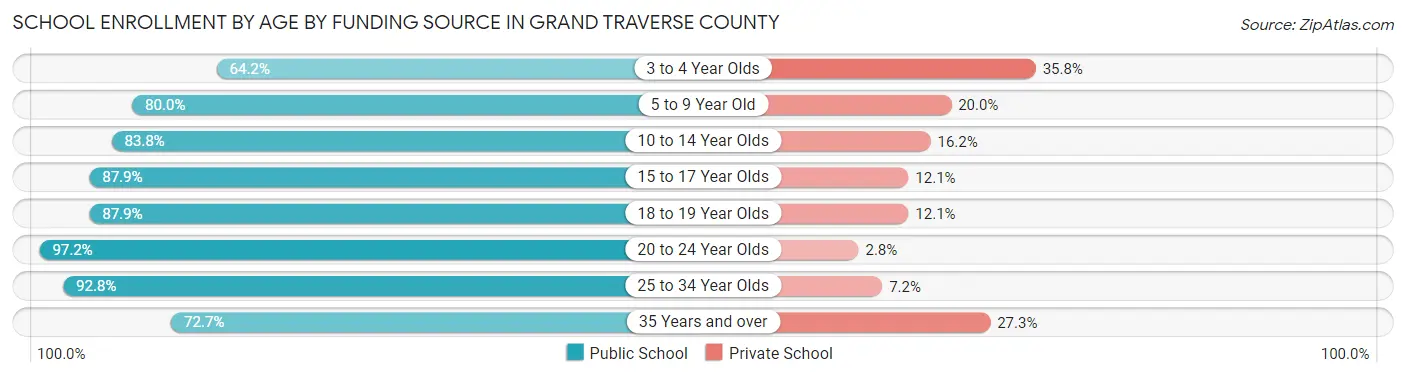
| Age Bracket | Public School | Private School |
| 3 to 4 Year Olds | 659 (64.2%) | 367 (35.8%) |
| 5 to 9 Year Old | 3,686 (80.0%) | 923 (20.0%) |
| 10 to 14 Year Olds | 4,512 (83.8%) | 871 (16.2%) |
| 15 to 17 Year Olds | 2,917 (87.9%) | 400 (12.1%) |
| 18 to 19 Year Olds | 1,626 (87.9%) | 223 (12.1%) |
| 20 to 24 Year Olds | 2,073 (97.2%) | 59 (2.8%) |
| 25 to 34 Year Olds | 1,176 (92.8%) | 91 (7.2%) |
| 35 Years and over | 956 (72.7%) | 359 (27.3%) |
| Total | 17,596 (84.2%) | 3,302 (15.8%) |
Educational Attainment by Field of Study in Grand Traverse County
Business (5,493 | 18.8%), education (4,094 | 14.0%), science & technology (3,705 | 12.7%), bio, nature & agricultural (2,434 | 8.3%), and arts & humanities (1,974 | 6.8%) are the most common fields of study among 29,248 individuals in Grand Traverse County who have obtained a bachelor's degree or higher.
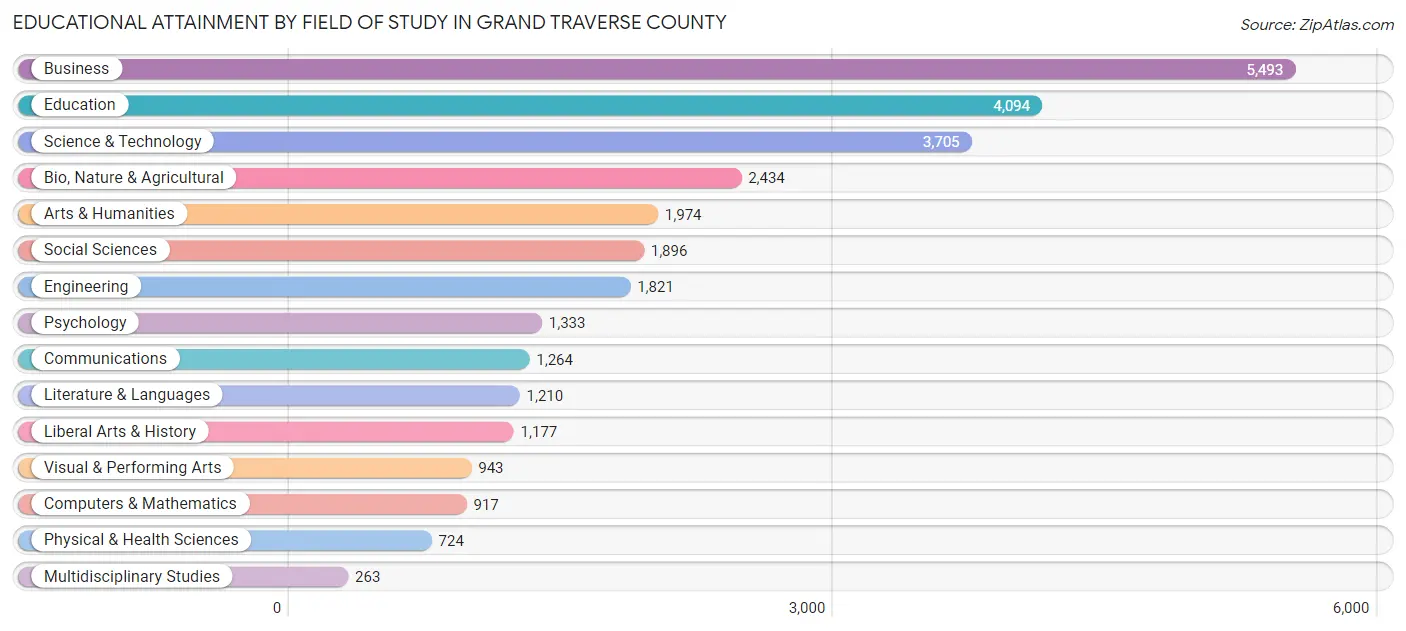
| Field of Study | # Graduates | % Graduates |
| Computers & Mathematics | 917 | 3.1% |
| Bio, Nature & Agricultural | 2,434 | 8.3% |
| Physical & Health Sciences | 724 | 2.5% |
| Psychology | 1,333 | 4.6% |
| Social Sciences | 1,896 | 6.5% |
| Engineering | 1,821 | 6.2% |
| Multidisciplinary Studies | 263 | 0.9% |
| Science & Technology | 3,705 | 12.7% |
| Business | 5,493 | 18.8% |
| Education | 4,094 | 14.0% |
| Literature & Languages | 1,210 | 4.1% |
| Liberal Arts & History | 1,177 | 4.0% |
| Visual & Performing Arts | 943 | 3.2% |
| Communications | 1,264 | 4.3% |
| Arts & Humanities | 1,974 | 6.8% |
| Total | 29,248 | 100.0% |
Transportation & Commute in Grand Traverse County
Vehicle Availability by Sex in Grand Traverse County
The most prevalent vehicle ownership categories in Grand Traverse County are males with 2 vehicles (11,005, accounting for 44.2%) and females with 2 vehicles (9,801, making up 49.0%).
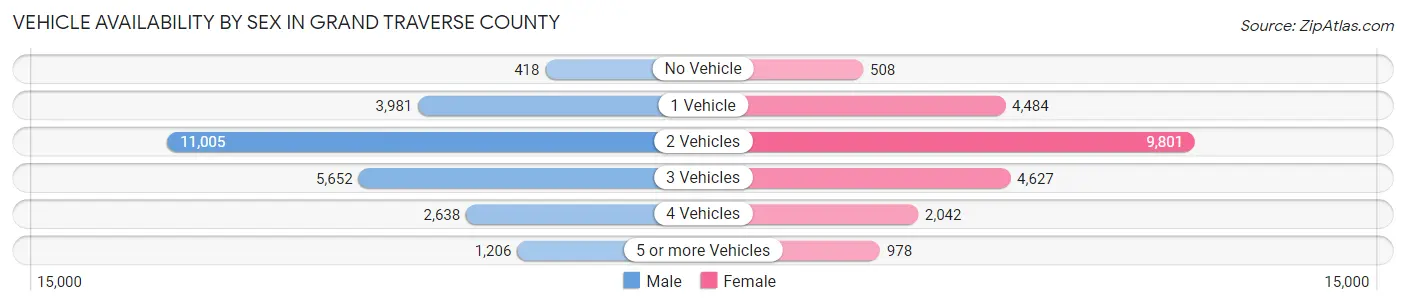
| Vehicles Available | Male | Female |
| No Vehicle | 418 (1.7%) | 508 (2.3%) |
| 1 Vehicle | 3,981 (16.0%) | 4,484 (20.0%) |
| 2 Vehicles | 11,005 (44.2%) | 9,801 (43.7%) |
| 3 Vehicles | 5,652 (22.7%) | 4,627 (20.6%) |
| 4 Vehicles | 2,638 (10.6%) | 2,042 (9.1%) |
| 5 or more Vehicles | 1,206 (4.8%) | 978 (4.4%) |
| Total | 24,900 (100.0%) | 22,440 (100.0%) |
Commute Time in Grand Traverse County
The most frequently occuring commute durations in Grand Traverse County are 15 to 19 minutes (8,875 commuters, 21.1%), 10 to 14 minutes (7,558 commuters, 17.9%), and 20 to 24 minutes (7,402 commuters, 17.6%).
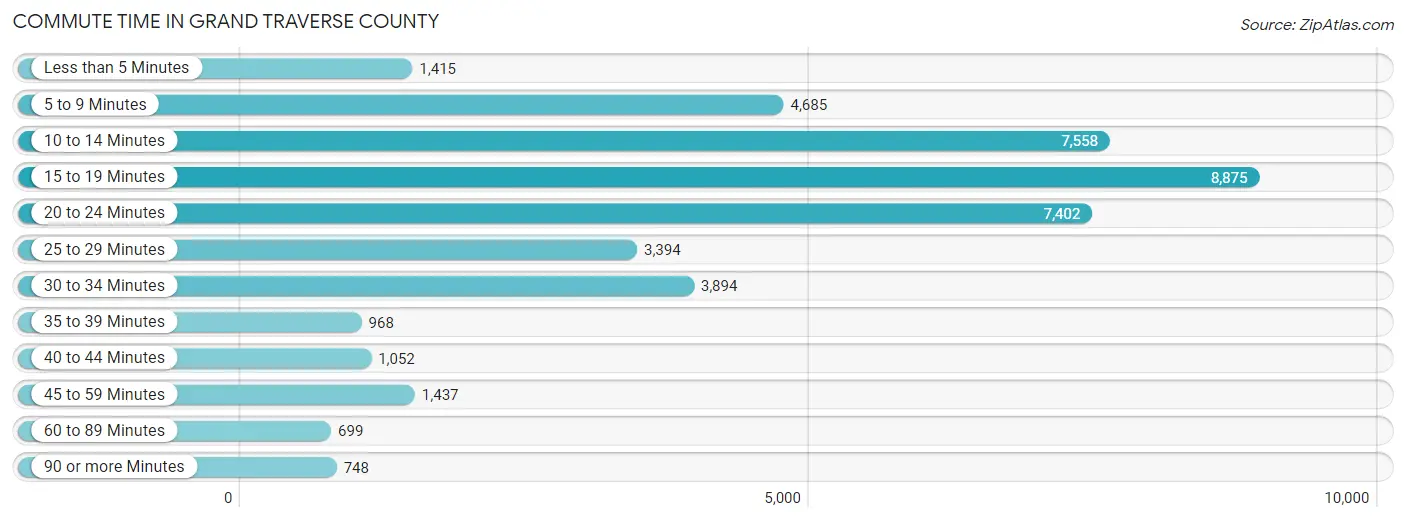
| Commute Time | # Commuters | % Commuters |
| Less than 5 Minutes | 1,415 | 3.4% |
| 5 to 9 Minutes | 4,685 | 11.1% |
| 10 to 14 Minutes | 7,558 | 17.9% |
| 15 to 19 Minutes | 8,875 | 21.1% |
| 20 to 24 Minutes | 7,402 | 17.6% |
| 25 to 29 Minutes | 3,394 | 8.1% |
| 30 to 34 Minutes | 3,894 | 9.2% |
| 35 to 39 Minutes | 968 | 2.3% |
| 40 to 44 Minutes | 1,052 | 2.5% |
| 45 to 59 Minutes | 1,437 | 3.4% |
| 60 to 89 Minutes | 699 | 1.7% |
| 90 or more Minutes | 748 | 1.8% |
Commute Time by Sex in Grand Traverse County
The most common commute times in Grand Traverse County are 15 to 19 minutes (4,372 commuters, 19.7%) for males and 15 to 19 minutes (4,503 commuters, 22.7%) for females.
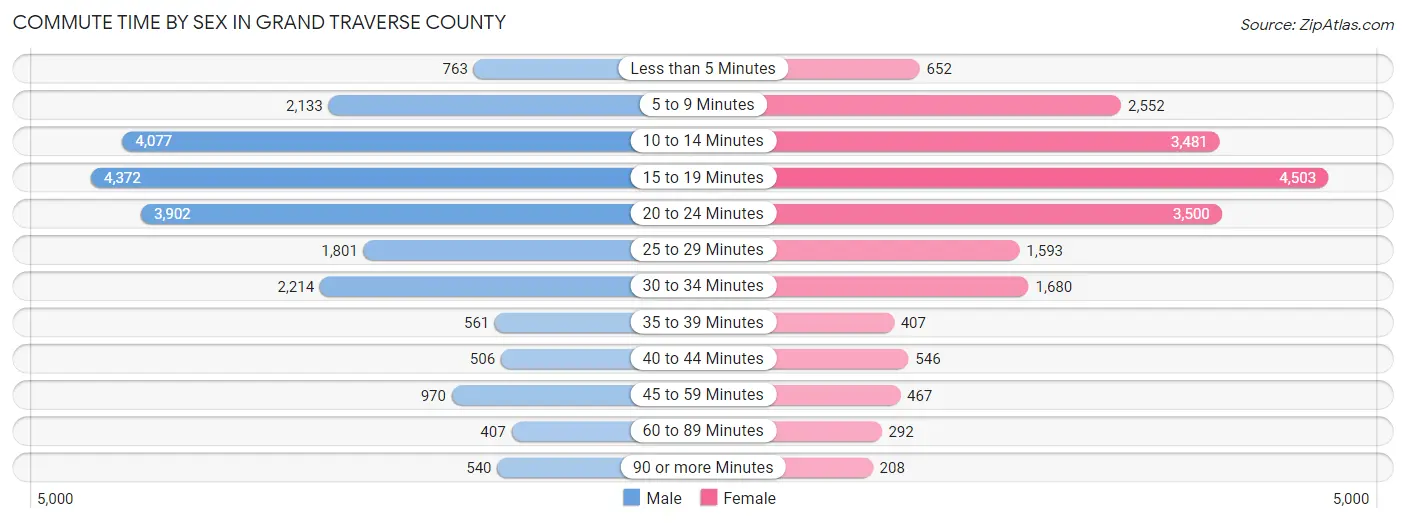
| Commute Time | Male | Female |
| Less than 5 Minutes | 763 (3.4%) | 652 (3.3%) |
| 5 to 9 Minutes | 2,133 (9.6%) | 2,552 (12.8%) |
| 10 to 14 Minutes | 4,077 (18.3%) | 3,481 (17.5%) |
| 15 to 19 Minutes | 4,372 (19.7%) | 4,503 (22.7%) |
| 20 to 24 Minutes | 3,902 (17.5%) | 3,500 (17.6%) |
| 25 to 29 Minutes | 1,801 (8.1%) | 1,593 (8.0%) |
| 30 to 34 Minutes | 2,214 (10.0%) | 1,680 (8.5%) |
| 35 to 39 Minutes | 561 (2.5%) | 407 (2.1%) |
| 40 to 44 Minutes | 506 (2.3%) | 546 (2.8%) |
| 45 to 59 Minutes | 970 (4.4%) | 467 (2.4%) |
| 60 to 89 Minutes | 407 (1.8%) | 292 (1.5%) |
| 90 or more Minutes | 540 (2.4%) | 208 (1.1%) |
Time of Departure to Work by Sex in Grand Traverse County
The most frequent times of departure to work in Grand Traverse County are 7:00 AM to 7:29 AM (3,400, 15.3%) for males and 7:30 AM to 7:59 AM (3,388, 17.0%) for females.
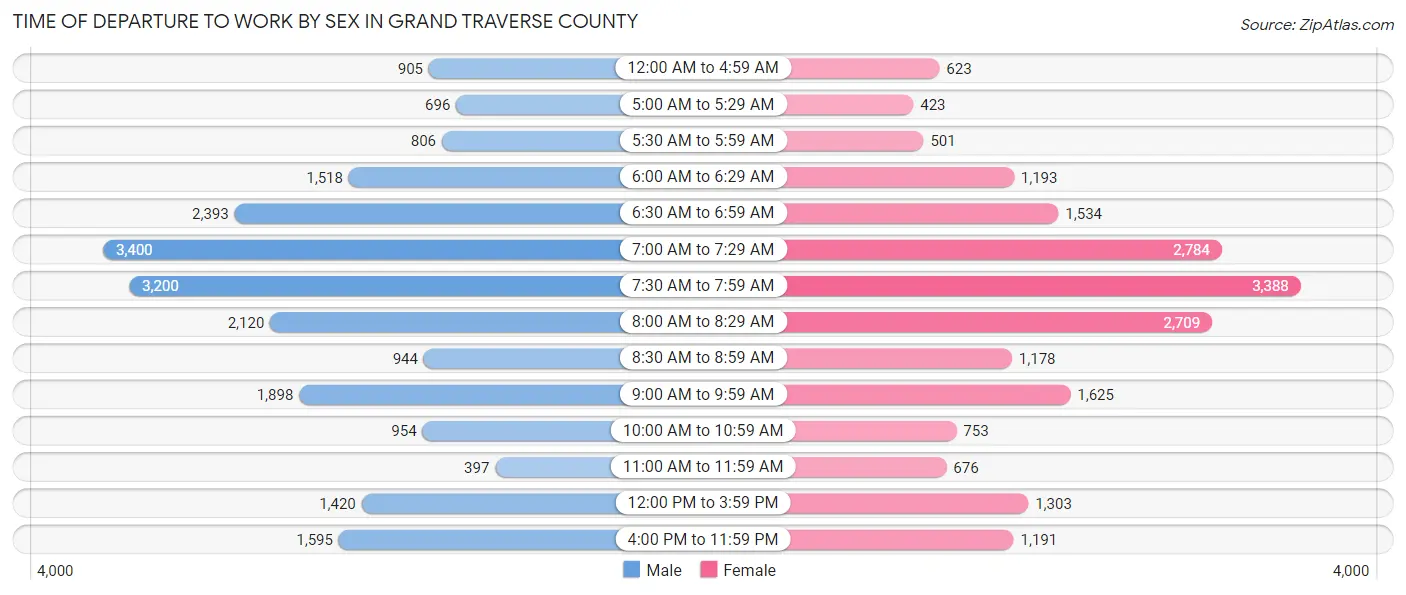
| Time of Departure | Male | Female |
| 12:00 AM to 4:59 AM | 905 (4.1%) | 623 (3.1%) |
| 5:00 AM to 5:29 AM | 696 (3.1%) | 423 (2.1%) |
| 5:30 AM to 5:59 AM | 806 (3.6%) | 501 (2.5%) |
| 6:00 AM to 6:29 AM | 1,518 (6.8%) | 1,193 (6.0%) |
| 6:30 AM to 6:59 AM | 2,393 (10.8%) | 1,534 (7.7%) |
| 7:00 AM to 7:29 AM | 3,400 (15.3%) | 2,784 (14.0%) |
| 7:30 AM to 7:59 AM | 3,200 (14.4%) | 3,388 (17.0%) |
| 8:00 AM to 8:29 AM | 2,120 (9.5%) | 2,709 (13.6%) |
| 8:30 AM to 8:59 AM | 944 (4.2%) | 1,178 (5.9%) |
| 9:00 AM to 9:59 AM | 1,898 (8.5%) | 1,625 (8.2%) |
| 10:00 AM to 10:59 AM | 954 (4.3%) | 753 (3.8%) |
| 11:00 AM to 11:59 AM | 397 (1.8%) | 676 (3.4%) |
| 12:00 PM to 3:59 PM | 1,420 (6.4%) | 1,303 (6.6%) |
| 4:00 PM to 11:59 PM | 1,595 (7.2%) | 1,191 (6.0%) |
| Total | 22,246 (100.0%) | 19,881 (100.0%) |
Housing Occupancy in Grand Traverse County
Occupancy by Ownership in Grand Traverse County
Of the total 38,572 dwellings in Grand Traverse County, owner-occupied units account for 29,292 (75.9%), while renter-occupied units make up 9,280 (24.1%).
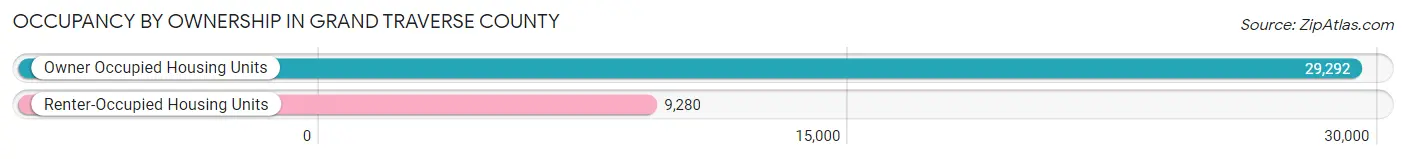
| Occupancy | # Housing Units | % Housing Units |
| Owner Occupied Housing Units | 29,292 | 75.9% |
| Renter-Occupied Housing Units | 9,280 | 24.1% |
| Total Occupied Housing Units | 38,572 | 100.0% |
Occupancy by Household Size in Grand Traverse County
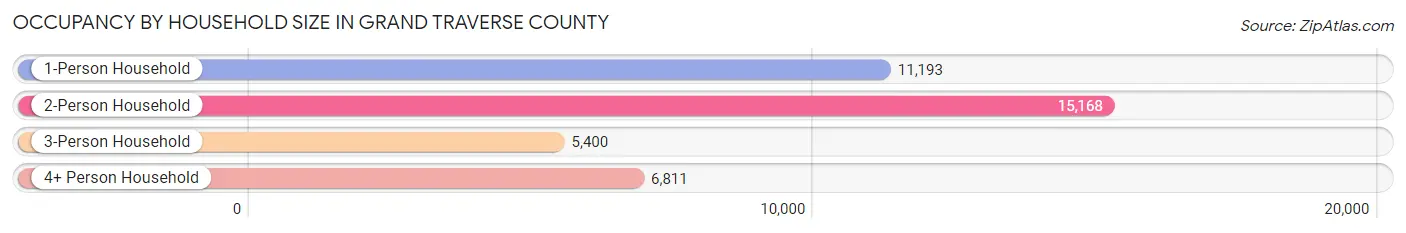
| Household Size | # Housing Units | % Housing Units |
| 1-Person Household | 11,193 | 29.0% |
| 2-Person Household | 15,168 | 39.3% |
| 3-Person Household | 5,400 | 14.0% |
| 4+ Person Household | 6,811 | 17.7% |
| Total Housing Units | 38,572 | 100.0% |
Occupancy by Ownership by Household Size in Grand Traverse County
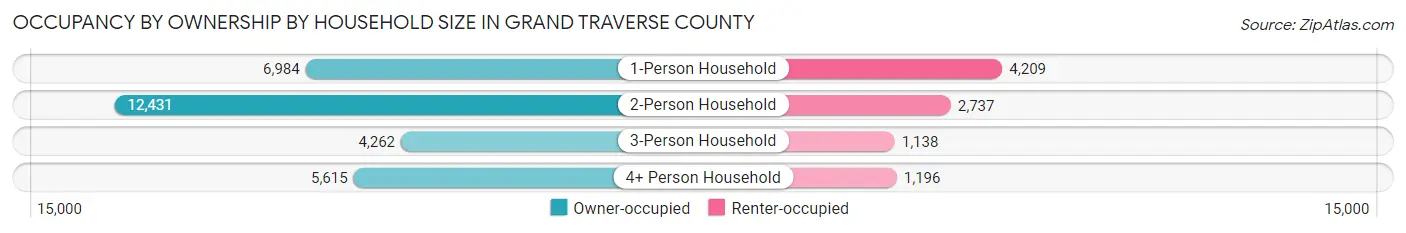
| Household Size | Owner-occupied | Renter-occupied |
| 1-Person Household | 6,984 (62.4%) | 4,209 (37.6%) |
| 2-Person Household | 12,431 (82.0%) | 2,737 (18.0%) |
| 3-Person Household | 4,262 (78.9%) | 1,138 (21.1%) |
| 4+ Person Household | 5,615 (82.4%) | 1,196 (17.6%) |
| Total Housing Units | 29,292 (75.9%) | 9,280 (24.1%) |
Occupancy by Educational Attainment in Grand Traverse County
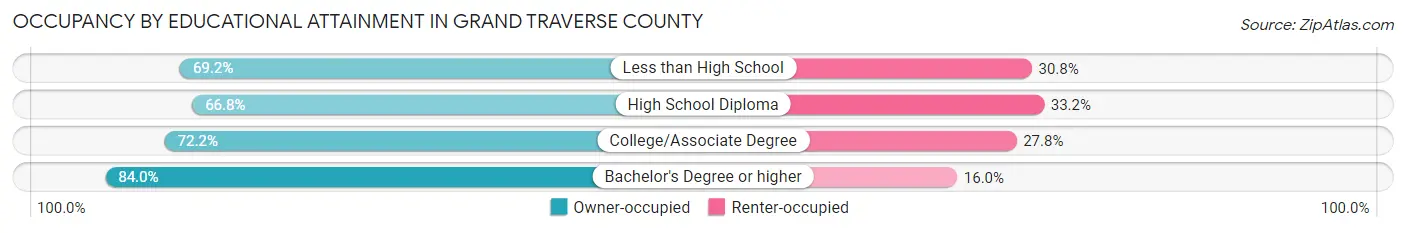
| Household Size | Owner-occupied | Renter-occupied |
| Less than High School | 1,078 (69.2%) | 480 (30.8%) |
| High School Diploma | 4,907 (66.8%) | 2,443 (33.2%) |
| College/Associate Degree | 9,884 (72.2%) | 3,800 (27.8%) |
| Bachelor's Degree or higher | 13,423 (84.0%) | 2,557 (16.0%) |
Occupancy by Age of Householder in Grand Traverse County
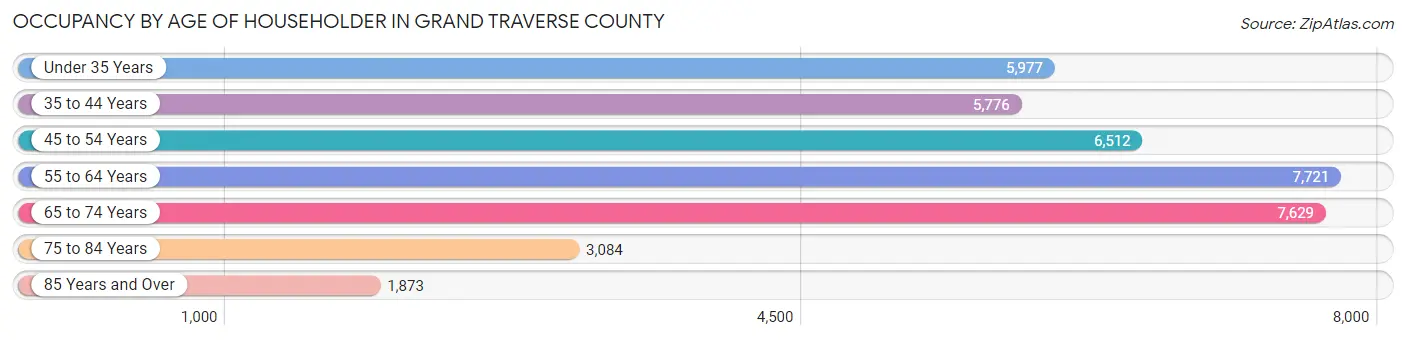
| Age Bracket | # Households | % Households |
| Under 35 Years | 5,977 | 15.5% |
| 35 to 44 Years | 5,776 | 15.0% |
| 45 to 54 Years | 6,512 | 16.9% |
| 55 to 64 Years | 7,721 | 20.0% |
| 65 to 74 Years | 7,629 | 19.8% |
| 75 to 84 Years | 3,084 | 8.0% |
| 85 Years and Over | 1,873 | 4.9% |
| Total | 38,572 | 100.0% |
Housing Finances in Grand Traverse County
Median Income by Occupancy in Grand Traverse County
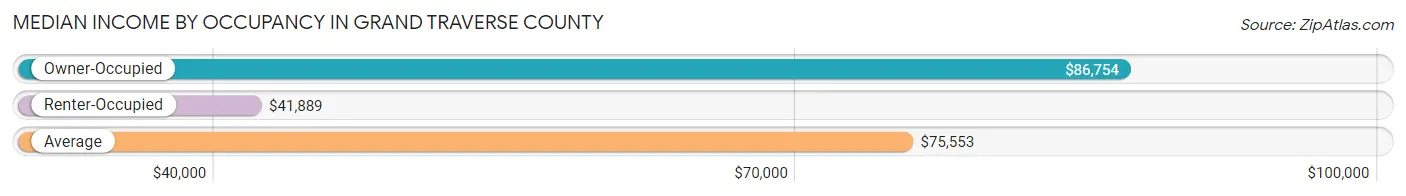
| Occupancy Type | # Households | Median Income |
| Owner-Occupied | 29,292 (75.9%) | $86,754 |
| Renter-Occupied | 9,280 (24.1%) | $41,889 |
| Average | 38,572 (100.0%) | $75,553 |
Occupancy by Householder Income Bracket in Grand Traverse County
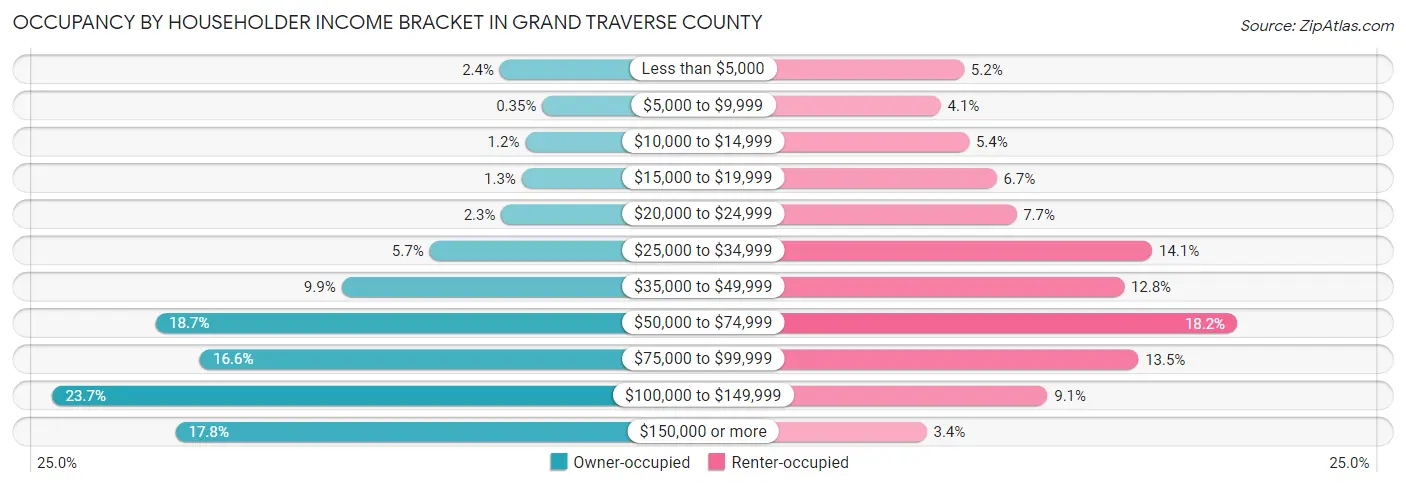
| Income Bracket | Owner-occupied | Renter-occupied |
| Less than $5,000 | 695 (2.4%) | 479 (5.2%) |
| $5,000 to $9,999 | 102 (0.4%) | 376 (4.1%) |
| $10,000 to $14,999 | 339 (1.2%) | 501 (5.4%) |
| $15,000 to $19,999 | 390 (1.3%) | 623 (6.7%) |
| $20,000 to $24,999 | 674 (2.3%) | 710 (7.6%) |
| $25,000 to $34,999 | 1,676 (5.7%) | 1,310 (14.1%) |
| $35,000 to $49,999 | 2,902 (9.9%) | 1,186 (12.8%) |
| $50,000 to $74,999 | 5,489 (18.7%) | 1,685 (18.2%) |
| $75,000 to $99,999 | 4,874 (16.6%) | 1,249 (13.5%) |
| $100,000 to $149,999 | 6,933 (23.7%) | 847 (9.1%) |
| $150,000 or more | 5,218 (17.8%) | 314 (3.4%) |
| Total | 29,292 (100.0%) | 9,280 (100.0%) |
Monthly Housing Cost Tiers in Grand Traverse County
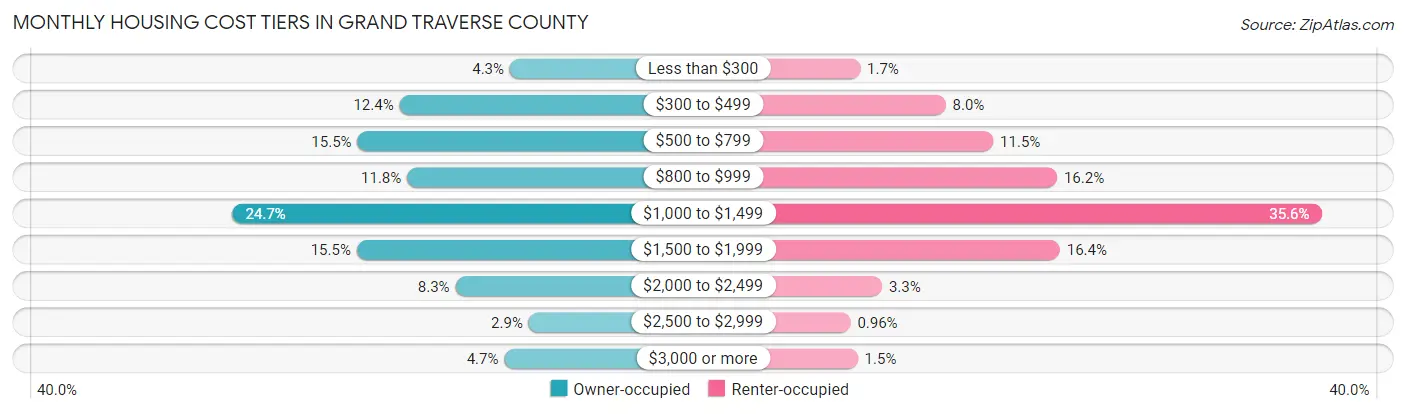
| Monthly Cost | Owner-occupied | Renter-occupied |
| Less than $300 | 1,247 (4.3%) | 155 (1.7%) |
| $300 to $499 | 3,629 (12.4%) | 740 (8.0%) |
| $500 to $799 | 4,538 (15.5%) | 1,064 (11.5%) |
| $800 to $999 | 3,464 (11.8%) | 1,501 (16.2%) |
| $1,000 to $1,499 | 7,231 (24.7%) | 3,307 (35.6%) |
| $1,500 to $1,999 | 4,552 (15.5%) | 1,520 (16.4%) |
| $2,000 to $2,499 | 2,422 (8.3%) | 304 (3.3%) |
| $2,500 to $2,999 | 840 (2.9%) | 89 (1.0%) |
| $3,000 or more | 1,369 (4.7%) | 138 (1.5%) |
| Total | 29,292 (100.0%) | 9,280 (100.0%) |
Physical Housing Characteristics in Grand Traverse County
Housing Structures in Grand Traverse County
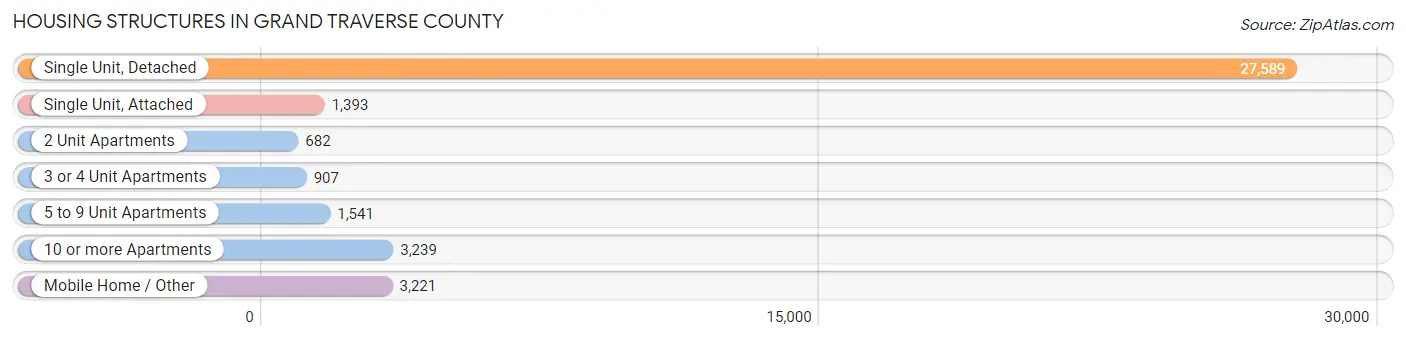
| Structure Type | # Housing Units | % Housing Units |
| Single Unit, Detached | 27,589 | 71.5% |
| Single Unit, Attached | 1,393 | 3.6% |
| 2 Unit Apartments | 682 | 1.8% |
| 3 or 4 Unit Apartments | 907 | 2.4% |
| 5 to 9 Unit Apartments | 1,541 | 4.0% |
| 10 or more Apartments | 3,239 | 8.4% |
| Mobile Home / Other | 3,221 | 8.4% |
| Total | 38,572 | 100.0% |
Housing Structures by Occupancy in Grand Traverse County
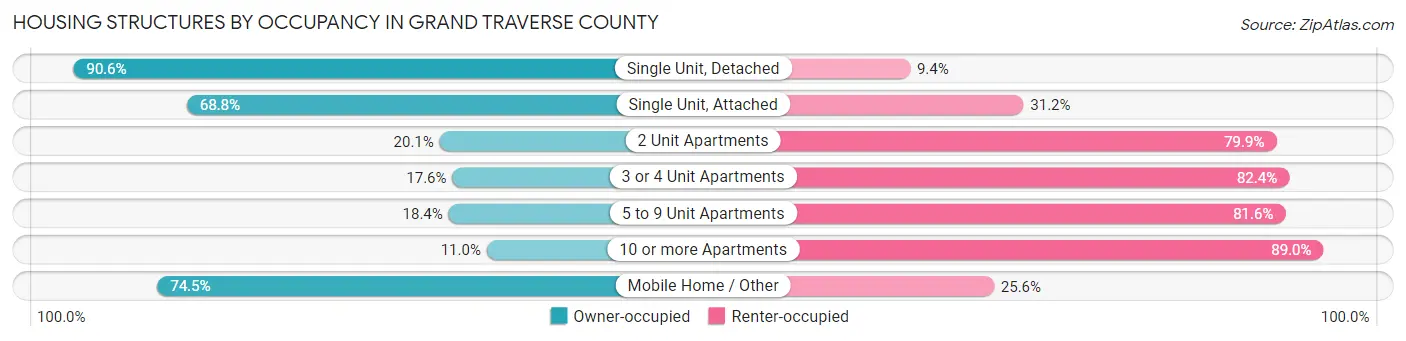
| Structure Type | Owner-occupied | Renter-occupied |
| Single Unit, Detached | 24,999 (90.6%) | 2,590 (9.4%) |
| Single Unit, Attached | 958 (68.8%) | 435 (31.2%) |
| 2 Unit Apartments | 137 (20.1%) | 545 (79.9%) |
| 3 or 4 Unit Apartments | 160 (17.6%) | 747 (82.4%) |
| 5 to 9 Unit Apartments | 283 (18.4%) | 1,258 (81.6%) |
| 10 or more Apartments | 357 (11.0%) | 2,882 (89.0%) |
| Mobile Home / Other | 2,398 (74.5%) | 823 (25.6%) |
| Total | 29,292 (75.9%) | 9,280 (24.1%) |
Housing Structures by Number of Rooms in Grand Traverse County
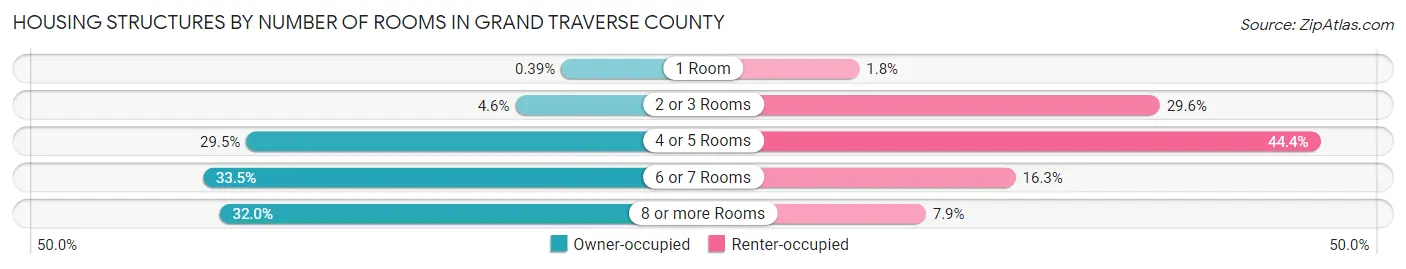
| Number of Rooms | Owner-occupied | Renter-occupied |
| 1 Room | 115 (0.4%) | 167 (1.8%) |
| 2 or 3 Rooms | 1,354 (4.6%) | 2,745 (29.6%) |
| 4 or 5 Rooms | 8,644 (29.5%) | 4,123 (44.4%) |
| 6 or 7 Rooms | 9,815 (33.5%) | 1,508 (16.3%) |
| 8 or more Rooms | 9,364 (32.0%) | 737 (7.9%) |
| Total | 29,292 (100.0%) | 9,280 (100.0%) |
Housing Structure by Heating Type in Grand Traverse County
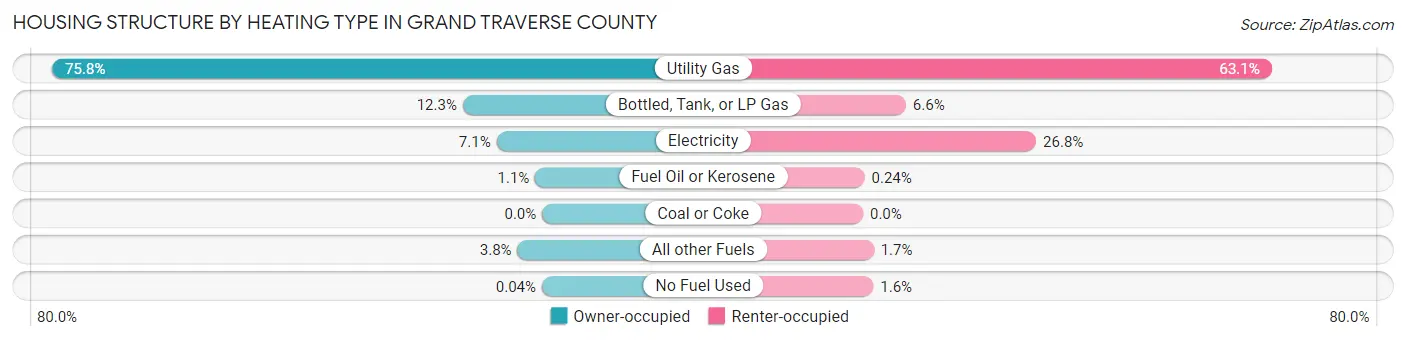
| Heating Type | Owner-occupied | Renter-occupied |
| Utility Gas | 22,193 (75.8%) | 5,859 (63.1%) |
| Bottled, Tank, or LP Gas | 3,593 (12.3%) | 615 (6.6%) |
| Electricity | 2,065 (7.0%) | 2,483 (26.8%) |
| Fuel Oil or Kerosene | 314 (1.1%) | 22 (0.2%) |
| Coal or Coke | 0 (0.0%) | 0 (0.0%) |
| All other Fuels | 1,116 (3.8%) | 153 (1.7%) |
| No Fuel Used | 11 (0.0%) | 148 (1.6%) |
| Total | 29,292 (100.0%) | 9,280 (100.0%) |
Household Vehicle Usage in Grand Traverse County
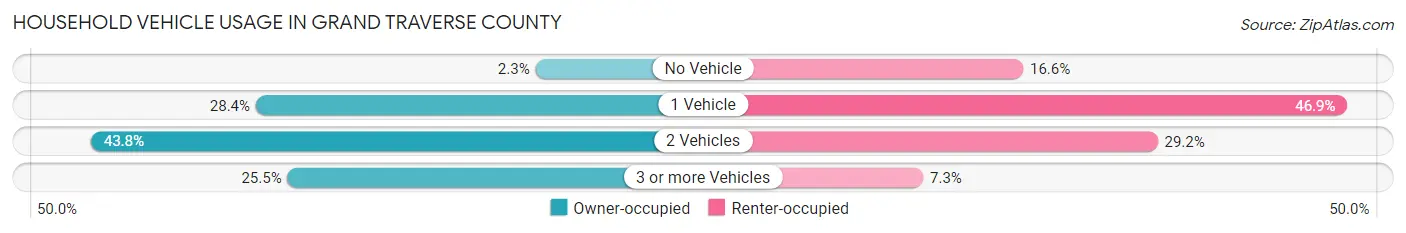
| Vehicles per Household | Owner-occupied | Renter-occupied |
| No Vehicle | 678 (2.3%) | 1,543 (16.6%) |
| 1 Vehicle | 8,321 (28.4%) | 4,352 (46.9%) |
| 2 Vehicles | 12,835 (43.8%) | 2,708 (29.2%) |
| 3 or more Vehicles | 7,458 (25.5%) | 677 (7.3%) |
| Total | 29,292 (100.0%) | 9,280 (100.0%) |
Real Estate & Mortgages in Grand Traverse County
Real Estate and Mortgage Overview in Grand Traverse County
| Characteristic | Without Mortgage | With Mortgage |
| Housing Units | 10,930 | 18,362 |
| Median Property Value | $260,600 | $280,500 |
| Median Household Income | $68,931 | $3,822 |
| Monthly Housing Costs | $552 | $1,349 |
| Real Estate Taxes | $2,816 | $490 |
Property Value by Mortgage Status in Grand Traverse County
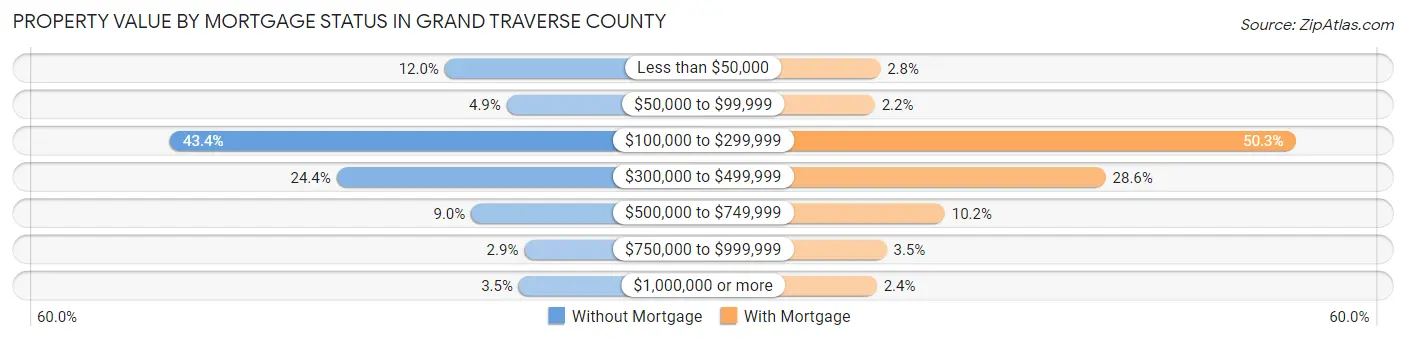
| Property Value | Without Mortgage | With Mortgage |
| Less than $50,000 | 1,310 (12.0%) | 517 (2.8%) |
| $50,000 to $99,999 | 537 (4.9%) | 403 (2.2%) |
| $100,000 to $299,999 | 4,739 (43.4%) | 9,227 (50.2%) |
| $300,000 to $499,999 | 2,662 (24.3%) | 5,248 (28.6%) |
| $500,000 to $749,999 | 980 (9.0%) | 1,873 (10.2%) |
| $750,000 to $999,999 | 317 (2.9%) | 650 (3.5%) |
| $1,000,000 or more | 385 (3.5%) | 444 (2.4%) |
| Total | 10,930 (100.0%) | 18,362 (100.0%) |
Household Income by Mortgage Status in Grand Traverse County
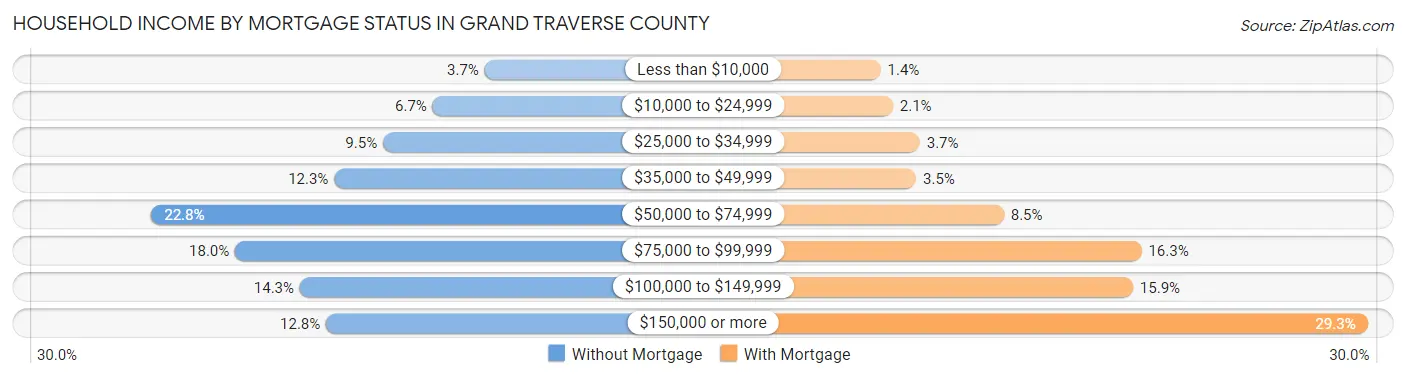
| Household Income | Without Mortgage | With Mortgage |
| Less than $10,000 | 405 (3.7%) | 262 (1.4%) |
| $10,000 to $24,999 | 730 (6.7%) | 392 (2.1%) |
| $25,000 to $34,999 | 1,041 (9.5%) | 673 (3.7%) |
| $35,000 to $49,999 | 1,346 (12.3%) | 635 (3.5%) |
| $50,000 to $74,999 | 2,488 (22.8%) | 1,556 (8.5%) |
| $75,000 to $99,999 | 1,964 (18.0%) | 3,001 (16.3%) |
| $100,000 to $149,999 | 1,560 (14.3%) | 2,910 (15.9%) |
| $150,000 or more | 1,396 (12.8%) | 5,373 (29.3%) |
| Total | 10,930 (100.0%) | 18,362 (100.0%) |
Property Value to Household Income Ratio in Grand Traverse County
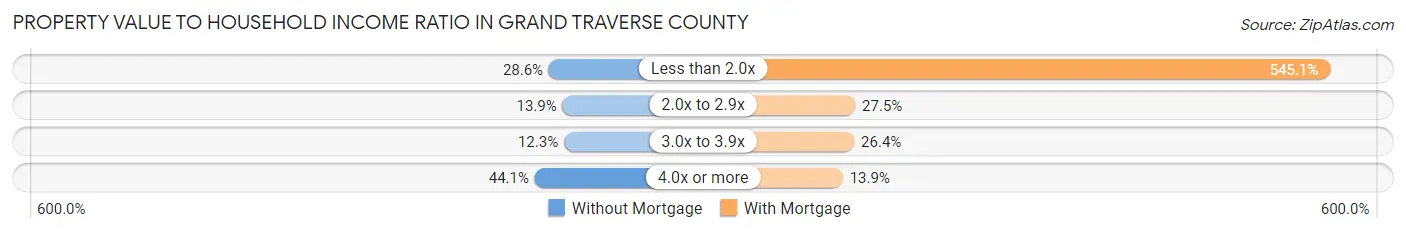
| Value-to-Income Ratio | Without Mortgage | With Mortgage |
| Less than 2.0x | 3,130 (28.6%) | 100,086 (545.1%) |
| 2.0x to 2.9x | 1,514 (13.9%) | 5,049 (27.5%) |
| 3.0x to 3.9x | 1,340 (12.3%) | 4,848 (26.4%) |
| 4.0x or more | 4,815 (44.1%) | 2,552 (13.9%) |
| Total | 10,930 (100.0%) | 18,362 (100.0%) |
Real Estate Taxes by Mortgage Status in Grand Traverse County
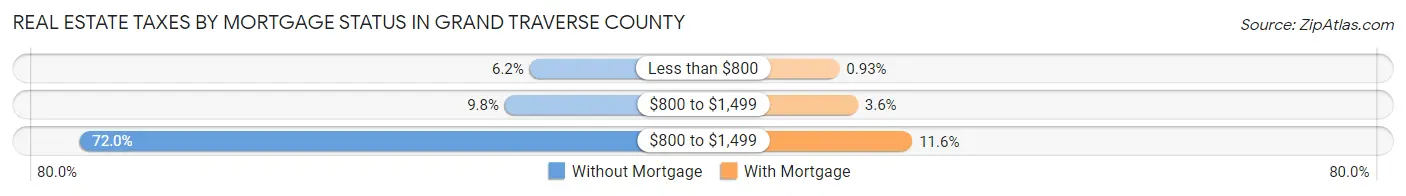
| Property Taxes | Without Mortgage | With Mortgage |
| Less than $800 | 679 (6.2%) | 170 (0.9%) |
| $800 to $1,499 | 1,074 (9.8%) | 665 (3.6%) |
| $800 to $1,499 | 7,869 (72.0%) | 2,124 (11.6%) |
| Total | 10,930 (100.0%) | 18,362 (100.0%) |
Health & Disability in Grand Traverse County
Health Insurance Coverage by Age in Grand Traverse County
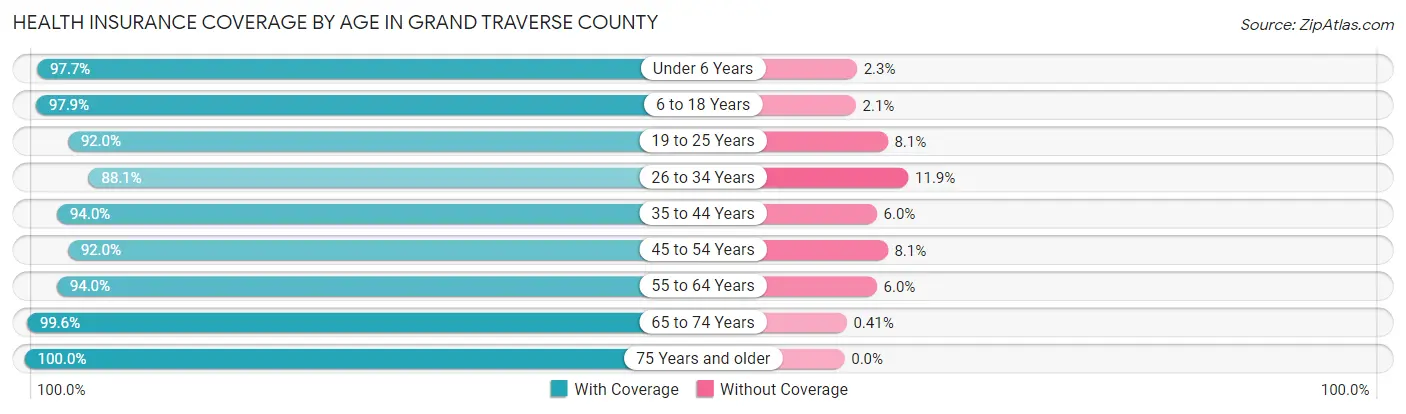
| Age Bracket | With Coverage | Without Coverage |
| Under 6 Years | 5,676 (97.7%) | 134 (2.3%) |
| 6 to 18 Years | 13,718 (97.9%) | 296 (2.1%) |
| 19 to 25 Years | 6,912 (91.9%) | 605 (8.1%) |
| 26 to 34 Years | 9,342 (88.1%) | 1,262 (11.9%) |
| 35 to 44 Years | 10,612 (94.0%) | 681 (6.0%) |
| 45 to 54 Years | 10,682 (91.9%) | 935 (8.1%) |
| 55 to 64 Years | 13,464 (94.0%) | 863 (6.0%) |
| 65 to 74 Years | 11,781 (99.6%) | 48 (0.4%) |
| 75 Years and older | 7,458 (100.0%) | 0 (0.0%) |
| Total | 89,645 (94.9%) | 4,824 (5.1%) |
Health Insurance Coverage by Citizenship Status in Grand Traverse County
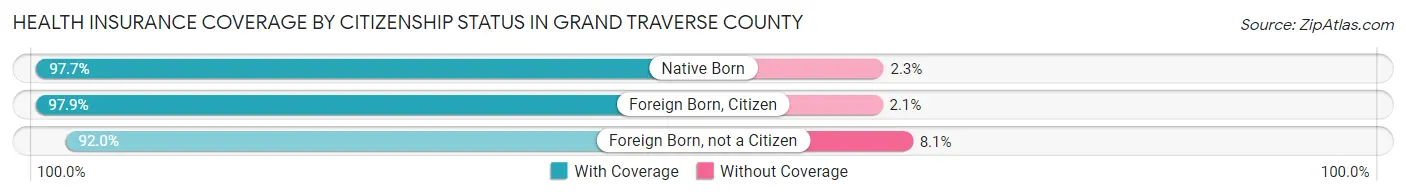
| Citizenship Status | With Coverage | Without Coverage |
| Native Born | 5,676 (97.7%) | 134 (2.3%) |
| Foreign Born, Citizen | 13,718 (97.9%) | 296 (2.1%) |
| Foreign Born, not a Citizen | 6,912 (91.9%) | 605 (8.1%) |
Health Insurance Coverage by Household Income in Grand Traverse County
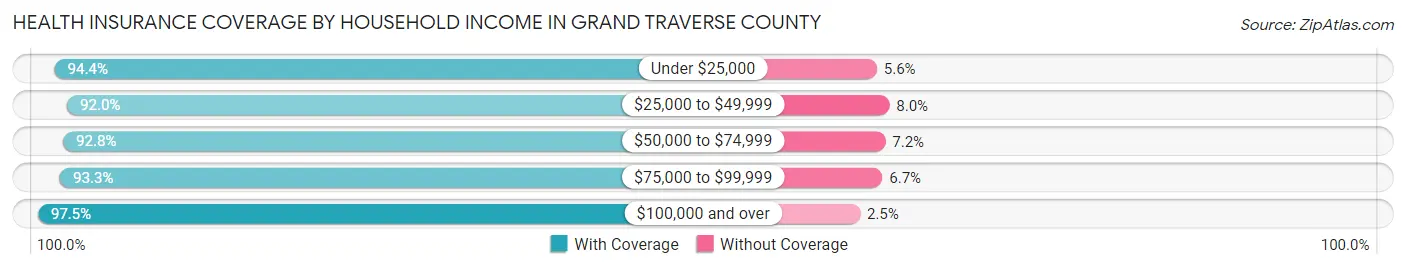
| Household Income | With Coverage | Without Coverage |
| Under $25,000 | 7,498 (94.4%) | 447 (5.6%) |
| $25,000 to $49,999 | 11,858 (92.0%) | 1,028 (8.0%) |
| $50,000 to $74,999 | 15,025 (92.8%) | 1,171 (7.2%) |
| $75,000 to $99,999 | 15,548 (93.3%) | 1,110 (6.7%) |
| $100,000 and over | 38,726 (97.5%) | 984 (2.5%) |
Public vs Private Health Insurance Coverage by Age in Grand Traverse County
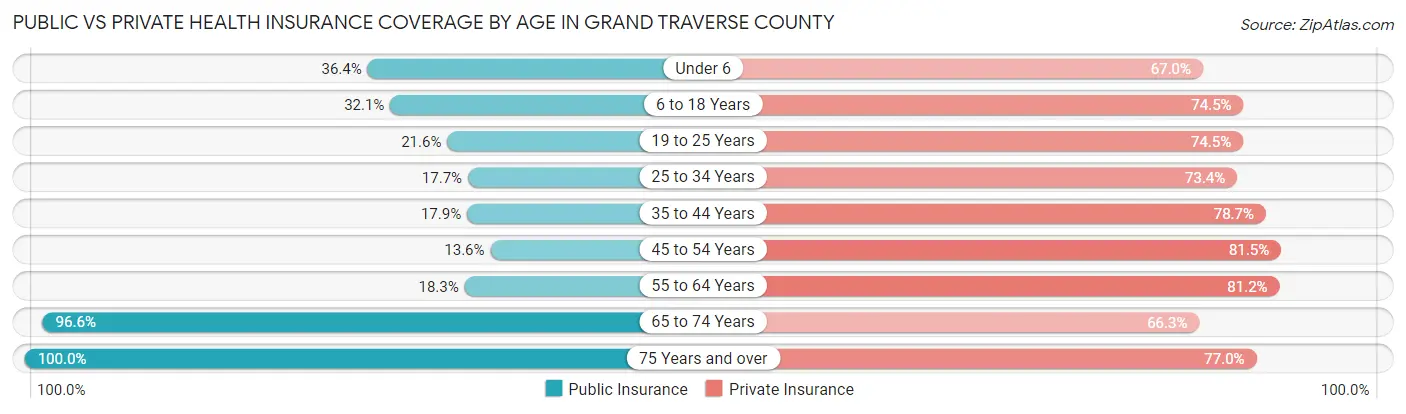
| Age Bracket | Public Insurance | Private Insurance |
| Under 6 | 2,112 (36.3%) | 3,893 (67.0%) |
| 6 to 18 Years | 4,504 (32.1%) | 10,446 (74.5%) |
| 19 to 25 Years | 1,620 (21.5%) | 5,598 (74.5%) |
| 25 to 34 Years | 1,879 (17.7%) | 7,780 (73.4%) |
| 35 to 44 Years | 2,020 (17.9%) | 8,887 (78.7%) |
| 45 to 54 Years | 1,574 (13.6%) | 9,472 (81.5%) |
| 55 to 64 Years | 2,627 (18.3%) | 11,637 (81.2%) |
| 65 to 74 Years | 11,431 (96.6%) | 7,847 (66.3%) |
| 75 Years and over | 7,456 (100.0%) | 5,739 (76.9%) |
| Total | 35,223 (37.3%) | 71,299 (75.5%) |
Disability Status by Sex by Age in Grand Traverse County
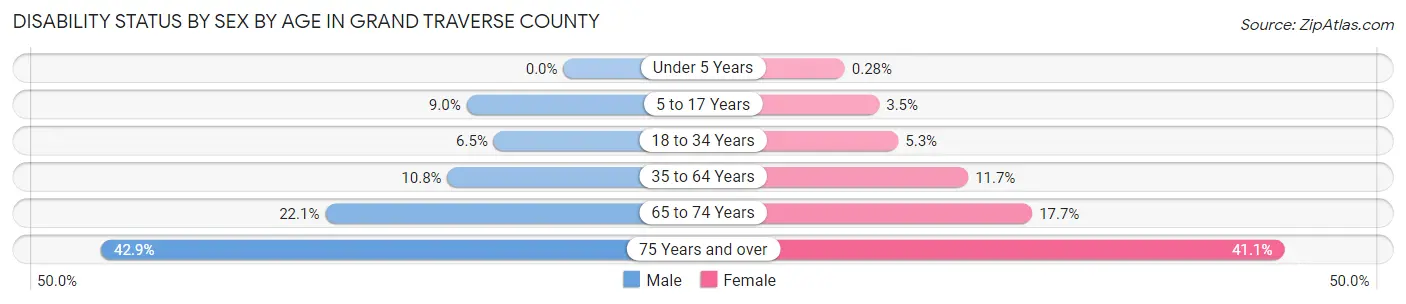
| Age Bracket | Male | Female |
| Under 5 Years | 0 (0.0%) | 6 (0.3%) |
| 5 to 17 Years | 654 (9.0%) | 238 (3.5%) |
| 18 to 34 Years | 630 (6.5%) | 497 (5.2%) |
| 35 to 64 Years | 1,995 (10.8%) | 2,194 (11.7%) |
| 65 to 74 Years | 1,256 (22.1%) | 1,086 (17.7%) |
| 75 Years and over | 1,320 (42.9%) | 1,799 (41.1%) |
Disability Class by Sex by Age in Grand Traverse County
Disability Class: Hearing Difficulty
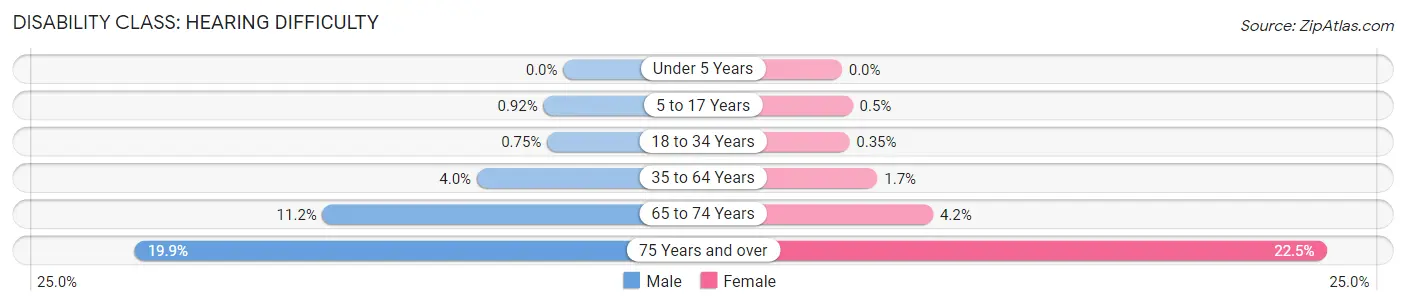
| Age Bracket | Male | Female |
| Under 5 Years | 0 (0.0%) | 0 (0.0%) |
| 5 to 17 Years | 67 (0.9%) | 34 (0.5%) |
| 18 to 34 Years | 73 (0.7%) | 33 (0.4%) |
| 35 to 64 Years | 744 (4.0%) | 309 (1.7%) |
| 65 to 74 Years | 635 (11.2%) | 260 (4.2%) |
| 75 Years and over | 612 (19.9%) | 985 (22.5%) |
Disability Class: Vision Difficulty
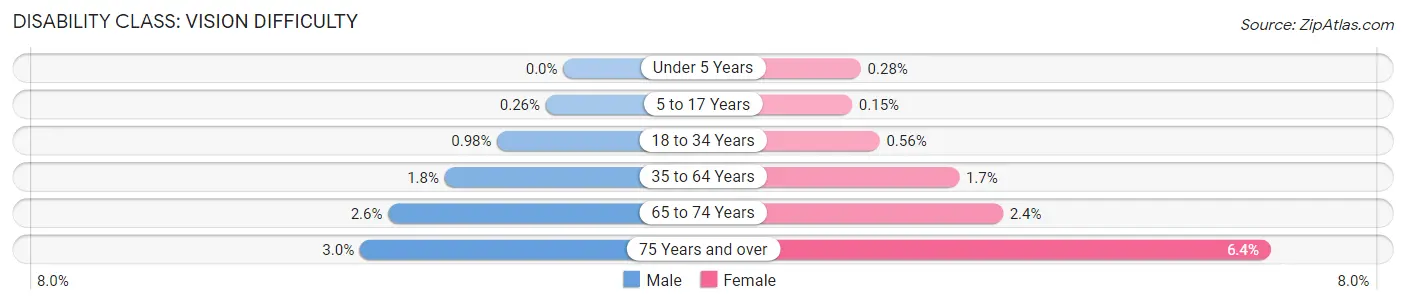
| Age Bracket | Male | Female |
| Under 5 Years | 0 (0.0%) | 6 (0.3%) |
| 5 to 17 Years | 19 (0.3%) | 10 (0.2%) |
| 18 to 34 Years | 96 (1.0%) | 53 (0.6%) |
| 35 to 64 Years | 326 (1.8%) | 325 (1.7%) |
| 65 to 74 Years | 148 (2.6%) | 147 (2.4%) |
| 75 Years and over | 93 (3.0%) | 279 (6.4%) |
Disability Class: Cognitive Difficulty
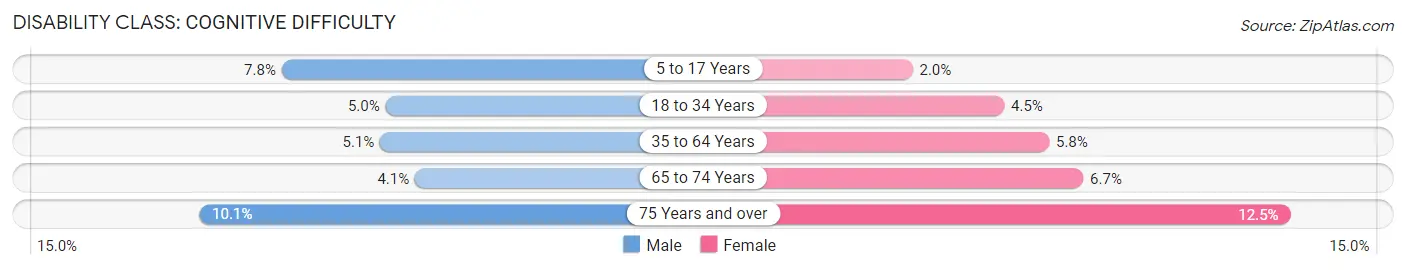
| Age Bracket | Male | Female |
| 5 to 17 Years | 570 (7.8%) | 135 (2.0%) |
| 18 to 34 Years | 483 (5.0%) | 428 (4.5%) |
| 35 to 64 Years | 946 (5.1%) | 1,079 (5.8%) |
| 65 to 74 Years | 235 (4.1%) | 413 (6.7%) |
| 75 Years and over | 312 (10.1%) | 547 (12.5%) |
Disability Class: Ambulatory Difficulty
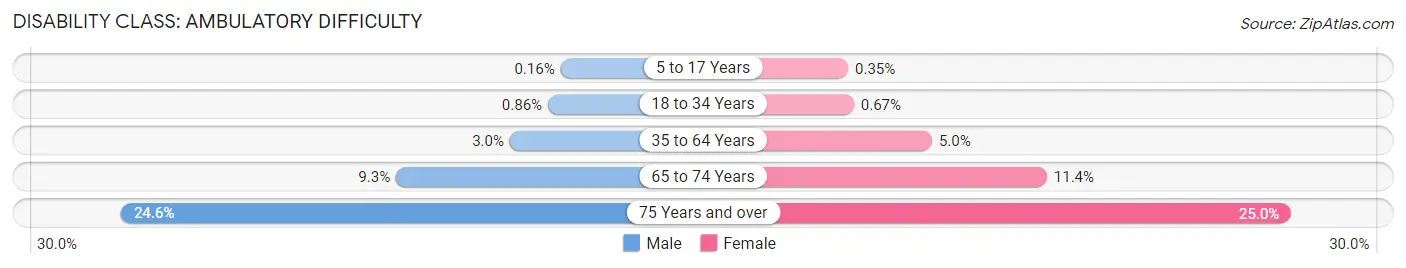
| Age Bracket | Male | Female |
| 5 to 17 Years | 12 (0.2%) | 24 (0.4%) |
| 18 to 34 Years | 84 (0.9%) | 63 (0.7%) |
| 35 to 64 Years | 553 (3.0%) | 938 (5.0%) |
| 65 to 74 Years | 530 (9.3%) | 702 (11.4%) |
| 75 Years and over | 758 (24.6%) | 1,096 (25.0%) |
Disability Class: Self-Care Difficulty
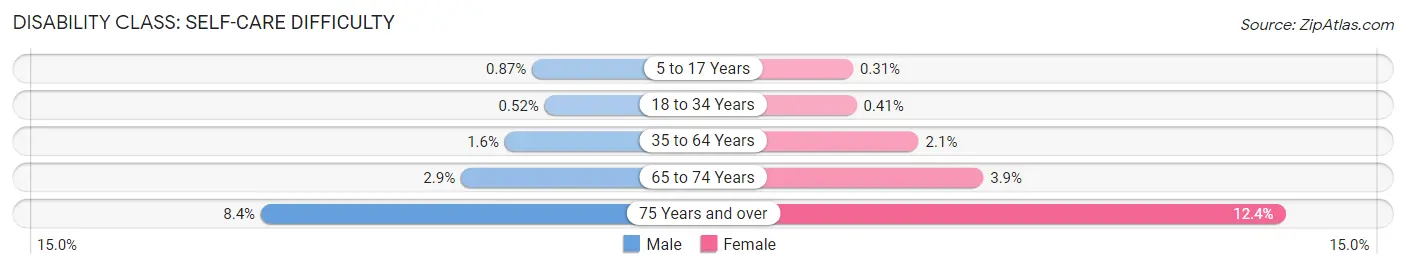
| Age Bracket | Male | Female |
| 5 to 17 Years | 63 (0.9%) | 21 (0.3%) |
| 18 to 34 Years | 51 (0.5%) | 39 (0.4%) |
| 35 to 64 Years | 303 (1.6%) | 400 (2.1%) |
| 65 to 74 Years | 162 (2.9%) | 242 (3.9%) |
| 75 Years and over | 259 (8.4%) | 541 (12.3%) |
Technology Access in Grand Traverse County
Computing Device Access in Grand Traverse County
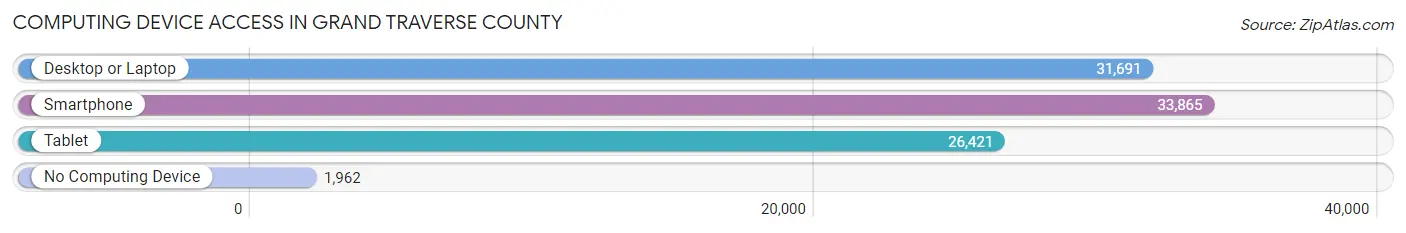
| Device Type | # Households | % Households |
| Desktop or Laptop | 31,691 | 82.2% |
| Smartphone | 33,865 | 87.8% |
| Tablet | 26,421 | 68.5% |
| No Computing Device | 1,962 | 5.1% |
| Total | 38,572 | 100.0% |
Internet Access in Grand Traverse County
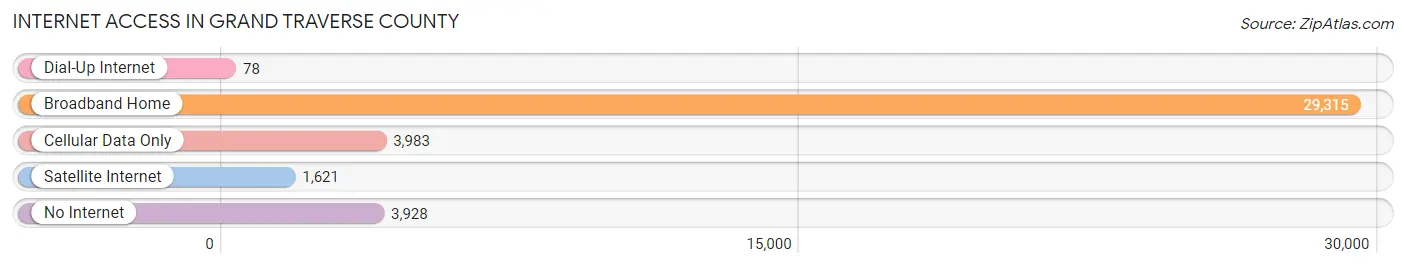
| Internet Type | # Households | % Households |
| Dial-Up Internet | 78 | 0.2% |
| Broadband Home | 29,315 | 76.0% |
| Cellular Data Only | 3,983 | 10.3% |
| Satellite Internet | 1,621 | 4.2% |
| No Internet | 3,928 | 10.2% |
| Total | 38,572 | 100.0% |
Grand Traverse County Summary
Grand Traverse County is located in the northwestern region of Michigan’s Lower Peninsula. It is bordered by Antrim, Kalkaska, and Leelanau counties to the north, Benzie County to the west, Manistee County to the south, and Wexford County to the east. The county seat is Traverse City, which is also the largest city in the county. Grand Traverse County covers an area of 1,068 square miles and has a population of 86,986 as of the 2020 census.
History
Grand Traverse County was established in 1840 and was named after the Grand Traverse Bay, which is located on the western side of the county. The bay was named by French explorers in the late 17th century, who were the first Europeans to explore the area. The county was originally part of Mackinac County, but was split off in 1840. The county was initially populated by Native Americans, primarily the Ottawa and Chippewa tribes.
In the late 19th century, the county began to attract settlers from the eastern United States and Europe. The county’s economy was largely based on lumbering and agriculture. The county’s population grew rapidly in the late 19th and early 20th centuries, and by the 1920s, the county had become a popular tourist destination.
Geography
Grand Traverse County is located in the northwestern region of Michigan’s Lower Peninsula. It is bordered by Antrim, Kalkaska, and Leelanau counties to the north, Benzie County to the west, Manistee County to the south, and Wexford County to the east. The county covers an area of 1,068 square miles and has a population of 86,986 as of the 2020 census.
The county is home to several bodies of water, including Grand Traverse Bay, Lake Michigan, and the Boardman River. The county is also home to several state parks, including Sleeping Bear Dunes National Lakeshore, Interlochen State Park, and Traverse City State Park.
Economy
Grand Traverse County’s economy is largely based on tourism, agriculture, and manufacturing. The county is home to several wineries and breweries, as well as several fruit orchards. The county is also home to several manufacturing companies, including automotive parts manufacturer Magna International and furniture manufacturer Herman Miller.
The county’s largest employer is Munson Medical Center, which employs over 4,000 people. Other major employers in the county include the Grand Traverse Resort and Spa, the Grand Traverse County government, and the Traverse City Area Public Schools.
Demographics
As of the 2020 census, Grand Traverse County had a population of 86,986. The population is predominantly white (90.2%), with smaller percentages of African American (3.2%), Native American (1.2%), Asian (2.2%), and Hispanic or Latino (2.2%) residents. The median household income in the county is $54,945, and the median home value is $219,400. The county’s poverty rate is 11.2%.
Grand Traverse County is home to several colleges and universities, including Northwestern Michigan College, Grand Valley State University, and the University of Michigan. The county is also home to several museums, including the Dennos Museum Center and the Grand Traverse Lighthouse Museum.
Common Questions
What is Per Capita Income in Grand Traverse County?
Per Capita income in Grand Traverse County is $40,644.
What is the Median Family Income in Grand Traverse County?
Median Family Income in Grand Traverse County is $93,542.
What is the Median Household income in Grand Traverse County?
Median Household Income in Grand Traverse County is $75,553.
What is Income or Wage Gap in Grand Traverse County?
Income or Wage Gap in Grand Traverse County is 24.5%.
Women in Grand Traverse County earn 75.5 cents for every dollar earned by a man.
What is Family Income Deficit in Grand Traverse County?
Family Income Deficit in Grand Traverse County is $11,194.
Families that are below poverty line in Grand Traverse County earn $11,194 less on average than the poverty threshold level.
What is Inequality or Gini Index in Grand Traverse County?
Inequality or Gini Index in Grand Traverse County is 0.44.
What is the Total Population of Grand Traverse County?
Total Population of Grand Traverse County is 95,315.
What is the Total Male Population of Grand Traverse County?
Total Male Population of Grand Traverse County is 47,300.
What is the Total Female Population of Grand Traverse County?
Total Female Population of Grand Traverse County is 48,015.
What is the Ratio of Males per 100 Females in Grand Traverse County?
There are 98.51 Males per 100 Females in Grand Traverse County.
What is the Ratio of Females per 100 Males in Grand Traverse County?
There are 101.51 Females per 100 Males in Grand Traverse County.
What is the Median Population Age in Grand Traverse County?
Median Population Age in Grand Traverse County is 42.8 Years.
What is the Average Family Size in Grand Traverse County
Average Family Size in Grand Traverse County is 3.0 People.
What is the Average Household Size in Grand Traverse County
Average Household Size in Grand Traverse County is 2.4 People.
How Large is the Labor Force in Grand Traverse County?
There are 50,483 People in the Labor Forcein in Grand Traverse County.
What is the Percentage of People in the Labor Force in Grand Traverse County?
64.3% of People are in the Labor Force in Grand Traverse County.
What is the Unemployment Rate in Grand Traverse County?
Unemployment Rate in Grand Traverse County is 3.9%.