Cities with the Highest Percentage of Population Employed in Mining, Quarrying, & Extraction in Georgia
RELATED REPORTS & OPTIONS
Mining, Quarrying, & Extraction
Georgia
Compare Cities
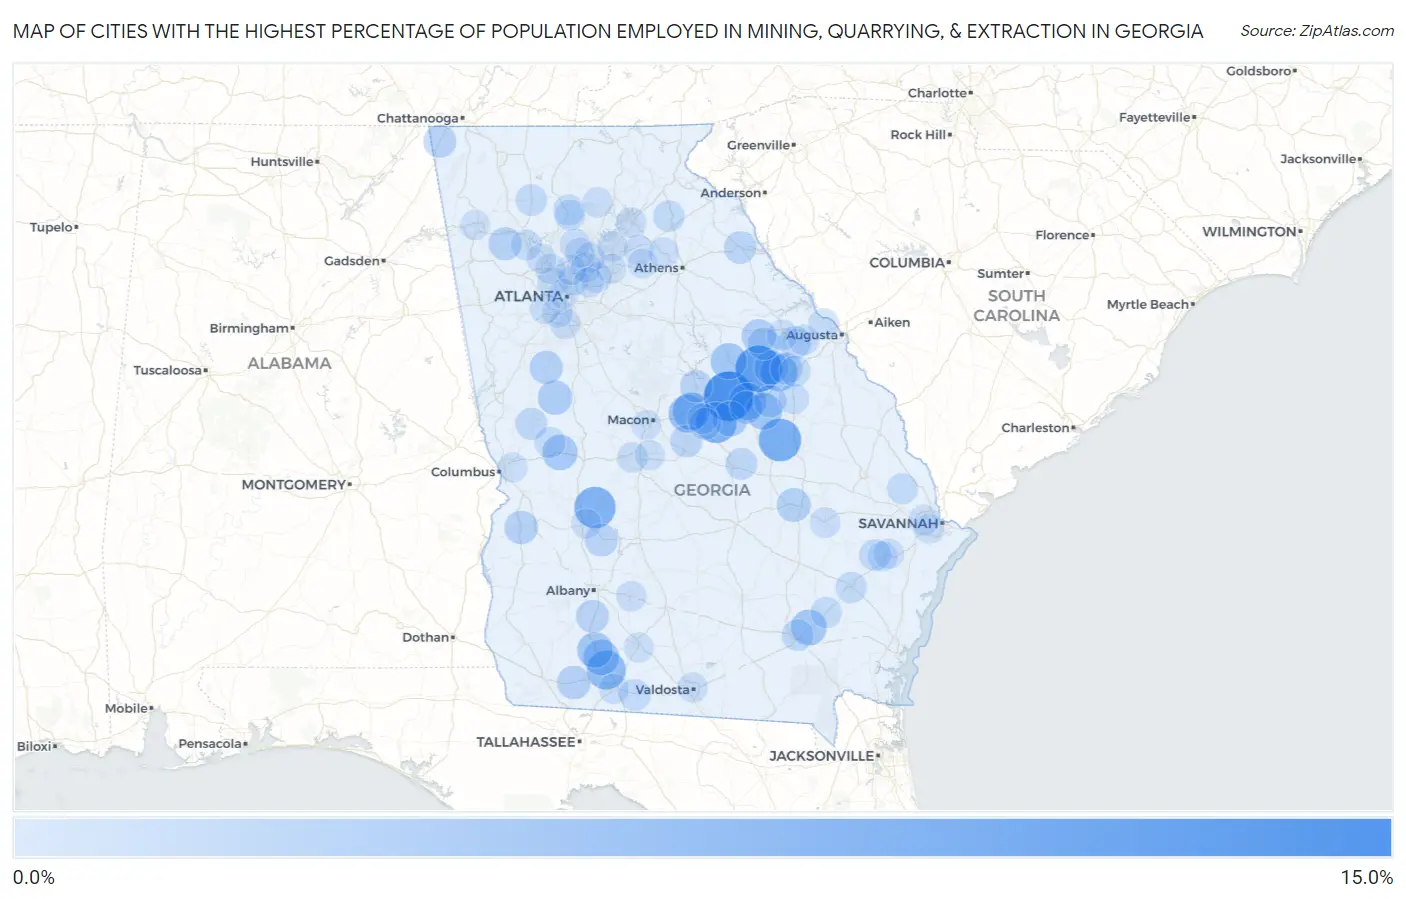
Map of Cities with the Highest Percentage of Population Employed in Mining, Quarrying, & Extraction in Georgia
0.0%
15.0%
Cities with the Highest Percentage of Population Employed in Mining, Quarrying, & Extraction in Georgia
| City | % Employed | vs State | vs National | |
| 1. | Deepstep | 13.6% | 0.11%(+13.5)#1 | 0.44%(+13.1)#485 |
| 2. | Mitchell | 11.3% | 0.11%(+11.2)#2 | 0.44%(+10.8)#655 |
| 3. | Kite | 8.6% | 0.11%(+8.46)#3 | 0.44%(+8.13)#928 |
| 4. | Andersonville | 7.8% | 0.11%(+7.66)#4 | 0.44%(+7.34)#1,035 |
| 5. | Toomsboro | 7.5% | 0.11%(+7.40)#5 | 0.44%(+7.07)#1,076 |
| 6. | Ochlocknee | 6.1% | 0.11%(+6.01)#6 | 0.44%(+5.68)#1,335 |
| 7. | Cataula | 5.2% | 0.11%(+5.13)#7 | 0.44%(+4.81)#1,532 |
| 8. | Gordon | 5.2% | 0.11%(+5.13)#8 | 0.44%(+4.81)#1,533 |
| 9. | Avera | 5.1% | 0.11%(+4.97)#9 | 0.44%(+4.64)#1,583 |
| 10. | Ivey | 5.0% | 0.11%(+4.86)#10 | 0.44%(+4.53)#1,610 |
| 11. | Sandersville | 4.6% | 0.11%(+4.52)#11 | 0.44%(+4.20)#1,717 |
| 12. | Riddleville | 4.5% | 0.11%(+4.43)#12 | 0.44%(+4.11)#1,747 |
| 13. | Sparta | 4.2% | 0.11%(+4.05)#13 | 0.44%(+3.72)#1,881 |
| 14. | Blackshear | 3.9% | 0.11%(+3.77)#14 | 0.44%(+3.44)#1,996 |
| 15. | Meigs | 3.8% | 0.11%(+3.70)#15 | 0.44%(+3.38)#2,031 |
| 16. | Pelham | 3.8% | 0.11%(+3.64)#16 | 0.44%(+3.31)#2,053 |
| 17. | Junction City | 3.6% | 0.11%(+3.46)#17 | 0.44%(+3.13)#2,135 |
| 18. | Oconee | 3.5% | 0.11%(+3.40)#18 | 0.44%(+3.07)#2,185 |
| 19. | Molena | 2.9% | 0.11%(+2.76)#19 | 0.44%(+2.43)#2,567 |
| 20. | Gibson | 2.8% | 0.11%(+2.70)#20 | 0.44%(+2.37)#2,605 |
| 21. | Norwood | 2.7% | 0.11%(+2.55)#21 | 0.44%(+2.23)#2,714 |
| 22. | Vidalia | 2.6% | 0.11%(+2.45)#22 | 0.44%(+2.13)#2,810 |
| 23. | Whigham | 2.2% | 0.11%(+2.13)#23 | 0.44%(+1.81)#3,048 |
| 24. | Lumpkin | 2.2% | 0.11%(+2.11)#24 | 0.44%(+1.78)#3,065 |
| 25. | Haralson | 2.2% | 0.11%(+2.11)#25 | 0.44%(+1.78)#3,075 |
| 26. | Euharlee | 2.1% | 0.11%(+2.00)#26 | 0.44%(+1.68)#3,163 |
| 27. | Leslie | 1.9% | 0.11%(+1.78)#27 | 0.44%(+1.46)#3,367 |
| 28. | Baconton | 1.9% | 0.11%(+1.78)#28 | 0.44%(+1.45)#3,372 |
| 29. | Tennille | 1.8% | 0.11%(+1.72)#29 | 0.44%(+1.40)#3,422 |
| 30. | Trenton | 1.8% | 0.11%(+1.66)#30 | 0.44%(+1.33)#3,491 |
| 31. | Warrenton | 1.6% | 0.11%(+1.53)#31 | 0.44%(+1.20)#3,636 |
| 32. | Dearing | 1.6% | 0.11%(+1.53)#32 | 0.44%(+1.20)#3,646 |
| 33. | Elberton | 1.6% | 0.11%(+1.51)#33 | 0.44%(+1.18)#3,672 |
| 34. | Milledgeville | 1.6% | 0.11%(+1.46)#34 | 0.44%(+1.14)#3,720 |
| 35. | Jeffersonville | 1.5% | 0.11%(+1.36)#35 | 0.44%(+1.04)#3,855 |
| 36. | Davisboro | 1.4% | 0.11%(+1.32)#36 | 0.44%(+0.988)#3,908 |
| 37. | Stapleton | 1.3% | 0.11%(+1.22)#37 | 0.44%(+0.893)#4,037 |
| 38. | Shiloh | 1.2% | 0.11%(+1.11)#38 | 0.44%(+0.784)#4,205 |
| 39. | East Dublin | 1.2% | 0.11%(+1.09)#39 | 0.44%(+0.764)#4,242 |
| 40. | Irwinton | 1.1% | 0.11%(+1.00)#40 | 0.44%(+0.675)#4,384 |
| 41. | Deenwood | 1.1% | 0.11%(+0.986)#41 | 0.44%(+0.659)#4,405 |
| 42. | Gumbranch | 1.0% | 0.11%(+0.918)#42 | 0.44%(+0.591)#4,506 |
| 43. | Boston | 1.0% | 0.11%(+0.899)#43 | 0.44%(+0.572)#4,542 |
| 44. | Fairmount | 1.0% | 0.11%(+0.893)#44 | 0.44%(+0.566)#4,561 |
| 45. | Homer | 0.99% | 0.11%(+0.878)#45 | 0.44%(+0.551)#4,582 |
| 46. | Jesup | 0.81% | 0.11%(+0.693)#46 | 0.44%(+0.366)#4,933 |
| 47. | Talbotton | 0.74% | 0.11%(+0.622)#47 | 0.44%(+0.295)#5,088 |
| 48. | Offerman | 0.71% | 0.11%(+0.601)#48 | 0.44%(+0.274)#5,154 |
| 49. | Guyton | 0.62% | 0.11%(+0.506)#49 | 0.44%(+0.179)#5,423 |
| 50. | Nelson | 0.62% | 0.11%(+0.506)#50 | 0.44%(+0.178)#5,426 |
| 51. | Wrens | 0.58% | 0.11%(+0.471)#51 | 0.44%(+0.144)#5,526 |
| 52. | Fort Valley | 0.52% | 0.11%(+0.407)#52 | 0.44%(+0.080)#5,715 |
| 53. | Louisville | 0.51% | 0.11%(+0.396)#53 | 0.44%(+0.069)#5,747 |
| 54. | Evans | 0.50% | 0.11%(+0.385)#54 | 0.44%(+0.058)#5,787 |
| 55. | Harlem | 0.48% | 0.11%(+0.368)#55 | 0.44%(+0.041)#5,835 |
| 56. | Lilburn | 0.48% | 0.11%(+0.364)#56 | 0.44%(+0.036)#5,852 |
| 57. | Thomson | 0.46% | 0.11%(+0.352)#57 | 0.44%(+0.024)#5,885 |
| 58. | Ball Ground | 0.41% | 0.11%(+0.301)#58 | 0.44%(-0.026)#6,067 |
| 59. | Emerson | 0.40% | 0.11%(+0.283)#59 | 0.44%(-0.044)#6,135 |
| 60. | Echols County Consolidated Government | 0.37% | 0.11%(+0.255)#60 | 0.44%(-0.072)#6,247 |
| 61. | Buford | 0.32% | 0.11%(+0.209)#61 | 0.44%(-0.118)#6,414 |
| 62. | Mcintyre | 0.32% | 0.11%(+0.206)#62 | 0.44%(-0.121)#6,423 |
| 63. | Sylvester | 0.30% | 0.11%(+0.182)#63 | 0.44%(-0.145)#6,505 |
| 64. | Pooler | 0.29% | 0.11%(+0.181)#64 | 0.44%(-0.146)#6,511 |
| 65. | Reidsville | 0.28% | 0.11%(+0.168)#65 | 0.44%(-0.159)#6,549 |
| 66. | Riverdale | 0.27% | 0.11%(+0.161)#66 | 0.44%(-0.166)#6,581 |
| 67. | Hoschton | 0.24% | 0.11%(+0.132)#67 | 0.44%(-0.195)#6,686 |
| 68. | College Park | 0.23% | 0.11%(+0.121)#68 | 0.44%(-0.206)#6,713 |
| 69. | Arcade | 0.23% | 0.11%(+0.121)#69 | 0.44%(-0.206)#6,715 |
| 70. | Valdosta | 0.23% | 0.11%(+0.118)#70 | 0.44%(-0.209)#6,729 |
| 71. | Flemington | 0.22% | 0.11%(+0.108)#71 | 0.44%(-0.219)#6,761 |
| 72. | Gainesville | 0.22% | 0.11%(+0.107)#72 | 0.44%(-0.220)#6,772 |
| 73. | Dawsonville | 0.22% | 0.11%(+0.105)#73 | 0.44%(-0.222)#6,781 |
| 74. | Thomasville | 0.20% | 0.11%(+0.083)#74 | 0.44%(-0.245)#6,878 |
| 75. | Milton | 0.19% | 0.11%(+0.078)#75 | 0.44%(-0.249)#6,902 |
| 76. | Brookhaven | 0.17% | 0.11%(+0.055)#76 | 0.44%(-0.272)#6,990 |
| 77. | Smyrna | 0.14% | 0.11%(+0.031)#77 | 0.44%(-0.296)#7,103 |
| 78. | Johns Creek | 0.12% | 0.11%(+0.012)#78 | 0.44%(-0.315)#7,204 |
| 79. | South Fulton | 0.12% | 0.11%(+0.006)#79 | 0.44%(-0.322)#7,244 |
| 80. | Americus | 0.12% | 0.11%(+0.002)#80 | 0.44%(-0.325)#7,256 |
| 81. | Winder | 0.10% | 0.11%(-0.009)#81 | 0.44%(-0.336)#7,320 |
| 82. | Augusta-Richmond County Consolidated Government (Balance) | 0.10% | 0.11%(-0.012)#82 | 0.44%(-0.339)#7,330 |
| 83. | Rome | 0.095% | 0.11%(-0.018)#83 | 0.44%(-0.345)#7,361 |
| 84. | Peachtree Corners | 0.084% | 0.11%(-0.029)#84 | 0.44%(-0.356)#7,426 |
| 85. | Hinesville | 0.083% | 0.11%(-0.030)#85 | 0.44%(-0.357)#7,436 |
| 86. | Marietta | 0.074% | 0.11%(-0.039)#86 | 0.44%(-0.366)#7,502 |
| 87. | Macon Bibb County | 0.071% | 0.11%(-0.042)#87 | 0.44%(-0.369)#7,522 |
| 88. | Atlanta | 0.068% | 0.11%(-0.045)#88 | 0.44%(-0.372)#7,542 |
| 89. | Lawrenceville | 0.062% | 0.11%(-0.051)#89 | 0.44%(-0.378)#7,583 |
| 90. | Athens-Clarke County Unified Government (Balance) | 0.058% | 0.11%(-0.055)#90 | 0.44%(-0.383)#7,614 |
| 91. | Sandy Springs | 0.054% | 0.11%(-0.059)#91 | 0.44%(-0.386)#7,633 |
| 92. | Warner Robins | 0.054% | 0.11%(-0.059)#92 | 0.44%(-0.386)#7,634 |
| 93. | Kennesaw | 0.050% | 0.11%(-0.063)#93 | 0.44%(-0.390)#7,656 |
| 94. | Alpharetta | 0.044% | 0.11%(-0.070)#94 | 0.44%(-0.397)#7,704 |
| 95. | Tucker | 0.038% | 0.11%(-0.075)#95 | 0.44%(-0.402)#7,745 |
| 96. | Moultrie | 0.033% | 0.11%(-0.080)#96 | 0.44%(-0.408)#7,781 |
| 97. | Columbus | 0.028% | 0.11%(-0.085)#97 | 0.44%(-0.413)#7,821 |
| 98. | Savannah | 0.011% | 0.11%(-0.102)#98 | 0.44%(-0.429)#7,919 |
Common Questions
What are the Top 10 Cities with the Highest Percentage of Population Employed in Mining, Quarrying, & Extraction in Georgia?
Top 10 Cities with the Highest Percentage of Population Employed in Mining, Quarrying, & Extraction in Georgia are:
#1
13.6%
#2
11.3%
#3
8.6%
#4
7.8%
#5
7.5%
#6
6.1%
#7
5.2%
#8
5.1%
#9
5.0%
#10
4.6%
What city has the Highest Percentage of Population Employed in Mining, Quarrying, & Extraction in Georgia?
Deepstep has the Highest Percentage of Population Employed in Mining, Quarrying, & Extraction in Georgia with 13.6%.
What is the Percentage of Population Employed in Mining, Quarrying, & Extraction in the State of Georgia?
Percentage of Population Employed in Mining, Quarrying, & Extraction in Georgia is 0.11%.
What is the Percentage of Population Employed in Mining, Quarrying, & Extraction in the United States?
Percentage of Population Employed in Mining, Quarrying, & Extraction in the United States is 0.44%.